

Synopsis
Angiogenesis is a highly-controlled process that is dependent on the intricate balance of both promoting and inhibiting factors, involved in various physiological and pathological processes. A comprehensive understanding of the molecular mechanisms that regulate angiogenesis has resulted in the design of new and more effective therapeutic strategies. Due to insufficient sensitivity to detect therapeutic effects by using standard clinical endpoints or by looking for physiological improvement, a multitude of imaging techniques have been developed to assess tissue vasculature on the structural, functional and molecular level. Imaging is expected to provide a novel approach to noninvasively monitor angiogenesis, to optimize the dose of new antiangiogenic agents and to assess the efficacy of therapies directed at modulation of the angiogenic process. All these methods have been successfully used preclinically and will hopefully aid in antiangiogenic drug development in animal studies. In this review article, the application of PET in angiogenesis imaging at both functional and molecular level will be discussed. For PET imaging of angiogenesis related molecular markers, we emphasize integrin αvβ3, VEGF/VEGFR, and MMPs.
Keywords: angiogenesis, molecular imaging, integrin, VEGFR, MMP
Introduction
Angiogenesis refers to the process by which new blood vessels are formed and is involved in various physiological as well as pathological processes including physical development, wound repair, reproduction, response to ischemia, arthritis, psoriasis, retinopathies, solid tumor growth and metastatic tumor spread1. Angiogenesis is a highly-controlled process that is dependent on the intricate balance of both promoting and inhibiting factors.
Antiangiogenic and antivascular agents are intensively investigated for tumor therapy and can be potentially used to control eye diseases and arthritis. Pro-angiogenic therapy are also undergoing clinical trials in human patients suffering from ischemic heart disease, peripheral vascular disease, chronic wounds or stroke2. A comprehensive understanding of the molecular mechanisms that regulate angiogenesis has resulted in the design of new and more effective therapeutic strategies3. Although preclinical animal studies have demonstrated the benefit of pro-angiogenic therapy, recent clinical trials focused on the stimulation of myocardial or peripheral angiogenesis by the local delivery of growth factors were somewhat disappointing, showing no clear benefit over placebo in patients with severe ischemia4. Most of these studies evaluated angiogenesis by using standard clinical endpoints or by looking for a physiological improvement (i.e. improvement in perfusion). These approaches may have insufficient sensitivity to detect a therapeutic benefit.
For tumor therapy, Bevacizumab, a humanized monoclonal antibody directed against vascular endothelial growth factor (VEGF), is the first drug developed as an inhibitor of angiogenesis approved by the Food and Drug Administration (FDA)5–7. Sorafenib and sunitinib that target multiple receptor tyrosine kinases (VEGF receptors and platelet-derived growth factor (PDGF) receptors), have also been approved by the FDA as antiangiogenic drugs8. Traditionally, the gold standard to evaluate therapeutic response is tumor volume change. Clinical trials with conventional cytotoxic chemotherapeutic agents have mainly used morphological imaging to provide indices of therapeutic response, mostly computed tomography (CT) or magnetic resonance imaging (MRI) according to the Response Evaluation Criteria in Solid Tumors (RECIST) introduced in the year 20009. However, antiangiogenic agents are typically cytostatic rather than cytotoxic and lead to a stop or delay of tumor progression rather than tumor shrinkage. Thus, it is not sensitive to use tumor volume as an indicator for therapeutic efficacy evaluation and it might take months or years to assess.
Both the success and setback in angiogenesis related therapies spur the need for the development of noninvasive imaging strategies for the direct noninvasive evaluation of molecular events associated with angiogenesis. Imaging is expected to provide a novel approach to noninvasively monitor angiogenesis, to optimize the dose of new antiangiogenic agents and to assess the efficacy of therapies directed at modulation of the angiogenic process10,11–13. In this review article, after brief introduction of angiogenesis biology and structure and functional imaging of angiogenesis with various imaging modalities, we will focus on the application of PET in angiogenesis imaging at both functional and molecular level.
Biology of Angiogenesis
The whole angiogenesis process involves several steps including the growth of endothelial sprouts from preexisting postcapillary venules and following the growth and remodeling process of the primitive network into a complex network14. The cellular and molecular mechanisms of angiogenesis differ in various tissues and physiologic or pathologic angiogenesis15. Here we will give a brief introduction of tumor angiogenesis.
Each solid malignancy starts as a small population of transformed cells, which do not initially have a blood supply of their own. Tumor cells are initially supplied by diffusion and tumor growth is limited by the lack of access to growth factors, circulating oxygen, and nutrients16. Without angiogenesis, the growth of solid tumors remains restricted to 2–3 mm in diameter17. Tumor angiogenesis occurs as a series of events18, 19. First, diseased tissues produce and release angiogenic growth factors that diffuse into the nearby tissues in response to tumor hypoxia, such as the vascular endothelial growth factor (VEGF), the acidic and basic fibroblast growth factors (aFGF, bFGF), and the platelet-derived endothelial cell growth factor (PD-ECGF)20. When the angiogenic growth factors bind to their corresponding specific receptors located on the endothelial cells of pre-existing blood vessels, various signal transduction pathways are activated, for example phosphorylation of tyrosine kinases, protein kinases, and MAP kinases and consequently to the activation of endothelial cells21, 22. Consequently, the original vessels undergo characteristic morphological changes, including enlargement of the diameter, basement membrane degradation, a thinned endothelial cell lining, increased endothelial number, decreased pericyte number and pericyte detachment23. In the next step, several different mechanisms may lead to the formation of new tumor blood vessels24, 25. The original vessels may retain their large diameter and evolve into medium-sized arteries and veins by acquiring a smooth muscle and internal elastica. Alternatively, the endothelium of a mother vessel may form smaller separate well-differentiated vessel channels by projecting cytoplasmic structures into the lumen which form translumenal bridges. A third process is called intussusception and involves focal invagination of connective tissue pillars from within the mother vessel. Finally, endothelial cell sprouting may occur, which requires the focal dissolution of the basement membrane surrounding mother vessels26. This is achieved by a number of proteolytic enzymes, including matrix metalloproteinases (MMPs) and plasminogen activator, which enable endothelial cells to exit the vessel. Activated angiogenic endothelial cells proliferate rapidly and migrate into the extracellular matrix towards the angiogenic stimulus27. Cell surface adhesion molecules such as integrins play an important role in endothelial cell migration and in contact with the extracellular tumor matrix, facilitate cell survival28, 29. At the sprouting tips of growing vessels, endothelial cells secrete MMPs that facilitate degradation of the extracellular matrix and cell invasion30. Next, a lumen within an endothelial cell tubule has to be formed, which requires interactions between the extracellular matrix and cell-associated surface proteins, among them are galectin-2, PECAM-1, and VE-cadherin31. Finally, newly formed vessels are stabilized through the recruitment of smooth muscle cells and pericytes.
Structural Imaging of Vasculature/Angiogenesis
All imaging modalities can provide structural information although they have different spatial resolution. The old-fashion way for vascular structure imaging is x-ray angiography. However, it is difficult to provide microvasculature information. Following the steps of improvement of imaging equipments, contrast agents and data acquisition and analysis techniques, more detailed vascular structure was deciphered. Several modalities are available for tumor microvascular imaging, including intravital microscope, CT angiography, contrast enhanced ultrasound and high-resolution magnetic resonance angiography (MRA)32. Ex vivo structural imaging of tumor vasculature can be achieved by various techniques such as vascular casts33, 34, immunohistochemical staining of endothelial cell markers such as CD31 and von Willebrand factor35, 36, labeling the endothelial cells by fluorescent reporters expressed in transgenic mice37, 38, and intravital labeling39, 40. Tumor macrovasculature imaging can be performed clinically by various imaging modalities such as computed tomography (CT)41, 42, magnetic resonance imaging (MRI)43, 44, and ultrasound45. However, visualization of the microvasculature is very challenging even after administration of intravascular contrast agents. Scanners dedicated to small animal imaging studies, such as microCT, have better spatial resolution in pre-clinical models but with poor temporal resolution and large radiation exposure 46.
Intravital microscopy of tumors growing in window chambers in animal models can directly investigate tumor angiogenesis and vascular response to treatment, in terms of both the morphology of the vascular networks and the function of individual vessels 47. This technique allows for repeated measurements of the same tumor with very high resolution (down to sub-micrometer level). Multi-photon fluorescence microscopy techniques have also been applied to these model systems to obtain 3D images of the tumor vasculature47.
Functional Imaging of Vasculature
The major consequence of angiogenesis is to perfuse and oxygenate surrounding tissue; therefore, the angiogenic process can be assessed by the evaluation of standard physiologic parameters such as regional perfusion, function, and metabolism. During antiangiogenic or pro-angiogenic therapies, the changes in hemodynamic parameters can also be promising biomarkers for evaluating the therapeutic effect along with morphological changes. Traditionally, tumor angiogenesis and anti-angiogenic therapy have been evaluated by methods such as measurement of circulating angiogenic markers and histological estimate of microvascular density (MVD). Various imaging modalities including dynamic contrast enhanced MRI (DCE-MRI), ultrasound, PET (especially with [15O]water), dynamic contrast enhanced CT are currently employed to provide functional information of the vasculature48.
DCE-MRI has been well established to investigate angiogenesis within tumors, and in particular the response to antiangiogenic therapy. DCE-MRI works by tracking the pharmacokinetics of injected contrast agents as they pass through the tumor vasculature, which represents a complex summation of vascular permeability, blood flow, vascular surface area, and interstitial pressure49, 50.
DCE-MRI can be performed with low-molecular-weight contrast media (LMCM) such as Gd-diethylenetriamine pentaacetic acid (Gd-DTPA) or macromolecular contrast media (MMCM) such as Gd conjugated human serum albumin (Gd-HSA)51. It has been shown that DCE-MRI can detect responses to PTK/ZK (a VEGF receptor tyrosine kinase inhibitor) therapy as early as two days after therapy with significant reductions in area under gadolinium-contrast-medium curve (AUGC)52 or permeability parameters53, which also predict subsequent response. LMCM DCE-MRI has also shown significant reductions in permeability values in patients treated with the antivascular agents AG-013736 (an inhibitor of the VEGF, PDGF, and c-Kit receptor tyrosine kinases) and SU5416 (a selective inhibitor of VEGFR-2 tyrosine kinase) activity54. Although consensus is still lacking on the exact kinetic model to be used in analyzing DCE-MRI data, the differences among the various methods are often marginal. Therefore, DCE-MRI is rapidly emerging as the imaging technique of choice for monitoring clinical response in trials of new antiangiogenic and antivascular therapies. Unlike LMCM, the increased size of MMCMs makes them less diffusible, and Ktrans values may reflect permeability within tumors more accurately55. MMCMs can also give more accurate estimates of tumor blood volume since they are excellent blood pool agents. For example, SU6668 is an oral, small molecule inhibitor of angiogenic receptor tyrosine kinases such as vascular endothelial growth factor receptor 2 (Flk-1/KDR), platelet-derived growth factor (PDGF) receptor, and fibroblast growth factor (FGF) receptor. DCE-MRI clearly detected the early effect (after 24 h of treatment) of SU6668 on tumor vasculature as a 51% and 26% decrease in the average vessel permeability measured in the tumor rim and core, respectively. A substantial decrease was also observed in average fractional plasma volume in the rim (59%) and core (35%) of the tumor56, 57. In addition to DCE-MRI, other MRI techniques have also been developed to retrieve functional information of the vasculature. In arterial spin labeling (ASL), water molecules can be labeled for MRI by inverting the nuclear spin of their hydrogen atoms with a radiofrequency pulse directed at the arterial blood before it enters the regions of interest (ROIs)58, 59. An absolute value of blood flow is determined by the change in the MR signal as the labeled water in the arterial bloodstream arrives in the ROI60. Blood oxygen level dependent (BOLD) MRI can detect the changes in oxygen saturation of the blood and this effect can be enhanced by increasing the amount of oxygen in the breathed air61, 62.
Ultrasound is also well established as a means of measuring blood flow or, more precisely, blood velocity using the Doppler principle or microbubles as contrast agent63–66. Power Doppler can be quantified to give an estimate of the relative fractional vascular volume while microbubbles can show blood flow down to the microcirculation level by raising the signal from smaller vessels67, 68. Specialized contrast-specific US techniques have been developed for improving image qualities such as Pulse Inversion69, 70 and Power Modulation71. Given the fundamental assumption that the relation between microbubble concentration video-intensity is linear up to the achievement of a plateau phase72, in animal models CEUS can quantify tumor vascularity determined by neoangiogenesis73, 74. The use of ultrasound contrast agents and nonlinear processing provide access to the bulk properties of the microvascular compartment but they do not offer sufficient resolution to observe the morphology and detailed flow characteristics of the microvasculature. With high frequency ultrasound, it is possible to achieve resolution ranging from 15 to 100 μm in the 20–100MHz range45. However, it is subject to an inherent trade-off between image resolution and imaging depth75. Ultrasound (particularly microbubble contrast enhanced ultrasound) is a valuable imaging modality to determine the tumor microvascular blood volume and blood velocity76. Dynamic contrast-enhanced ultrasonography (DCE-US) allows repeated examinations and provides both morphologic and functional analyses. US modes, based on the second harmonic signal generated by the nonlinear properties of contrast agents, have provided access to tumor blood flow with the quantification of the contrast-uptake kinetics within tumors after a bolus injection of contrast agent77. Several quantitative parameters considered as indicators of tumor flow such as the peak intensity (PI) or time-to-PI can be extracted from the time-intensity curves of contrast uptake78. Using DCE-US, the antitumor efficacy of AVE8062, a tumor vasculature disruptive agent, has been assessed in melanoma-bearing nude mice79.
Many other imaging modalities can also reveal the functional properties of the vasculature. DCE-CT is analogous to DCE-MRI80, 81. To minimize the exposure to ionizing radiation and the nephrotoxicity of CT contrast agents, DCE-CT studies are typically quite brief using only a low dose of contrast agent. Optical imaging can also be applied to evaluate important functional indexes of blood vessels such as vascular permeability, vessel size, and blood flow82. Multiphoton microscopy in combination with fluorescently labeled molecules can be used to quantify the permeability of individual tumor blood vessels non-invasively deep inside living animals83. Fluorescence-mediated tomography (FMT) has been applied to measure angiogenesis in superficial tissue by using fluorescent nanoparticles84. However, optical imaging is still limited to tissue and animal models.
PET Imaging
So far, PET is the most sensitive and specific technique for imaging molecular pathways in vivo in humans85. PET radiotracers are physiologically and pharmacologically relevant compounds labeled with positron-emitting radioisotopes (such as fluoride-18 or carbon-11). After internalization by injection or inhalation, the tracer reaches the target and the location and the quantity is then detected with a PET scanner. With a ring-shaped array of photoelectric crystals, PET detectors capture “coincidentally” a pair of 511 keV photons at almost 180° separation emitted by interaction of a positron with negatively charged electrons. The raw PET scan data are the set of coincidental photoelectric events, logged for time and location, which indicate the position of the molecule spatiotemporally. Using reconstruction algorithms, images can then be constructed tomographically, and regional time activities can be derived86.
The inherent sensitivity and specificity of PET is the major strength of this technique. Isotopes can be detected down to the 100 picomolar level in the target tissues. At this low level the compounds often have little or no physiological effect on the patient or the test animal, which permits studying the mechanism of action or biodistribution independent of any physiological consequences87, 88. The spatial resolution of PET down to the millimeter level permits applications not only to humans for diagnosis and drug development, but also to animals for preclinical studies. The ability of PET to translate studies from animals to humans adds to its appeal.
Compared with single photon emission computed tomography (SPECT), PET offers increased spatial information and permits more accurate attenuation correction. Many PET radiotracers have a short half-life, which allows for repetitive imaging over time. However, the anatomical resolution of PET (approximately 4–8 mm3 in clinical and 1–2 mm3 in small animal imaging systems) is noticeably poorer than that achieved by CT or MRI89. The variable movement of positrons before annihilation, and the deviation of the generated 511 keV photons from the exact 180° angular separation, can limit the resolution. To overcome this limitation, hybrid systems such as PET-CT have been introduced90. The CT component of the hybrid system is used to improve anatomical definition of the ROIs for analysis and to create radiation-attenuation maps to correct for non-uniform attenuation91. With the development of microPET or microPET/CT scanners dedicated to small animal imaging studies, it can provide a similar in vivo imaging capability in mice, rats, monkeys, and humans so one can readily transfer knowledge and molecular measurements between species92, 93. Initial experiments with PET/MRI prototypes also showed very promising results, indicating its great potential for clinical and preclinical imaging94.
Functional Imaging of Angiogenesis with PET
A major advantage of the nuclear medicine techniques especially using PET tracers is that they are truly quantitative and that the tissue concentration Ct can be measured non-invasively95. 133Xe 96 has been used to measure regional cerebral blood flow and 11C-microspheres of approximately 10 μm diameter been used as “gold standard” for perfusion measurements or for validation of new imaging methods for perfusion measurement 97.
Nowadays, most PET-perfusion measurements are performed using 15O-H2O, using either static or dynamic PET imaging98, 99. 15O-H2O satisfies all the requirements for a perfusion tracer in Fick’s model100 (1) because it is biologically and metabolically inert, and freely diffusible into and out of tissue water.
| (1) |
Ct = tissue concentration, mol*mltissue−1; Ci = Influx concentration, mol*mlcarrier−1
Ce = eflux concentration, mol*mlcarrier−1; P = Perfusion, mlcarrier * min−1* mltissue−1
Thus “tissue water” can be modelled as a single compartment including both tissue and its draining fluids (lymphatics and veins). Two methods can be used for measuring perfusion with [15O]H2O, the steady-state method of Frackowiak and colleagues, and the 15O-dynamic water method by Lammertsma et al.101. The latter is currently used most often for perfusion studies due to improved PET scanner technology. The tracer is administered by inhalation or by peripheral venous bolus injection. Continuous arterial data are obtained either by image based arterial input functions (a large vessel like the aorta or the left ventricle) or by peripheral sampling to a well counter device. The data are compatible with those from diseases investigated with other methods, and the values reported by PET for tumors are within the reported range for PET in other tissues102, 103. In locally advanced breast cancer, first results with dynamic 15O-H2O PET are promising, as tumor blood flow decreased in the responder group after chemotherapy, whereas it increased in the non-responder group104.
PET imaging can also be used to derive data on blood volume and vascular permeability. Blood volume imaging with PET uses 15O-CO or 11C-CO carbon monoxide. 15O-CO binds irreversibly with hemoglobin to form 15O-CO-Hb carboxyhemoglobin 86. Because 15O-CO-Hb remains exclusively within the vasculature it can be used as a tracer of vascular volume. A tissue concentration dataset is obtained over a further 5–6 min and an arterial 15O-CO-Hb concentration curve is derived from a series of arterial blood samples over the same interval. Another method for blood volume imaging is labeling red blood cells (RBCs) or albumin with radionuclides, because both are too large to leave normal blood vessels and are retained in the blood pool. In tumor vessels, leakage of these contrast agents into the tumor will occur, but this effect can be used to calculate the tumor vessel permeability, when dynamic imaging is performed. For PET, the tracer 68Ga-DOTA-albumin has been developed and showed favorable results in first animal studies105.
Imaging of molecular markers of vasculature
Even though structural/functional imaging of the vasculature can reveal potentially useful information before, during, and after therapeutic intervention, they do not convey enough knowledge about the biological changes upon therapy at the molecular level which may occur long before any structural/functional changes can be detected. While techniques like DCE-MRI and 15O-H2O PET for the assessment of hemodynamic parameters are widely used, the interpretation of the results with regard to their physiological meaning often remains difficult. Therefore more specific markers of angiogenic activity are necessary for pre-therapeutic assessment of angiogenesis and response evaluation during therapy. One approach is to identify molecular markers of angiogenesis such as receptors, enzymes, or extracellular matrix proteins and to use specific ligands to these targets conjugated with imaging probes for PET, SPECT, MRI, Optical Imaging or Ultrasound 106-108. Several molecular imaging makers including integrins, VEGF/VEGFR, MMPs, Hypoxia/HIF1 are angiogenesis related and PET imaging targeting to these markers will be discussed in the following sections.
PET imaging of integrins
Integrins, a family of cell adhesion molecules, are involved in a wide range of cell-extracellular matrix (ECM) and cell-cell interactions28, 109. Integrins are heterodimeric transmembrane glycoproteins consisting of different α- and β-subunits which play an important role in cell-cell- and cell-matrix-interactions110. In mammals, 18 α and 8 β subunits assemble into at least 24 different receptors111. Integrins expressed on endothelial cells modulate cell migration and survival during angiogenesis while integrins expressed on carcinoma cells potentiate metastasis by facilitating invasion and movement across the blood vessels. The αvβ3 integrin, which binds to Arginine-Glycine-Aspartic acid (RGD)-containing components of the interstitial matrix such as vitronectin, fibronectin and thrombospondin112, 113, is expressed in a number of tumor types such as melanoma, late stage glioblastoma, ovarian, breast, and prostate cancer114–116. The critical role of integrin αvβ3 in tumor invasion and metastasis arises from its ability to recruit and activate MMP-2 and plasmin, which can degrade components of the basement membrane and interstitial matrix117. Among all 24 integrins discovered to date, integrin αvβ3 is the most intensively studied, though many other integrins such as αvβ1, αvβ5, α5β1 and α4β1 also play important roles in regulating angiogenesis29, 118–121.
Several ECM proteins like vitronectin, fibrinogen and fibronectin interact via the RGD tripeptide sequence with the integrins113. Based on these findings, linear as well as cyclic RGD peptides have been introduced and showed high affinity and selectivity for αvβ3122, 123. First in vivo application of radioiodinated RGD peptides revealed the receptor-specific tumor uptake but also predominantly hepatobiliary elimination, resulting in high activity concentration in the liver and small intestine124. Consequently, several strategies to improve the pharmacokinetics of radiohalogenated peptides have been studied including conjugation with sugar moieties, hydrophilic amino acids and polyethylene glycol (PEG)125–128. Besides radiohalogenated RGD peptides, a variety of radiometalated tracers have been developed as well, including peptides labeled with 111In, 99mTc, 64Cu, 90Y, 188Re and 68Ga 129–132. Most of them are based on the cyclic pentapeptide and are conjugated via the γ-amino function of a lysine with different chelator systems, like DTPA, the tetrapeptide sequence H-Asp-Lys-Cys-Lys-OH, 1, 4, 7, 10-tetraazacyclododecane-N-N″-N″-N‴-tetraacetic acid (DOTA) and 1,4,7-triazacyclononane-1,4,7-triacetic acid (NOTA). While all these compounds have shown high receptor affinity and selectivity and specific tumor accumulation, the pharmacokinetics of most of them still have to be improved133. Among them, the compound 99mTc-NC100692 by GE Healthcare has been used for SPECT imaging in preclinical and clinical studies134.
In a human melanoma M21 model, 18F-Galacto-RGD showed a tumor uptake of 1.5 %ID/g at 120 min p.i.135, 136. Integrin receptor specific accumulation was demonstrated by blocking experiments injecting c(RGDfV) 10 min prior to tracer injection, which reduced tumor accumulation to approximately 35% of control. A correlation between integrin expression and tracer accumulation was observed in imaging studies with mice bearing melanoma tumors with increasing amounts of αvβ3-positive cells137. These data demonstrate that non-invasive determination of αvβ3 expression and quantification with radiolabeled RGD peptides is feasible with PET scans. 18F-Galacto-RGD has also been applied to patients and successfully imaged αvβ3 expression in human tumors with good tumor/background ratios138. Rapid clearance of 18F-Galacto-RGD from the blood pool and primarily renal excretion was confirmed by following biodistribution and dosimetry studies. Background activity in lung and muscle tissue was low and the calculated effective dose is very similar to an 18F-FDG scan139 (Figure 1). Results from dynamic emission scans over 60 minutes and kinetic modeling studies suggested that SUVs derived from static emission scans at ~ 60 min. p.i. can be used for the assessment of αvβ3 receptor density with reasonable accuracy139. SUVs and tumor/blood ratios based on PET imaging using 18F-Galacto-RGD were also found to correlate with the intensity of immunohistochemical staining of αvβ3 expression as well as with the microvessel density140. Good tumor/background ratios with 18F-Galacto-RGD PET also have been demonstrated in squamous cell carcinoma of the head and neck (SCCHN) with a widely varying intensity of tracer uptake. Immunohistochemistry demonstrated predominantly vascular αvβ3 expression, thus in SCCHN, 18F-Galacto-RGD PET might be used as a surrogate parameter of angiogenesis141. Moreover, there was no obvious correlation between the tracer uptake of 18F-FDG and 18F-Galacto-RGD in patients with various tumors, indicating that αvβ3 expression and glucose metabolism are not closely correlated in tumor lesions and that consequently 18F-FDG cannot provide similar information as 18F-Galacto-RGD142.
Figure 1.
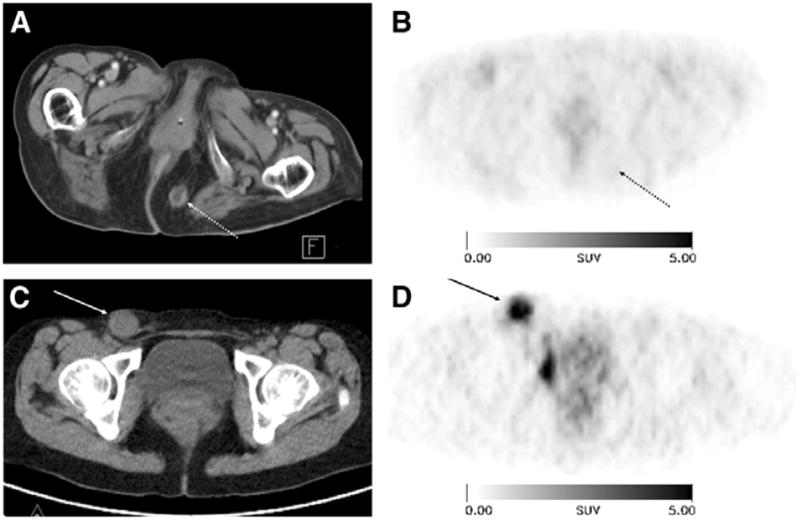
18F-Galacto-RGD scans of 2 patients with metastases from malignant melanoma and different tracer uptake. (Upper row images) An 89-y-old female patient with metastasis in subcutaneous fat in gluteal area on left side (arrow with dotted line). Tumor can be clearly delineated in CT scan (A), whereas it shows no significant uptake in 18F-Galacto-RGD PET scan (B; 60 min after injection). (Lower row images) A 36-y-old female patient with lymph node metastasis in right groin (arrow). Again, tumor is clearly visualized in CT scan (C) but also shows intense tracer uptake in 18F-Galacto-RGD PET scan (D; 89 min after injection; SUV, 6.8). Reproduced from Beer et al. 139 with permission.
Within physiological 18F-Galacto-RGD uptake area, such as liver, spleen and intestine, lesion identification is still problematic. Therefore, multimeric RGD peptides have been developed in order to provide more effective antagonists with better targeting capability and higher cellular uptake through the integrin-dependent binding143. The underlying rationale is that the interaction between integrin αvβ3 and RGD-containing ECM-proteins involves multivalent binding sites with clustering of integrins. A series of multimeric RGD peptides labeled with 18F or 64Cu for PET imaging to improve the tumor-targeting efficacy and pharmacokinetics have been reported130, 144–148. 18F-FB-E[c(RGDyK)]2 (abbreviated as 18F-FRGD2) showed predominantly renal excretion and almost twice as much tumor uptake in the same animal model compared with the monomeric tracer 18F-FB-c(RGDyK)144, 145. Tumor uptakes quantified by microPET scans in six tumor xenograft models correlated well with integrin αvβ3 expression level measured by SDS-PAGE autoradiography. The tetrameric RGD peptide-based tracer, 18F-E[E[c(RGDfK)]2]2, showed significantly higher receptor binding affinity than the corresponding monomeric and dimeric RGD analogues and demonstrated rapid blood clearance, high metabolic stability, predominant renal excretion and significant receptor-mediated tumor uptake with good contrast in xenograft-bearing mice 148. Therefore, 18F-E[E[c(RGDfK)]2]2 is a promising agent for peptide receptor radionuclide imaging as well as targeted internal radiotherapy of integrin αvβ3 positive tumors. Compared with tetramer, RGD octamer further increased the integrin avidity by another 3-fold. In vivo microPET imaging showed that 64Cu-DOTA-RGD octamer had slightly higher initial tumor uptake and much longer tumor retention in U87MG tumor that express high level of integrin149 (Figure 2). However, compared with tetramers, higher renal uptake of the octamer was observed, which was attributed mainly to the integrin positivity of the kidneys. Wester and Kessler groups have also synthesized a series of monomeric, dimeric, tetrameric and octameric RGD peptides. These compounds contain different numbers of c(RGDfE) peptides connected via PEG linker and lysine moieties, which are used as branching units150, 151.
Figure 2.

(A) Decay-corrected whole-body coronal microPET images of athymic female nude mice bearing U87MG tumor at 5, 15, 30, 60, 120, and 180 min after injection of 18F-FPRGD4 (3.7 MBq [100 μCi]). (B) Decay-corrected whole-body coronal microPET images of c-neu oncomice at 30, 60, and 150min (5-min static image) after intravenous injection of 18F-FPRGD4. (C) Decay-corrected whole-body coronal microPET images of orthotopic MDA-MB-435 tumor-bearing mouse at 30, 60, and 150 min after intravenous injection of 18F-FPRGD4. (D) Decay-corrected whole-body coronal microPET images of DU-145 tumor-bearing mouse (5-min static image) after intravenous injection of 18F-FPRGD4. (E) Coronal microPET images of a U87MG tumor-bearing mouse at 30 and 60 min after coinjection of 18F-FPRGD4 and a blocking dose of c(RGDyK). Arrows indicate tumors in all cases. Reproduced from Wu et al. 149 with permission.
Besides RGD peptides, in vivo imaging using Abegrin, a humanized monoclonal antibody against human integrin αvβ3, has been performed after DOTA conjugation and 64Cu labeling. MicroPET studies revealed that 64Cu-DOTA-Abegrin had a high tumor activity accumulation up to 49.41 ± 4.54% injected dose/g at 71-hour postinjection for U87MG tumors 152. Not only malignant diseases, the integrin expression after myocardial infarction has also been monitored with 18F-Galacto-RGD in a Wister rat model. PET imaging and autoradiography revealed focal accumulation in the infarct area started at day 3, peaked between 1 and 3 weeks, and decreased to day 3 level at 6 months after reperfusion. The time course of focal tracer uptake paralleled vascular density as measured by CD31 immunohistochemical analysis, indicating that 18F-Galacto-RGD is promising for the monitoring of myocardial repair processes 153. The results from this study encourage the application of RGD PET imaging to monitor the angiogenesis in other non-cancer diseases.
PET Imaging of VEGF and Its Receptors
VEGF, a potent mitogen in embryonic and somatic angiogenesis, plays a pivotal role in both normal vascular tissue development and many disease processes154, 155. The VEGF family is composed of seven members with a common VEGF homology domain: VEGF-A, VEGF-B, VEGF-C, VEGF-D, VEGF-E, VEGF-F, and placenta growth factor5. VEGF-A is a dimeric, disulfide-bound glycoprotein existing in at least seven homodimeric isoforms, consisting of 121, 145, 148, 165, 183, 189, or 206 amino acids. Besides the difference in molecular weight, these isoforms also differ in their biological properties such as the ability to bind to cell surface heparin sulfate proteoglycans5.
The angiogenic actions of VEGF are mainly mediated via two endothelium-specific receptor tyrosine kinases, Flt-1 (VEGFR-1) and Flk-1/KDR (VEGFR-2)156. Both VEGFRs are largely restricted to vascular endothelial cells and all VEGF-A isoforms bind to both VEGFR-1 and VEGFR-2. It is now generally accepted that VEGFR-1 is critical for physiologic and developmental angiogenesis and its function varies with the stages of development, the states of physiologic and pathologic conditions, and the cell types in which it is expressed5, 155. VEGFR-2 is the major mediator of the mitogenic, angiogenic, and permeability-enhancing effects of VEGF. Over-expression of VEGF and/or VEGFRs has been implicated as poor prognostic markers in various clinical studies5. Agents that prevent VEGF-A binding to its receptors157, antibodies that directly block VEGFR-2158, 159, and small molecules that inhibit the kinase activity of VEGFR-2 thereby block growth factor signaling65, 160, 161, are all currently under active development.
The critical role of VEGF-A in cancer progression has been highlighted by the approval of the humanized anti-VEGF monoclonal antibody bevacizumab (Avastin; Genentech) for first line cancer treatment162. Development of VEGF- or VEGFR-targeted molecular imaging probes could serve as a new paradigm for the assessment of anti-angiogenic therapeutics and for better understanding the role and expression profile of VEGF/VEGFR in many angiogenesis-related diseases. VEGF/VEGFR has been imaged by various imaging modalities though PET is the dominant technique for direct VEGF/VEGFR imaging163. In the clinical setting, the right timing can be critical for VEGFR-targeted cancer therapy and non-invasive imaging of VEGF/VEGFR can help in determining whether to start and when to start VEGFR-targeted treatment. With the development of new tracers with better targeting efficacy and desirable pharmacokinetics, clinical translation will be critical for the maximum benefit of VEGF-based imaging agents.
VEGF imaging has been investigated especially with radiolabeled specific antibodies164. VG76e, an IgG1 monoclonal antibody that binds to human VEGF, was labeled with 124I for PET imaging of solid tumor xenografts in immune-deficient mice165. Whole-animal PET imaging studies revealed a high tumor-to-background contrast. Although VEGF specificity in vivo was demonstrated in this report, the poor immunoreactivity (< 35%) of the radiolabeled antibody limits the potential use of this tracer. HuMV833, the humanized version of a mouse monoclonal anti-VEGF antibody MV833, was also labeled with 124I and the distribution and biological effects of HuMV833 in patients in a phase I clinical trial were investigated 166. Patients with progressive solid tumors were treated with various doses of HuMV833 and PET imaging using 124I-HuMV833 was carried out to measure the antibody distribution in and clearance from tissues. It was found that antibody distribution and clearance were quite heterogeneous not only between and within patients but also between and within individual tumors. Bevacizumab, a humanized monoclonal antibody against VEGF, has been labeled with 111In to image VEGF-A expression in nude mice model or patients with colorectal liver metastases167. Although enhanced uptake of 111In-bevacizumab in the liver metastases was observed in 9 of the 12 patients, there was no correlation between the level of 111In-antibody accumulation and the level of VEGF-A expression in the tissue as determined by in situ hybridization and ELISA 167. Bevacizumab has also been labeled with the PET isotope 89Zr for noninvasive in vivo VEGF visualization and quantification. On small-animal PET images, radiolabeled bevacizumab showed higher uptake compared with radiolabeled human IgG in a human SKOV-3 ovarian tumor xenograft. Tracer uptake in other organs was seen primarily in the liver and spleen (Figure 3)164. A recent study showed that there was a significant 18F-FDG kinetics correlation between k1 (The transport coefficient ) and VEGF-A mRNA level determined by gene chip assay (r = 0.51), indicating the possibility to predict the gene expression of VEGF-A with the regression functions from the FDG PET parameters168.
FIGURE 3.
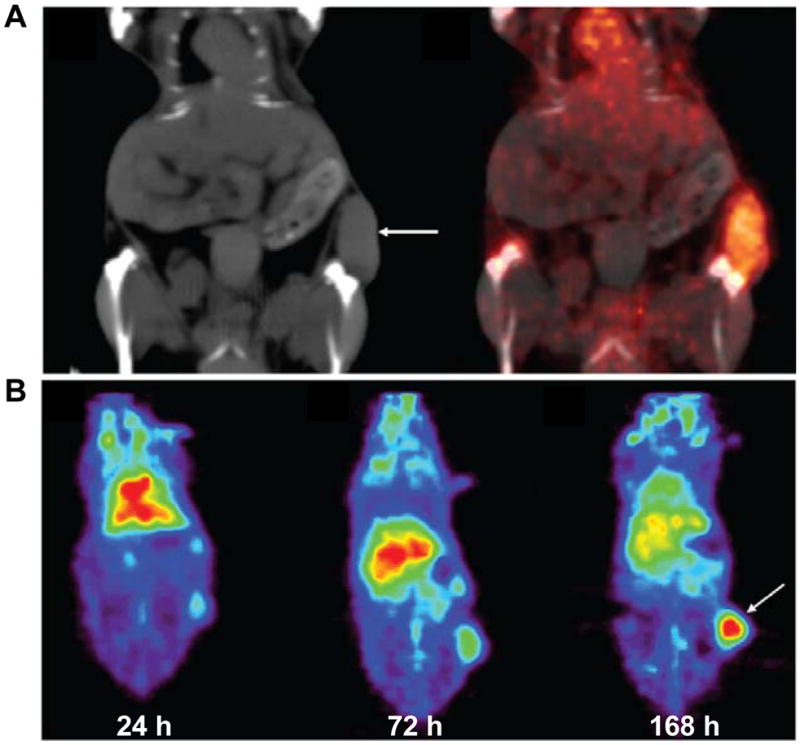
(A) Coronal CT image and fusion of microPET and CT images (168 h after injection) enables adequate quantitative measurement of 89Zr-bevacizumab in the tumor; (B) Coronal planes of microPET images after injection of 89Zr-bevacizumab. Reproduced from Nagengast et al. 164 with permission.
VEGF/VEGFR interactions is one of the most extensively studied angiogenesis-related signaling pathways 163. The alternative to overcome the difficulty induced by the soluble and more dynamic nature of VEGF is to image VEGFRs, another indicators of angiogenesis which have superior accessibility. VEGF isoforms exist in nature and have very strong binding affinity and specificity to VEGFRs163, 169. Therefore, a generic strategy is to label these VEGF isoforms with radionuclides to image VEGFRs expression. VEGF121 is a soluble, non-heparin-binding variant that exists in solution as a disulfide-linked homodimer containing the full biological and receptor-binding activity of the larger variants5. VEGF121 has been labeled with 64Cu (t1/2 = 12.7 h) for PET imaging of tumor angiogenesis and VEGFR expression170. DOTA-VEGF121 exhibited nanomolar receptor binding affinity (comparable to VEGF121) in vitro. MicroPET imaging revealed rapid, specific, and prominent uptake of 64Cu-DOTA-VEGF121 (10~15%ID/g) in highly vascularized small U87MG tumor (60 mm3 ) with high VEGFR-2 expression but significantly lower and sporadic uptake (~ 3%ID/g) in large U87MG tumor (1,200 mm3 ) with low VEGFR-2 expression (Figure 4). Western blotting of tumor tissue lysate, immunofluorescence staining, and blocking studies with unlabeled VEGF121 confirmed that the tumor uptake is VEGFR specific. This was the first report on PET imaging of VEGFR expression. This study also demonstrated the dynamic nature of VEGFR expression during tumor progression in that even for the same tumor model, VEGFR expression level can be dramatically different at different stages. Successful demonstration of the ability of 64Cu-DOTA-VEGF121 to visualize VEGFR expression in vivo should allow for clinical translation of this tracer to image tumor angiogenesis and to guide VEGFR-targeted cancer therapy 170. Further studies showed that the uptake of 64Cu-DOTA-VEGF121 in the tumor peaked when the tumor size was about 100–250 mm3. Both small and large tumors had lower tracer uptake indicating a narrow range of tumor size with high VEGFR-2 expression171. In another follow-up study, a VEGFR specific fusion toxin VEGF121/rGel (composed of VEGF121 linked with a G4S tether to recombinant plant toxin gelonin) was used to treat orthotopic glioblastoma in a mouse model169. Before initiation of treatment, microPET imaging with 64Cu-labeled VEGF121/rGel was performed to evaluate the tumor targeting efficacy and the pharmacokinetics. It was found that 64Cu-DOTA-VEGF121/rGel exhibited high tumor accumulation/retention and high tumor-to-background contrast up to 48 h after injection in glioblastoma xenografts. Based on the in vivo pharmacokinetics of 64Cu-DOTA-VEGF121/rGel, VEGF121/rGel was administered every other day for the treatment of orthotopic U87MG glioblastomas. Histologic analysis revealed specific tumor neovasculature damage after treatment with 4 doses of VEGF121/rGel 169. 64Cu was also used to site-specifically label VEGF121 and it was found that PEGylation showed considerably prolonged blood clearance. Compared with 99mTc-labeled analog where the tumor uptake (~ 2 %ID/g) was lower than most of the normal organs and the kidney uptake was about 120 %ID/g, the PEGylated version gave higher tumor uptake (~ 2.5 %ID/g) and lower kidney uptake at about 65 %ID/g 172.
Figure 4.

MicroPET of 64Cu-DOTA-VEGF121 in U87MG tumor-bearing mice. (A) Serial microPET scans of large and small U87MG tumor-bearing mice injected intravenously with 5–10 MBq of 64Cu-DOTA-VEGF121. Mice injected with 64Cu-DOTA-VEGF121 30 min after injection of 100 μg VEGF121 are also shown (denoted as “Small tumor + block”). (B) Two-dimensional whole-body projection of the 3 mice shown in A at 16 h after injection of 64Cu-DOTA-VEGF121. Tumors are indicated by arrows. Reproduced from Cai et al. 170 with permission.
PET imaging using radiolabeled VEGF can also play a role in other angiogenesis-related diseases besides cancer. Myocardial infarction (MI) can lead to the activation of many biological pathways including VEGF/VEGFR signaling173, 174. Using the previously validated PET tracer 64Cu-DOTA-VEGF121, the kinetics of VEGFR expression was imaged for the first time in living subjects using a rat model of MI175. MI was induced by ligation of the left anterior descending coronary artery in Sprague-Dawley rats and confirmed by ultrasound. 64Cu-DOTA-VEGF121 PET scans were performed prior to MI induction, and at days 3, 10, 17, and 24 after MI induction. Baseline myocardial uptake of 64Cu-DOTA-VEGF121 was minimal (0.3 ± 0.1 %ID/g). After MI, 64Cu-DOTA-VEGF121 myocardial uptake significantly increased (up to 1.0 ± 0.1 %ID/g) and was elevated for 2 weeks, after which it returned to baseline levels. In a hindlimb ischemia model, PET imaging showed significantly higher 64Cu-DOTA-VEGF121 uptake in ischemic hindlimbs than in non-ischemic hindlimbs. Treadmill exercise training was also found to increase 64Cu-DOTA-VEGF121 uptake in ischemic hindlimbs compared with non-exercised hindlimbs176. With 64Cu-DOTA-VEGF121 PET imaging, we have evaluated the VEGFR expression kinetics noninvasively in a rat stroke model. The results revealed that the tracer uptake in the stroke border zone peaked at approximately 10 days after surgery, indicating neovascularization as confirmed by histology (VEGFR-2, BrdU, and lectin staining)177.
All VEGF-A isoforms bind to both VEGFR-1 and VEGFR-25. In the imaging studies reported to date, specificity to either VEGFR-1 or VEGFR-2 has rarely been achieved as most of the tracers are based on VEGF isoforms. Kidneys have high VEGFR-1 expression which can take up VEGF-A based tracer thus usually makes it the dose limiting organ170, 178. Alanine-scanning mutagenesis has been used to identify a positively charged surface in VEGF165 that mediates the binding to VEGFR-2179. Arg82, Lys84, and His86, located in a hairpin loop, were found to be critical for binding VEGFR-2, while negatively charged residues, Asp63, Glu64, and Glu67, were associated with VEGFR-1 binding. Mutations in the 63–67 region of VEGF exhibited only modest effects on VEGFR-2 binding but significant reduction in affinity with VEGFR-1. Recently, our lab engineered a D63AE64AE67A mutant of VEGF121 (VEGFDEE) by recombinant DNA technology to develop a VEGFR-2-specific PET tracer. Cell binding assay demonstrated that VEGFDEE had about 20-fold lower VEGFR-1 binding affinity and only slightly lower VEGFR-2 binding affinity as compared with VEGF121. Both 64Cu-DOTA-VEGF121 and 64Cu-DOTA-VEGFDEE had rapid and prominent activity accumulation in VEGFR-2-expressing 4T1 tumors. However, the renal uptake of 64Cu-DOTA-VEGFDEE was significantly lower than that of 64Cu-DOTA-VEGF121 as rodent kidneys expressed high levels of VEGFR-1, indicating that VEGFDEE is superior to wild type VEGF121 for imaging tumor angiogenesis (Figure 3) 180. The DOTA conjugation of VEGF proteins in this study is randomly instead of site-specifically. It will be critical to further develop more potent VEGFR-2 specific mutants, site-specifically label VEGF analog proteins with various isotopes including 64Cu to improve angiogenesis imaging quality and result analysis 175.
Imaging of Matrix Metalloproteinases
Matrix metalloproteinases (MMPs) are a family of zinc- and calcium-dependent endopeptidases which are responsible for the enzymatic degradation of connective tissue und thus facilitate endothelial cell migration during angiogenesis 181. Additionally, MMPs process and release bioactive molecules such as growth factors, proteinase inhibitors, cytokines and chemokines182. From the more than 18 members of the MMP family, the gelatinases MMP-2 and -9 are most consistently detected in malignancies117. In the progression of the atherosclerotic lesions, MMP-3 and -9 have been shown to limit plaque growth and promote a stable plaque phenotype and MMP-12 supports atherosclerotic lesion expansion and destabilization 183. Many strategies have been developed to image MMPs level for the assessment of angiogenesis 184, 185.
The so-called “smart probes” have been developed to contain fluorescent dyes and MMP cleavable sequences 186, 187. It has been reported a MMP-2-sensitive probe was activated by MMP-2 in vitro, producing up to an 850% increase in near-infrared fluorescent signal intensity, and MMP-2-positive tumors were easily identified as high-signal-intensity regions as early as 1 hour after intravenous injection of the MMP-2 probe 188.
Via phage display techniques, the MMP specific decapeptide H-Cys-Thr-Thr-His-Trp-Gly-Phe-Thr-leu-Cys-OH (CTT) was found and could be labeled with 125I and 99mTc. However, this tracer has unfavourable characteristics for in vivo imaging because the metabolic stability of the compound is low and lipophilicity is high 189. Another group labeled this peptide with 111In after conjugating it with a highly hydrophilic and negatively charged chelator DTPA. A significant correlation was observed between the accumulation in the tumor as well as tumor-to-blood ratio of 111In-DTPA-CTT and gelatinase activity. Moreover, 111In-DTPA-CTT showed low levels of radioactivity in the liver and kidneys190. CTT peptide also has been labeled with 64Cu after DOTA conjugation for PET imaging of MMP. 64Cu-DOTA-CTT inhibited hMMP-2 and mMMP-9 with similar affinity to CTT. MicroPET imaging studies showed that 64Cu-DOTA-CTT was taken up by MMP-2/9-positive B16F10 murine melanoma tumors, however, the low affinity for MMP-2 and MMP-9 and in vivo instability of CTT-based imaging probes need to be overcome for further applications191.
Another approach is to label small molecule MMP inhibitors (MMPIs), which are typically used as antiangiogenic drugs. In general, MMPIs possess a zinc binding group (ZBG) complexing the zinc ion of the active site and are classified into several groups owing to their lead structures181. Different 18F and 11C labeled MMPIs have been synthesized and evaluated preclinically with mixed results192, 193. Fluorinated MMPIs based on lead structures of the broad-spectrum inhibitors N-hydroxy-2(R)-[[(4-methoxyphenyl)sulfonyl](benzyl)-amino]-3-methyl-butanamide (CGS 25966) and N-hydroxy-2(R)-[[(4-methoxyphenyl)sulfonyl](3-picolyl)-amino]-3-methyl-butanamide (CGS 27023A) have been synthesized and showed high in vitro MMP inhibition potencies for MMP-2, MMP-8, MMP-9, and MMP-13 194. However, in vivo microPET study with 11C-CGS 25966 failed to demarcate MMP positive tumors195. A 11C-labeled MMPI (2R)-2-[[4-(6-fluorohex-1-ynyl)phenyl]sulfonylamino]-3-methylbutyric acid 11C-methyl ester (11C-FMAME), has also been synthesized and applied to two animal models of breast cancer, MCF-7 xenograft transfected with IL-1 and MDA-MB-435 xenograft in athymic mice. Again, low tumor-to-blood and tumor-to muscle ratios of these tracers do not allow visualization of the tumors in microPET studies192 196. However, biodistribution study with 18F-labeled similar compound, (2R)-2-[4-(6-18F-Fluorohex-1-ynyl)-benzenesulfonylamino]-3-methylbutyric acid (18F-SAV03), showed higher tumor uptake of the tracer than normal organs193. Other MMPIs have also been synthesized and labeled with radionuclides including 111In and 18F 197–194. Nevertheless, significant improvements in tumor MMP targeting and in vivo pharmacokinetics are necessary before the use of MMP radiotracer imaging will be translated into the clinic.
Imaging of other angiogenesis related targets
Fibronectin is a large glycoprotein, which can be found physiologically in plasma and tissues. However, the extra-domain B of fibronectin (EDB), consisting of 91 amino acids, is not present in the fibronectin molecule under normal conditions, except for the endometrium in the proliferative phase and some vessels of the ovaries. EDB is interesting as a marker of angiogenesis as it is expressed in a variety of solid tumors, as well as in ocular angiogenesis and wound healing198. The human antibody fragment scFv(L19) has been shown to efficiently localize on neovasculature both in animal models and in cancer patients. In a study with patients suffering from various solid tumors, 16 of 20 tumor lesions could be identified by SPECT using 123I-scFv(L19). Whether the unidentified tumors were not detected because they were either in a phase of slow growth with low levels of angiogenesis, or due to the technical limitations of SPECT imaging, is not clear199. No reports about PET tracers targeting EDB are available up to now. Other angiogenesis related biomarkers such as angiopoietins/Tie receptors200 and CD276201 are also potential targets for angiogenesis imaging. Angiopoietins/Tie receptors are involved in regulation of complex interactions between endothelium and surrounding cells. CD276 has been observed to be overexpressed in tumor versus normal endothelium.
Summary and perspective
Numerous imaging techniques are available for assessing tissue vasculature on a structural, functional and molecular level. A wide variety of targeting ligands (small molecules, peptides, peptidomimetics, and antibodies) have been conjugated with various imaging labels for MRI, ultrasound, optical, SPECT, PET, and multimodality imaging of angiogenesis. All these methods have been successfully used preclinically and will hopefully aid in antiangiogenic drug evaluation in animal studies. Due to its high sensitivity and low amounts of tracer that have to be used, PET will probably be the first to be used on a wide scale in patients in the intermediate term. In addition, toxicity issues of PET tracers are of less importance compared to MRI or Ultrasound imaging probes since only pica molar amount will be used for imaging purpose. However, it is likely that not one single parameter, target structure or imaging technique will be used for the assessment of angiogenesis in the future, but rather a multimodality, multiplexing imaging which will allow for evaluation of the angiogenic cascade in its full complexity to acquire comprehensive information. It is predictable that the new generation clinical PET/CT and microPET/microCT, as well as PET/MRI and microPET/microMRI currently in active development 202–204, will likely play a major role in molecular imaging of angiogenesis for the years to come.
Although it is generally assumed that non-invasive imaging results correlate with the target expression level, such assumption has not been extensively validated. In most reports, two tumor models are studied where one acts as a positive control and the other as a negative control. Quantitative correlation between the target expression level in vivo and the non-invasive imaging data is rare205–208. Such correlation is critical for future therapeutic response monitoring, as it would be ideal to be able to monitor the changes in the target expression level quantitatively, rather than qualitatively, in each individual patient. Lack of accurate quantification is one of the hindrances why only a few radiotracers including PET tracers have been used in humans up to now, and their role in assessment of anti- or pro-angiogenic therapies is still unsettled.
To further improve imaging of the angiogenesis process at molecular level, it is necessary to identify new angiogenesis related targets and corresponding specific ligands and to optimize currently available imaging probes. Thorough and full understanding of the physiological and pathological changes during angiogenesis will be critical for new targets identification. Optimization of current available imaging probes can be achieved in several ways. First, oligomerization (homo or hetero) the targeting ligand (typically peptide) can improve the binding affinity as well as tissue retention likely due to the polyvalency effect 209. Second, site-specific labeling may be advantageous than randomly labeling on lysine residues in terms of retaining the binding affinity and functional activity 175. Third, incorporation of a linker between the targeting ligand and the label can improve the pharmacokinetic properties. Glycosylation, PEGylation, and various other linkers have been shown to improve the imaging quality. Last, development of new strategies to improve the labeling yield (most applicable to 18F-based tracers) is critical for future clinical studies. To foster the continued discovery and development of angiogenesis-targeted imaging agents, cooperative efforts are needed from cellular/molecular biologists to identify and validate novel imaging targets, chemists/radiochemists to synthesize and characterize the imaging probes, and engineers/medical physicists/mathematicians to develop high sensitivity/high resolution imaging devices/hybrid instruments and better image reconstruction algorithms.
Non-invasive imaging of angiogenesis has clinical applications in many aspects including lesion detection, patient stratification, new drug development/validation, treatment monitoring, and dose optimization. For example, glucosamino 99mTc-d-c(RGDfK) gamma-camera imaging has been applied to monitor the therapeutic efficacy of paclitaxel in LLC tumor-bearing mice 210. With the development of new tracers with better targeting efficacy and desirable pharmacokinetics, clinical translation will be critical for the maximum benefit of these imaging probes. Most of the molecular imaging probes suffer from the slow translation from bench to bedside. Multiple steps in pre-clinical development, especially the investigational new drug (IND)-directed toxicology, significantly slowed down the process of converting a newly developed agent into a diagnostic imaging probe for clinical testing. The high specificity required for molecular imaging not only leads to higher costs of development but also smaller market potential, which may make them considered too risky by investors for commercial development. However, the situation has gradually changed over the last several years thanks to the continued development and wider availability of scanners dedicated to small animal imaging studies, as well as the exploratory IND mechanism proposed by the food and drug administration (FDA) to allow faster first-in-human studies. Now the molecular imaging techniques can bridge the gap between preclinical and clinical research to develop candidate drugs that have the optimal target specificity, pharmacodynamics, and efficacy. It is expected that in the foreseeable future, anigogenesis imaging with PET tracers will be routinely applied in anti-cancer clinical trials, paving the way to personalized molecular therapy.
Acknowledgments
Some of the research presented in this review from was supported, in part, by the National Institute of Biomedical Imaging and Bioengineering (NIBIB) (R21 EB001785), National Cancer Institute (NCI) (R21 CA102123, P50 CA114747, U54 CA119367, and R24 CA93862), Department of Defense (DOD) (W81XWH-04-1-0697, W81XWH-06-1-0665, W81XWH-06-1-0042, and DAMD17-03-1-0143), and a DOD Prostate Postdoctoral Fellowship from Department of Defense (to G. Niu).
Footnotes
Publisher's Disclaimer: This is a PDF file of an unedited manuscript that has been accepted for publication. As a service to our customers we are providing this early version of the manuscript. The manuscript will undergo copyediting, typesetting, and review of the resulting proof before it is published in its final citable form. Please note that during the production process errors may be discovered which could affect the content, and all legal disclaimers that apply to the journal pertain.
References
- 1.Folkman J. Angiogenesis in cancer, vascular, rheumatoid and other disease. Nat Med. 1995 Jan;1(1):27–31. doi: 10.1038/nm0195-27. [DOI] [PubMed] [Google Scholar]
- 2.Atluri P, Woo YJ. Pro-angiogenic cytokines as cardiovascular therapeutics: assessing the potential. BioDrugs. 2008;22(4):209–222. doi: 10.2165/00063030-200822040-00001. [DOI] [PubMed] [Google Scholar]
- 3.Pathak AP, Gimi B, Glunde K, Ackerstaff E, Artemov D, Bhujwalla ZM. Molecular and functional imaging of cancer: Advances in MRI and MRS. Methods Enzymol. 2004;386:3–60. doi: 10.1016/S0076-6879(04)86001-4. [DOI] [PubMed] [Google Scholar]
- 4.Rajagopalan S, Trachtenberg J, Mohler E, et al. Phase I study of direct administration of a replication deficient adenovirus vector containing the vascular endothelial growth factor cDNA (CI-1023) to patients with claudication. Am J Cardiol. 2002 Sep 1;90(5):512–516. doi: 10.1016/s0002-9149(02)02524-9. [DOI] [PubMed] [Google Scholar]
- 5.Ferrara N. Vascular endothelial growth factor: basic science and clinical progress. Endocr Rev. 2004 Aug;25(4):581–611. doi: 10.1210/er.2003-0027. [DOI] [PubMed] [Google Scholar]
- 6.Hurwitz H, Fehrenbacher L, Novotny W, et al. Bevacizumab plus irinotecan, fluorouracil, and leucovorin for metastatic colorectal cancer. N Engl J Med. 2004 Jun 3;350(23):2335–2342. doi: 10.1056/NEJMoa032691. [DOI] [PubMed] [Google Scholar]
- 7.Kerbel RS. Antiangiogenic therapy: a universal chemosensitization strategy for cancer? Science. 2006 May 26;312(5777):1171–1175. doi: 10.1126/science.1125950. [DOI] [PubMed] [Google Scholar]
- 8.Faivre S, Demetri G, Sargent W, Raymond E. Molecular basis for sunitinib efficacy and future clinical development. Nat Rev Drug Discov. 2007 Sep;6(9):734–745. doi: 10.1038/nrd2380. [DOI] [PubMed] [Google Scholar]
- 9.Jaffe CC. Measures of response: RECIST, WHO, and new alternatives. J Clin Oncol. 2006 Jul 10;24(20):3245–3251. doi: 10.1200/JCO.2006.06.5599. [DOI] [PubMed] [Google Scholar]
- 10.Cai W, Rao J, Gambhir SS, Chen X. How molecular imaging is speeding up anti-angiogenic drug development. Mol Cancer Ther. 2006;5(11):2624–2633. doi: 10.1158/1535-7163.MCT-06-0395. [DOI] [PubMed] [Google Scholar]
- 11.Choe YS, Lee KH. Targeted in vivo imaging of angiogenesis: present status and perspectives. Curr Pharm Des. 2007;13(1):17–31. doi: 10.2174/138161207779313812. [DOI] [PubMed] [Google Scholar]
- 12.Haubner R. Noninvasive tracer techniques to characterize angiogenesis. Handb Exp Pharmacol. 2008;(185 Pt 2):323–339. doi: 10.1007/978-3-540-77496-9_14. [DOI] [PubMed] [Google Scholar]
- 13.Berthelot T, Lasne MC, Deleris G. New trends in molecular imaging of tumor angiogenesis. Anticancer Agents Med Chem. 2008 Jun;8(5):497–522. doi: 10.2174/187152008784533026. [DOI] [PubMed] [Google Scholar]
- 14.Auguste P, Lemiere S, Larrieu-Lahargue F, Bikfalvi A. Molecular mechanisms of tumor vascularization. Crit Rev Oncol Hematol. 2005 Apr;54(1):53–61. doi: 10.1016/j.critrevonc.2004.11.006. [DOI] [PubMed] [Google Scholar]
- 15.Carmeliet P. Mechanisms of angiogenesis and arteriogenesis. Nat Med. 2000 Apr;6(4):389–395. doi: 10.1038/74651. [DOI] [PubMed] [Google Scholar]
- 16.Holash J, Maisonpierre PC, Compton D, et al. Vessel cooption, regression, and growth in tumors mediated by angiopoietins and VEGF. Science. 1999 Jun 18;284(5422):1994–1998. doi: 10.1126/science.284.5422.1994. [DOI] [PubMed] [Google Scholar]
- 17.Folkman J. Tumor angiogenesis: therapeutic implications. N Engl J Med. 1971 Nov 18;285(21):1182–1186. doi: 10.1056/NEJM197111182852108. [DOI] [PubMed] [Google Scholar]
- 18.Kalluri R. Basement membranes: structure, assembly and role in tumour angiogenesis. Nat Rev Cancer. 2003 Jun;3(6):422–433. doi: 10.1038/nrc1094. [DOI] [PubMed] [Google Scholar]
- 19.Bergers G, Benjamin LE. Tumorigenesis and the angiogenic switch. Nat Rev Cancer. 2003 Jun;3(6):401–410. doi: 10.1038/nrc1093. [DOI] [PubMed] [Google Scholar]
- 20.Nguyen M. Angiogenic factors as tumor markers. Invest New Drugs. 1997;15(1):29–37. doi: 10.1023/a:1005766511385. [DOI] [PubMed] [Google Scholar]
- 21.Landgren E, Schiller P, Cao Y, Claesson-Welsh L. Placenta growth factor stimulates MAP kinase and mitogenicity but not phospholipase C-gamma and migration of endothelial cells expressing Flt 1. Oncogene. 1998 Jan 22;16(3):359–367. doi: 10.1038/sj.onc.1201545. [DOI] [PubMed] [Google Scholar]
- 22.Nor JE, Christensen J, Mooney DJ, Polverini PJ. Vascular endothelial growth factor (VEGF)-mediated angiogenesis is associated with enhanced endothelial cell survival and induction of Bcl-2 expression. Am J Pathol. 1999 Feb;154(2):375–384. doi: 10.1016/S0002-9440(10)65284-4. [DOI] [PMC free article] [PubMed] [Google Scholar]
- 23.Paku S, Paweletz N. First steps of tumor-related angiogenesis. Lab Invest. 1991 Sep;65(3):334–346. [PubMed] [Google Scholar]
- 24.Djonov V, Schmid M, Tschanz SA, Burri PH. Intussusceptive angiogenesis: its role in embryonic vascular network formation. Circ Res. 2000 Feb 18;86(3):286–292. doi: 10.1161/01.res.86.3.286. [DOI] [PubMed] [Google Scholar]
- 25.Metzger RJ, Krasnow MA. Genetic control of branching morphogenesis. Science. 1999 Jun 4;284(5420):1635–1639. doi: 10.1126/science.284.5420.1635. [DOI] [PubMed] [Google Scholar]
- 26.Pepper MS, Ferrara N, Orci L, Montesano R. Vascular endothelial growth factor (VEGF) induces plasminogen activators and plasminogen activator inhibitor-1 in microvascular endothelial cells. Biochem Biophys Res Commun. 1991 Dec 16;181(2):902–906. doi: 10.1016/0006-291x(91)91276-i. [DOI] [PubMed] [Google Scholar]
- 27.Asahara T, Chen D, Takahashi T, et al. Tie2 receptor ligands, angiopoietin-1 and angiopoietin-2, modulate VEGF-induced postnatal neovascularization. Circ Res. 1998 Aug 10;83(3):233–240. doi: 10.1161/01.res.83.3.233. [DOI] [PubMed] [Google Scholar]
- 28.Brooks PC, Clark RA, Cheresh DA. Requirement of vascular integrin αvβ3 for angiogenesis. Science. 1994 Apr 22;264(5158):569–571. doi: 10.1126/science.7512751. [DOI] [PubMed] [Google Scholar]
- 29.Friedlander M, Brooks PC, Shaffer RW, Kincaid CM, Varner JA, Cheresh DA. Definition of two angiogenic pathways by distinct alpha v integrins. Science. 1995 Dec 1;270(5241):1500–1502. doi: 10.1126/science.270.5241.1500. [DOI] [PubMed] [Google Scholar]
- 30.Sang QX. Complex role of matrix metalloproteinases in angiogenesis. Cell Res. 1998 Sep;8(3):171–177. doi: 10.1038/cr.1998.17. [DOI] [PubMed] [Google Scholar]
- 31.Gamble J, Meyer G, Noack L, et al. B1 integrin activation inhibits in vitro tube formation: effects on cell migration, vacuole coalescence and lumen formation. Endothelium. 1999;7(1):23–34. doi: 10.3109/10623329909165309. [DOI] [PubMed] [Google Scholar]
- 32.Nakao N, Miura K, Takayasu Y, Wada Y, Miura T. CT angiography in hepatocellular carcinoma. J Comput Assist Tomogr. 1983 Oct;7(5):780–787. doi: 10.1097/00004728-198310000-00005. [DOI] [PubMed] [Google Scholar]
- 33.Less JR, Skalak TC, Sevick EM, Jain RK. Microvascular architecture in a mammary carcinoma: branching patterns and vessel dimensions. Cancer Res. 1991 Jan 1;51(1):265–273. [PubMed] [Google Scholar]
- 34.Konerding MA, Miodonski AJ, Lametschwandtner A. Microvascular corrosion casting in the study of tumor vascularity: a review. Scanning Microsc. 1995;9(4):1233–1243. discussion 1243–1234. [PubMed] [Google Scholar]
- 35.Schlingemann RO, Rietveld FJ, Kwaspen F, van de Kerkhof PC, de Waal RM, Ruiter DJ. Differential expression of markers for endothelial cells, pericytes, and basal lamina in the microvasculature of tumors and granulation tissue. Am J Pathol. 1991 Jun;138(6):1335–1347. [PMC free article] [PubMed] [Google Scholar]
- 36.Miettinen M, Lindenmayer AE, Chaubal A. Endothelial cell markers CD31, CD34, and BNH9 antibody to H- and Y-antigens--evaluation of their specificity and sensitivity in the diagnosis of vascular tumors and comparison with von Willebrand factor. Mod Pathol. 1994 Jan;7(1):82–90. [PubMed] [Google Scholar]
- 37.Schlaeger TM, Bartunkova S, Lawitts JA, et al. Uniform vascular-endothelial-cell-specific gene expression in both embryonic and adult transgenic mice. Proc Natl Acad Sci USA. 1997 Apr 1;94(7):3058–3063. doi: 10.1073/pnas.94.7.3058. [DOI] [PMC free article] [PubMed] [Google Scholar]
- 38.Motoike T, Loughna S, Perens E, et al. Universal GFP reporter for the study of vascular development. Genesis. 2000 Oct;28(2):75–81. doi: 10.1002/1526-968x(200010)28:2<75::aid-gene50>3.0.co;2-s. [DOI] [PubMed] [Google Scholar]
- 39.Trotter MJ, Olive PL, Chaplin DJ. Effect of vascular marker Hoechst 33342 on tumour perfusion and cardiovascular function in the mouse. Br J Cancer. 1990 Dec;62(6):903–908. doi: 10.1038/bjc.1990.406. [DOI] [PMC free article] [PubMed] [Google Scholar]
- 40.Hashizume H, Baluk P, Morikawa S, et al. Openings between defective endothelial cells explain tumor vessel leakiness. Am J Pathol. 2000 Apr;156(4):1363–1380. doi: 10.1016/S0002-9440(10)65006-7. [DOI] [PMC free article] [PubMed] [Google Scholar]
- 41.Usami N, Iwano S, Yokoi K. Solitary fibrous tumor of the pleura: evaluation of the origin with 3D CT angiography. J Thorac Oncol. 2007 Dec;2(12):1124–1125. doi: 10.1097/JTO.0b013e31815ba277. [DOI] [PubMed] [Google Scholar]
- 42.McDonald DM, Choyke PL. Imaging of angiogenesis: from microscope to clinic. Nat Med. 2003 Jun;9(6):713–725. doi: 10.1038/nm0603-713. [DOI] [PubMed] [Google Scholar]
- 43.van Vliet M, van Dijke CF, Wielopolski PA, et al. MR angiography of tumor-related vasculature: from the clinic to the micro-environment. Radiographics. 2005 Oct;25(Suppl 1):S85–97. doi: 10.1148/rg.25si055512. discussion S97–88. [DOI] [PubMed] [Google Scholar]
- 44.Boudghene FP, Gouny P, Tassart M, Callard P, Le Breton C, Vayssairat M. Subungual glomus tumor: combined use of MRI and three-dimensional contrast MR angiography. J Magn Reson Imaging. 1998 Nov–Dec;8(6):1326–1328. doi: 10.1002/jmri.1880080621. [DOI] [PubMed] [Google Scholar]
- 45.Foster FS, Burns PN, Simpson DH, Wilson SR, Christopher DA, Goertz DE. Ultrasound for the visualization and quantification of tumor microcirculation. Cancer Metastasis Rev. 2000;19(1–2):131–138. doi: 10.1023/a:1026541510549. [DOI] [PubMed] [Google Scholar]
- 46.Jiang Y, Zhao J, White DL, Genant HK. Micro CT and Micro MR imaging of 3D architecture of animal skeleton. J Musculoskelet Neuronal Interact. 2000 Sep;1(1):45–51. [PubMed] [Google Scholar]
- 47.Tozer GM, Ameer-Beg SM, Baker J, et al. Intravital imaging of tumour vascular networks using multi-photon fluorescence microscopy. Adv Drug Deliv Rev. 2005 Jan 2;57(1):135–152. doi: 10.1016/j.addr.2004.07.015. [DOI] [PubMed] [Google Scholar]
- 48.Galbraith SM. Antivascular cancer treatments: imaging biomarkers in pharmaceutical drug development. Br J Radiol. 2003;76:S83–86. doi: 10.1259/bjr/15255885. Spec No 1. [DOI] [PubMed] [Google Scholar]
- 49.Choyke PL, Dwyer AJ, Knopp MV. Functional tumor imaging with dynamic contrast-enhanced magnetic resonance imaging. J Magn Reson Imaging. 2003 May;17(5):509–520. doi: 10.1002/jmri.10304. [DOI] [PubMed] [Google Scholar]
- 50.O’Connor JP, Jackson A, Parker GJ, Jayson GC. DCE-MRI biomarkers in the clinical evaluation of antiangiogenic and vascular disrupting agents. Br J Cancer. 2007 Jan 29;96(2):189–195. doi: 10.1038/sj.bjc.6603515. [DOI] [PMC free article] [PubMed] [Google Scholar]
- 51.Zhang C, Jugold M, Woenne EC, et al. Specific targeting of tumor angiogenesis by RGD-conjugated ultrasmall superparamagnetic iron oxide particles using a clinical 1.5-T magnetic resonance scanner. Cancer Res. 2007 Feb 15;67(4):1555–1562. doi: 10.1158/0008-5472.CAN-06-1668. [DOI] [PubMed] [Google Scholar]
- 52.Liu G, Rugo HS, Wilding G, et al. Dynamic contrast-enhanced magnetic resonance imaging as a pharmacodynamic measure of response after acute dosing of AG-013736, an oral angiogenesis inhibitor, in patients with advanced solid tumors: results from a phase I study. J Clin Oncol. 2005 Aug 20;23(24):5464–5473. doi: 10.1200/JCO.2005.04.143. [DOI] [PubMed] [Google Scholar]
- 53.Thomas AL, Morgan B, Horsfield MA, et al. Phase I study of the safety, tolerability, pharmacokinetics, and pharmacodynamics of PTK787/ZK 222584 administered twice daily in patients with advanced cancer. J Clin Oncol. 2005 Jun 20;23(18):4162–4171. doi: 10.1200/JCO.2005.09.034. [DOI] [PubMed] [Google Scholar]
- 54.Medved M, Karczmar G, Yang C, et al. Semiquantitative analysis of dynamic contrast enhanced MRI in cancer patients: Variability and changes in tumor tissue over time. J Magn Reson Imaging. 2004 Jul;20(1):122–128. doi: 10.1002/jmri.20061. [DOI] [PubMed] [Google Scholar]
- 55.Padhani AR. MRI for assessing antivascular cancer treatments. Br J Radiol. 2003;76(Spec No 1):S60–80. doi: 10.1259/bjr/15334380. [DOI] [PubMed] [Google Scholar]
- 56.Marzola P, Degrassi A, Calderan L, et al. In vivo assessment of antiangiogenic activity of SU6668 in an experimental colon carcinoma model. Clin Cancer Res. 2004 Jan 15;10(2):739–750. doi: 10.1158/1078-0432.ccr-0828-03. [DOI] [PubMed] [Google Scholar]
- 57.Faccioli N, Marzola P, Boschi F, Sbarbati A, D’Onofrio M, Pozzi Mucelli R. Pathological animal models in the experimental evaluation of tumour microvasculature with magnetic resonance imaging. Radiol Med (Torino) 2007 Apr;112(3):319–328. doi: 10.1007/s11547-007-0144-6. [DOI] [PubMed] [Google Scholar]
- 58.Williams DS. Quantitative perfusion imaging using arterial spin labeling. Methods Mol Med. 2006;124:151–173. doi: 10.1385/1-59745-010-3:151. [DOI] [PubMed] [Google Scholar]
- 59.Liu TT, Brown GG. Measurement of cerebral perfusion with arterial spin labeling: Part 1. Methods. J Int Neuropsychol Soc. 2007 May;13(3):517–525. doi: 10.1017/S1355617707070646. [DOI] [PubMed] [Google Scholar]
- 60.Wolf RL, Detre JA. Clinical neuroimaging using arterial spin-labeled perfusion magnetic resonance imaging. Neurotherapeutics. 2007 Jul;4(3):346–359. doi: 10.1016/j.nurt.2007.04.005. [DOI] [PMC free article] [PubMed] [Google Scholar]
- 61.Hsu YY, Chang CN, Jung SM, et al. Blood oxygenation level-dependent MRI of cerebral gliomas during breath holding. J Magn Reson Imaging. 2004 Feb;19(2):160–167. doi: 10.1002/jmri.10447. [DOI] [PubMed] [Google Scholar]
- 62.Baudelet C, Cron GO, Gallez B. Determination of the maturity and functionality of tumor vasculature by MRI: correlation between BOLD-MRI and DCE-MRI using P792 in experimental fibrosarcoma tumors. Magn Reson Med. 2006 Nov;56(5):1041–1049. doi: 10.1002/mrm.21047. [DOI] [PubMed] [Google Scholar]
- 63.Fleischer AC, Wojcicki WE, Donnelly EF, et al. Quantified color Doppler sonography of tumor vascularity in an animal model. J Ultrasound Med. 1999 Aug;18(8):547–551. doi: 10.7863/jum.1999.18.8.547. [DOI] [PubMed] [Google Scholar]
- 64.Forsberg F, Ro RJ, Potoczek M, et al. Assessment of angiogenesis: implications for ultrasound imaging. Ultrasonics. 2004 Apr;42(1–9):325–330. doi: 10.1016/j.ultras.2003.12.026. [DOI] [PubMed] [Google Scholar]
- 65.Drevs J, Hofmann I, Hugenschmidt H, et al. Effects of PTK787/ZK 222584, a specific inhibitor of vascular endothelial growth factor receptor tyrosine kinases, on primary tumor, metastasis, vessel density, and blood flow in a murine renal cell carcinoma model. Cancer Res. 2000 Sep 1;60(17):4819–4824. [PubMed] [Google Scholar]
- 66.Liang JD, Yang PM, Liang PC, Huang GT, Sheu JC, Chen DS. Three-dimensional power Doppler ultrasonography for demonstrating associated arteries of hepatocellular carcinoma. J Formos Med Assoc. 2003 Jun;102(6):367–374. [PubMed] [Google Scholar]
- 67.Stride E, Saffari N. Microbubble ultrasound contrast agents: a review. Proc Inst Mech Eng [H] 2003;217(6):429–447. doi: 10.1243/09544110360729072. [DOI] [PubMed] [Google Scholar]
- 68.Niermann KJ, Fleischer AC, Huamani J, et al. Measuring tumor perfusion in control and treated murine tumors: correlation of microbubble contrast-enhanced sonography to dynamic contrast-enhanced magnetic resonance imaging and fluorodeoxyglucose positron emission tomography. J Ultrasound Med. 2007 Jun;26(6):749–756. doi: 10.7863/jum.2007.26.6.749. [DOI] [PubMed] [Google Scholar]
- 69.Wilson SR, Burns PN, Muradali D, Wilson JA, Lai X. Harmonic hepatic US with microbubble contrast agent: initial experience showing improved characterization of hemangioma, hepatocellular carcinoma, and metastasis. Radiology. 2000 Apr;215(1):153–161. doi: 10.1148/radiology.215.1.r00ap08153. [DOI] [PubMed] [Google Scholar]
- 70.Burns PN, Wilson SR, Simpson DH. Pulse inversion imaging of liver blood flow: improved method for characterizing focal masses with microbubble contrast. Invest Radiol. 2000 Jan;35(1):58–71. doi: 10.1097/00004424-200001000-00007. [DOI] [PubMed] [Google Scholar]
- 71.Quaia E. Microbubble ultrasound contrast agents: an update. Eur Radiol. 2007 Aug;17(8):1995–2008. doi: 10.1007/s00330-007-0623-0. [DOI] [PubMed] [Google Scholar]
- 72.Cornud F, Hamida K, Flam T, et al. Endorectal color doppler sonography and endorectal MR imaging features of nonpalpable prostate cancer: correlation with radical prostatectomy findings. AJR Am J Roentgenol. 2000 Oct;175(4):1161–1168. doi: 10.2214/ajr.175.4.1751161. [DOI] [PubMed] [Google Scholar]
- 73.McCarville MB, Streck CJ, Dickson PV, Li CS, Nathwani AC, Davidoff AM. Angiogenesis inhibitors in a murine neuroblastoma model: quantitative assessment of intratumoral blood flow with contrast-enhanced gray-scale US. Radiology. 2006 Jul;240(1):73–81. doi: 10.1148/radiol.2401050709. [DOI] [PubMed] [Google Scholar]
- 74.Stieger SM, Bloch SH, Foreman O, Wisner ER, Ferrara KW, Dayton PA. Ultrasound assessment of angiogenesis in a matrigel model in rats. Ultrasound Med Biol. 2006 May;32(5):673–681. doi: 10.1016/j.ultrasmedbio.2005.12.008. [DOI] [PMC free article] [PubMed] [Google Scholar]
- 75.Ferrara KW, Merritt CR, Burns PN, Foster FS, Mattrey RF, Wickline SA. Evaluation of tumor angiogenesis with US: imaging, Doppler, and contrast agents. Acad Radiol. 2000 Oct;7(10):824–839. doi: 10.1016/s1076-6332(00)80631-5. [DOI] [PubMed] [Google Scholar]
- 76.Hughes MS, Marsh JN, Zhang H, et al. Characterization of digital waveforms using thermodynamic analogs: detection of contrast-targeted tissue in vivo. IEEE Trans Ultrason Ferroelectr Freq Control. 2006 Sep;53(9):1609–1616. doi: 10.1109/tuffc.2006.1678189. [DOI] [PubMed] [Google Scholar]
- 77.Lassau N, Lamuraglia M, Chami L, et al. Gastrointestinal stromal tumors treated with imatinib: monitoring response with contrast-enhanced sonography. AJR Am J Roentgenol. 2006 Nov;187(5):1267–1273. doi: 10.2214/AJR.05.1192. [DOI] [PubMed] [Google Scholar]
- 78.Li PC, Yang MJ. Transfer function analysis of ultrasonic time-intensity measurements. Ultrasound Med Biol. 2003 Oct;29(10):1493–1500. doi: 10.1016/s0301-5629(03)00968-2. [DOI] [PubMed] [Google Scholar]
- 79.Lavisse S, Lejeune P, Rouffiac V, et al. Early quantitative evaluation of a tumor vasculature disruptive agent AVE8062 using dynamic contrast-enhanced ultrasonography. Invest Radiol. 2008 Feb;43(2):100–111. doi: 10.1097/RLI.0b013e3181577cfc. [DOI] [PubMed] [Google Scholar]
- 80.Haider MA, Milosevic M, Fyles A, et al. Assessment of the tumor microenvironment in cervix cancer using dynamic contrast enhanced CT, interstitial fluid pressure and oxygen measurements. Int J Radiat Oncol Biol Phys. 2005 Jul 15;62(4):1100–1107. doi: 10.1016/j.ijrobp.2004.12.064. [DOI] [PubMed] [Google Scholar]
- 81.Bisdas S, Konstantinou GN, Lee PS, et al. Dynamic contrast-enhanced CT of head and neck tumors: perfusion measurements using a distributed-parameter tracer kinetic model. Initial results and comparison with deconvolution-based analysis. Phys Med Biol. 2007 Oct 21;52(20):6181–6196. doi: 10.1088/0031-9155/52/20/007. [DOI] [PubMed] [Google Scholar]
- 82.Larson DR, Zipfel WR, Williams RM, et al. Water-soluble quantum dots for multiphoton fluorescence imaging in vivo. Science. 2003 May 30;300(5624):1434–1436. doi: 10.1126/science.1083780. [DOI] [PubMed] [Google Scholar]
- 83.Brown EB, Campbell RB, Tsuzuki Y, et al. In vivo measurement of gene expression, angiogenesis and physiological function in tumors using multiphoton laser scanning microscopy. Nat Med. 2001 Jul;7(7):864–868. doi: 10.1038/89997. [DOI] [PubMed] [Google Scholar]
- 84.Montet X, Ntziachristos V, Grimm J, Weissleder R. Tomographic fluorescence mapping of tumor targets. Cancer Res. 2005 Jul 15;65(14):6330–6336. doi: 10.1158/0008-5472.CAN-05-0382. [DOI] [PubMed] [Google Scholar]
- 85.Jones T. The imaging science of positron emission tomography. Eur J Nucl Med. 1996 Jul;23(7):807–813. doi: 10.1007/BF00843711. [DOI] [PubMed] [Google Scholar]
- 86.Laking GR, Price PM. Positron emission tomographic imaging of angiogenesis and vascular function. Br J Radiol. 2003;76:S50–59. doi: 10.1259/bjr/30399077. Spec No 1. [DOI] [PubMed] [Google Scholar]
- 87.Phelps ME, Hoffman EJ, Mullani NA, Ter-Pogossian MM. Application of annihilation coincidence detection to transaxial reconstruction tomography. J Nucl Med. 1975 Mar;16(3):210–224. [PubMed] [Google Scholar]
- 88.Phelps ME. PET: the merging of biology and imaging into molecular imaging. J Nucl Med. 2000 Apr;41(4):661–681. [PubMed] [Google Scholar]
- 89.Willmann JK, van Bruggen N, Dinkelborg LM, Gambhir SS. Molecular imaging in drug development. Nat Rev Drug Discov. 2008 Jul;7(7):591–607. doi: 10.1038/nrd2290. [DOI] [PubMed] [Google Scholar]
- 90.Beyer T, Townsend DW, Brun T, et al. A combined PET/CT scanner for clinical oncology. J Nucl Med. 2000 Aug;41(8):1369–1379. [PubMed] [Google Scholar]
- 91.Kamel E, Hany TF, Burger C, et al. CT vs 68Ge attenuation correction in a combined PET/CT system: evaluation of the effect of lowering the CT tube current. Eur J Nucl Med Mol Imaging. 2002 Mar;29(3):346–350. doi: 10.1007/s00259-001-0698-9. [DOI] [PubMed] [Google Scholar]
- 92.Cherry SR, Shao Y, Silverman RW, et al. MicroPET: a high resolution PET scanner for imaging small animals. IEEE Trans Nucl Sci. 1997;44(3):1161–1166. [Google Scholar]
- 93.Chatziioannou AF, Cherry SR, Shao Y, et al. Performance evaluation of microPET: a high-resolution lutetium oxyorthosilicate PET scanner for animal imaging. J Nucl Med. 1999 Jul;40(7):1164–1175. [PMC free article] [PubMed] [Google Scholar]
- 94.Pichler BJ, Judenhofer MS, Pfannenberg C. Multimodal imaging approaches: PET/CT and PET/MRI. Handb Exp Pharmacol. 2008;(185 Pt 1):109–132. doi: 10.1007/978-3-540-72718-7_6. [DOI] [PubMed] [Google Scholar]
- 95.Laking GR, West C, Buckley DL, Matthews J, Price PM. Imaging vascular physiology to monitor cancer treatment. Crit Rev Oncol Hematol. 2006 May;58(2):95–113. doi: 10.1016/j.critrevonc.2005.10.006. [DOI] [PubMed] [Google Scholar]
- 96.Anderson RE. Cerebral blood flow xenon-133. Neurosurg Clin N Am. 1996 Oct;7(4):703–708. [PubMed] [Google Scholar]
- 97.Wilson RA, Shea MJ, De Landsheere CM, et al. Validation of quantitation of regional myocardial blood flow in vivo with 11C-labeled human albumin microspheres and positron emission tomography. Circulation. 1984 Oct;70(4):717–723. doi: 10.1161/01.cir.70.4.717. [DOI] [PubMed] [Google Scholar]
- 98.Mullani N, Herbst R, Abbruzzese J, et al. 9:30–9:45. First pass FDG measured blood flow in tumors: A comparison with O-15 labeled water measured blood flow. Clin Positron Imaging. 2000 Jul;3(4):153. doi: 10.1016/s1095-0397(00)00065-0. [DOI] [PubMed] [Google Scholar]
- 99.Dimitrakopoulou-Strauss A, Strauss LG, Burger C. Quantitative PET studies in pretreated melanoma patients: a comparison of 6-[18F]fluoro-L-dopa with 18F-FDG and 15O-water using compartment and noncompartment analysis. J Nucl Med. 2001 Feb;42(2):248–256. [PubMed] [Google Scholar]
- 100.Acierno LJ. Adolph Fick: mathematician, physicist, physiologist. Clin Cardiol. 2000 May;23(5):390–391. doi: 10.1002/clc.4960230519. [DOI] [PMC free article] [PubMed] [Google Scholar]
- 101.Lammertsma AA, Jones T. Low oxygen extraction fraction in tumours measured with the oxygen-15 steady state technique: effect of tissue heterogeneity. Br J Radiol. 1992 Aug;65(776):697–700. doi: 10.1259/0007-1285-65-776-697. [DOI] [PubMed] [Google Scholar]
- 102.Wilson CB, Lammertsma AA, McKenzie CG, Sikora K, Jones T. Measurements of blood flow and exchanging water space in breast tumors using positron emission tomography: a rapid and noninvasive dynamic method. Cancer Res. 1992 Mar 15;52(6):1592–1597. [PubMed] [Google Scholar]
- 103.Anderson H, Price P. Clinical measurement of blood flow in tumours using positron emission tomography: a review. Nucl Med Commun. 2002 Feb;23(2):131–138. doi: 10.1097/00006231-200202000-00004. [DOI] [PubMed] [Google Scholar]
- 104.Tseng J, Dunnwald LK, Schubert EK, et al. 18F-FDG kinetics in locally advanced breast cancer: correlation with tumor blood flow and changes in response to neoadjuvant chemotherapy. J Nucl Med. 2004 Nov;45(11):1829–1837. [PubMed] [Google Scholar]
- 105.Hoffend J, Mier W, Schuhmacher J, et al. Gallium-68-DOTA-albumin as a PET blood-pool marker: experimental evaluation in vivo. Nucl Med Biol. 2005 Apr;32(3):287–292. doi: 10.1016/j.nucmedbio.2005.01.002. [DOI] [PubMed] [Google Scholar]
- 106.Sipkins DA, Cheresh DA, Kazemi MR, Nevin LM, Bednarski MD, Li KC. Detection of tumor angiogenesis in vivo by alphaVbeta3-targeted magnetic resonance imaging. Nat Med. 1998 May;4(5):623–626. doi: 10.1038/nm0598-623. [DOI] [PubMed] [Google Scholar]
- 107.Wierzbicka-Patynowski I, Niewiarowski S, Marcinkiewicz C, Calvete JJ, Marcinkiewicz MM, McLane MA. Structural Requirements of Echistatin for the Recognition of alpha vbeta 3 and alpha 5beta 1 Integrins. J Biol Chem. 1999 December 31;274(53):37809–37814. doi: 10.1074/jbc.274.53.37809. [DOI] [PubMed] [Google Scholar]
- 108.Cai W, Shin DW, Chen K, et al. Peptide-labeled near-infrared quantum dots for imaging tumor vasculature in living subjects. Nano Lett. 2006 Apr;6(4):669–676. doi: 10.1021/nl052405t. [DOI] [PubMed] [Google Scholar]
- 109.Hood JD, Cheresh DA. Role of integrins in cell invasion and migration. Nat Rev Cancer. 2002 Feb;2(2):91–100. doi: 10.1038/nrc727. [DOI] [PubMed] [Google Scholar]
- 110.Chen X. Multimodality imaging of tumor integrin alphavbeta3 expression. Mini Rev Med Chem. 2006 Feb;6(2):227–234. doi: 10.2174/138955706775475975. [DOI] [PubMed] [Google Scholar]
- 111.Hynes RO. Integrins: bidirectional, allosteric signaling machines. Cell. 2002 Sep 20;110(6):673–687. doi: 10.1016/s0092-8674(02)00971-6. [DOI] [PubMed] [Google Scholar]
- 112.Xiong JP, Stehle T, Zhang R, et al. Crystal structure of the extracellular segment of integrin αvβ3 in complex with an Arg-Gly-Asp ligand. Science. 2002 Apr 5;296(5565):151–155. doi: 10.1126/science.1069040. [DOI] [PubMed] [Google Scholar]
- 113.Ruoslahti E, Pierschbacher MD. New perspectives in cell adhesion: RGD and integrins. Science. 1987 Oct 23;238(4826):491–497. doi: 10.1126/science.2821619. [DOI] [PubMed] [Google Scholar]
- 114.Jin H, Varner J. Integrins: roles in cancer development and as treatment targets. Br J Cancer. 2004;90(3):561–565. doi: 10.1038/sj.bjc.6601576. [DOI] [PMC free article] [PubMed] [Google Scholar]
- 115.Mizejewski GJ. Role of integrins in cancer: survey of expression patterns (44435) Proc Soc Exp Biol Med. 1999;222(2):124–138. doi: 10.1177/153537029922200203. [DOI] [PubMed] [Google Scholar]
- 116.Cai W, Chen X. Anti-angiogenic cancer therapy based on integrin αvβ3 antagonism. Anti-Cancer Agents Med Chem. 2006;6:407–428. doi: 10.2174/187152006778226530. [DOI] [PubMed] [Google Scholar]
- 117.Brooks PC, Stromblad S, Sanders LC, et al. Localization of matrix metalloproteinase MMP-2 to the surface of invasive cells by interaction with integrin αvβ3. Cell. 1996 May 31;85(5):683–693. doi: 10.1016/s0092-8674(00)81235-0. [DOI] [PubMed] [Google Scholar]
- 118.Yang JT, Rayburn H, Hynes RO. Embryonic mesodermal defects in α5 integrin-deficient mice. Development. 1993;119(4):1093–1105. doi: 10.1242/dev.119.4.1093. [DOI] [PubMed] [Google Scholar]
- 119.Goh KL, Yang JT, Hynes RO. Mesodermal defects and cranial neural crest apoptosis in α5 integrin-null embryos. Development. 1997;124(21):4309–4319. doi: 10.1242/dev.124.21.4309. [DOI] [PubMed] [Google Scholar]
- 120.Taverna D, Hynes RO. Reduced blood vessel formation and tumor growth in α5-integrin-negative teratocarcinomas and embryoid bodies. Cancer Res. 2001;61(13):5255–5261. [PubMed] [Google Scholar]
- 121.Yang JT, Rayburn H, Hynes RO. Cell adhesion events mediated by α4 integrins are essential in placental and cardiac development. Development. 1995;121(2):549–560. doi: 10.1242/dev.121.2.549. [DOI] [PubMed] [Google Scholar]
- 122.Aumailley M, Gurrath M, Muller G, Calvete J, Timpl R, Kessler H. Arg-Gly-Asp constrained within cyclic pentapeptides. Strong and selective inhibitors of cell adhesion to vitronectin and laminin fragment P1. FEBS Lett. 1991 Oct 7;291(1):50–54. doi: 10.1016/0014-5793(91)81101-d. [DOI] [PubMed] [Google Scholar]
- 123.Haubner R, Finsinger D, Kessler H. Stereoisomeric peptide libraries and peptidomimetics for designing selective inhibitors of the αvβ3 integrin for a new cancer therapy. Angew Chem Int Ed Engl. 1997;36:1374–1389. [Google Scholar]
- 124.Haubner R, Wester HJ, Reuning U, et al. Radiolabeled alpha(v)beta3 integrin antagonists: a new class of tracers for tumor targeting. J Nucl Med. 1999 Jun;40(6):1061–1071. [PubMed] [Google Scholar]
- 125.Haubner R, Wester HJ, Weber WA, et al. Noninvasive imaging of alpha(v)beta3 integrin expression using 18F-labeled RGD-containing glycopeptide and positron emission tomography. Cancer Res. 2001 Mar 1;61(5):1781–1785. [PubMed] [Google Scholar]
- 126.Haubner R. Alphavbeta3-integrin imaging: a new approach to characterise angiogenesis? Eur J Nucl Med Mol Imaging. 2006 Jul;33 (Suppl 1):54–63. doi: 10.1007/s00259-006-0136-0. [DOI] [PubMed] [Google Scholar]
- 127.Harris JM, Martin NE, Modi M. Pegylation: a novel process for modifying pharmacokinetics. Clin Pharmacokinet. 2001;40(7):539–551. doi: 10.2165/00003088-200140070-00005. [DOI] [PubMed] [Google Scholar]
- 128.Chen X, Park R, Shahinian AH, Bading JR, Conti PS. Pharmacokinetics and tumor retention of 125I-labeled RGD peptide are improved by PEGylation. Nucl Med Biol. 2004 Jan;31(1):11–19. doi: 10.1016/j.nucmedbio.2003.07.003. [DOI] [PubMed] [Google Scholar]
- 129.Noiri E, Goligorsky MS, Wang GJ, et al. Biodistribution and clearance of 99mTc-labeled Arg-Gly-Asp (RGD) peptide in rats with ischemic acute renal failure. J Am Soc Nephrol. 1996 Dec;7(12):2682–2688. doi: 10.1681/ASN.V7122682. [DOI] [PubMed] [Google Scholar]
- 130.Chen X, Hou Y, Tohme M, et al. Pegylated Arg-Gly-Asp peptide: 64Cu labeling and PET imaging of brain tumor alphavbeta3-integrin expression. J Nucl Med. 2004 Oct;45(10):1776–1783. [PubMed] [Google Scholar]
- 131.Dijkgraaf I, Liu S, Kruijtzer JA, et al. Effects of linker variation on the in vitro and in vivo characteristics of an 111In-labeled RGD peptide. Nucl Med Biol. 2007 Jan;34(1):29–35. doi: 10.1016/j.nucmedbio.2006.10.006. [DOI] [PubMed] [Google Scholar]
- 132.Li ZB, Chen K, Chen X. (68)Ga-labeled multimeric RGD peptides for microPET imaging of integrin alpha(v)beta (3) expression. Eur J Nucl Med Mol Imaging. 2008 Jun;35(6):1100–1108. doi: 10.1007/s00259-007-0692-y. [DOI] [PubMed] [Google Scholar]
- 133.van Hagen PM, Breeman WA, Bernard HF, et al. Evaluation of a radiolabelled cyclic DTPA-RGD analogue for tumour imaging and radionuclide therapy. Int J Cancer. 2000 Aug 20;90(4):186–198. [PubMed] [Google Scholar]
- 134.Bach-Gansmo T, Danielsson R, Saracco A, et al. Integrin receptor imaging of breast cancer: a proof-of-concept study to evaluate 99mTc-NC100692. J Nucl Med. 2006 Sep;47(9):1434–1439. [PubMed] [Google Scholar]
- 135.Haubner R, Wester HJ, Burkhart F, et al. Glycosylated RGD-containing peptides: tracer for tumor targeting and angiogenesis imaging with improved biokinetics. J Nucl Med. 2001 Feb;42(2):326–336. [PubMed] [Google Scholar]
- 136.Haubner R, Kuhnast B, Mang C, et al. [18F]Galacto-RGD: synthesis, radiolabeling, metabolic stability, and radiation dose estimates. Bioconjug Chem. 2004 Jan–Feb;15(1):61–69. doi: 10.1021/bc034170n. [DOI] [PubMed] [Google Scholar]
- 137.Haubner R, Weber WA, Beer AJ, et al. Noninvasive visualization of the activated alphavbeta3 integrin in cancer patients by positron emission tomography and [18F]Galacto-RGD. PLoS Med. 2005 Mar;2(3):e70. doi: 10.1371/journal.pmed.0020070. [DOI] [PMC free article] [PubMed] [Google Scholar]
- 138.Beer AJ, Haubner R, Goebel M, et al. Biodistribution and pharmacokinetics of the alphavbeta3-selective tracer 18F-galacto-RGD in cancer patients. J Nucl Med. 2005 Aug;46(8):1333–1341. [PubMed] [Google Scholar]
- 139.Beer AJ, Haubner R, Wolf I, et al. PET-based human dosimetry of 18F-galacto-RGD, a new radiotracer for imaging alpha v beta3 expression. J Nucl Med. 2006 May;47(5):763–769. [PubMed] [Google Scholar]
- 140.Beer AJ, Haubner R, Sarbia M, et al. Positron emission tomography using [18F]Galacto-RGD identifies the level of integrin alpha(v)beta3 expression in man. Clin Cancer Res. 2006 Jul 1;12(13):3942–3949. doi: 10.1158/1078-0432.CCR-06-0266. [DOI] [PubMed] [Google Scholar]
- 141.Beer AJ, Grosu AL, Carlsen J, et al. [18F]galacto-RGD positron emission tomography for imaging of alphavbeta3 expression on the neovasculature in patients with squamous cell carcinoma of the head and neck. Clin Cancer Res. 2007 Nov 15;13(22 Pt 1):6610–6616. doi: 10.1158/1078-0432.CCR-07-0528. [DOI] [PubMed] [Google Scholar]
- 142.Beer AJ, Lorenzen S, Metz S, et al. Comparison of integrin alphaVbeta3 expression and glucose metabolism in primary and metastatic lesions in cancer patients: a PET study using 18F-galacto-RGD and 18F-FDG. J Nucl Med. 2008 Jan;49(1):22–29. doi: 10.2967/jnumed.107.045864. [DOI] [PubMed] [Google Scholar]
- 143.Boturyn D, Coll JL, Garanger E, Favrot MC, Dumy P. Template assembled cyclopeptides as multimeric system for integrin targeting and endocytosis. J Am Chem Soc. 2004 May 12;126(18):5730–5739. doi: 10.1021/ja049926n. [DOI] [PubMed] [Google Scholar]
- 144.Chen X, Tohme M, Park R, Hou Y, Bading JR, Conti PS. Micro-PET imaging of alphavbeta3-integrin expression with 18F-labeled dimeric RGD peptide. Mol Imaging. 2004 Apr;3(2):96–104. doi: 10.1162/15353500200404109. [DOI] [PubMed] [Google Scholar]
- 145.Zhang X, Xiong Z, Wu Y, et al. Quantitative PET imaging of tumor integrin alphavbeta3 expression with 18F-FRGD2. J Nucl Med. 2006 Jan;47(1):113–121. [PMC free article] [PubMed] [Google Scholar]
- 146.Chen X, Park R, Tohme M, Shahinian AH, Bading JR, Conti PS. MicroPET and autoradiographic imaging of breast cancer alpha v-integrin expression using 18F- and 64Cu-labeled RGD peptide. Bioconjug Chem. 2004 Jan–Feb;15(1):41–49. doi: 10.1021/bc0300403. [DOI] [PubMed] [Google Scholar]
- 147.Chen X, Liu S, Hou Y, et al. MicroPET imaging of breast cancer alphav-integrin expression with 64Cu-labeled dimeric RGD peptides. Mol Imaging Biol. 2004 Sep–Oct;6(5):350–359. doi: 10.1016/j.mibio.2004.06.004. [DOI] [PubMed] [Google Scholar]
- 148.Wu Z, Li ZB, Chen K, et al. microPET of tumor integrin alphavbeta3 expression using 18F-labeled PEGylated tetrameric RGD peptide (18F-FPRGD4) J Nucl Med. 2007 Sep;48(9):1536–1544. doi: 10.2967/jnumed.107.040816. [DOI] [PMC free article] [PubMed] [Google Scholar]
- 149.Li ZB, Cai W, Cao Q, et al. (64)Cu-labeled tetrameric and octameric RGD peptides for small-animal PET of tumor alpha(v)beta(3) integrin expression. J Nucl Med. 2007 Jul;48(7):1162–1171. doi: 10.2967/jnumed.107.039859. [DOI] [PubMed] [Google Scholar]
- 150.Thumshirn G, Hersel U, Goodman SL, Kessler H. Multimeric cyclic RGD peptides as potential tools for tumor targeting: solid-phase peptide synthesis and chemoselective oxime ligation. Chemistry. 2003 Jun 16;9(12):2717–2725. doi: 10.1002/chem.200204304. [DOI] [PubMed] [Google Scholar]
- 151.Poethko T, Schottelius M, Thumshirn G, et al. Two-step methodology for high-yield routine radiohalogenation of peptides: (18)F-labeled RGD and octreotide analogs. J Nucl Med. 2004 May;45(5):892–902. [PubMed] [Google Scholar]
- 152.Cai W, Wu Y, Chen K, Cao Q, Tice DA, Chen X. In vitro and in vivo characterization of 64Cu-labeled AbegrinTM, a humanized monoclonal antibody against integrin avb3. Cancer Res. 2006;66(19):9673–9681. doi: 10.1158/0008-5472.CAN-06-1480. [DOI] [PubMed] [Google Scholar]
- 153.Higuchi T, Bengel FM, Seidl S, et al. Assessment of alphavbeta3 integrin expression after myocardial infarction by positron emission tomography. Cardiovasc Res. 2008 May 1;78(2):395–403. doi: 10.1093/cvr/cvn033. [DOI] [PubMed] [Google Scholar]
- 154.Ferrara N. VEGF and the quest for tumour angiogenesis factors. Nat Rev Cancer. 2002 Oct;2(10):795–803. doi: 10.1038/nrc909. [DOI] [PubMed] [Google Scholar]
- 155.Broumas AR, Pollard RE, Bloch SH, Wisner ER, Griffey S, Ferrara KW. Contrast-enhanced computed tomography and ultrasound for the evaluation of tumor blood flow. Invest Radiol. 2005 Mar;40(3):134–147. doi: 10.1097/01.rli.0000152833.35744.7f. [DOI] [PMC free article] [PubMed] [Google Scholar]
- 156.Hicklin DJ, Ellis LM. Role of the vascular endothelial growth factor pathway in tumor growth and angiogenesis. J Clin Oncol. 2005 Feb 10;23(5):1011–1027. doi: 10.1200/JCO.2005.06.081. [DOI] [PubMed] [Google Scholar]
- 157.Sun J, Wang DA, Jain RK, et al. Inhibiting angiogenesis and tumorigenesis by a synthetic molecule that blocks binding of both VEGF and PDGF to their receptors. Oncogene. 2005 Jul 7;24(29):4701–4709. doi: 10.1038/sj.onc.1208391. [DOI] [PubMed] [Google Scholar]
- 158.Watanabe H, Mamelak AJ, Wang B, et al. Anti-vascular endothelial growth factor receptor-2 (Flk-1/KDR) antibody suppresses contact hypersensitivity. Exp Dermatol. 2004 Nov;13(11):671–681. doi: 10.1111/j.0906-6705.2004.00240.x. [DOI] [PubMed] [Google Scholar]
- 159.Prewett M, Huber J, Li Y, et al. Antivascular endothelial growth factor receptor (fetal liver kinase 1) monoclonal antibody inhibits tumor angiogenesis and growth of several mouse and human tumors. Cancer Res. 1999 Oct 15;59(20):5209–5218. [PubMed] [Google Scholar]
- 160.Ciardiello F, Caputo R, Damiano V, et al. Antitumor effects of ZD6474, a small molecule vascular endothelial growth factor receptor tyrosine kinase inhibitor, with additional activity against epidermal growth factor receptor tyrosine kinase. Clin Cancer Res. 2003 Apr;9(4):1546–1556. [PubMed] [Google Scholar]
- 161.Wedge SR, Ogilvie DJ, Dukes M, et al. ZD4190: an orally active inhibitor of vascular endothelial growth factor signaling with broad-spectrum antitumor efficacy. Cancer Res. 2000 Feb 15;60(4):970–975. [PubMed] [Google Scholar]
- 162.Kennedy JE, ter Haar GR, Wu F, et al. Contrast-enhanced ultrasound assessment of tissue response to high-intensity focused ultrasound. Ultrasound Med Biol. 2004 Jun;30(6):851–854. doi: 10.1016/j.ultrasmedbio.2004.03.011. [DOI] [PubMed] [Google Scholar]
- 163.Cai W, Chen X. Multimodality imaging of vascular endothelial growth factor and vascular endothelial growth factor receptor expression. Front Biosci. 2007;12:4267–4279. doi: 10.2741/2386. [DOI] [PubMed] [Google Scholar]
- 164.Nagengast WB, de Vries EG, Hospers GA, et al. In vivo VEGF imaging with radiolabeled bevacizumab in a human ovarian tumor xenograft. J Nucl Med. 2007 Aug;48(8):1313–1319. doi: 10.2967/jnumed.107.041301. [DOI] [PubMed] [Google Scholar]
- 165.Collingridge DR, Carroll VA, Glaser M, et al. The development of [124I]iodinated-VG76e: a novel tracer for imaging vascular endothelial growth factor in vivo using positron emission tomography. Cancer Res. 2002 Oct 15;62(20):5912–5919. [PubMed] [Google Scholar]
- 166.Jayson GC, Zweit J, Jackson A, et al. Molecular imaging and biological evaluation of HuMV833 anti-VEGF antibody: implications for trial design of antiangiogenic antibodies. J Natl Cancer Inst. 2002 Oct 2;94(19):1484–1493. doi: 10.1093/jnci/94.19.1484. [DOI] [PubMed] [Google Scholar]
- 167.Scheer MG, Stollman TH, Boerman OC, et al. Imaging liver metastases of colorectal cancer patients with radiolabelled bevacizumab: Lack of correlation with VEGF-A expression. Eur J Cancer. 2008 Sep;44(13):1835–1840. doi: 10.1016/j.ejca.2008.05.026. [DOI] [PubMed] [Google Scholar]
- 168.Strauss LG, Koczan D, Klippel S, et al. Impact of angiogenesis-related gene expression on the tracer kinetics of 18F-FDG in colorectal tumors. J Nucl Med. 2008 Aug;49(8):1238–1244. doi: 10.2967/jnumed.108.051599. [DOI] [PubMed] [Google Scholar]
- 169.Hsu AR, Cai W, Veeravagu A, et al. Multimodality molecular imaging of glioblastoma growth inhibition with vasculature-targeting fusion toxin VEGF121/rGel. J Nucl Med. 2007 Mar;48(3):445–454. [PubMed] [Google Scholar]
- 170.Cai W, Chen K, Mohamedali KA, et al. PET of vascular endothelial growth factor receptor expression. J Nucl Med. 2006;47(12):2048–2056. [PubMed] [Google Scholar]
- 171.Chen K, Cai W, Li ZB, Wang H, Chen X. Quantitative PET Imaging of VEGF Receptor Expression. Mol Imaging Biol. 2008 Sep 11; doi: 10.1007/s11307-008-0172-1. [DOI] [PubMed] [Google Scholar]
- 172.Backer MV, Levashova Z, Patel V, et al. Molecular imaging of VEGF receptors in angiogenic vasculature with single-chain VEGF-based probes. Nat Med. 2007 Apr;13(4):504–509. doi: 10.1038/nm1522. [DOI] [PubMed] [Google Scholar]
- 173.Li J, Brown LF, Hibberd MG, Grossman JD, Morgan JP, Simons M. VEGF, flk-1, and flt-1 expression in a rat myocardial infarction model of angiogenesis. Am J Physiol. 1996 May;270(5 Pt 2):H1803–1811. doi: 10.1152/ajpheart.1996.270.5.H1803. [DOI] [PubMed] [Google Scholar]
- 174.Soeki T, Tamura Y, Shinohara H, Tanaka H, Bando K, Fukuda N. Serial changes in serum VEGF and HGF in patients with acute myocardial infarction. Cardiology. 2000;93(3):168–174. doi: 10.1159/000007022. [DOI] [PubMed] [Google Scholar]
- 175.Rodriguez-Porcel M, Cai W, Gheysens O, et al. Imaging of VEGF receptor in a rat myocardial infarction model using PET. J Nucl Med. 2008 Apr;49(4):667–673. doi: 10.2967/jnumed.107.040576. [DOI] [PMC free article] [PubMed] [Google Scholar]
- 176.Willmann JK, Paulmurugan R, Chen K, et al. Ultrasonic imaging of tumor angiogenesis with contrast microbubbles targeted to vascular endothelial growth factor type 2 receptor. Radiology. 2007 doi: 10.1148/radiol.2462070536. revision. [DOI] [PMC free article] [PubMed] [Google Scholar]
- 177.Cai W, Guzman R, Hsu AR, et al. Positron Emission Tomography Imaging of Poststroke Angiogenesis. Stroke. 2008 Oct 23; doi: 10.1161/STROKEAHA.108.517474. [DOI] [PubMed] [Google Scholar]
- 178.Simon M, Rockl W, Hornig C, et al. Receptors of vascular endothelial growth factor/vascular permeability factor (VEGF/VPF) in fetal and adult human kidney: localization and [125I]VEGF binding sites. J Am Soc Nephrol. 1998 Jun;9(6):1032–1044. doi: 10.1681/ASN.V961032. [DOI] [PubMed] [Google Scholar]
- 179.Keyt BA, Nguyen HV, Berleau LT, et al. Identification of vascular endothelial growth factor determinants for binding KDR and FLT-1 receptors. Generation of receptor-selective VEGF variants by site-directed mutagenesis. J Biol Chem. 1996 Mar 8;271(10):5638–5646. doi: 10.1074/jbc.271.10.5638. [DOI] [PubMed] [Google Scholar]
- 180.Wang H, Cai W, Chen K, et al. A new PET tracer specific for vascular endothelial growth factor receptor 2. Eur J Nucl Med Mol Imaging. 2007 Dec;34(12):2001–2010. doi: 10.1007/s00259-007-0524-0. [DOI] [PubMed] [Google Scholar]
- 181.Wagner S, Breyholz HJ, Faust A, et al. Molecular imaging of matrix metalloproteinases in vivo using small molecule inhibitors for SPECT and PET. Curr Med Chem. 2006;13(23):2819–2838. doi: 10.2174/092986706778522002. [DOI] [PubMed] [Google Scholar]
- 182.Folgueras AR, Pendas AM, Sanchez LM, Lopez-Otin C. Matrix metalloproteinases in cancer: from new functions to improved inhibition strategies. Int J Dev Biol. 2004;48(5–6):411–424. doi: 10.1387/ijdb.041811af. [DOI] [PubMed] [Google Scholar]
- 183.Johnson JL, George SJ, Newby AC, Jackson CL. Divergent effects of matrix metalloproteinases 3, 7, 9, and 12 on atherosclerotic plaque stability in mouse brachiocephalic arteries. Proc Natl Acad Sci U S A. 2005 Oct 25;102(43):15575–15580. doi: 10.1073/pnas.0506201102. [DOI] [PMC free article] [PubMed] [Google Scholar]
- 184.Hidalgo M, Eckhardt SG. Development of matrix metalloproteinase inhibitors in cancer therapy. J Natl Cancer Inst. 2001 Feb 7;93(3):178–193. doi: 10.1093/jnci/93.3.178. [DOI] [PubMed] [Google Scholar]
- 185.Li WP, Anderson CJ. Imaging matrix metalloproteinase expression in tumors. Q J Nucl Med. 2003 Sep;47(3):201–208. [PubMed] [Google Scholar]
- 186.Lee S, Park K, Kim K, Choi K, Kwon IC. Activatable imaging probes with amplified fluorescent signals. Chem Commun (Camb) 2008 Sep 28;(36):4250–4260. doi: 10.1039/b806854m. [DOI] [PubMed] [Google Scholar]
- 187.Lee S, Park K, Lee SY, et al. Dark quenched matrix metalloproteinase fluorogenic probe for imaging osteoarthritis development in vivo. Bioconjug Chem. 2008 Sep;19(9):1743–1747. doi: 10.1021/bc800264z. [DOI] [PubMed] [Google Scholar]
- 188.Bremer C, Bredow S, Mahmood U, Weissleder R, Tung CH. Optical imaging of matrix metalloproteinase-2 activity in tumors: feasibility study in a mouse model. Radiology. 2001 Nov;221(2):523–529. doi: 10.1148/radiol.2212010368. [DOI] [PubMed] [Google Scholar]
- 189.Medina OP, Kairemo K, Valtanen H, et al. Radionuclide imaging of tumor xenografts in mice using a gelatinase-targeting peptide. Anticancer Res. 2005 Jan–Feb;25(1A):33–42. [PubMed] [Google Scholar]
- 190.Hanaoka H, Mukai T, Habashita S, et al. Chemical design of a radiolabeled gelatinase inhibitor peptide for the imaging of gelatinase activity in tumors. Nucl Med Biol. 2007 Jul;34(5):503–510. doi: 10.1016/j.nucmedbio.2007.04.002. [DOI] [PubMed] [Google Scholar]
- 191.Sprague JE, Li WP, Liang K, Achilefu S, Anderson CJ. In vitro and in vivo investigation of matrix metalloproteinase expression in metastatic tumor models. Nucl Med Biol. 2006 Feb;33(2):227–237. doi: 10.1016/j.nucmedbio.2005.10.011. [DOI] [PubMed] [Google Scholar]
- 192.Zheng QH, Fei X, Liu X, et al. Synthesis and preliminary biological evaluation of MMP inhibitor radiotracers [11C]methyl-halo-CGS 27023A analogs, new potential PET breast cancer imaging agents. Nucl Med Biol. 2002 Oct;29(7):761–770. doi: 10.1016/s0969-8051(02)00338-4. [DOI] [PubMed] [Google Scholar]
- 193.Furumoto S, Takashima K, Kubota K, Ido T, Iwata R, Fukuda H. Tumor detection using 18F-labeled matrix metalloproteinase-2 inhibitor. Nucl Med Biol. 2003 Feb;30(2):119–125. doi: 10.1016/s0969-8051(02)00393-1. [DOI] [PubMed] [Google Scholar]
- 194.Wagner S, Breyholz HJ, Law MP, et al. Novel fluorinated derivatives of the broad-spectrum MMP inhibitors N-hydroxy-2(R)-[[(4-methoxyphenyl)sulfonyl](benzyl)- and (3-picolyl)-amino]-3-methyl-butanamide as potential tools for the molecular imaging of activated MMPs with PET. J Med Chem. 2007 Nov 15;50(23):5752–5764. doi: 10.1021/jm0708533. [DOI] [PubMed] [Google Scholar]
- 195.Zheng QH, Fei X, Liu X, et al. Comparative studies of potential cancer biomarkers carbon-11 labeled MMP inhibitors (S)-2-(4′-[11C]methoxybiphenyl-4-sulfonylamino)-3-methylbutyric acid and N-hydroxy-(R)-2-[[(4′-[11C]methoxyphenyl)sulfonyl]benzylamino]-3-methylbut anamide. Nucl Med Biol. 2004 Jan;31(1):77–85. doi: 10.1016/s0969-8051(03)00111-2. [DOI] [PubMed] [Google Scholar]
- 196.Zheng QH, Fei X, DeGrado TR, et al. Synthesis, biodistribution and micro-PET imaging of a potential cancer biomarker carbon-11 labeled MMP inhibitor (2R)-2-[[4-(6-fluorohex-1-ynyl)phenyl]sulfonylamino]-3-methylbutyric acid [11C]methyl ester. Nucl Med Biol. 2003 Oct;30(7):753–760. doi: 10.1016/s0969-8051(03)00086-6. [DOI] [PubMed] [Google Scholar]
- 197.Kulasegaram R, Giersing B, Page CJ, et al. In vivo evaluation of 111In-DTPA-N-TIMP-2 in Kaposi sarcoma associated with HIV infection. Eur J Nucl Med. 2001 Jun;28(6):756–761. [PubMed] [Google Scholar]
- 198.Neri D, Carnemolla B, Nissim A, et al. Targeting by affinity-matured recombinant antibody fragments of an angiogenesis associated fibronectin isoform. Nat Biotechnol. 1997 Nov;15(12):1271–1275. doi: 10.1038/nbt1197-1271. [DOI] [PubMed] [Google Scholar]
- 199.Santimaria M, Moscatelli G, Viale GL, et al. Immunoscintigraphic detection of the ED-B domain of fibronectin, a marker of angiogenesis, in patients with cancer. Clin Cancer Res. 2003 Feb;9(2):571–579. [PubMed] [Google Scholar]
- 200.Suri C, Jones PF, Patan S, et al. Requisite role of angiopoietin-1, a ligand for the TIE2 receptor, during embryonic angiogenesis. Cell. 1996 Dec 27;87(7):1171–1180. doi: 10.1016/s0092-8674(00)81813-9. [DOI] [PubMed] [Google Scholar]
- 201.Seaman S, Stevens J, Yang MY, Logsdon D, Graff-Cherry C, St Croix B. Genes that distinguish physiological and pathological angiogenesis. Cancer Cell. 2007 Jun;11(6):539–554. doi: 10.1016/j.ccr.2007.04.017. [DOI] [PMC free article] [PubMed] [Google Scholar]
- 202.Shao Y, Cherry SR, Farahani K, et al. Simultaneous PET and MR imaging. Phys Med Biol. 1997 Oct;42(10):1965–1970. doi: 10.1088/0031-9155/42/10/010. [DOI] [PubMed] [Google Scholar]
- 203.Townsend DW, Beyer T. A combined PET/CT scanner: the path to true image fusion. Br J Radiol. 2002 Nov;75:S24–30. doi: 10.1259/bjr.75.suppl_9.750024. Spec No. [DOI] [PubMed] [Google Scholar]
- 204.Catana C, Wu Y, Judenhofer MS, Qi J, Pichler BJ, Cherry SR. Simultaneous acquisition of multislice PET and MR images: initial results with a MR-compatible PET scanner. J Nucl Med. 2006 Dec;47(12):1968–1976. [PubMed] [Google Scholar]
- 205.Haubner R, Weber WA, Beer AJ, et al. Noninvasive visualization of the activated αvβ3 integrin in cancer patients by positron emission tomography and [18F]galacto-RGD. PLoS Med. 2005 Mar;2(3):e70. doi: 10.1371/journal.pmed.0020070. [DOI] [PMC free article] [PubMed] [Google Scholar]
- 206.Zhang X, Xiong Z, Wu X, et al. Quantitative PET imaging of tumor integrin αvβ3 expression with 18F-FRGD2. J Nucl Med. 2006;47(1):113–121. [PMC free article] [PubMed] [Google Scholar]
- 207.Cai W, Chen K, He L, Cao Q, Koong A, Chen X. Quantitative PET of EGFR expression in xenograft-bearing mice using 64Cu-labeled cetuximab, a chimeric anti-EGFR monoclonal antibody. Eur J Nucl Med Mol Imaging. 2007 Epub;34:850–858. doi: 10.1007/s00259-006-0361-6. [DOI] [PubMed] [Google Scholar]
- 208.Cai W, Ebrahimnejad A, Chen K, et al. Quantitative radioimmunoPET imaging of EphA2 in tumour-bearing mice. Eur J Nucl Med Mol Imaging. 2007;34(12):2024–2036. doi: 10.1007/s00259-007-0503-5. [DOI] [PubMed] [Google Scholar]
- 209.Li ZB, Wu Z, Chen K, Ryu EK, Chen X. 18F-labeled BBN-RGD heterodimer for prostate cancer imaging. J Nucl Med. 2008 Mar;49(3):453–461. doi: 10.2967/jnumed.107.048009. [DOI] [PubMed] [Google Scholar]
- 210.Jung KH, Lee KH, Paik JY, et al. Favorable biokinetic and tumor-targeting properties of 99mTc-labeled glucosamino RGD and effect of paclitaxel therapy. J Nucl Med. 2006 Dec;47(12):2000–2007. [PubMed] [Google Scholar]