

Abstract
In the postnatal brain, oligodendrocyte progenitor cells (OPCs) arise from the subventricular zone (SVZ) and migrate into the developing white matter, where they differentiate into oligodendrocytes and myelinate axons. The mechanisms regulating OPC migration and differentiation are not fully defined. The present study demonstrates that endothelin-1 (ET-1) is an astrocyte-derived signal that regulates OPC migration and differentiation. OPCs in vivo and in culture express functional ETA and ETB receptors, which mediate ET-1-induced ERK (extracellular signal-regulated kinase) and CREB (cAMP response element-binding protein) phosphorylation. ET-1 exerts both chemotactic and chemokinetic effects on OPCs to enhance cell migration; it also prevents lineage progression from the O4+ to the O1+ stage without affecting cell proliferation. Astrocyte-conditioned medium stimulates OPC migration in culture through ET receptor activation, whereas multiphoton time-lapse imaging shows that selective ET receptor antagonists or anti-ET-1 antibodies inhibit OPC migration from the SVZ. Inhibition of ET receptor activity also derepresses OPC differentiation in the corpus callosum in slice cultures. Our findings indicate that ET-1 is a soluble astrocyte-derived signal that regulates OPC migration and differentiation during development.
Introduction
Myelinating oligodendrocytes originate from well characterized oligodendrocyte progenitor cells (OPCs) whose major source in the postnatal brain is the subventricular zone (SVZ). Although differentiated oligodendrocytes cannot migrate, OPCs migrate from SVZ into developing white matter where they can again divide, before finally differentiating and myelinating axons (Rogister et al., 1999; Noble, 2000; Baumann and Pham-Dinh, 2001; Miller, 2002).
Both stimulatory and inhibitory signals have been found to regulate the timing and extent of OPC migration. These include extracellular matrix components (ffrench-Constant et al., 1988; Frost et al., 1996), growth factors (Simpson and Armstrong, 1999), and chemokines (Tsai et al., 2002). Identifying signals that control OPC migration is crucially important to understanding OPC development, and to design remyelination strategies.
Endothelins (ET-1, ET-2, and ET-3) are 21 aa peptides found in many tissues (Simonson, 1993). Only ET-1 and ET-3 are found in brain (MacCumber et al., 1990; Kuwaki et al., 1997); ET-1 levels are higher, and it is distributed throughout different brain regions (Kuwaki et al., 1997). Three G-protein-coupled endothelin receptors (ET-Rs) have been cloned (ETA, ETB, and ETC), but studies identify only two pharmacologically distinct receptors, ETA-R and ETB-R (Simonson, 1993). In the CNS, ETB-R density consistently exceeds ETA-R density (Kuwaki et al., 1997; Schinelli et al., 2001). ET-R expression is regulated during neural cell maturation (Tsaur et al., 1997; Nataf et al., 1998; Nakagomi et al., 2000), and different ET peptides modulate development of distinct cell types including Schwann cells (Brennan et al., 2000; Dupin et al., 2000, 2003; Berti-Mattera et al., 2001), astrocytes (Koyama et al., 1993; Stanimirovic et al., 1995; Cazaubon et al., 1997; Teixeira et al., 2000; Rogers et al., 2003), and neural crest cells (Lahav et al., 1996, 1998).
The findings that ET-1 and ET-Rs are present in the CNS and that ETs exert biological effects on gliogenesis and glial cell function raise the important question of whether this peptide might affect oligodendrocyte development. Furthermore, ET-1 is synthesized not only by microvascular endothelial cells (Durieu-Trautmann et al., 1993) but also by astrocytes (Ehrenreich et al., 1999; Sirén et al., 2000; Ripodas et al., 2001; Schinelli et al., 2001; Gadea et al., 2008); in postnatal brain, oligodendrocytes develop after astrocytes in close partnership with them in the SVZ (Lim and Alvarez-Buylla, 1999). To define a possible role of ET-1 in oligodendrocyte development, we determined expression of functional ET-Rs in OPCs in culture and in vivo. Combining studies in cultured cells and in situ, we investigated whether activation of these receptors affects OPC proliferation, migration, and differentiation.
Materials and Methods
Materials
ET-1 (human and porcine), cyclo(d-Asp-Pro-d-Ile-Leu-d-Trp) (JKC-301), and l-3,3′,5-triiodothyronine sodium salt (T3) were from Calbiochem; H-Cys-Val-Tyr-Phe-Cys-His-Leu-Asp-Ile-Ile-Trp-OH (IRL-1038) was from Alexis; bosentan was donated by Actelion Pharmaceuticals; Ac-Dip-Leu-Asp-Ile-Ile-Trp (PD142893) was from Calbiochem; anti-endothelin-1 monoclonal antibody was from Calbiochem; anti-ETA-R, anti-ETB-R, and anti-NG2 antibodies were from Millipore Bioscience Research Reagents; A2B5, O4, and O1 antibodies were from American Type Culture Collection. Rabbit polyclonal Olig2 antibody was a gift from Dr. David Rowitch (University of California, San Francisco, San Francisco, CA). Antibodies from Cell Signaling Technology included the following: dually phosphorylated (Thr180/Tyr182) p38 mitogen-activated protein kinase (p38MAPK), phosphorylation state-independent p38MAPK, dually phosphorylated (Thr183/Tyr185) c-Jun N-terminal kinase (JNK), phosphorylation state-independent JNK, phosphorylated Ser133 cAMP response element-binding protein (CREB) (P-CREB), phosphorylation state-independent CREB, dually phosphorylated (Thr202/Tyr204) extracellular signal-regulated kinase (ERK), phosphorylation state-independent ERK, and cleaved caspase-3. Anti-cyclic nucleotide phosphodiesterase (CNP) and anti-myelin basic protein (MBP) monoclonal antibodies were from Sternberger Monoclonal; anti-vascular endothelial growth factor (VEGF) antibody was from BD Biosciences; anti-5-bromo-2′-deoxyuridine (BrdU) antibody was from Dako; platelet-derived growth factor (PDGF) (human; AB; heterodimer form) and fibroblast growth factor-2 (FGF-2) were from Millipore. Cell culture reagents, except for fetal bovine serum (FBS) (HyClone), were from Invitrogen. All other reagents were purchased from Sigma-Aldrich.
Cell cultures
Purified cortical oligodendrocyte progenitor (OP) cultures were prepared from embryonic day 20 rats as previously described (Gallo et al., 1996; Ghiani et al., 1999). All animal procedures were approved by Children's National Medical Center Institutional Animal Care and Use Committee. OP cells were plated onto poly-d-ornithine-coated plates (0.1 mg/ml) and cultured in DMEM-N1 biotin-containing medium (penicillin, 100 U/ml; streptomycin, 100 μg/ml; human apo-transferrin, 50 μg/ml; biotin, 10 ng/ml; Na selenium, 25 nm; insulin, 2.5 μg/ml; putrescine, 100 μm; progesterone, 20 nm). In cells cultured with PDGF (10 ng/ml), the growth factor was added to the culture medium 2 h after plating for 48 h. To differentiate OP cells into preoligodendrocytes or oligodendrocytes, OPs were cultured in PDGF (10 ng/ml) for 3 d. Previously, we demonstrated that, in PDGF-treated cultures, 100% of the cells expressed nestin and >90% of the nestin+ cells are A2B5+ or NG2+ at 24 h in culture; no O1+ cells and <5% O4+ cells were found at this time point (Gallo et al., 1996). After 3 d in vitro (DIV), >85% of the cells were O4+ (see below). In cultures treated with T3 hormone, 97.3 ± 0.2% of the total cells were O1+ at 4 DIV. Cells were cultured 1–5 d preceding immunocytochemical staining or harvesting for protein and RNA extraction. ET-1 and/or ET-R antagonists were added directly to DMEM-N1 culture medium. When tested together, ET-1 was added 1 h after the antagonists. For protein phosphorylation studies, the medium was replaced with basal DMEM 4–5 h before stimulation with ET-1.
Cortical astrocyte cultures were prepared as previously described (McCarthy and de Vellis, 1980; Schinelli et al., 2001; Gadea et al., 2008). For astrocyte-conditioned medium (ACM), cortical astrocytes were cultured in T75 flasks. At 12 DIV (cell confluency), culture medium was replaced with fresh DMEM for 24–96 h. The medium was collected, centrifuged to eliminate debris, and stored at −20°C before utilization.
CNP-EGFP transgenic mouse and EGFP+ cell purification by FACS
The CNP-EGFP transgenic mouse has been characterized (Stevens et al., 2002; Yuan et al., 2002; Belachew et al., 2003; Aguirre et al., 2004). This study used transgenic line C1 (FVB/N × CB6 background) of the CNP-GFP transgenic mouse (Yuan et al., 2002). The same results were obtained with line D2. Brains were removed from postnatal day 6 (P6) to P8 CNP-EGFP mice, and EGFP+ and NG2+EGFP+ cells were FACS-purified as previously described (Aguirre and Gallo, 2004). By this method, the yield of CNP-EGFP+ cells was 1 × 10⁶ cells/brain and 25 × 104 cells/SVZ.
Reverse transcription-PCR
RNA was isolated from P8 FACS-purified EGFP+ mouse cells and from cultured OP cells using Trizol (Invitrogen) (Aguirre and Gallo, 2004). One microgram of RNA from each sample was reverse-transcribed using the SuperScript First-Strand cDNA Synthesis kit (Invitrogen). Specific primers were obtained from Integrated DNA Technologies. Sequences were as follows: ETA-R, sense, 5′-AGCAGCTGCTGGACGAGCA-3′, and antisense, 5′-CCTGCTTCCAAAGTCCATTC-3′; ETB-R, sense, 5′-TTACAAGACAGCCAAAGACT-3′, and antisense, 5′-CACGATGAGGACAATGAGAT-3′; ET-1, sense, 5′-CTTCCCAATAAGGCCACAGACCAG-3′, and antisense, 5′-AGCCACACAGATGGTCTTGCTAAG-3′; actin, sense, 5′-CGTGGGCCGCCCTAGGCACCA-3′, and antisense, 5′-TTGGCCTTAGGGTTCAGGGGG-3′. Genes were amplified by 1 min denaturation at 94°C, 1 min annealing at 60°C, and 1 min extension at 72°C for 35 cycles. PCR products were resolved by 1.2% agarose gel electrophoresis and visualized under UV light.
Western blot
Oligodendrocyte lineage cells cultured in DMEM-N1 medium plus PDGF (10 ng/ml) were grown on 60 mm plastic dishes for 1–5 d. For phosphorylation studies, stimulation with ET-1 or treatment with antagonists was performed in cultures grown for 2 DIV. Cells were harvested and cell extracts prepared as previously described (Gadea et al., 2008). Lysates were centrifuged at 16,000 × g for 15 min and supernatants were collected. All antibodies, including anti-ET-R antibodies, were diluted in Tris-buffered saline containing 4% nonfat dry milk (TBSM) (1:1000; anti-ETA-R and ETB-R, 1:500). Protein bands were detected as previously described (Gadea et al., 2008).
Immunohistochemistry
P8 mice were anesthetized by flurane (Ohmeda PPD) inhalation and perfused intracardially with 1× PBS, followed by 4% paraformaldehyde. Brains were removed and postfixed as previously described; immunocytochemical procedures and confocal microscopy analysis (Zeiss LSM 510 NLO confocal microscope) were as previously described (Aguirre et al., 2007).
Enzyme immunometric assay
ET-1 concentration was measured in ACM using the TiterZyme enzyme immunometric assay kit for human endothelin-1 (Assay Designs) following the manufacturer's instructions. This assay is specific for ET-1, with a detection limit of 0.14 pg/ml. Cross-reactivity with other ET peptides is 3.3% for ET-2, 0.1% for bigET-1, and <0.1% for ET-3. Absorbance at 450 nm was measured using a Microtek ELISA reader. Measurements were performed in triplicate from at least three independent cultures.
Immunocytochemistry and cell proliferation assays in oligodendrocyte cultures
Immunocytochemistry of oligodendrocyte lineage cell cultures by double indirect immunofluorescence was performed as previously described (Gallo and Armstrong, 1995; Gallo et al., 1996; Yuan et al., 1998; Ghiani et al., 1999). Primary antibodies used to identify developmental stages of the oligodendrocyte lineage were as follows: A2B5 (Eisenbarth et al., 1979); NG2 (Stallcup and Beasley, 1987); O4 (Sommer and Schachner, 1981); and O1 (Sommer and Schachner, 1981). Secondary fluorochrome-conjugated antibodies were from Cappel/Organon Teknika. For lineage progression analysis, purified OPCs were plated on poly-d-ornithine-coated coverslips (200,000 cells/coverslip) in DMEM-N1 medium with 10 ng/ml PDGF and 30 ng/ml T3, in the absence or presence of ET-1. ET-1 (200 nm) was added at the time of plating and 24 h later. Differentiation was assessed by immunostaining with O4 and O1 antibodies at 48 and 96 h in culture (Sohn et al., 2006). The ratio of O4+ or O1+ OPCs/Hoechst+ nuclei per field was calculated. For cell counting, 10–20 microscopic fields were counted for each coverslip, analyzing one to two coverslips per experiment. At least three independent experiments were performed for each condition. Data are presented as averages ± SEM.
For receptor expression studies, double staining with NG2, O4, or O1 and anti-ETA-R or ETB-R, was performed in cells of oligodendrocyte lineage cultured for 3 d in PDGF (10 ng/ml at time of plating). Under these conditions, 57% of cells were NG2+, 52% O4+, and 26% O1+. Live cells were first stained with NG2, O4, or O1, and then fixed in 4% paraformaldehyde, pH 7.4 (in PBS), for 15 min. After permeabilization in 95% ethanol/5% acetic acid for 10 min at −20°C, cells were incubated with polyclonal anti-ETA-R or anti-ETB-R antibodies (1:250; overnight at 4°C), and then incubated for 30 min with rhodamine-conjugated goat anti-rabbit IgG. Cells were then mounted in 4′,6′-diamidino-2-phenylindole (DAPI)/Vectashield (Vector Laboratories). Controls for antibody specificity omitted each of the primary antibodies in the immunostaining protocols. The confocal immunofluorescence micrographs presented are representative of at least three experiments and were taken on a Zeiss LSM 510 NLO confocal microscope.
Cell proliferation was measured by BrdU and [3H]thymidine incorporation, as previously described (Gallo et al., 1996). Two hours after plating, PDGF or FGF-2, and/or ET-1 were added to the culture medium together with [methyl-3H]thymidine (0.5 μCi/ml; 45 Ci/mmol; GE Healthcare), and cells were harvested at 24 h. In one set of experiments, [methyl-3H]thymidine was added 24 or 72 h after plating; cells were harvested at 48 and 96 h, respectively. Cells were lysed in dissociation solution (1% SDS, 1 mg/ml BSA in 1× PBS). [3H]Thymidine incorporation was measured by precipitation with 10% trichloroacetic acid and scintillation counting.
For BrdU incorporation experiments, cells plated on glass coverslips were pulsed with BrdU and stained as described previously (Sohn et al., 2006). The A2B5+BrdU+/A2B5+ and O4+BrdU+/O4+ ratio was determined by counting three coverslips (10 fields per coverslip) from three separate experiments for each culture condition. No O1+BrdU+ cells were found under any culture condition.
Apoptosis assays
Apoptotic cell death was determined by fluorescence microscopy using the terminal deoxynucleotidyl transferase-mediated biotinylated UTP nick end labeling (TUNEL) assay (Roche Diagnostics) or activated caspase-3 staining (Calbiochem). For TUNEL staining, cells plated on glass coverslips were fixed in 4% paraformaldehyde, permeabilized in 0.1% Triton X-100, 0.1% sodium citrate (2 min at 4°C), and stained with TUNEL following manufacturer's instructions. Apoptotic OPCs were brightly fluorescent. For activated caspase-3 staining, cells were fixed in 4% paraformaldehyde, permeabilized in 0.1% Triton X-100, incubated for 1 h at room temperature with an antibody that recognizes cleaved caspase-3 (1:250), and then incubated 30 min with rhodamine-conjugated goat anti-rabbit IgG (1:200). Nuclear staining was performed with DAPI and percentage of activated caspase-3+ cells was calculated. Two to three independent experiments were performed for each assay. In each experiment, two coverslips were analyzed and 8–10 microscopic fields were counted per coverslip. All data presented are averages ± SEM.
Cell migration assays
Agarose drop assay.
Cell migration was quantified using the agarose drop assay (Milner et al., 1997; Frost et al., 2000). Oligodendrocyte precursors were isolated as above, centrifuged at 300 × g for 5 min, and then resuspended at a density of 40–50 × 106 cells/ml in DMEM/Sato medium (Milner and ffrench-Constant, 1994) supplemented with 10% FBS and 0.3% low-melting point agarose (Sigma-Aldrich) maintained at 37°C to prevent hardening. Drops (1.5 μl) of this suspension were placed at the center of poly-d-lysine (5 μg/ml)-coated wells in a 24-well tissue culture dish (Nalge Nunc International), and then maintained at 4°C for 15 min for hardening agarose. After cooling, the agarose drop was covered with 0.5 ml of serum-free DMEM/Sato medium or 0.5 ml of astrocyte-conditioned medium. Growth factors, ET-1, and ET-R antagonists were added to the wells immediately after adding the media. ET-1 (alone or with antagonists) was readded 24 and 48 h after plating. When tested together, ET-1 was added 2 h after the ET-R antagonists. Cell migration was measured daily for 1–6 d using a phase contrast microscope with calibrated graticule; one grid square width represented 80 μm actual distance at 10× magnification. Cells migrated outward, forming a uniform corona around the drop. Distance between the edge of the drop and the leading edge of migrating cells in the corona on four sides of the drop was recorded at each time point. Occasional individual cells that migrated ahead of the corona were not considered. All experiments were performed in three or more wells. Mean migration was calculated for each experiment, and results were expressed as mean ± SEM. Statistical significance was assessed using Student's paired t test, with p < 0.05 defined as statistically significant. Immunostaining of migrating cells was performed as described above.
Analyses of ET-1 effects in SVZ explant cultures and microchemotaxis chambers were performed as previously described (Aguirre et al., 2005).
SVZ explant migration assays.
P5 brains from CNP-EGFP mice were dissected out and transferred to ice-cold HBSS medium (Invitrogen). The brains were cut in 300-μm-thick sections, and only those sections containing the SVZ were selected for additional manipulation. The SVZ was dissected along the lateral wall of the lateral ventricles under a surgical microscope, and then cut into small pieces (50–100 μm in size) that were placed on top of 50% BD PuraMatrix Peptide Hydrogel (BD Biosciences). Peptide Hydrogel was prepared following the manufacturer's recommendations. Briefly, 35 mm diameter cell inserts (0.4 μm pore size; Corning) were coated with Peptide Hydrogel diluted 1:1 with 1× PBS, pH 7.4. After polymerization, the gel was equilibrated three times with Neurobasal medium containing B27, N2 supplements, l-glutamine (0.5 mm), and penicillin–streptomycin (all from Invitrogen). Cultures were maintained in a humidified incubator at 5% CO2 and 37°C for 3 d. Heparin beads (Sigma-Aldrich) loaded with ET-1 (2 mg/ml) or BSA as control (0.1%; Sigma-Aldrich) were placed at opposite sites in the well, and SVZ explants were symmetrically positioned between ET-1- and BSA-loaded beads (300–400 μm from each set of beads), using a graticule with scale division. This configuration allowed the simultaneous analysis of EGFP+ cell migration with the two sets of beads. For direct quantification of cell migration, SVZ explants were subdivided into four quadrants, and the areas occupied by migrating cells in two of these quadrants (facing either BSA- or ET-1-coated beads) were quantified by image analysis as previously described (Pozas et al., 2001). The same results were also obtained by separately testing individual explants with ET-1- and BSA-loaded heparin beads.
Chemotaxis assays in Boyden chambers.
In vitro migration of purified OP cells was assessed using poly-l-lysine-coated (5 μg/ml) polyvinylcarbonate-free membranes with 8 μm pore size (NeuroProbe). Assays were performed in modified Boyden chambers. Briefly, OPCs were obtained as described above for purified cortical OP cultures. After purification, cells were resuspended in N1 medium (1 × 10⁶ cells/ml) and 25 μl of this suspension was placed in the upper chamber. Tested compounds, including ET-1 (100 nm), bosentan (1 μm), and/or PDGF (10 μg/ml), were all diluted in N1 medium and added to the lower chamber, to the upper chamber, or to both chambers when indicated. In the experiments in which bosentan was used, cells were preincubated with the antagonist for 30 min at 37°C in 5% CO2 before loading in the top chamber. After 24 h incubation at 37°C in 5% CO2, the upper surface of membranes was scraped free of cells and debris, and membranes were fixed, stained with DAPI, and mounted. Cells that had migrated through the pores and adhered to the membrane were analyzed under high-power light microscopy and counted in five to six adjacent high-power fields (HPFs) (area of HPF, 0.78 mm2; area of each filter, 7.07 mm2) in triplicate (four different membranes for each experimental condition). Experiments were repeated three times, and data were analyzed from a total of 60 fields from 12 membranes for each experimental condition. Data were expressed as numbers of cells per HPF ± SEM. Data were analyzed for statistical significance between groups by using the unpaired t test.
Organotypic slice cultures from CNP-EGFP mice
Coronal brain slices from P4 and P5 CNP-EGFP mice were obtained as previously described (Haydar et al., 1999) with modifications. To determine culture conditions for the slices, we cultured slices for 48 h in serum-free Neurobasal medium supplemented with B27 and N2, and 0, 2.5, or 5.0% FBS. Slices were fixed in 4% paraformaldehyde and cryoprotected in 30% sucrose. Apoptosis was measured as the number of activated caspase-3+ cells in 1.5 × 10⁵/μm3 of SVZ. Counts were obtained throughout the middle of the slice (100–150 μm deep in the 300-μm-thick slices), the same depth used for live imaging (below). The lowest percentage of apoptotic cells was found in slices cultured in 5.0% serum (supplemental Fig. S3, available at www.jneurosci.org as supplemental material). For cell migration experiments, slices were allowed to recover for 2 h in culture, and then preincubated 4 h with either bosentan (1 μm), or anti-ET-1 (1:500), or ET-1 (50 nm) in Neurobasal plus 5% FBS. In experiments studying reversibility of anti-ET-1 effects, slices were incubated with the antibody for 2 h, followed by anti-ET-1 (1:500) plus ET-1 (50 nm) for 2 h. All culture conditions were tested for their effects on cell survival, measured by caspase-3 immunoreactivity.
Quantification of myelin protein expression in organotypic slice cultures
Organotypic slice cultures were prepared from P8 or P13 CNP-EGFP mice; n ≥ 8 slices from two to three brains were processed for each experiment. After decapitation, organotypic slices were prepared as above. Slices were cultured for 2–4 h, and then either saline or bosentan (1 mm) was added to the culture medium. After 4 d in culture, the corpus callosum was microdissected from the coronal sections, and 15 μg of total protein from each sample was analyzed by Western blot as previously described (Aguirre et al., 2007). MBP levels were normalized to actin and expressed as arbitrary units. MBP and CNP levels were compared between control and bosentan-treated slices.
Time-lapse multiphoton microscopy
Time-lapse image acquisition of migrating EGFP+ living cells was performed on acutely isolated P4 or P5 slices, which were maintained in a humidified incubator (37°C, 5% CO2) for 2–8 h before observation, and then transferred to a heated stage insert (Warner Instruments) and immobilized. The imaging chamber was mounted on the stage of a Zeiss LSM510 Meta NLO Axiovert 200M microscope (Carl Zeiss Microimaging). Heated medium (supplemented Neurobasal buffered with HEPES, pH 7.4) was superfused through the stage insert during imaging. All time-lapse studies were conducted with a 25× multiimmersion lens (0.8 numerical aperture) using 895 nm excitation (Mira 900F with 8W Verdi pump; Coherent).
Time series experiments were conducted by collecting 20- to 40-μm-thick Z-stacks 100–150 μm deep within the tissue. Stacks at the same tissue position were acquired every 6 min for up to 24 h; the three-dimensional distance migrated was obtained by manually tracking cells with Carl Zeiss software. To count total numbers of migrating cells, each Z-stack was collapsed into a single image. Time series were concatenated and contrast-enhanced using Carl Zeiss LSM 510 and Adobe Photoshop software.
Tracking of migrating progenitors started when a cell first came into focus or appeared in the imaging field, and ended when it went out of focus or left the imaging field. Thus, not all cells were imaged for the same time window. The percentage of migrating cells in each experiment was based on the total number of EGFP+ progenitors present during the whole imaging period. In control experiments, the average percentage of migrating cells was 30–40 ± 5–6%. Highly motile, autofluorescent phagocytic cells (immunostained for OX42) (data not shown) were detected, especially at the ventricular lining. These endogenous cells were easily differentiated from OPs expressing high levels of EGFP fluorescence and displaying leading and trailing processes.
Results
OPCs express ET-Rs in vivo and in culture
ET-R expression is unexplored in oligodendrocyte lineage cells. Double immunofluorescence with antibodies against ET-Rs, and the oligodendrocyte lineage markers NG2 (OPCs), O4 (preoligodendrocytes), and O1 (oligodendrocytes) revealed ETA-R and ETB-R expression throughout the oligodendrocyte lineage in culture (Fig. 1 A–F). Cultured rat OPCs were analyzed at 3 DIV. All NG2+, O4+, and O1+ cells were immunopositive for ETA-R (Fig. 1 A–C) and ETB-R (Fig. 1 D–F). Some cells coexpressed NG2 and O4, or O4 and O1 (Gallo and Armstrong, 1995). Reverse transcription (RT)-PCR and Western blot analysis confirmed these findings. Cultured oligodendrocyte lineage cells displayed lower ETA-R than ETB-R expression, at both mRNA and protein levels (Fig. 1 G,H). However, ETA-R mRNA and protein levels increased with time in culture (mRNA, 1.5 ± 0.2-fold at 3 DIV, 2 ± 0.1 at 4 DIV, and 2.1 ± 0.2 at 5 DIV, compared with 1 DIV; protein, 1.7 ± 0.2 at 3 DIV, 1.8 ± 0.2 at 4 DIV, 2.2 ± 0.1 at 5 DIV, compared with 1 DIV; Student's t test, p < 0.01), whereas ETB-R expression remained constant (Fig. 1 G,H).
Figure 1.
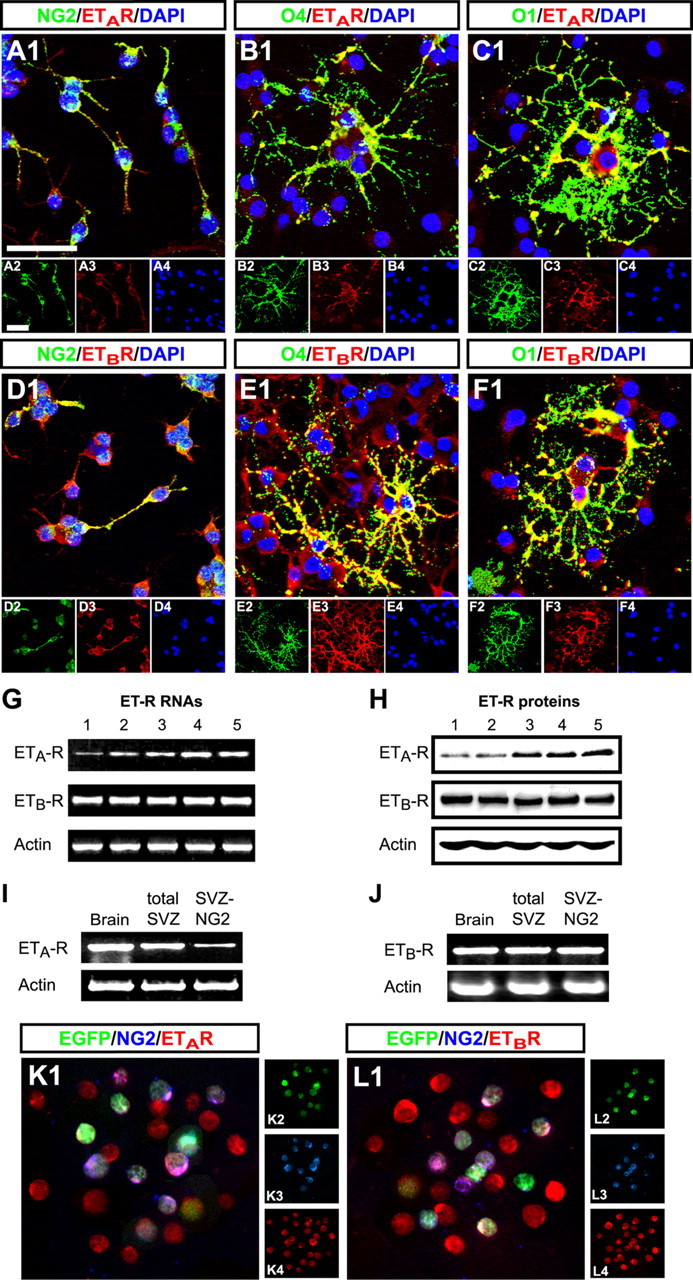
ET-Rs are expressed in cells of oligodendrocyte lineage in culture and in vivo and in progenitors of the subventricular zone. A–F, Immunostaining was performed in cells of oligodendrocyte lineage in culture: 57% of cells were NG2+, 52% O4+, and 26% O1+. Double immunostaining used the above-mentioned cell surface antibodies (green) and anti-ET-R antibodies (red). Nuclear staining used DAPI (blue). The smaller panels show individual channels. Both receptors are expressed in NG2+, O4+, and O1+ cells. Scale bars, 30 μm. G, RT-PCR analysis of ET-Rs mRNA expression in cultured oligodendrocyte lineage cells. Total RNA was extracted from OPCs at 1–5 d in culture. ETA-R mRNA showed time-dependent increase in culture; ETB-R mRNA levels remained constant. H, Cell lysates from cultured OPCs were analyzed by Western blot at 1–5 d in culture. Expression levels of both ET-R proteins match those of their mRNAs. I, J, ET-R mRNA expression in EGFP+ cells FACS-purified from CNP-EGFP transgenic mouse brain. Total RNA was obtained from EGFP+ cells of total brain (GFP) and SVZ. Double sorting from SVZ used an antibody against the NG2 proteoglycan, obtaining a pure population of NG2-expressing EGFP+ progenitors (NG2). Total mRNA was reverse transcribed to cDNA and analyzed by PCR. mRNA for both receptors was expressed in brain EGFP+ oligodendrocyte lineage cells, in SVZ OPCs, and in NG2-expressing progenitors of SVZ. Note: In NG2-expressing progenitors ETA-R shows lower mRNA expression than ETB-R. K, L, Immunostaining in dissociated cells from the SVZ of P8 CNP-EGFP mice. Two hours after plating, cells were immunostained with antibodies against NG2 and the ETA (K) or the ETB (L) receptors. Ninety-eight percent of NG2+EGFP+ (green) cells in the SVZ displayed immunostaining for both ET-Rs (red).
To confirm ET-R expression in oligodendrocyte lineage cells in vivo, we used RT-PCR to analyze expression of ETA-R and ETB-R genes in EGFP+ cells FACS-purified from the forebrain and SVZ of the CNP-EGFP mouse (Aguirre et al., 2007). NG2+EGFP+progenitors were also double-sorted from the SVZ. mRNAs for both receptors were expressed in all EGFP+ cell populations analyzed (Fig. 1 I,J). Supporting our analysis in cultured cells (Fig. 1 G,H), NG2+EGFP+ progenitors expressed lower mRNA levels of ETA-R than ETB-R (Fig. 1 I,J). Finally, immunocytochemistry on freshly dissociated SVZ cells from the CNP-EGFP mouse with antibodies against NG2 and ET-Rs showed that 98 ± 1% of the NG2+EGFP+ progenitors in the SVZ express both types of receptors (Fig. 1 K,L). These results demonstrate that both ETA-R and ETB-R are expressed in the oligodendrocyte lineage in vitro and in vivo.
Functional ET-Rs in OPCs are linked to the MAPK pathway
We recently demonstrated that ET-1 activates p38MAPK and JNK pathways in astrocytes (Gadea et al., 2008). To demonstrate that ET-Rs in OPCs are functional, we monitored ET-R-mediated activation of ERK-1/2, p38MAPK, and CREB by immunoblotting with antibodies specific for P-ERK-1/2, P-p38MAPK, and P-CREB. Although ET-R stimulation did not change basal expression of total ERK-1/2 and CREB, time course analysis of ERK1/2 and p38MAPK phosphorylation revealed a rapid ET-1-induced increase in phosphorylation of both proteins in OPCs. Detectable after 5 min stimulation with ET-1, phosphorylation was maximal at 5–10 min (2.5 ± 0.2-fold increase for ERK1/2 and 3 ± 0.1-fold for p38MAPK with respect to basal; Student's t test, p < 0.01), and then decreased to basal levels 60 min after stimulation (Fig. 2 A,B). Similarly, ET-1 induced CREB phosphorylation in OPCs within several minutes after stimulation (Fig. 2 C) (2 ± 0.2-fold increase at 10 min). In contrast to astrocytes (Gadea et al., 2008), ET-1 affected neither total JNK levels nor JNK phosphorylation in OPCs (Fig. 2 D).
Figure 2.

ET-1 activates ET-Rs to induce ERK, p38MAPK, and CREB phosphorylation. A, Time course of ET-1-induced ERK phosphorylation in OPCs. Cultured OPCs were stimulated with 100 nm ET-1 for times indicated; total cell lysates were analyzed by Western blot using anti-P-ERK or antibody for total ERK. B, Time course of ET-1-induced p38MAPK phosphorylation. OPCs were stimulated as in A. Lysates were analyzed using anti-P-p38MAPK antibody or antibody for total p38MAPK. C, Time course of ET-1-induced CREB phosphorylation. OPCs were stimulated as in A. Lysates were analyzed using anti-P-CREB antibody or antibody for total CREB. D, ET-1 does not induce JNK phosphorylation. OPCs were stimulated as in A. Lysates were analyzed using anti-P-JNK antibody or antibody for total JNK. E, Effects of ET-R antagonists on ET-1-induced ERK phosphorylation. OPCs were preincubated for 15 min with ET-R pan-antagonists bosentan (Bos) (2 μm) or PD142893 (PD14) (2 μm). After preincubation, cells were stimulated with 100 nm ET-1 for 10 min. Lysates were analyzed using anti-P-ERK antibody or antibody for total ERK. F, OPCs were treated with ET-R antagonists and stimulated as in E. Lysates were analyzed using anti-P-CREB antibody or total CREB antibody. For all blots A–F, similar results were obtained in three independent experiments; representative Western blots are shown.
Stimulatory effects of ET-1 on ERK1/2 and CREB phosphorylation were blocked by ET-R pan-antagonists bosentan (Clozel et al., 1994) and PD142893 (Wellings et al., 1994) (Fig. 2 E,F), demonstrating that activation of functional ET-Rs mediates the effects of ET-1 on OPCs. These data demonstrate that ET-1 functionally activates ET-Rs and multiple signal transduction pathways leading to CREB phosphorylation in OPCs.
ET-1 stimulates cultured OPC migration by chemotaxis and chemokinesis, without affecting cell proliferation
To investigate whether ET-1 affects OPC proliferation, we used BrdU and [3H]thymidine incorporation to periodically assay OPC proliferation (12, 24, 48, and 96 h after ET-1 treatment) under various culture conditions (ET-1 treatment in cells cultured with PDGF, FGF-2, and/or T3; ET-1 treatment at plating, or 24–48 h after plating). Despite previously described effects on proliferation of other glial cell types (Supattapone et al., 1989; Stanimirovic et al., 1995; Kuwaki et al., 1997; Berti-Mattera et al., 2001; Jessen and Mirsky, 2002; Koyama et al., 2003; Gadea et al., 2008), ET-1 failed to affect OPC proliferation under conditions tested (Table 1).
Table 1.
ET-1 does not affect oligodendrocyte progenitor proliferation
| Culture conditions | [3H]Thymidine (dpm ×103) | A2B5+/BrdU+ | O4+/BrdU+ |
|---|---|---|---|
| N1 | 21.94 ± 0.93 | 51 ± 6 | 34 ± 4 |
| N1 + ET-1 | 23.16 ± 2.11 | 48 ± 8 | 36 ± 3 |
| N1 + PDGF | 59.11 ± 1.66 | 87 ± 5 | 71 ± 8 |
| N1 + PDGF + ET-1 | 61.26 ± 2.84 | 90 ± 7 | 80 ± 7 |
OPC proliferation was determined by BrdU and [3H]thymidine incorporation. Purified OPCs were plated in DMEM-N1 medium. After 1 h, PDGF (10 ng/ml) and/or ET-1 were added to the culture medium. [3H]Thymidine (0.5 μCi/ml) was added together with PDGF and ET-1, and incorporation was measured after 24 h by trichloroacetic acid precipitation and scintillation counting. For the BrdU assay, OPCs were plated on poly-l-ornithine-coated coverslips in DMEM-N1 medium and 10 ng/ml of PDGF ± ET-1 (200 nm). BrdU incorporation was quantified as described in Materials and Methods (Gallo et al., 1996). BrdU (25 μm) was added to the cultures 18 h before harvesting the cells. The proliferation rate was calculated as the percentage of A2B5+/BrdU+ cells/microscopic field (after 24 h in culture) or O4+/BrdU+ cells/microscopic field (after 48 h in culture). Ten to 15 fields/coverslip were randomly chosen to obtain a mean for each culture dish. Data represent the mean ± SEM of four experiments performed in triplicate. No significant differences were found in cultures treated with ET-1 compared with their respective controls. dpm, Disintegration per minute.
To analyze ET-1 effects on OPC migration, we modified the Varani agarose drop assay (Varani et al., 1978; Milner et al., 1997; Frost et al., 2000). As expected from studies using different assays (Noble et al., 1988; Armstrong et al., 1990), PDGF and FGF-2 promoted OPC migration in the agarose drop assay (Fig. 3 A; supplemental Fig. S1, available at www.jneurosci.org as supplemental material, FGF-2). OPC staining with A2B5 and anti-Olig2 antibodies showed that A2B5+Olig2+ cells had migrated to form a uniform corona around the drop after 48 h (Fig. 3 C,D). Growth factors PDGF or FGF-2 were required: in their presence, OPCs migrated up to 0.6 mm during a 6 d period; in their absence, migration was not observed (Fig. 3 A; supplemental Fig. S1, available at www.jneurosci.org as supplemental material, FGF-2).
Figure 3.

ET-1 stimulates OPC migration. Agarose drop assays were used to measure ET-1 (200 nm) effects on OPC migration. A, ET-1 stimulates OPC migration in the presence of PDGF, compared with PDGF alone (*significantly different from control at corresponding time points; Student's t test; **p < 0.01). ET-R pan-antagonist bosentan (2 μm) completely prevented ET-1 effects on OPC migration (PDGF/PDGF + ET-1 + Bos vs PDGF/PDGF + ET-1, significantly different at days 4, 5, and 6; p < 0.01). B, Cell density at different distances from the edge of the drop (expressed as number of cells per unit area) in assays performed for 6 d in the absence (Sato medium) or presence of PDGF (10 ng/ml) and/or ET-1 (200 nm). At 6 d in the presence of PDGF, ET-1 significantly increased the number of cells migrating out of the agarose drop (Student's t test, p < 0.05). Data are means ± SEM of two independent experiments performed in triplicate. C, D, Staining of the agarose drop assay after 48 h with A2B5 (green) and anti-Olig2 antibodies (red) and counterstained with DAPI (blue). Most cells were A2B5+ and Olig2+, and remaining cells were O4+ (data not shown). ET-1 stimulated cell migration out of the drop without changing relative proportion of A2B5+ or Olig2+ cells (>95% A2B5+/Olig2+ cells under both conditions). E, Effects of ETA-R antagonist JKC-301 (1 μm) and ETB-R antagonist IRL-1038 (1 μm) on OPC migration were determined in the presence of ET-1 (200 nm) and PDGF (10 ng/ml). ET-1 stimulated OPC migration in the presence of PDGF, compared with control (PDGF alone). At 6 d, ETA-R and ETB-R antagonists JKC-301 and IRL-1038 (1 μm) significantly inhibited ET-1-stimulated migration (34 ± 5 and 75 ± 4%, respectively; Student's t test, *p < 0.05, **p < 0.01). F, ETA-R and ETB-R antagonists JKC-301 and IRL-1038 (both 1 μm) inhibited effects of ET-1 on P-ERK phosphorylation. Student's t test, **p < 0.01. Equal loading in Western blot was demonstrated by detection of total ERK.
ET-1 alone did not promote OPC migration, but significantly enhanced stimulatory effects of PDGF and FGF-2. ET-1 effects became apparent 3 d after exposure and persisted for 6 d (Fig. 3 A; supplemental Fig. S1, available at www.jneurosci.org as supplemental material, FGF-2). Effects of ET-1 on OPC migration were mediated by selective activation of ET-Rs, since the pan-antagonist bosentan blocked the ET-1 effects but did not affect growth factor-induced migration (Fig. 3 A). Importantly, ET-1 stimulated cell migration outside of the drop without changing the relative proportions of A2B5+ or Olig2+ cells (Fig. 3 C,D). To further quantify OPC migration, we analyzed cell density at different distances from the edge of the drop at each time point. In either PDGF or FGF-2, ET-1 increased both the distance and total number of cells migrating out of the agarose drop (Fig. 3 B; supplemental Fig. S1, available at www.jneurosci.org as supplemental material, FGF-2). ET-1 also increased (p < 0.05) the maximum distance that OPCs migrated from the edge of the drop (Fig. 3 B). Consistent with our data (Table 1), ET-1 did not modify OPC proliferation under these culture conditions (data not shown).
ETA-R and ETB-R involvement in ET-1 effects on OPC migration was demonstrated in the agarose drop assay by partial inhibitory effects of the selective ETA-R and ETB-R antagonists JKC-301 (Widdowson and Kirk, 1996; Ngoka and Gross, 2000) and IRL-1038 (Baertschi et al., 2000; Rossi, 2004), respectively (Fig. 3 E,F). IRL was significantly more effective than JKC, indicating a major role for ETB-Rs (Fig. 3 E). This was consistent with a higher percentage inhibition of ET-1-induced P-ERK phosphorylation in cultured OPCs observed with IRL (90 + 5; n = 3 independent experiments) than with JKC (45 + 4; n = 3) (Fig. 3 F).
Two other migration assays confirmed the promigratory effects of ET-1 on OPCs. SVZ explants from CNP-EGFP mouse brain were placed equidistant (400 μm) from heparin beads soaked with either ET-1 or BSA (Fig. 4 A,B), allowing simultaneous analysis of EGFP+ OPC migration with the two sets of beads (Fig. 4 A–C). A high percentage of EGFP+ cells migrated out of the explant toward the ET-1-soaked beads during the first 24 h in culture (data not shown). At 72 h in culture, EGFP+ cells displayed limited migration toward BSA-heparin beads (Fig. 4 B1,C1). Conversely, many EGFP+ cells exhibited migration toward ET-1-heparin beads (Fig. 4 B2,C2). Cell migration at 72 h was directly quantified by measuring the area occupied by migrating EGFP+ cells (Fig. 4 D), demonstrating a sevenfold increase in ET-1-stimulated migration compared with BSA (Fig. 4 D). This effect was mediated by ET-R activation, as shown by complete inhibition with bosentan (Fig. 4 D). EGFP+ cells that migrated in the presence of ET-1 displayed typical migratory morphology, with small cell bodies and thin cell processes oriented toward the ET-1 source (Fig. 4 C3). Interestingly, SVZ explants showed high levels of PDGF expression compared with pure OPC cultures used for the agarose drop assays (supplemental Fig. S2A,B, available at www.jneurosci.org as supplemental material), indicating that the migratory effects of ET-1 were supported by high levels of endogenous PDGF in the SVZ.
Figure 4.

ET-1 is a chemotaxic and chemokinetic signal for OPCs. SVZ explants from CNP-EGFP mice were cocultured with BSA-soaked (B1) and ET-1-soaked (B2) heparin beads. EGFP+ cells preferentially migrate toward ET-1 (B2) compared with BSA beads (B1). The arrows in A, C1, and C2 point to the position of the soaked bead. The dotted lines indicate edges of SVZ explants. Higher magnification images are shown in C1 and C2. C3, Image from boxed area in C2. Migratory cells with ET-1 (B2, C2, C3) displayed bipolar morphology distinct from nonmigratory cells with BSA (B1, C1). D, Quantification of cell migration. Histogram illustrates quantification of cell migration in SVZ explants, shown as average ± SEM of migration area (in square micrometers). Nine explants from three different experiments were analyzed. *p < 0.01. E, F, Cell migration was studied using microchemotaxis chambers (Boyden chambers). E1–E3, Representative images of rat OPCs that migrated through the filters under conditions shown, assessed by nuclear staining with DAPI. ET-1 promotes migration in the presence of PDGF, compared with PDGF alone. E4, Quantification of cell migration. Different combinations of PDGF and ET-1 were used in lower and upper chambers to measure migration. Unpaired t test compared with N1/N1, *p < 0.05, **p < 0.01. F, Dose–response curve showing effect of ET-1 on OPC migration, with maximal effect of ET-1 at 200 nm. Data represent averages ± SEM of quadruplicate determinations from three different experiments.
To determine whether ET-1 promoted OPC migration by enhanced chemokinesis, we used Boyden microchemotaxis chambers. After 12 h, PDGF added to either bottom or top chamber significantly enhanced OPC migration (Fig. 4 E). ET-1 added to the bottom chamber significantly increased PDGF-induced migration in a dose-dependent manner; bosentan inhibited this effect (Fig. 4 E,F). ET-1 enhanced OPC migration by chemokinesis, shown by the significantly increased number of cells found in the chamber filters after ET-1 was added to the top chamber (Fig. 4 E). Results of three different migration assays indicate that ET-1 promotes OPC migration by enhanced chemotaxis and chemokinesis.
Astrocytes synthesize and release ET-1 to stimulate OPC migration
Oligodendrocytes develop in close proximity to astrocytes. Several growth factors and signaling cues derived from astrocytes, including PDGF, are central regulators of oligodendrocyte development (Raff et al., 1988; Sasahara et al., 1992; Richardson et al., 2000). We investigated whether astrocytes, in addition to vascular endothelial cells, synthesize and release ETs to stimulate OPC migration.
We analyzed ET-1 immunoreactivity in SVZ of P8 CNP-EGFP transgenic mice, to define possible cellular sources of ET-1. GFAP+ astrocytes in the anterior SVZ (aSVZ) and dorsolateral SVZ (dlSVZ) demonstrated ET-1 immunoreactivity (Fig. 5 A,B). In aSVZ (Fig. 5 C) and dlSVZ (data not shown), ET-1 expression was detected in vascular endothelial growth factor receptor 2+ (VEGF-R2+) endothelial cells, which displayed morphology distinct from GFAP+ET-1+ astrocytes (Fig. 5 A–C). Notably, no ET-1 immunoreactivity was observed in SVZ CNP-EGFP+ progenitor cells (Fig. 5 A–C).
Figure 5.
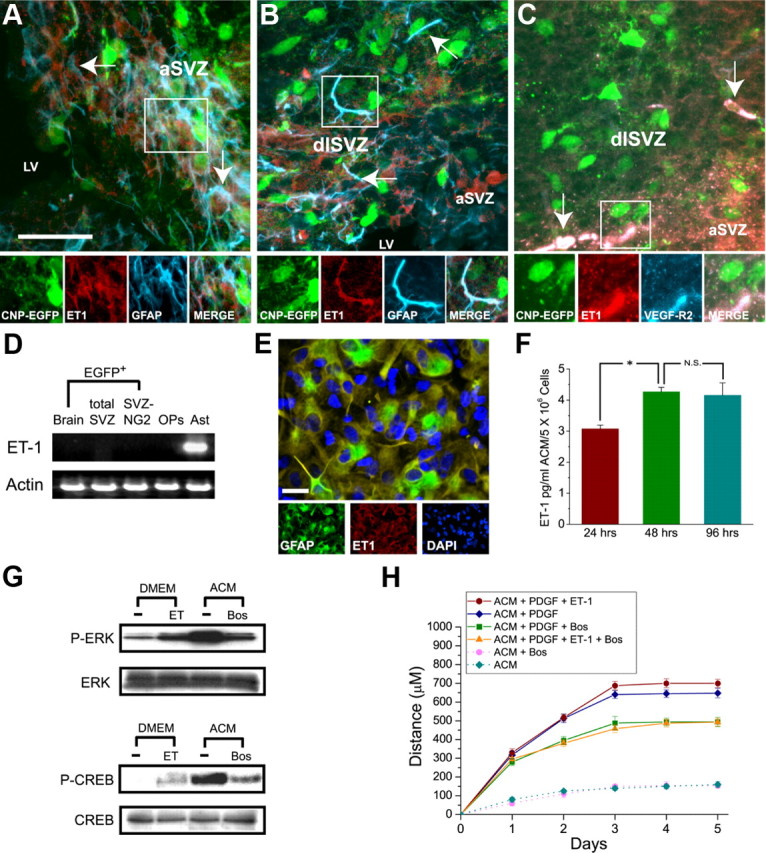
Astrocytes synthesize and release ET-1 that can activate ET-Rs in OPCs. A–C, Astrocytes and endothelial cells of SVZ synthesize ET-1 in situ. Double immunostaining of coronal brain slices from CNP-EGFP mice with anti-ET-1, and anti-GFAP or anti-VEGF-R2 antibodies: ET-1 immunoreactivity is present in astrocytes of aSVZ and dlSVZ (A, B) and endothelial cells of aSVZ (C). The arrows point at examples of cells immunopositive for ET-1. D, RT-PCR analysis for ET-1 mRNAs shows cultured astrocytes (Ast) express ET-1 mRNA. No ET-1 mRNA was detected in total brain EGFP+ cells, SVZ EGFP+ cells, or double-sorted NG2+/EGFP+ SVZ cells FACS-purified from CNP-EGFP transgenic mice. ET-1 mRNA was absent from cultured OPs (2 d culture). E, ET-1 is expressed in cultured astrocytes. Anti-ET-1 staining (red) demonstrates expression in GFAP+ (green) astrocytes. Cell nuclei were stained with DAPI (blue). Scale bar, 30 μm. F, ACM contains ET-1. ET-1 concentrations were measured by enzyme immunometric assays at different times in culture. ET-1 concentration increased between 24 and 48 h, but no further after 48 h (*p < 0.05; N.S., not significant). Data are the mean ± SEM of duplicate measurements from five independent cultures. G, ET-1 in ACM can activate ET-Rs in cultured OPCs. OPCs were stimulated for 10 min with ET-1 (100 nm) or ACM, in the presence or absence of ET-R pan-antagonist bosentan (Bos) (2 μm). Total cell lysates were analyzed by Western blot using anti-P-ERK or anti-P-CREB antibodies. H, ET-1 present in ACM stimulates OPC migration. Cell migration was quantified as described for Figure 3, except ACM replaced Sato medium. With PDGF, ACM effect on OPC migration resembled that of ET-1 (Fig. 3). Bosentan, with or without ET-1, inhibited ACM effects on OPC migration in the presence of PDGF (ACM + PDGF + Bos vs ACM + PDGF; significant differences were observed between days 2 and 5, Student's t test, *p < 0.05).
Consistent with this, RT-PCR analysis showed that cultured astrocytes (Ast) expressed ET-1 mRNA, whereas no ET-1 transcripts were detected in FACS-purified CNP-EGFP+ cells isolated from total brain (GFP), SVZ, or double-sorted NG2+EGFP+ progenitor cells (NG2) (Fig. 5 D). ET-1 mRNA was also absent from cultured rat OPs (Fig. 5 D). Immunostaining of astrocyte cultures with anti-ET-1 antibody confirmed expression in GFAP+ cells (Fig. 5 E).
With close anatomical relationships between astrocytes and oligodendrocytes during development, we asked whether exogenous ET-1 effects on OPC migration could be reproduced by astrocyte-derived ET-1. We prepared ACM and demonstrated by enzyme immunometric assays that ET-1 was present at ∼3 pg/ml (5 × 10⁶ cells/flask) after 24 h, and increased to 4.5 pg/ml after 48 h (Fig. 5 F). ET-1 concentration had not increased further after 96 h in culture (Fig. 5 F). ET-1 present in ACM functionally activated ET-Rs in cultured OPCs, and ACM induced ERK1/2 and CREB phosphorylation in cultured OPCs (Fig. 5 G). Phosphorylation of both proteins was significantly prevented by the ET-R pan-antagonist bosentan (Fig. 5 G), indicating that astrocytes synthesize and release ET-1 that acts on ET-Rs on OPCs.
Effects of astrocyte-derived ET-1 on OPC migration were analyzed by the agarose drop assay. Cell migration was quantified as in Figure 3, except Sato medium was replaced by ACM. Tested alone, ACM induced little OPC migration (maximum distance was ∼100 μm) (Fig. 5 H). However, in the presence of PDGF (10 ng/ml), ACM enhanced the growth factor effect on OPC migration (Fig. 5 H). This finding, together with those in Figure 3, indicates that ET-1 could be the endogenous factor in ACM responsible for the effects on PDGF-induced OPC migration.
This hypothesis was confirmed when bosentan did not modify migration of OPCs cultured with ACM alone (Fig. 5 H) but prevented ACM-induced OPC migration in the presence of PDGF (Fig. 5 H). Adding exogenous ET-1 to ACM did not further stimulate PDGF-induced migration (Fig. 5 H), and under these conditions bosentan prevented the effects of ACM (Fig. 5 H). Thus, ET-1 present in ACM stimulates OPC migration by activating ET-Rs, supporting the idea of ET-1 as an astrocyte-to-oligodendrocyte signal modulating oligodendrocyte development.
PDGF induces expression of ET-Rs in culture
As mentioned above, ET-1 alone did not promote OPC migration of purified OPC cultures but significantly enhanced stimulatory effects of PDGF. To further investigate the mechanism by which growth factors could affect the response of OPCs to ET-1, we analyzed the expression of ET-Rs after growth factor treatment. As shown in Figure 6 A, both PDGF and FGF significantly increased ET-R expression in OPCs after 2 d in vitro. PDGF increased the expression of ETA-R and of ETB-Rs by twofold and threefold, respectively (Fig. 6 B,C). ACM has been shown to contain PDGF (Gard et al., 1995); interestingly both ET-Rs showed low levels of expression in OPCs cultured for 2 d in ACM alone, and further addition of PDGF was necessary to increase their expression (Fig. 6 A–C). We also asked whether ET-1 could maintain the expression of the PDGFR-α and sustain the migrating response of OPCs to PDGF through this mechanism. Our results show that ET-1 did not modify the levels of expression of PDGFR-α in cultured OPCs (supplemental Fig. S2C,D, available at www.jneurosci.org as supplemental material).
Figure 6.

ET-R expression is regulated by growth factors. A, ETA-R and ETB-R expression is increased by growth factors. Cultured OPCs were grown in the N1 medium alone or in the presence of 10 ng/ml bFGF, 1 ng/ml or 10 ng/ml PDGF; or in astrocyte-conditioned medium with or without 10 ng/ml PDGF. Cell lysates were prepared after 2 DIV and were analyzed by Western blot using anti-ETA-R antibody or anti-ETB-R antibody. B, C, Densitometric analysis demonstrated a peak twofold increase of ETA-R with 10 ng/ml PDGF, and a threefold increase for ETB-R in the same condition. Data were normalized to actin. D, Cultured OPCs were stimulated with 100 nm ET-1 and/or 10 ng/ml PDGF for 15 min; total cell lysates were analyzed by Western blot using anti-P-ERK or antibody for total ERK. E, Similar results were obtained in three independent experiments; representative Western blots are shown; averages ± SEM from three to four independent samples are shown. *Significantly different from control (Student's t test, p < 0.01).
PDGF-induced upregulation of ET-Rs also enhanced ERK phosphorylation. Figure 6 D shows that both PDGF and ET-1 enhanced ERK phosphorylation and, when tested together, displayed an additive effect (Fig. 6 E). Together, these results indicate that growth factors that modulate OPC development also enhance the response of these cells to ET-1 by increasing ET-R expression and function.
ET-1 prevents OPC differentiation
To study possible effects of ET-1 on oligodendrocyte lineage progression, purified OPCs were plated on coverslips in DMEM-N1 medium containing PDGF and T3, with or without ET-1 (200 nm), and immunostained with anti-O4 and anti-O1 antibodies at different times in culture (Fig. 7 A,C). After 48 h treatment, ET-1 did not modify the percentage of O4+ preoligodendrocytes (Fig. 7 B) but significantly decreased the percentage of O1+ oligodendrocytes to 55 ± 5% of controls (Fig. 7 B). Conversely, at 96 h in vitro, ET-1 induced a significant increase in the percentage of O4+ cells (145 ± 15% of control) (Fig. 7 D) but still decreased the percentage of O1+ cells (63 ± 5% of control) (Fig. 7 D). The ET-R pan-antagonist bosentan blocked ET-1 effects on oligodendrocyte lineage progression (Fig. 7 D), confirming a receptor-mediated effect of ET-1 on OPC differentiation. Consistent with our data (Fig. 3 C,D), ET-1 treatment did not modify the percentage of A2B5+ cells (data not shown). ET-1 treatment did not affect cell survival, as demonstrated by the low percentage of TUNEL+ and caspase-3+ cells (∼6 and ∼12%, in untreated and ET-1 treated cells, respectively) (data not shown). These results indicate that ET-1 affects OPC differentiation by delaying transition from the O4+ to the more differentiated O1+ stage.
Figure 7.

ET-1 delays OPC differentiation. A–D, ET-1 delays oligodendrocyte lineage progression, preventing O4–O1 transition. Differentiation was assessed by immunostaining with antibodies against O4 and O1 (green), at 48 h (A, B) or 96 h (C, D) after plating. Cells were counterstained with DAPI (blue). The ratio of O4+ or O1+ (B, D) cells/DAPI+ nuclei was calculated in each field. B, ET-1 decreased the percentage of O1+ cells to 55 ± 5% of controls after 48 h. No significant change occurred in percentage of O4+ cells. D, At 96 h, ET-1 induced an increase in the percentage of O4+ cells (145 ± 15% of control) and a decrease in O1+ cells (63 ± 5% of control). Percentages of O4+ and O1+ cells in controls were 35 ± 4 and 15 ± 3 at 48 h; 25 ± 4 and 46 ± 5 at 96 h, respectively. O1+ cells treated with ET-1 are less branched, compared with O1+ cells in control conditions at 96 h (C, bottom panels). D, ET-1 effects on oligodendrocyte lineage progression were prevented by ET-R pan-antagonist bosentan (1 μm). Data are expressed as mean percentage ± SEM of four independent experiments performed in triplicate. *Significantly different from control (Student's t test, p < 0.05). Scale bar: A, C, 50 μm. E, ET-1 inhibits expression of myelin-related proteins in OPCs differentiating in culture. Western blot analysis of CNP and MBP expression. Cells were collected for protein extraction for CNP and MBP expression analysis at times indicated. Total cell lysates were analyzed by Western blot using monoclonal antibodies against CNP or MBP, with β-actin for loading control. F, Densitometric analysis demonstrated that ET-1 inhibited CNP and MBP expression. Data were normalized to actin; averages + SEM from three to four independent samples are shown. *Significantly different from control (Student's t test, p < 0.01). Results indicate that ET-1 induces a less differentiated phenotype in oligodendrocytes.
To further examine ET-1 effects on oligodendrocyte differentiation, we investigated myelin protein expression by Western blot. Analysis of CNP and MBP expression revealed that ET-1 significantly reduced MBP and CNP levels at all times in culture (Fig. 7 E,F). These results support the conclusion that ET-1 induces a less differentiated phenotype in the oligodendrocyte lineage. In summary, in vitro findings strongly suggest that ET-1 plays a regulatory role in oligodendrocyte development, promoting migration and decreasing differentiation rate of OPCs.
ET-R activation sustains OPC migration and decreases differentiation in organotypic slice cultures
The results above, plus the finding that OPCs express ET-Rs in tissue, raise the question of whether OPCs respond to ET-1 in situ. We established conditions that maintained morphological integrity and viability of postnatal (P4–P5) organotypic slices isolated from CNP-EGFP mouse brain (supplemental Fig. S3, available at www.jneurosci.org as supplemental material). The slices contained numerous CNP-EGFP+ progenitors in the SVZ (supplemental Fig. S3A–D, available at www.jneurosci.org as supplemental material), a large percentage of which displayed bipolar, migratory morphology (supplemental Fig. S3B, available at www.jneurosci.org as supplemental material). Activated caspase-3 staining determined the number of apoptotic SVZ CNP-EGFP+ cells in slices cultured in different percentages of FBS (supplemental Fig. S3C–E, available at www.jneurosci.org as supplemental material), obtaining the lowest apoptosis rate with 5.0% FBS. Based on this finding, slice cultures from CNP-EGFP mouse brains were maintained in medium containing 5.0% FBS.
We used time-lapse multiphoton imaging to establish baseline properties of migrating OPCs in these slice cultures. The four-dimensional series, taken mainly in the SVZ, were analyzed to reconstruct the distance and direction of migration. Cell migration patterns resembled those described for GFP-retrovirally labeled SVZ neural progenitors (Kakita and Goldman, 1999). In dorsolateral SVZ, nearly 40% of CNP-EGFP+ cell bodies showed displacement under control conditions. CNP-EGFP+ cells within dorsal and lateral SVZ did not move consistently in one direction. Rather, the direction of individual cells varied, with frequent angular turns (supplemental Movie 1, available at www.jneurosci.org as supplemental material). Figure 8 A depicts the migration pathways. Each circle represents the position of each individual cell body at 6 min intervals; the length of the line connecting two adjacent points represents the relative velocity of the cell at that time. Figure 8 B shows migration rates of 18 migrating progenitor cells in control experiments. The average calculated velocity of cell migration (23 ± 8 μm/h) approximated that previously reported for DiI-labeled cells in slice preparations (O'Rourke et al., 1992, 1995; Fishell et al., 1993; Komuro and Rakic, 1995, 1998; Phelps et al., 1996), in which average velocity of migrating cells was 10–25 μm/h. Cells did not migrate with uniform velocities, but in a saltatory manner, with the direction of cell body movement foreshadowed by the direction in which the leading process extended. Most CNP-EGFP+ cells that did not migrate during the observation period showed active extensions and retractions of cytoplasmic processes (Fig. 8 C; supplemental Movie 1, available at www.jneurosci.org as supplemental material).
Figure 8.

Endogenous ET sustains OPC migration in situ. A, B, Baseline migration of OPCs in SVZ, determined by time-lapse microscopy. A, Reconstruction of migratory paths of EGFP+ cells observed over 4 h. Each point represents the cell body position of individual cells recorded at 6 min intervals. The intersegmental distance represents the relative velocity of the cell at that moment. The arrows indicate direction of initial movement. B, Migration rates of 18 selected migrating progenitor cells in control experiments. Each color represents an individual cell. Note that cells migrated in a saltatory manner. C, Effects of anti-ET-1 antibodies on OPC migration. Still images of EGFP+ cells are shown from time-lapse confocal microscopy. The red arrows indicate starting positions of migrating cells; the green lines represent distance migrated after 2 h. Progenitors were bipolar with leading and trailing processes. In slices treated with anti-ET-1, the number of migrating cells was reduced, indicating that ET-R activation by endogenous ET-1 is required for OPCs in SVZ in situ. D, Average percentage of migrating cells under different culture conditions. Percentage of migrating cells was calculated relative to total number of EGFP+ cells in the imaged field. Bosentan (1 μm) and anti-ET-1 (1:500) significantly reduced the percentage of cells migrating in the SVZ (**p < 0.01). Control anti-IgG antibody had no effect (N.S., not significant). Effects of anti-ET-1 were reversed by 50 nm ET-1, but ET-1 (50 nm) alone did not modify overall number or velocity of migrating cells. Data are the mean ± SEM of three independent experiments. The number of cells analyzed was 40–200.
Having established baseline properties of migrating CNP-EGFP+ progenitors in the SVZ, we analyzed the role of endogenous ET-1 by blocking its actions with ET-R pan-antagonist bosentan. As shown in Figure 8 D and in supplemental Movie 2 (available at www.jneurosci.org as supplemental material), organotypic brain slices treated with 1 μm bosentan contained fewer migrating cells than control slices. In bosentan-treated slices, the average velocity of the few migrating cells did not differ significantly from the control (Table 2). The effects of bosentan on migration are not attributable to increased cell death, as assessed by activated caspase-3 immunostaining (supplemental Fig. S3E, available at www.jneurosci.org as supplemental material). Thus, bosentan inhibits CNP-EGFP+ progenitor migration by preventing activation of ET-Rs most likely by endogenous ET-1.
Table 2.
Blocking ET-Rs or endogenous ET-1 does not alter cell migration velocity
| Culture condition | Average (μm/h) | Velocity number of cells |
|---|---|---|
| Control | 22.6 ± 9 | 110 |
| Bosentan | 18.5 ± 6 | 8 |
| Anti-ET-1 | 19.8 ± 7 | 19 |
| IgG | 23.3 ± 5 | 17 |
| Anti-ET-1 + ET-1 | 26.7 ± 8 | 36 |
| ET-1 | 20.3 ± 10 | 40 |
The effects of ET-1/ET-R perturbation on the migration velocity of SVZ CNP-EGFP+ progenitors were studied using multiphoton microscopy in organotypic slices from P5 brain. No significant differences in average migration velocity were observed between any of the culture conditions tested (Student's t test).
To further define the physiological effects of endogenous ET-1, we added anti-ET-1 antibodies to the slice cultures. Anti-ET-1 antibodies also inhibited progenitor migration (Fig. 8 D), and similar to the effects observed with bosentan, average velocity of the few migrating CNP-EGFP+ cells was not modified by the antibody treatment (Table 2). Control experiments treating organotypic slices with a nonimmune IgG antibody demonstrated no difference in number or average velocity of migrating progenitors (Fig. 8 D, Table 2). Anti-ET-1 antibody treatment did not affect CNP-EGFP+ cell survival in the slices (supplemental Fig. S3D, available at www.jneurosci.org as supplemental material). Effects of anti-ET-1 antibodies were completely reversed by coincubating the slices with 50 nm ET-1 (Fig. 8 D). Under these conditions, the number and average velocity of migrating progenitors did not differ significantly from controls (Fig. 8 D, Table 2), indicating saturation of anti-ET-1 antibody by exogenously added ET-1. At this concentration, ET-1 alone did not significantly increase the number of migrating CNP-EGFP+ cells or their average migration velocity (Fig. 8 D, Table 2).
ET-R activation also affected OPC differentiation in slice cultures. P8 organotypic slices cultured for 4 d with 1 μm bosentan doubled the percentage of total EGFP+ cells expressing the mature oligodendrocyte marker CC1, compared with controls (CC1+/EGFP+ cells, percentage of total EGFP+, 17 ± 3% bosentan vs 33 ± 5% control; p < 0.01, Student's t test) (Fig. 9 A). Western blot analysis of MBP and CNP expression in P8 brain cultures confirmed that blocking ET-Rs with the ET-R antagonist de-repressed OPC differentiation, as demonstrated by enhanced MBP and CNP expression (Fig. 9 B,D). This effect was age dependent; bosentan had no significant effects in P13 brain cultures (Fig. 9 C,D). These analyses in organotypic slice cultures support the notion that activation of ET-Rs by endogenous ET-1 contributes to maintaining migration and reducing differentiation of OPCs in postnatal brain.
Figure 9.
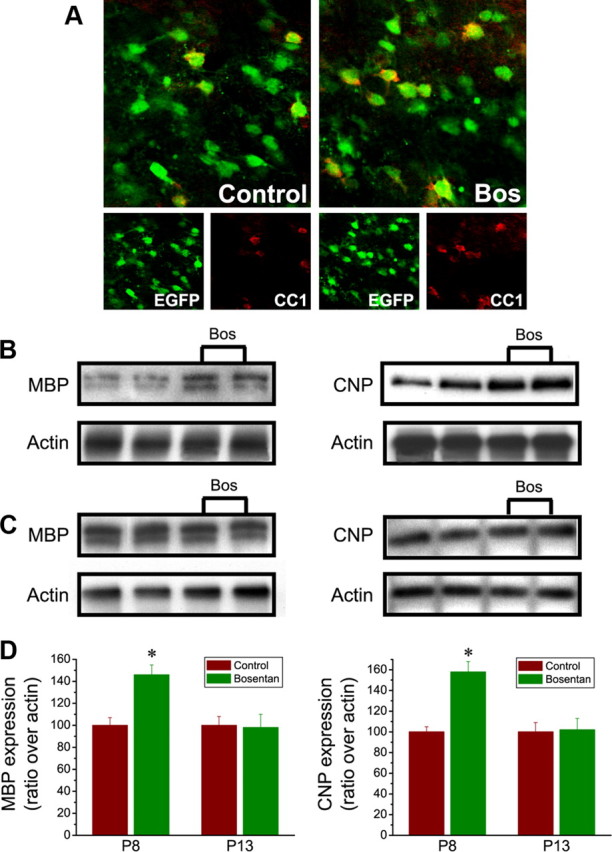
Endogenous endothelin modulates OPC differentiation in situ. Organotypic slice cultures from P8 (A, B) or P13 (C) CNP-EGFP mice were cultured for 4 d in the presence or absence of bosentan (1 μm). A, Confocal images show colabeling of CNP-EGFP with antibodies to CC1 in subcortical white matter. Scale bar, 50 μm. Total protein extracts from each corpus callosum were analyzed by Western blot using monoclonal antibodies against MBP (B, C, left panels) or CNP (B, C, right panels). Duplicate samples from separate organotypic cultures are shown for each age and culture condition. P8 cultures treated with bosentan, but not P13 slices, show higher levels of MBP and CNP expression. β-Actin (bottom panels) demonstrates equal loading of protein samples. MBP and CNP expression levels were normalized with actin to compare bosentan-treated with control samples. D, Densitometric analysis demonstrates that bosentan increased CNP and MBP expression in P8 slices, but not P13 brains. Results are expressed in arbitrary units as averages + SEM from four independent experiments performed in duplicate. *p < 0.01, Student's t test.
Discussion
The present study identifies ET-1 as a novel signal for oligodendrocyte development promoting migration and inhibiting differentiation. Our analysis indicates that this peptide is an important mediator of astrocyte–oligodendrocyte signaling regulating OPC migration and maturation, and may therefore be a particularly important element of myelin repair strategies.
ET-R expression and regulation in the oligodendrocyte lineage
Despite widespread distribution of ET system components throughout the brain (Nambi et al., 1990; Davenport and Morton, 1991; Kuwaki et al., 1997), their function in oligodendrocyte lineage cells was unexplored. In the present study, we show that ET-Rs are expressed from the immature OP stage to the differentiated phenotype. Constitutive expression of ETB-Rs early in development, and upregulation of ETA-Rs under culture conditions inducing OPC differentiation, suggest that ETB-R is expressed in multipotential progenitors and neural stem cells, whereas ETA-R is upregulated in committed progenitors and their differentiated progenies. Consistent with this, in vivo studies have localized ETB-Rs to progenitor cells in the ventricular zone of the embryonic brain and in the adult brain SVZ (Tsaur et al., 1997; Shinohara et al., 2004).
The CNP-EGFP mouse (Yuan et al., 2002) was used to define expression and regulation of ET-Rs in cells of oligodendrocyte lineage in vivo. We found that ETA-R and ETB-R are expressed in CNP-EGFP+ progenitors of the postnatal SVZ, which generate oligodendrocytes in vivo and in culture (Aguirre and Gallo, 2004; Aguirre et al., 2007). ET-R expression in CNP-EGFP+ progenitors in vivo indicates that they are potential cellular targets of ET-1 physiological effects in the brain.
ET-R expression in cultured OPCs allowed us to investigate their functionality and define intracellular signal transduction pathways associated with these receptors. Consistent with findings in different cell types (Lazarini et al., 1996; Cazaubon et al., 1997; Tabernero et al., 1998; Schinelli et al., 2001), ET-1 stimulation of OPCs increased ERK and CREB phosphorylation in a time-dependent manner. ET-1 effects were blocked by the pan-antagonists bosentan and PD142893, and partially inhibited by selective ETA-R and ETB-R antagonists JKC-301 and IRL-1038, singly applied, indicating that ET-1 activated both receptor subtypes. The greater inhibition attained with the ETB-R antagonist indicates that ET-1 predominantly activates ETB-R in OPCs.
Biological effects of ET-1 on oligodendrocyte development
ETs are potent mitogens for various cell types, including neural crest cells (Reid et al., 1996; Opdecamp et al., 1998), astrocytes (Supattapone et al., 1989; Stanimirovic et al., 1995; Teixeira et al., 2000; Koyama et al., 2003; Gadea et al., 2008), and Schwann cells (Kuwaki et al., 1997; Berti-Mattera et al., 2001; Jessen and Mirsky, 2002). We investigated whether ET-1 is an OPC mitogen but found no significant effect (Table 1). This indicates that (1) mitogenic effects of ET-1 are not generalized to all glia, and (2) biological effects on OPCs are directed to specific aspects of their development. We recently demonstrated that ET-1-induced astrocyte proliferation activates the JNK/c-Jun pathway (Gadea et al., 2008). Our present findings demonstrate that, consistent with the lack of ET-1 effect on OPC proliferation, this pathway is not activated by ET-1 in OPCs.
To explore migratory responses of OPCs to ET-1, we used an agarose drop assay and confirmed that PDGF and FGF-2 support OPC migration (Armstrong et al., 1990; Simpson and Armstrong, 1999). ET-1 alone did not promote OPC migration; however, it enhanced PDGF- and FGF-2-stimulated migration without altering survival. Blockage of the additive effects of ET-1 on OPC migration by the antagonists bosentan, JKC-301, and IRL-1038 indicates that the peptide effects were ET-R mediated.
Other migration assays confirmed that ET-1 exerts a chemotactic effect on OPCs and uncovered an ET-1 effect on OPC chemokinesis. This result obtained in isolated OPCs was consistent with results in organotypic slice cultures demonstrating that endogenous ET-1 supports OPC migration within the SVZ (see below).
The precise mechanism by which ET-1 enhances growth factor-induced OPC migration in culture is not known. ET-1 might alter integrin subunit expression (Milner et al., 1996; Blaschuk et al., 2000) or modify PSA-NCAM (polysialic acid–neural cell adhesion molecule) levels (Wang et al., 1994) in OPCs to promote a migratory phenotype. Alternatively, ET-Rs activation might overcome signals inhibiting OPC migration, such as Tenascin-C (ffrench-Constant et al., 1988; Frost et al., 1996). Here, we were able to demonstrate that ET-R expression can be modulated by growth factors and that ET-1 can further enhance PDGF-induced ERK phosphorylation without affecting PDGFR-α expression. These results suggest that one of the mechanisms for ET-1 actions might be the facilitation of the intracellular pathways activated by these growth factors in OPCs.
The ET-1-induced changes on OPC differentiation are consistent with its effects on cell migration: ET-1 promotes a more migratory and less mature phenotype. OPCs lose migratory potential as they differentiate into myelinating oligodendrocytes. O4+ preoligodendrocytes, less motile than OPCs, retain migratory capacity (Armstrong et al., 1990; Warrington et al., 1993; Barral-Moran et al., 2003), whereas more mature galactocerebroside (O1+) oligodendrocytes are nonmigratory (Orentas and Miller, 1998). We found that ET-1 affects oligodendrocyte differentiation by preventing transition from the O4+ to the more mature O1+ stage, without affecting the A2B5+–O4+ stage transition. Compatible with the idea that ET-1 delays oligodendrocyte differentiation, ET-1 decreases CNP and MBP expression. In conclusion, consistent with ET-R expression throughout the oligodendrocyte lineage, ET-1 apparently exerts multiple effects on OPCs and their progeny.
To investigate the functional role of ET-Rs in OPCs in a system preserving cellular organization and cell–cell connections, we established a preparation for studying SVZ progenitor migration in situ. Monitoring CNP-EGFP+ progenitor migration in the SVZ, we determined that (1) blockage of ET-Rs in organotypic slice cultures with pan-antagonists reduced the number of migrating progenitors; (2) anti-ET-1 antibodies prevented CNP-EGFP+ progenitor migration, an effect reversed by coincubation with ET-1; and (3) neither treatment modified the average velocity of the few OPCs still able to migrate. We hypothesize that cells migrating in the presence of ET-R antagonist or anti-ET-1 antibodies may express different levels of ET-Rs, or may experience variable levels of endogenous ET-1 and/or growth factors in their microenvironment. We were unable to discriminate between chemotactic and chemokinetic effects of ET-1 in slice cultures, but the presence of astrocytes and endothelial cells expressing ET-1 within the SVZ (see discussion below) strongly suggests that endogenous ET-1 sustains OPC migration within the SVZ by enhancing chemokinesis. The fact that endogenous ET-1 promotes CNP-EGFP+ progenitor migration in the same system indicated that growth factors (e.g., PDGF) necessary for migration are present in the cultured slices. This was confirmed by direct Western blot analysis of PDGF expression in purified OPC cultures and SVZ explants, demonstrating much higher growth factor levels in the explant cultures.
Endogenous ET-1 affects OPC differentiation also in organotypic slice cultures, as demonstrated by enhanced myelin protein expression after treatment with ET-R antagonist bosentan. The effectiveness of bosentan in younger brain tissue (P8), and lack of effect at later stages (P13) when oligodendrocyte maturation has progressed, is consistent with findings in cell cultures that ET-1 affects lineage progression at the O4+–O1+ transition, during earlier stages of oligodendrocyte development.
Cellular sources of ET-1 in the developing brain
A possible source of ET-1 in the brain is astrocytes, which synthesize ETs during proliferation, maturation, and reactive gliosis (MacCumber et al., 1990; Ehrenreich et al., 1991; Nie and Olsson, 1996). Astrocytes secrete other factors important in oligodendrocyte development, such as PDGF (Dutly and Schwab, 1991; Silberstein et al., 1996). Our data (see also Gadea et al., 2008) indicate that astrocytes synthesize ET-1 in culture and in vivo and that ET-1 contained in ACM can activate ET-Rs and promote OPC migration. Interestingly, ET-1 also stimulates PDGF expression in cultured astrocytes (supplemental Fig. S2A,B, available at www.jneurosci.org as supplemental material). Given the proximity of astrocytes and OPCs during development (Lim and Alvarez-Buylla, 1999), we propose that ET-1 is an astrocyte signal that regulates oligodendrocyte progenitor migration and maturation during postnatal brain development.
Another possible cellular source of ETs in developing brain is capillary endothelial cells in which the ET-1 precursor preproendothelin-1 is expressed. Vascular cells are located within CNS germinal zones throughout postnatal life (Breier et al., 1992; Capela and Temple, 2002; Louissaint et al., 2002) and form a niche for neural stem cells in the SVZ (Palmer et al., 2000). Recently, it was reported that a soluble factor secreted by endothelial cells maintained self-renewal of neural stem cells and inhibited differentiation (Shen et al., 2004). The identity of this/these factor(s) is unknown, but one could speculate that ET-1 fits this physiological role.
Conclusions
Our study reports a novel dual role for ET-1 as a regulator of OPC migration and differentiation, and identifies ET-1 as one factor that controls early developmental stages in the oligodendrocyte lineage by maintaining OPCs in a migratory and undifferentiated state. Although ET-1 likely acts in concert with other cellular signals modulating OPC development, our results demonstrate ET-1 selectivity between different types of glia, strongly promoting proliferation in astrocytes and Schwann cells (Berti-Mattera et al., 2001; Gadea et al., 2008), but not in OPCs (present study).
Our findings on ET-1 and OPC development are also important for remyelination strategies in CNS demyelinating diseases. Although OPCs are present in demyelinated regions, it is still undetermined why their differentiation and ability to remyelinate are inhibited in diseases such as multiple sclerosis (Prineas et al., 2001). It is possible to speculate that ET-1 released by reactive astrocytes in demyelinating lesions might contribute to inhibition of OPC differentiation. Nevertheless, our data show that ET-1, in concert with other cellular factors, could promote repopulation of demyelinating lesions by preventing differentiation and stimulating migration of OPCs. Therefore, targeted manipulation of the ET-1/ET-R system should be part of a comprehensive strategy leading to remyelination and repair.
Footnotes
This work was supported by National Institutes of Health Grants R21 NS048238 (V.G.), R01 NS051852-01 (T.F.H.), and P30 HD40677 (V.G.), and by National Multiple Sclerosis Grant RG4019 (V.G.). A.G. was supported by a postdoctoral fellowship from the National Multiple Sclerosis Society. We thank Stacey Roundtree and Dr. Li-Jin Chew for maintenance of the CNP-EGFP mice; W. King (The William and Shirley Howard Hematopoietic Stem Cell Laboratory, Children's Research Institute, Children's National Medical Center, Washington, DC) and Dr. A. Popratiloff (Center for Microscopy and Image Analysis, George Washington University School of Medicine, Washington, DC) for assistance with FACS sorting and acquisition of confocal images, respectively. We thank Drs. Li-Jin Chew and David Panchision for discussion and critical comments on this manuscript.
References
- Aguirre A, Gallo V. Postnatal neurogenesis and gliogenesis in the olfactory bulb from NG2-expressing progenitors of the subventricular zone. J Neurosci. 2004;24:10530–10541. doi: 10.1523/JNEUROSCI.3572-04.2004. [DOI] [PMC free article] [PubMed] [Google Scholar]
- Aguirre A, Rizvi TA, Ratner N, Gallo V. Overexpression of the epidermal growth factor receptor confers migratory properties to nonmigratory postnatal neural progenitors. J Neurosci. 2005;25:11092–11106. doi: 10.1523/JNEUROSCI.2981-05.2005. [DOI] [PMC free article] [PubMed] [Google Scholar]
- Aguirre A, Dupree JL, Mangin JM, Gallo V. A functional role for EGFR signaling in myelination and remyelination. Nat Neurosci. 2007;10:990–1002. doi: 10.1038/nn1938. [DOI] [PubMed] [Google Scholar]
- Aguirre AA, Chittajallu R, Belachew S, Gallo V. NG2-expressing cells in the subventricular zone are type C-like cells and contribute to interneuron generation in the postnatal hippocampus. J Cell Biol. 2004;165:575–589. doi: 10.1083/jcb.200311141. [DOI] [PMC free article] [PubMed] [Google Scholar]
- Armstrong RC, Harvath L, Dubois-Dalcq ME. Type 1 astrocytes and oligodendrocyte-type 2 astrocyte glial progenitors migrate toward distinct molecules. J Neurosci Res. 1990;27:400–407. doi: 10.1002/jnr.490270319. [DOI] [PubMed] [Google Scholar]
- Baertschi AJ, Pedrazzini T, Aubert JF, Roatti A, Pence RA. Role of endothelin receptor subtypes in volume-stimulated ANF secretion. Am J Physiol Heart Circ Physiol. 2000;278:493–499. doi: 10.1152/ajpheart.2000.278.2.H493. [DOI] [PubMed] [Google Scholar]
- Barral-Moran MJ, Calaora V, Vutskits L, Wang C, Zhang H, Durbec P, Rougon G, Kiss JZ. Oligodendrocyte progenitor migration in response to injury of glial monolayers requires the polysialic neural cell-adhesion molecule. J Neurosci Res. 2003;72:679–690. doi: 10.1002/jnr.10627. [DOI] [PubMed] [Google Scholar]
- Baumann N, Pham-Dinh D. Biology of oligodendrocyte and myelin in the mammalian central nervous system. Physiol Rev. 2001;81:871–927. doi: 10.1152/physrev.2001.81.2.871. [DOI] [PubMed] [Google Scholar]
- Belachew S, Chittajallu R, Aguirre AA, Yuan X, Kirby M, Anderson S, Gallo V. Postnatal NG2 proteoglycan-expressing progenitor cells are intrinsically multipotent and generate functional neurons. J Cell Biol. 2003;161:169–186. doi: 10.1083/jcb.200210110. [DOI] [PMC free article] [PubMed] [Google Scholar]
- Berti-Mattera LN, Harwalkar S, Hughes B, Wilkins PL, Almhanna K. Proliferative and morphological effects of endothelins in Schwann cells: roles of p38 mitogen-activated protein kinase and Ca2+-independent phospholipase A2. J Neurochem. 2001;79:1136–1148. doi: 10.1046/j.1471-4159.2001.00642.x. [DOI] [PubMed] [Google Scholar]
- Blaschuk KL, Frost EE, ffrench-Constant C. The regulation of proliferation and differentiation in oligodendrocyte progenitor cells by alphaV integrins. Development. 2000;127:1961–1969. doi: 10.1242/dev.127.9.1961. [DOI] [PubMed] [Google Scholar]
- Breier G, Albrecht U, Sterrer S, Risau W. Expression of vascular endothelial growth factor during embryonic angiogenesis and endothelial cell differentiation. Development. 1992;114:521–532. doi: 10.1242/dev.114.2.521. [DOI] [PubMed] [Google Scholar]
- Brennan A, Dean CH, Zhang AL, Cass DT, Mirsky R, Jessen KR. Endothelins control the timing of Schwann cell generation in vitro and in vivo. Dev Biol. 2000;227:545–557. doi: 10.1006/dbio.2000.9887. [DOI] [PubMed] [Google Scholar]
- Capela A, Temple S. LeX/ssea-1 is expressed by adult mouse CNS stem cells, identifying them as nonependymal. Neuron. 2002;35:865–875. doi: 10.1016/s0896-6273(02)00835-8. [DOI] [PubMed] [Google Scholar]
- Cazaubon S, Chaverot N, Romero IA, Girault JA, Adamson P, Strosberg AD, Couraud PO. Growth factor activity of endothelin-1 in primary astrocytes mediated by adhesion-dependent and -independent pathway. J Neurosci. 1997;15:6203–6212. doi: 10.1523/JNEUROSCI.17-16-06203.1997. [DOI] [PMC free article] [PubMed] [Google Scholar]
- Clozel M, Breu V, Gray GA, Kalina B, Löffler BM, Burri K, Cassal JM, Hirth G, Müller M, Neidhart W. Pharmacological characterization of bosentan, a new potent orally active nonpeptide endothelin receptor antagonist. J Pharmacol Exp Ther. 1994;270:228–235. [PubMed] [Google Scholar]
- Davenport AP, Morton AJ. Binding sites for 125I ET-1, ET-2, ET-3 and vasoactive intestinal contractor are present in adult rat brain and neurone-enriched primary cultures of embryonic brain cells. Brain Res. 1991;554:278–285. doi: 10.1016/0006-8993(91)90201-6. [DOI] [PubMed] [Google Scholar]
- Dupin E, Glavieux C, Vaigot P, Le Douarin NM. Endothelin 3 induces the reversion of melanocytes to glia through a neural crest-derived glial-melanocytic progenitor. Proc Natl Acad Sci U S A. 2000;97:7882–7887. doi: 10.1073/pnas.97.14.7882. [DOI] [PMC free article] [PubMed] [Google Scholar]
- Dupin E, Real C, Glavieux-Pardanaud C, Vaigot P, Le Douarin NM. Reversal of developmental restrictions in neural crest lineages: transition from Schwann cells to glial-melanocytic precursors in vitro. Proc Natl Acad Sci U S A. 2003;100:5229–5233. doi: 10.1073/pnas.0831229100. [DOI] [PMC free article] [PubMed] [Google Scholar]
- Durieu-Trautmann O, Fédérici C, Créminon C, Foignant-Chaverot N, Roux F, Claire M, Strosberg AD, Couraud PO. Nitric oxide and endothelin secretion by brain microvessel endothelial cells: regulation by cyclic nucleotides. J Cell Physiol. 1993;155:104–111. doi: 10.1002/jcp.1041550114. [DOI] [PubMed] [Google Scholar]
- Dutly F, Schwab ME. Neurons and astrocytes influence the development of purified O-2A progenitor cells. Glia. 1991;4:559–571. doi: 10.1002/glia.440040603. [DOI] [PubMed] [Google Scholar]
- Ehrenreich H, Anderson RW, Ogino Y, Rieckmann P, Costa T, Wood GP, Coligan JE, Kehrl JH, Fauci AS. Selective autoregulation of endothelins in primary astrocyte cultures: endothelin receptor-mediated potentiation of endothelin-1 secretion. New Biol. 1991;3:135–141. [PubMed] [Google Scholar]
- Ehrenreich H, Oldenburg J, Hasselblatt M, Herms J, Dembowski C, Löffler BM, Brück W, Kamrowski-Kruck H, Gall S, Sirén AL, Schilling L. Endothelin B receptor-deficient rats as a subtraction model to study the cerebral endothelin system. Neuroscience. 1999;91:1067–1075. doi: 10.1016/s0306-4522(98)00663-0. [DOI] [PubMed] [Google Scholar]
- Eisenbarth GS, Walsh FS, Nirenberg M. Monoclonal antibody to a plasma membrane antigen of neurons. Proc Natl Acad Sci U S A. 1979;76:4913–4917. doi: 10.1073/pnas.76.10.4913. [DOI] [PMC free article] [PubMed] [Google Scholar]
- ffrench-Constant C, Miller RH, Burne JF, Raff MC. Evidence that migratory oligodendrocyte-type-2 astrocyte (O-2A) progenitor cells are kept out of the rat retina by a barrier at the eye-end of the optic nerve. J Neurocytol. 1988;1:13–25. doi: 10.1007/BF01735374. [DOI] [PubMed] [Google Scholar]
- Fishell G, Mason CA, Hatten ME. Dispersion of neural progenitors within the germinal zones of the forebrain. Nature. 1993;362:636–638. doi: 10.1038/362636a0. [DOI] [PubMed] [Google Scholar]
- Frost E, Kiernan BW, Faissner A, ffrench-Constant C. Regulation of oligodendrocyte precursor migration by extracellular matrix: evidence for substrate-specific inhibition of migration by tenascin-C. Dev Neurosci. 1996;18:266–273. doi: 10.1159/000111416. [DOI] [PubMed] [Google Scholar]
- Frost EE, Milner R, ffrench-Constant C. Migration assays for oligodendrocyte precursor cells. Methods Mol Biol. 2000;139:265–278. doi: 10.1385/1-59259-063-2:265. [DOI] [PubMed] [Google Scholar]
- Gadea A, Schinelli S, Gallo V. Endothelin-1 regulates astrocyte proliferation and reactive gliosis through JNK/c-Jun activation. J Neurosci. 2008;28:2394–2408. doi: 10.1523/JNEUROSCI.5652-07.2008. [DOI] [PMC free article] [PubMed] [Google Scholar]
- Gallo V, Armstrong RC. Developmental and growth factor-induced regulation of nestin in oligodendrocyte lineage cells. J Neurosci. 1995;15:394–406. doi: 10.1523/JNEUROSCI.15-01-00394.1995. [DOI] [PMC free article] [PubMed] [Google Scholar]
- Gallo V, Zhou JM, McBain CJ, Wright P, Knutson PL, Armstrong RC. Oligodendrocyte progenitor cell proliferation and lineage progression are regulated by glutamate receptor-mediated K+ channel block. J Neurosci. 1996;16:2659–2670. doi: 10.1523/JNEUROSCI.16-08-02659.1996. [DOI] [PMC free article] [PubMed] [Google Scholar]
- Gard AL, Burrell MR, Pfeiffer SE, Rudge JS, Williams WC., 2nd Astroglial control of oligodendrocyte survival mediated by PDGF and leukemia inhibitory factor-like protein. Development. 1995;121:2187–2197. doi: 10.1242/dev.121.7.2187. [DOI] [PubMed] [Google Scholar]
- Ghiani CA, Eisen AM, Yuan X, DePinho RA, McBain CJ, Gallo V. Neurotransmitter receptor activation triggers p27(Kip1)and p21(CIP1) accumulation and G1 cell cycle arrest in oligodendrocyte progenitors. Development. 1999;126:1077–1090. doi: 10.1242/dev.126.5.1077. [DOI] [PubMed] [Google Scholar]
- Haydar TF, Bambrick LL, Krueger BK, Rakic P. Organotypic slice cultures for analysis of proliferation, cell death, and migration in the embryonic neocortex. Brain Res Brain Res Protoc. 1999;4:425–437. doi: 10.1016/s1385-299x(99)00033-1. [DOI] [PubMed] [Google Scholar]
- Jessen KR, Mirsky R. Signals that determine Schwann cell identity. J Anat. 2002;200:367–376. doi: 10.1046/j.1469-7580.2002.00046.x. [DOI] [PMC free article] [PubMed] [Google Scholar]
- Kakita A, Goldman JE. Patterns and dynamics of SVZ cell migration in the postnatal forebrain: monitoring living progenitors in slice preparations. Neuron. 1999;23:461–472. doi: 10.1016/s0896-6273(00)80800-4. [DOI] [PubMed] [Google Scholar]
- Komuro H, Rakic P. Dynamics of granule cell migration: a confocal microscopic study in acute cerebellar slice preparations. J Neurosci. 1995;15:1110–1120. doi: 10.1523/JNEUROSCI.15-02-01110.1995. [DOI] [PMC free article] [PubMed] [Google Scholar]
- Komuro H, Rakic P. Distinct modes of neuronal migration in different domains of developing cerebellar cortex. J Neurosci. 1998;18:1478–1490. doi: 10.1523/JNEUROSCI.18-04-01478.1998. [DOI] [PMC free article] [PubMed] [Google Scholar]
- Koyama Y, Ishibashi T, Hayata K, Baba A. Endothelins modulate dibutyryl cAMP-induced stellation of cultured astrocytes. Brain Res. 1993;600:81–88. doi: 10.1016/0006-8993(93)90404-b. [DOI] [PubMed] [Google Scholar]
- Koyama Y, Yoshioka Y, Matsuda T, Baba A. Focal adhesion kinase is required for endothelin-induced cell cycle progression of cultured astrocytes. Glia. 2003;43:185–189. doi: 10.1002/glia.10240. [DOI] [PubMed] [Google Scholar]
- Kuwaki T, Kurihara H, Cao WH, Kurihara Y, Unekawa M, Yazaki Y, Kumada M. Physiological role of brain endothelin in the central autonomic control: from neuron to knockout mouse. Prog Neurobiol. 1997;51:545–579. doi: 10.1016/s0301-0082(96)00063-9. [DOI] [PubMed] [Google Scholar]
- Lahav R, Ziller C, Dupin E, Le Douarin NM. Endothelin 3 promotes neural crest cell proliferation and mediates a vast increase in melanocyte number in culture. Proc Natl Acad Sci U S A. 1996;95:3892–3897. doi: 10.1073/pnas.93.9.3892. [DOI] [PMC free article] [PubMed] [Google Scholar]
- Lahav R, Dupin E, Lecoin L, Glavieux C, Champeval D, Ziller C, Le Douarin NM. Endothelin 3 selectively promotes survival and proliferation of neural crest-derived glial and melanocytic precursors in vitro. Proc Natl Acad Sci U S A. 1998;95:14214–14219. doi: 10.1073/pnas.95.24.14214. [DOI] [PMC free article] [PubMed] [Google Scholar]
- Lazarini F, Strosberg AD, Couraud PO, Cazaubon SM. Coupling of ETB endothelin receptor to mitogen-activated protein kinase stimulation and DNA synthesis in primary cultures of rat astrocytes. J Neurochem. 1996;66:459–465. doi: 10.1046/j.1471-4159.1996.66020459.x. [DOI] [PubMed] [Google Scholar]
- Lim DA, Alvarez-Buylla A. Interaction between astrocytes and adult subventricular zone precursors stimulates neurogenesis. Proc Natl Acad Sci U S A. 1999;96:7526–7531. doi: 10.1073/pnas.96.13.7526. [DOI] [PMC free article] [PubMed] [Google Scholar]
- Louissaint A, Jr, Rao S, Leventhal C, Goldman SA. Coordinated interaction of neurogenesis and angiogenesis in the adult songbird brain. Neuron. 2002;34:945–960. doi: 10.1016/s0896-6273(02)00722-5. [DOI] [PubMed] [Google Scholar]
- MacCumber MW, Ross CA, Snyder SH. Endothelin in brain: receptors, mitogenesis, and biosynthesis in glial cells. Proc Natl Acad Sci U S A. 1990;87:2359–2363. doi: 10.1073/pnas.87.6.2359. [DOI] [PMC free article] [PubMed] [Google Scholar]
- McCarthy KD, de Vellis J. Preparation of separate astroglial and oligodendroglial cell cultures from rat cerebral tissue. J Cell Biol. 1980;85:890–902. doi: 10.1083/jcb.85.3.890. [DOI] [PMC free article] [PubMed] [Google Scholar]
- Miller RH. Regulation of oligodendrocyte development in the vertebrate CNS. Prog Neurobiol. 2002;67:451–467. doi: 10.1016/s0301-0082(02)00058-8. [DOI] [PubMed] [Google Scholar]
- Milner R, ffrench-Constant C. A developmental analysis of oligodendroglial integrins in primary cells: changes in alpha v-associated beta subunits during differentiation. Development. 1994;120:3497–3506. doi: 10.1242/dev.120.12.3497. [DOI] [PubMed] [Google Scholar]
- Milner R, Edwards G, Streuli C, ffrench-Constant C. A role in migration for the alpha V beta 1 integrin expressed on oligodendrocyte precursors. J Neurosci. 1996;16:7240–7252. doi: 10.1523/JNEUROSCI.16-22-07240.1996. [DOI] [PMC free article] [PubMed] [Google Scholar]
- Milner R, Anderson HJ, Rippon RF, McKay JS, Franklin RJ, Marchionni MA, Reynolds R, ffrench-Constant C. Contrasting effects of mitogenic growth factors on oligodendrocyte precursor cell migration. Glia. 1997;19:85–90. doi: 10.1002/(sici)1098-1136(199701)19:1<85::aid-glia9>3.0.co;2-9. [DOI] [PubMed] [Google Scholar]
- Nakagomi S, Kiryu-Seo S, Kiyama H. Endothelin-converting enzyme and endothelin receptor B messenger RNA are expressed in different neural cell species and these messenger RNAs are coordinately induced in neurons and astrocytes respectively following nerve injury. Neuroscience. 2000;101:441–449. doi: 10.1016/s0306-4522(00)00345-6. [DOI] [PubMed] [Google Scholar]
- Nambi P, Pullen M, Feuerstein G. Identification of endothelin receptors in various regions of rat brain. Neuropeptides. 1990;16:195–199. doi: 10.1016/0143-4179(90)90062-4. [DOI] [PubMed] [Google Scholar]
- Nataf V, Grapin-Botton A, Champeval D, Amemiya A, Yanagisawa M, Le Douarin NM. The expression patterns of endothelin-A receptor and endothelin 1 in the avian embryo. Mech Dev. 1998;75:145–149. doi: 10.1016/s0925-4773(98)00079-3. [DOI] [PubMed] [Google Scholar]
- Ngoka LC, Gross ML. Location of alkali metal binding sites in endothelin A selective receptor antagonists, cyclo(d-Trp-d-Asp-Pro-d-Val-Leu) and cyclo(d-Trp-d-Asp-Pro-d-Ile-Leu), from multistep collisionally activated decompositions. J Mass Spectrom. 2000;35:265–276. doi: 10.1002/(SICI)1096-9888(200002)35:2<265::AID-JMS946>3.0.CO;2-#. [DOI] [PubMed] [Google Scholar]
- Nie XJ, Olsson Y. Endothelin peptides in brain diseases. Rev Neurosci. 1996;7:177–186. doi: 10.1515/revneuro.1996.7.3.177. [DOI] [PubMed] [Google Scholar]
- Noble M. Precursor cell transitions in oligodendrocyte development. J Cell Biol. 2000;148:839–842. doi: 10.1083/jcb.148.5.839. [DOI] [PMC free article] [PubMed] [Google Scholar]
- Noble M, Murray K, Stroobant P, Waterfield MD, Riddle P. Platelet-derived growth factor promotes division and motility and inhibits premature differentiation of the oligodendrocyte/type-2 astrocyte progenitor cell. Nature. 1988;333:560–562. doi: 10.1038/333560a0. [DOI] [PubMed] [Google Scholar]
- Opdecamp K, Kos L, Arnheiter H, Pavan WJ. Endothelin signalling in the development of neural crest-derived melanocytes. Biochem Cell Biol. 1998;76:1093–1099. [PubMed] [Google Scholar]
- Orentas DM, Miller RH. Regulation of oligodendrocyte development. Mol Neurobiol. 1998;18:247–259. doi: 10.1007/BF02741302. [DOI] [PubMed] [Google Scholar]
- O'Rourke NA, Dailey ME, Smith SJ, McConnell SK. Diverse migratory pathways in the developing cerebral cortex. Science. 1992;258:299–302. doi: 10.1126/science.1411527. [DOI] [PubMed] [Google Scholar]
- O'Rourke NA, Sullivan DP, Kaznowski CE, Jacobs AA, McConnell SK. Tangential migration of neurons in the developing cerebral cortex. Development. 1995;121:2165–2176. doi: 10.1242/dev.121.7.2165. [DOI] [PubMed] [Google Scholar]
- Palmer TD, Willhoite AR, Gage FH. Vascular niche for adult hippocampal neurogenesis. J Comp Neurol. 2000;425:479–494. doi: 10.1002/1096-9861(20001002)425:4<479::aid-cne2>3.0.co;2-3. [DOI] [PubMed] [Google Scholar]
- Phelps PE, Barber RP, Vaughn JE. Nonradial migration of interneurons can be experimentally altered in spinal cord slice cultures. Development. 1996;122:2013–2022. doi: 10.1242/dev.122.7.2013. [DOI] [PubMed] [Google Scholar]
- Pozas E, Pascual M, Nguyen Ba-Charvet KT, Guijarro P, Sotelo C, Chédotal A, Del Río JA, Soriano E. Age-dependent effects of secreted Semaphorins 3A, 3F, and 3E on developing hippocampal axons: in vitro effects and phenotype of Semaphorin 3A (−/−) mice. Mol Cell Neurosci. 2001;18:26–43. doi: 10.1006/mcne.2001.0999. [DOI] [PubMed] [Google Scholar]
- Prineas JW, Kwon EE, Cho ES, Sharer LR, Barnett MH, Oleszak EL, Hoffman B, Morgan BP. Immunopathology of secondary-progressive multiple sclerosis. Ann Neurol. 2001;50:646–657. doi: 10.1002/ana.1255. [DOI] [PubMed] [Google Scholar]
- Raff MC, Lillien LE, Richardson WD, Burne JF, Noble MD. Platelet-derived growth factor from astrocytes drives the clock that times oligodendrocyte development in culture. Nature. 1988;333:562–565. doi: 10.1038/333562a0. [DOI] [PubMed] [Google Scholar]
- Reid K, Turnley AM, Maxwell GD, Kurihara Y, Kurihara H, Bartlett PF, Murphy M. Multiple roles for endothelin in melanocyte development: regulation of progenitor number and stimulation of differentiation. Development. 1996;122:3911–3919. doi: 10.1242/dev.122.12.3911. [DOI] [PubMed] [Google Scholar]
- Richardson WD, Smith HK, Sun T, Pringle NP, Hall A, Woodruff R. Oligodendrocyte lineage and the motor neuron connexion. Glia. 2000;29:136–142. doi: 10.1002/(sici)1098-1136(20000115)29:2<136::aid-glia6>3.0.co;2-g. [DOI] [PubMed] [Google Scholar]
- Ripodas A, de Juan JA, Roldán-Pallarés M, Bernal R, Moya J, Chao M, López A, Fernández-Cruz A, Fernández-Durango R. Localization of endothelin-1 mRNA expression and immunoreactivity in the retina and optic nerve from human and porcine eye. Evidence for endothelin-1 expression in astrocytes. Brain Res. 2001;912:137–143. doi: 10.1016/s0006-8993(01)02731-7. [DOI] [PubMed] [Google Scholar]
- Rogers SD, Peters CM, Pomonis JD, Hagiwara H, Ghilardi JR, Mantyh PW. Endothelin B receptors are expressed by astrocytes and regulate hypertrophy in the normal and injured CNS. Glia. 2003;41:180–190. doi: 10.1002/glia.10173. [DOI] [PubMed] [Google Scholar]
- Rogister B, Ben-Hur T, Dubois-Dalcq M. From neural stem cells to myelinating oligodendrocytes. Mol Cell Neurosci. 1999;14:287–300. doi: 10.1006/mcne.1999.0790. [DOI] [PubMed] [Google Scholar]
- Rossi NF. Regulation of vasopressin secretion by ETA and ETB receptors in compartmentalized rat hypothalamo-neurohypophysial explants. Am J Physiol Endocrinol Metab. 2004;286:535–541. doi: 10.1152/ajpendo.00344.2003. [DOI] [PubMed] [Google Scholar]
- Sasahara A, Kott JN, Sasahara M, Raines EW, Ross R, Westrum LE. Platelet-derived growth factor B-chain-like immunoreactivity in the developing and adult rat brain. Dev Brain Res. 1992;68:41–53. doi: 10.1016/0165-3806(92)90246-s. [DOI] [PubMed] [Google Scholar]
- Schinelli S, Zanassi P, Paolillo M, Wang H, Feliciello A, Gallo V. Stimulation of endothelin B receptors in astrocytes induces cAMP response element-binding protein phosphorylation and c-fos expression via multiple mitogen-activated protein kinase signaling pathways. J Neurosci. 2001;21:8842–8853. doi: 10.1523/JNEUROSCI.21-22-08842.2001. [DOI] [PMC free article] [PubMed] [Google Scholar]
- Shen Q, Goderie SK, Jin L, Karanth N, Sun Y, Abramova N, Vincent P, Pumiglia K, Temple S. Endothelial cells stimulate self-renewal and expand neurogenesis of neural stem cells. Science. 2004;304:1338–1340. doi: 10.1126/science.1095505. [DOI] [PubMed] [Google Scholar]
- Shinohara H, Udagawa J, Morishita R, Ueda H, Otani H, Semba R, Kato K, Asano T. Gi2 signaling enhances proliferation of neural progenitor cells in the developing brain. J Biol Chem. 2004;279:41141–41148. doi: 10.1074/jbc.M406721200. [DOI] [PubMed] [Google Scholar]
- Silberstein FC, De Simone R, Levi G, Aloisi F. Cytokine-regulated expression of platelet-derived growth factor gene and protein in cultured human astrocytes. J Neurochem. 1996;66:1409–1417. doi: 10.1046/j.1471-4159.1996.66041409.x. [DOI] [PubMed] [Google Scholar]
- Simonson MS. Endothelins: multifunctional renal peptides. Physiol Rev. 1993;73:375–411. doi: 10.1152/physrev.1993.73.2.375. [DOI] [PubMed] [Google Scholar]
- Simpson PB, Armstrong RC. Intracellular signals and cytoskeletal elements involved in oligodendrocyte progenitor migration. Glia. 1999;26:22–35. [PubMed] [Google Scholar]
- Sirén AL, Knerlich F, Schilling L, Kamrowski-Kruck H, Hahn A, Ehrenreich H. Differential glial and vascular expression of endothelins and their receptors in rat brain after neurotrauma. Neurochem Res. 2000;25:957–969. doi: 10.1023/a:1007552408463. [DOI] [PubMed] [Google Scholar]
- Sohn J, Natale J, Chew LJ, Belachew S, Cheng Y, Aguirre A, Lytle J, Nait-Oumesmar B, Kerninon C, Kanai-Azuma M, Kanai Y, Gallo V. Identification of Sox17 as a transcription factor that regulates oligodendrocyte development. J Neurosci. 2006;26:9722–9735. doi: 10.1523/JNEUROSCI.1716-06.2006. [DOI] [PMC free article] [PubMed] [Google Scholar]
- Sommer I, Schachner M. Monoclonal antibodies (O1 to O4) to oligodendrocyte cell surfaces: an immunocytological study in the central nervous system. Dev Biol. 1981;83:11–327. doi: 10.1016/0012-1606(81)90477-2. [DOI] [PubMed] [Google Scholar]
- Stallcup WB, Beasley L. Bipotential glial precursor cells of the optic nerve express the NG2 proteoglycan. J Neurosci. 1987;7:2737–2744. doi: 10.1523/JNEUROSCI.07-09-02737.1987. [DOI] [PMC free article] [PubMed] [Google Scholar]
- Stanimirovic DB, Ball R, Mealing G, Morley P, Durkin JP. The role of intracellular calcium and protein kinase C in endothelin-stimulated proliferation of rat type I astrocytes. Glia. 1995;15:119–130. doi: 10.1002/glia.440150204. [DOI] [PubMed] [Google Scholar]
- Stevens B, Porta S, Haak LL, Gallo V, Fields RD. Adenosine: a neuron-glial transmitter promoting myelination in the CNS in response to action potentials. Neuron. 2002;36:855–868. doi: 10.1016/s0896-6273(02)01067-x. [DOI] [PMC free article] [PubMed] [Google Scholar]
- Supattapone S, Simpson AW, Ashley CC. Free calcium rise and mitogenesis in glial cells caused by endothelin. Biochem Biophys Res Commun. 1989;165:1115–1122. doi: 10.1016/0006-291x(89)92718-6. [DOI] [PubMed] [Google Scholar]
- Tabernero A, Stewart HJ, Jessen KR, Mirsky R. The neuron-glia signal beta neuregulin induces sustained CREB phosphorylation on Ser-133 in cultured rat Schwann cells. Mol Cell Neurosci. 1998;10:309–322. doi: 10.1006/mcne.1998.0662. [DOI] [PubMed] [Google Scholar]
- Teixeira A, Chaverot N, Strosberg AD, Cazaubon S. Differential regulation of cyclin D1 and D3 expression in the control of astrocyte proliferation induced by endothelin-1. J Neurochem. 2000;74:1034–1040. doi: 10.1046/j.1471-4159.2000.0741034.x. [DOI] [PubMed] [Google Scholar]
- Tsai HH, Frost E, To V, Robinson S, ffrench-Constant C, Geertman R, Ransohoff RM, Miller RH. The chemokine receptor CXCR2 controls positioning of oligodendrocyte precursors in developing spinal cord by arresting their migration. Cell. 2002;110:373–383. doi: 10.1016/s0092-8674(02)00838-3. [DOI] [PubMed] [Google Scholar]
- Tsaur ML, Wan YC, Lai FP, Cheng HF. Expression of B-type endothelin receptor gene during neural development. FEBS Lett. 1997;417:208–212. doi: 10.1016/s0014-5793(97)01295-7. [DOI] [PubMed] [Google Scholar]
- Varani J, Orr W, Ward PA. A comparison of the migration patterns of normal and malignant cells in two assay systems. Am J Pathol. 1978;90:159–172. [PMC free article] [PubMed] [Google Scholar]
- Wang C, Rougon G, Kiss JZ. Requirement of polysialic acid for the migration of the O-2A glial progenitor cell from neurohypophyseal explants. J Neurosci. 1994;14:4446–4457. doi: 10.1523/JNEUROSCI.14-07-04446.1994. [DOI] [PMC free article] [PubMed] [Google Scholar]
- Warrington AE, Barbarese E, Pfeiffer SE. Differential myelinogenic capacity of specific developmental stages of the oligodendrocyte lineage upon transplantation into hypomyelinating hosts. J Neurosci Res. 1993;34:1–13. doi: 10.1002/jnr.490340102. [DOI] [PubMed] [Google Scholar]
- Wellings RP, Corder R, Doherty AM, Vane JR. Antagonism of renal and systemic responses to endothelin-1 infusion with PD 145065. Eur J Pharmacol. 1994;256:201–204. doi: 10.1016/0014-2999(94)90246-1. [DOI] [PubMed] [Google Scholar]
- Widdowson PS, Kirk CN. Characterization of [125I]-endothelin-1 and [125I]-BQ3020 binding to rat cerebellar endothelin receptors. Br J Pharmacol. 1996;118:2126–2130. doi: 10.1111/j.1476-5381.1996.tb15652.x. [DOI] [PMC free article] [PubMed] [Google Scholar]
- Yuan X, Eisen AM, McBain CJ, Gallo V. A role for glutamate and its receptors in the regulation of oligodendrocyte development in cerebellar tissue slices. Development. 1998;125:2901–2914. doi: 10.1242/dev.125.15.2901. [DOI] [PubMed] [Google Scholar]
- Yuan X, Chittajallu R, Belachew S, Anderson S, McBain CJ, Gallo V. Expression of the green fluorescent protein in the oligodendrocyte lineage: a transgenic mouse for developmental and physiological studies. J Neurosci Res. 2002;70:529–545. doi: 10.1002/jnr.10368. [DOI] [PubMed] [Google Scholar]