


Abstract
The rates of dissociation of three non-intercalative unsymmetrical cyanine dyes, BEBO, BETO and BOXTO from mixed-sequence DNA have been studied with the DNA either free in solution or in confining porous agarose gels. The properties of the new dyes were compared to the related intercalating dyes BO, BO-PRO, TO-PRO and YO-PRO. With DNA in solution, BEBO dissociates more slowly than the monovalent BO and interestingly also more slowly than the divalent dye BO-PRO. Similarly, both BETO and BOXTO exhibit considerably slower dissociation than TO-PRO. The new dyes show biexponential dissociation kinetics in mixed-sequence DNA. The average rate of dissociation increases with increasing ionic strength, but the salt dependence of the dissociation is weaker than for the corresponding intercalating dye. The rate of dye-dissociation decreases by a factor of about 105 in the gel. The rates for the dyes generally follow the pattern that we observe with the DNA in free solution, however a more accentuated stabilization was seen for intercalators than for groove-bound dyes. The results show that, in particular, BOXTO is a promising candidate as a preferentially groove-bound DNA-stain with a large enhancement of the fluorescence quantum yield upon binding to DNA, and which exhibits slow and salt-insensitive dissociation compared to corresponding intercalative dyes.
INTRODUCTION
Fluorescence microscopy of individual DNA molecules has proved to be a useful tool for studies of polymer dynamics both in free solution (1) and in confining media such as porous gels and designed molecular mazes (2,3). Since DNA is not fluorescent by itself, the microscopy approach requires staining of the DNA with dye molecules which exhibit an enhanced quantum yield of fluorescence when bound to DNA. Cyanine dyes such as oxazole yellow (YO) and thiazole orange (TO) have been used successfully, since their typical 1000-fold increase in quantum yield upon binding gives good image-contrast (4). The dimeric forms YOYO and TOTO are particularly useful because of their strongly enhanced binding-affinity (5). Dimerization is expected to reduce (diffusion-controlled) association by a factor of only about two, so the order of magnitude increase in affinity can be ascribed to a strongly reduced rate of dissociation compared to the monomeric forms. This effect in the dimeric dyes is especially crucial in microscopy studies of individual DNA polymers, where the DNA is initially stained at comparatively high DNA and dye concentrations and then rapidly diluted to the low polymer concentrations typical of single molecule observations. Dilution is usually done by use of dye-free buffer in order to reduce the background even more, and since the dye-binding is reversible, dissociation will occur under the non-equilibrium conditions in the microscopy experiments. The time available for observation can therefore be considerably extended (from seconds to tens of minutes) by the use of slowly dissociating dyes.
A disadvantage with the dimeric forms YOYO and TOTO is that their high charge (tetravalent) makes their dissociation rates quite sensitive to ionic strength. The dimeric YOYO has been used successfully to monitor the electrophoretic motion of DNA in agarose gels for tens of minutes in Tris–borate buffers with an approximate concentration of 50 mM of monovalent ions (6). However, if the salt concentration was increased to 200 mM (monovalent ions) or if divalent calcium ions were used at a concentration of 5 mM, the YOYO dye was observed to dissociate within seconds (7), which rendered microscopy observations impossible. This is a crucial limitation when salt concentration is being used as a parameter to modulate electrostatic interactions by screening, or when divalent ions are used for instance as gelling agents in reversible gels for preparative electrophoresis (7). An additional potential disadvantage of cyanine dyes based on the YO and TO chromophores is that they bind to DNA by intercalation. The insertion between the base pairs leads to an extension of the DNA helix, essentially by one base pair per bound dye. Thus, with a typical degree of staining, using one dye per 5 bp, the stained DNA polymer may be almost 20% longer than the native form. Sometimes this problem can be overcome by considering the stained DNA to be a new type of polymer with new properties different from native DNA (8), an approach which has been successful in combined microscopy and spectroscopy studies of DNA polymer dynamics in gel electrophoresis (6). The uncertainty in contour length that is associated with the use of reversibly intercalating dyes may be less acceptable in studies of hydrodynamic and flexibility properties of DNA in solution (1), where the polymer length is a crucible variable.
It is thus desirable to find DNA-stains which do not extend the DNA helix and which do not exhibit the strong salt concentration sensitivity in the dissociation rates typical for the tetravalent cationic dyes, but that still are only slowly dissociating from DNA and exhibit a strong increase in the fluorescence quantum yield. We have chosen to approach this problem by developing groove-binding cyanine dyes (9) [see accompanying paper (10)], where a strong fluorescence enhancement results from hindered intra-dye rotational motion upon DNA binding and where the DNA helix does not undergo lengthening due to the non-intercalative mode of binding (9). These dyes have an advantage over other groove-binding dyes such as DAPI and Hoechst 33258 in that the latter dyes exhibit rather moderate enhancements in quantum yield when bound to DNA, typically 20- to 40-fold (11,12), and that they absorb in the near-UV region of the visible spectrum where background from scattering may become extensive in microscopy. Here we compare the dissociation properties of three new groove-binding cyanine dyes with those of intercalating counterparts, which are based on the same chromophores, either TO or BO. The two related dyes BOXTO and BETO both have the same cyanine chromophore as TO, but BOXTO has an additional benzoxazole group in 6-position and BETO has an additional benzothiazole group in 6-position (Fig. 1). It has been shown that both BETO and BOXTO exhibit groove-binding to mixed sequence DNA [see accompanying paper (10)]. The third dye BEBO has the same chromophore as the parent dye BO, but has an extension of the structure with a benzothiazole moiety in the 6-position. The binding mode of BEBO is dependent on the DNA sequence: in poly(dA-dT)2 it binds in the groove whereas it intercalates in GC-sequences. The groove-binding mode dominates in mixed sequence DNA (9).
Figure 1.

The structures of three new dyes BEBO, BETO and BOXTO and the dyes compared in the study BO, BO-PRO, TO-PRO and YO-PRO.
We have focused on the rates of dissociation in this study since this parameter is the most crucial under non-equilibrium staining applications. A main theme was to compare the dissociation of the new groove-bound dyes with the related intercalating cyanine dyes BO, BO-PRO, TO-PRO and YO-PRO (Fig. 1). In order to cover two important environments for microscopy studies of polymer dynamics, the dissociation process was studied in both free solution by a stopped-flow approach with fluorescence detection, and in confining porous agarose gels by an electrophoretic approach based on repetitive scanning of the fluorescence intensity of zones of stained DNA undergoing migration.
MATERIALS AND METHODS
Dyes
BEBO, BETO, BOXTO were synthesized as described (9,10), BO, TO-PRO and YO-PRO were obtained from Molecular Probes. The concentrations of the dye and DNA solutions were determined by absorbance measurements on a Cary 4B Bio-UV–Vis spectrophotometer, using determined extinction coefficients (see Supplementary Material).
Dissociation in gel
Electrophoretic dissociation was performed with monodisperse double-stranded DNA from bacteriophage T5 (103 kb) from Sigma–Aldrich, 0.25 or 0.50 µg for each sample in a total sample volume of 24 µl. The mol fraction of dye/DNA base pair was 0.1. Bromophenoleblue (0.25 wt%) together with Ficoll (15 wt%) dissolved in TBE buffer was used as a loading additive (4.0 µl/sample). Agarose gels (1 wt% obtained as a dry powder from Sigma–Aldrich) were made with TBE buffer (50 mM in boric acid, 50 mM in Tris, 1.25 mM in EDTA in deionized water, pH 8.2) and run in submarine electrophoresis cells. A constant electric field was generated using platinum electrodes (7.5 V/cm). The electrophoresis buffer was circulated in order to ensure constant temperature during the electrophoresis. An average increase in the current by 13% show an increase of 4°C above ambient during the electrophoresis, i.e. a temperature of 24°C. Typically each gel was scanned eight times per experiment after 5–210 min, with a FluorImager gel scanner 595 (Molecular Dynamics) exciting the samples at 488 nm or at 514 nm (depending on the absorbance maximum of the dye) and using longpass emission filters with 530 and 570 nm cut-off, respectively. Quantification of the fluorescence intensity of the DNA bands was performed in ImageQuant 5.0. The natural logarithm of the ratio between the fluorescence intensity at different times and the initial fluorescence [ln (I/I0)] was plotted against time. The dissociation half-times (t1/2) of each dye were calculated using the slope (k) of the plot (t1/2 = ln 2/k).
Dissociation in free solution
The kinetics of dye dissociation from unconfined DNA was monitored by the technique of SDS capture and was studied at seven different salt concentrations (NaCl between 6 and 205 mM), using a computer-controlled stopped-flow instrument from Bio Logic. A Hg (Xe) lamp was coupled to a monochromator to excite the samples at their absorbance maximum (see Supplementary Material) and two longpass emission filters were used to measure the decline in the emission of light (500 nm cut-off for BEBO, BO and BO-PRO and 540 nm cut-off for BETO, BOXTO and TO-PRO). The measurements were made at 25°C. Due to the amounts of DNA that are required for stopped-flow studies (5 ml with a DNA concentration of 200 µM base), these could not be carried out on T5 DNA. Since polydispersity is not a problem in this technique, we used calf thymus DNA (ctDNA), and alternating poly(dA-dT)2. ctDNA was obtained as a sodium salt from Sigma–Aldrich and has an average size of 6000 base pairs. Synthetic alternating copolymer [poly(dA-dT)2] with an approximate average size of 6200 bp was purchased from Amersham Biosciences. Both the DNA-dye samples and the SDS samples (0.03 g SDS/ml buffer) were prepared in a phosphate buffer (5 mM, pH 6.9). Volumes of an aqueous solution of NaCl (2 M) were added to obtain the desired salt concentration both in the DNA and in the SDS samples. The DNA samples (mixing ratio of dye and DNA was 1 mol dye/ 30 mol bases) were allowed to equilibrate for at least 60 min before the experiments. After equilibrium was reached, the dissociation of the dyes from DNA was determined by mixing equal volumes (120 µl) of the DNA/dye sample and the SDS sample and measuring the decline in fluorescence intensity. The delay time between mixing and first point of data collection was 5.2 ms, and each decay curve was an average of typically 10–13 decay-profiles. Rate constants were determined by exponential fitting of the kinetic data (approximately 7000 data points), using one or two exponential fits [y = A × exp(–kt), respectively, y = A1 × exp(–kt1) + A2 × exp(–kt2)].
RESULTS
Dissociation in free solution by stopped-flow
BO-dyes. BEBO exhibits biexponential dissociation decay in ctDNA and monoexponential decay in the alternating copolymer poly(dA-dT)2. Figure 2 shows the case of 26 mM NaCl and the corresponding two-exponential fit to ctDNA. In ctDNA, there is a significant improvement in the fit with two exponentials, but a single exponential is sufficient in poly(dA-dT)2 (see Supplementary Material). For all dyes studied here (except BO-PRO), the rate of dissociation increases when the ionic strength is increased. A common way to present dissociation data for comparison with theory is to plot the logarithm of the rate constant versus the negative logarithm of the ionic strength. Theories (13,14) for the effect of counter-ion screening on the rate of dissociation of charged ligands from DNA predict such plots to be linear and as discussed in detail below, the slope is related to the charge of the ligand. When plotted in this fashion, the fast rate constant for BEBO in ctDNA has a slope of –0.28 (Fig. 3A), whereas the rate of the slow process is essentially independent of salt (slope –0.02). In the case of a two-exponential decay, the importance of fast process in the total decay is expressed by the relative amplitude A1/(A1 + A2). For BEBO in ctDNA, the fast component is responsible for about 80–90% of the decay with no significant dependence on salt-concentration (Fig. 4). The single rate constant in poly(dA-dT)2 has a slope of –0.22 (Fig. 3A).
Figure 2.
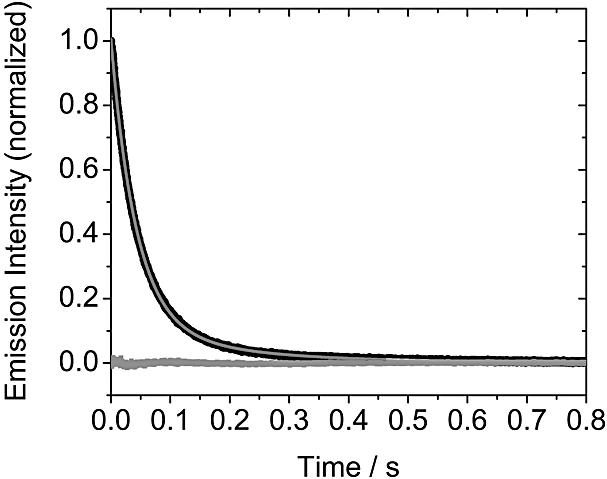
The kinetics of dissociation of BEBO from ctDNA (at 26 mM NaCl), after 1:1 dilution by an aqueous solution of SDS in NaCl (26 mM) (measured by stopped-flow technique). The emission intensity is normalized to the (constant) intensity measured after dilution of the same sample with the 26 mM NaCl solution without SDS. The dissociation data were analyzed with two exponential decay (light grey line) (Residual, grey square).
Figure 3.

(A) The salt dependence of the two rate constants for the dissociation of BEBO from ctDNA (k1, filled square, k2 filled diamond) and for the single rate constant for the dissociation of BEBO from poly(dA-dT)2 (open triangle). (B) The salt dependence of the rate constants for the dissociation of BO-PRO from ctDNA (biexponential decay, k1, filled square, k2, open diamond), of BO-PRO from poly(dA-dT)2 (single exponential decay, filled triangle) and of BO from ctDNA (single exponential decay, k, open triangle).
Figure 4.

The relative amplitude of the rate constant for the fast component of the dissociation of BEBO (filled up-triangle), BO-PRO (filled star), BETO (open diamond), BOXTO (filled down-triangle) and TO-PRO (open circle) from ctDNA (the lines in the figure are only guides to the eye).
The dissociation of the parent compound BO could be described by a single exponential with a rate constant that is essentially independent of ionic strength (Fig. 3B). However, a significant fraction of the initial fluorescence intensity (the value observed if dissociation was not initiated) decays within 5.2 ms, the lag-time of the instrument, that indicates the presence of a fast dissociation process that occurs on the millisecond time scale. The intensity that remains after the lag-time decreased monotonously with increasing salt (data not shown), indicating that the rate of the fast preceding process also increases with increasing salt. The divalent parent dye BO-PRO dissociates more slowly than BO (Fig. 3B), as expected from the higher charge. The decay was biexponential in ctDNA, and the fast and slow rate constants have a slope of –0.01 and +0.09, respectively (Fig. 3B). The faster component is clearly dominant with a relative amplitude of about 0.9 or larger except at the lowest ionic strength (Fig. 4). In poly(dA-dT)2, the dissociation of BO-PRO could be described by a single exponential, with a rate constant that exhibits a much larger sensitivity to ionic strength (slope –0.54) than for either of the dissociation processes in ctDNA (Fig. 3B).
TO-dyes. As was the case for BEBO, the dissociation of BOXTO exhibits biexponential decays in ctDNA. The fast rate constant has a slope of –0.32, whereas the slow rate constant has a slope of –0.26 (Fig. 5A). The relative amplitude of the fast component increases slightly from 0.25 to 0.4 with decreasing salt-concentration (Fig. 4). The decays in poly(dA-dT)2 could not be fitted satisfactorily even with three exponentials (data not shown). In fact, a semilogarithmic plot reveals a markedly sigmoidal shape in the decays, in contrast to the biphasic nature of the plots in the case of dissociation from ctDNA (see Supplementary Material). This effect is most accentuated at low salt concentrations, whereas at high concentration a nearly biphasic behaviour is consistent with a biexponential decay similar in nature to that observed in ctDNA. No further attempt was made to model the decays in poly(dA-dT)2.
Figure 5.

(A) The salt dependence of the two rate constants for the dissociation of BOXTO from ctDNA (biexponential decay, k1, filled square, k2, filled triangle). (B) The salt dependence of the two rate constants for the dissociation of TO-PRO from ctDNA (biexponential decay, k1, filled square, k2, filled diamond), and for the single rate constant for dissociation from poly(dA-dT)2 (open triangle).
BETO also exhibits biexponential decays in ctDNA, but in contrast to BOXTO (and all other dyes in this study), the log–log plots of rate constants versus ionic strength are not linear (see Supplementary Material). However, both rate constants decrease monotonously with decreasing salt concentration, as expected on the grounds of counter-ion screening. The faster component is responsible for about 15% of the decay independently of salt concentration (Fig. 4). In poly(dA-dT)2, BETO has the same type of non-exponential decay as seen with BOXTO in this alternating copolymer, including the tendency towards a bi-exponential decay at high salt, as is observed with ctDNA at all salt concentrations (data not shown). The divalent parent compound TO-PRO also has biexponential decays in ctDNA, and the rate constants have slopes –0.74 and –0.48 (Fig. 5B) for the fast and slow processes, respectively. The relative amplitude of the faster process varies between 0.7 and 0.9 (Fig. 4) in the salt interval studied, with a trend towards lower values at low salt concentration. The dissociation of TO-PRO in poly(dA-dT)2 is monoexponential. The rate constants are similar to the dominating fast process in ctDNA, albeit with a somewhat larger slope of –1.00 (Fig. 5B).
Average rate of dissociation. From an application point-of-view, it is the overall dissociation-rate that is of interest. We will therefore use the average rate constant
kapp = A1k1 + A2k2 1
when we compare the dissociation of groove-bound cyanine dyes and corresponding intercalated dyes from mixed sequence DNA, an approach that was used in an earlier study of DAPI (13). Figure 6A–C shows the collected data on how kapp depends on ionic strength (log kapp versus log salt) for the dyes in this study together with data on ethidium bromide (EB), propidium iodide (PI) and DAPI from Wilson and co-workers (13,14). Figure 6A shows a comparison of the dyes BO, BO-PRO and BEBO which are based on the BO chromophore, Figure 6B shows a comparison of the dyes TO-PRO, BETO (notice non-linear behaviour), and BOXTO which are based on the TO chromophore, and finally Figure 6C shows a comparison of the intercalators BO, BO-PRO, EB, PI, TO-PRO in ctDNA, and DAPI intercalated in poly(dG-dC)2 and groove-bound in poly(dA-dT)2 (13). The experimentally observed slopes in the salt-dependence plots, together with predictions by Wilson and co-workers for two types of intercalation processes and for groove-binding (13,14) are summarized in Table 1. The actual rate constants k1, k2 and kapp for the different dyes are collected in the Supplementary Material.
Figure 6.

The average rate constant (see equation 1) versus concentration of NaCl for the dissociation from DNA. (A) BO (filled triangle, single exponential decay), BO-PRO (filled square), and BEBO (open diamond) from ctDNA. (B) TO-PRO (open square), BETO (filled down-triangle, the line is a guide to the eye), and BOXTO (open down-triangle) from ctDNA. (C) BO (filled triangle), BO-PRO (filled square), EB (open circle), PI (filled circle), TO-PRO (open square) from ctDNA and DAPI from poly(dA-dT) (filled diamond) and poly(dG-dC) (open diamond). Data for EB, PI and DAPI are from Wilson et al. (14).
Table 1. A summary of the slopes in plots of log kapp versus log salta.
| BO | BEBO | BO-PRO | BETO | BOXTO | TO-PRO | Predicted intercalationf n = m′g | Predicted intercalationf n = 0.76m′g | Predicted groove-bindingf | |
|---|---|---|---|---|---|---|---|---|---|
| k1b | 0.00 | –0.28 | –0.01 | n.l. | –0.32 | –0.74 | |||
| k2c | – | –0.02 | 0.09 | n.l. | –0.26 | –0.48 | |||
| kappd | – | –0.24 | –0.08 | n.l. | –0.27 | –0.79 | –0.18 (+1)h | –0.4 (+1)h | –0.76(+1)h |
| –0.12 (+2) | –0.6 (+2) | –1.52 (+2) | |||||||
| poly(dA-dT)2e | n.d. | –0.22 | –0.54 | n.e. | n.e. | –1.00 |
n.d. = not determined; n.l. = non-linear plots of log kaverage versus log salt; n.e. = non-exponential decay.
akapp = A1k1 + A2k2.
bFast rate constant in ctDNA.
cSlow rate constant in ctDNA.
dAverage rate constant in ctDNA (kapp = A1k1 + A2k2).
eSingle rate constant in poly(dA-dT)2.
gTwo different modes of intercalation, see text.
hCharge of dye.
Applications to electrophoresis
Spectroscopic properties. One important aspect regarding bioanalytical applications is whether the new cyanine dyes are suitable for the laser-types that are used as light sources in, for instance, gel scanners and confocal microscopes. In all three cases, when bound to DNA, BOXTO (515 nm) and BETO (516 nm) have a maximum absorption which is very suitable for the 514 nm line of the Argon-ion laser, whereas for BEBO (467 nm), the 488 nm line is more suitable. The detailed spectroscopic properties for all dyes studied here are presented in a table in the Supplementary Material.
Electrophoretic dissociation. The application of these dyes to DNA analysis was tested by investigating the rate of dissociation during electrophoretic migration. This is important, for instance, when gel electrophoresis is used to assay hydrodynamic properties of dye-DNA complexes in order to elucidate the mode of dye-binding (10). Semilogarithmic plots of the relative amount of dye which remains bound to mixed sequence (T5) DNA as a function of electrophoresis time (1% agarose gels at 7.5 V/cm) are approximately linear for BO, BO-PRO, BEBO, BETO, BOXTO and YO-PRO (see Supplementary Material). The dissociation was therefore fitted to a single exponential decay, and the collected data on the half-times as averages of four to eight measurements on different gels are presented in Table 2. It is seen that the monocationic dyes generally dissociate faster than the dicationic ones, as expected from the lower electrostatic affinity. However, the groove-bound (monovalent) dyes BEBO, BETO and BOXTO have considerably longer half-times than the intercalated monovalent BO (by a factor of 19, 14 and 18, respectively). Interestingly, they even dissociate more slowly than the divalent BO-PRO. The latter dye clearly deviates from the two other divalent intercalators, since both TO-PRO and YO-PRO dissociate by a factor of 2.5 more slowly than the groove bound dyes. The half-time of 7 min that we obtained for BO is in good agreement with values for the monovalent intercalators EB and TO of 3.6 and 4.3 min, respectively, obtained under similar conditions (0.9% agarose, 10 V/cm, P/D = 5) by Benson et al. (4). For the sake of comparison, the effective half-times for dissociation (ln 2/kapp) of the dyes in free solution, as obtained in the stopped-flow experiments, are also presented in Table 2. The major difference between the two types of dissociations is the considerably slower rate in the gel. Whereas the half-times in solution are within seconds, the half-times in gels are around hundreds of minutes, or in the order of 105-fold slower. Table 2 shows the ratio between half-times in the gel and in free solution, and it is seen that the stabilization is generally higher for intercalators (BO, BO-PRO and TO-PRO) than for groove-bound dyes (BEBO, BETO and BOXTO).
Table 2. Dissociation half-times in gel and free solution.
| BO | BEBO | BETO | BOXTO | BO-PRO | TO-PRO | YO-PRO | |
|---|---|---|---|---|---|---|---|
| t1/2 (gel) (min)a | 7 (± 0) | 102 (± 14) | 127 (± 15) | 137 (± 20) | 93.2 (± 20) | 252 (± 13) | 273 (± 51) |
| t1/2 (sol) (s)b | 0.001 | 0.032 | 0.110 | 0.166 | 0.009 | 0.028 | |
| Ratio·105c | 3.8 | 1.9 | 0.69 | 0.49 | 6.0 | 5.4 |
aThe average dissociation half-times t1/2 (gel) from phage T5 DNA measured during constant field gel electrophoresis at 7.5 V/cm (N = 4–8; errors = ± S.E).
bThe effective half-times t1/2 (sol) = ln 2/kapp for dissociation from ctDNA in free solution measured by stopped-flow.
cThe ratio between half-times in the gel electrophoresis experiments and in free solution from the stopped-flow experiments [t1/2 (gel)/t1/2 (sol)].
DISCUSSION
Dissociation in free solution
The goal of this study was to compare the dissociation of the new groove-bound cyanine dyes with that of comparable intercalating dyes. BEBO is compared with intercalators BO (11) and BO-PRO, and BOXTO and BETO are compared with TO-PRO. Some of the cyanine dyes have an external binding mode at high binding ratios (15), and in order to avoid such complications, all experiments in the present study were conducted at dye to base ratios (D/P) of 1:10 or less. Comparison is also made with results by Wilson and co-workers (13,14) on the monovalent EB and the divalent PI intercalators (14), and the divalent DAPI which is intercalated when bound to the alternating copolymer poly(dG-dC)2 and a groove-binder when bound to poly(dA-dT)2 (13) [similar results have been obtained by them on other unfused aromatic cations (16,17)].
Our focus is on the two main objectives with the new dyes, i.e. DNA-stains with dissociation rates that are low and exhibit reduced sensitivity to salt concentration. The first aspect will be quantified by the value of average dissociation rate constant kapp at 56 mM salt concentration taken as a typical ionic strength. The salt-dependence will be quantified by the slope of the log–log plots of kapp versus ionic strength, which were linear with ctDNA except for BETO.
Based on polyelectrolyte theory, Wilson et al. have predicted that log–log plots of the dissociation rate constant versus ionic strength should be linear (14). The predicted slopes for groove-binders and intercalators are collected in Table 1. For intercalators, they assumed that either there is a loosely associated pre-complex in which the ligand displaces a number (n) of counter-ions which equals the charge of the ligand (m′) or that the cationic dye acts more like a condensed counterion and displaces a smaller number of counterions (n = 0.76m′). Wilson et al. found that the intercalators PI (–0.85) and EB (–0.35) had slopes in better agreement with the latter model (13). This was also true for DAPI which has a slope of –1 when intercalated in poly(dG-dC)2 (13). When groove-bound in poly(dA-dT)2, DAPI has a slope of –1.77 in good agreement with the prediction of –1.52.
BO-based dyes in ctDNA. The intercalators BO and BO-PRO exhibit a weak salt-dependence in the dissociation-rate (Fig. 6A) compared to EB and PI, with the slopes (0 and –0.08) (Fig. 6C) instead being close to the predicted values (–0.18 and –0.12, respectively) for the Wilson pre-complex model. Another difference is that BO dissociates much more quickly than EB and the dissociation time is in fact close to the resolution of our stopped-flow instrument. We therefore consider the observed value of approximately 630 s–1 to be a lower boundary for the dissociation-rate constant for BO, and cannot rule out that the lack of salt-dependence (Fig. 6A) is an effect of the limited time-resolution.
The rate of dissociation for BEBO is more than one order of magnitude slower than for its parent compound BO, in spite of having the same charge. In fact the dissociation rate of BEBO is even slower than for the divalent parent compound BO-PRO, by a factor of 3 at 56 mM ionic strength. BEBO exhibits a value of –0.24 for the slope (Fig. 6A), which is lower than the predicted value of –0.76 for a groove-binder. The finding that the mainly groove-bound BEBO has a comparatively low and salt-insensitive dissociation rate led us to investigate the dissociation kinetics of other groove-binding cyanine dyes. We chose BETO and BOXTO which exhibit a strong preference for groove-binding also in mixed-sequence DNA (10).
TO-based dyes in ctDNA. Interestingly, just as BEBO dissociates more slowly than the BO-PRO, monovalent BETO and BOXTO exhibit slower dissociation than the divalent TO-PRO (Fig. 6B) by a factor of 4 and 7, respectively, at 56 mM ionic strength. When taken together with the observation of much slower dissociation of DAPI in poly(dA-dT)2 compared to poly(dG-dC)2 (13), our combined observations on TO- and BO-based dyes leads to a general picture where groove-binding is associated with a slower dissociation when compared to an intercalating form of a comparable dye. Groove-binding therefore seems to be a useful approach for finding slowly dissociating dyes. Interestingly, Baliga and Crothers found similar dissociation rate constants for the monovalent groove-binder distamycin, although in their case the exact values depended on the binding-site sequence (18,19).
Regarding our objective of a weak dependence in the dissociation-rate on salt concentration, theory predicts that groove-binders are more salt-sensitive than intercalators of the same charge. However, experimentally, BOXTO exhibits a weaker salt dependence in the rate-constants (slope –0.27) than the intercalator TO-PRO (slope –0.79). This improvement is in part due to the lower charge compared to TO-PRO, but the slope is also lower than the value of –0.76 predicted for a monovalent groove-binder (Fig. 6B) in contrast to the fair agreement with theory in the divalent case of DAPI binding to poly(dA-dT)2 (13). To our knowledge, there has not been any other studies of the effect of the ionic strength on the dissociation kinetics of monovalent groove-binders. BETO exhibits an even larger deviation from theory since the log–log plot is not even linear (Fig. 6B). At low ionic strength, the dissociation rate is almost independent of salt concentration, but this is of limited practical use because above approximately 100 mM NaCl, the rate increases considerably more strongly than for BOXTO. In addition, BETO also has the disadvantage of exhibiting an overall faster rate of dissociation than BOXTO (see Supplementary Material). In the accompanying paper (10), it is also shown that BOXTO has the strongest preference for groove interaction and that it has more than twice as high fluorescence quantum yield than BETO when bound to DNA. The comparatively slow dissociation and the weak sensitivity to salt in a broad range of ionic strengths makes BOXTO the most interesting candidate as an alternative to TO-PRO as a DNA-stain. However, the dissociation is still rapid compared to homodimeric cyanine dyes TOTO and YOYO, so the full potential of BOXTO can probably only be realized by using a dimer approach.
Dissociation from poly(dA-dT)2. The dissociation of BEBO from poly(dA-dT)2 is well described by a single exponential (see Supplementary Material), indicating that release occurs from a single binding mode, in agreement with the pure groove-binding of BEBO in this polynucleotide (9). The rate constant in poly(dA-dT)2 indeed has a magnitude and salt-dependence similar to that of the faster and dominant of the two dissociation processes in ctDNA (Fig. 3A), reinforcing the earlier finding that the dominant binding form in ctDNA is by groove-binding in AT-rich regions (9). In the case of BEBO, dissociation from poly(dA-dT)2 thus helps clarify the dissociation from ctDNA.
With BETO and BOXTO, the situation is considerably more complicated than with BEBO because the dissociation from poly(dA-dT)2 could not be described by a sum of exponentials (see Supplementary Material). The details of dissociation from poly(dA-dT)2 will be left for a separate study since we are mainly interested in dissociation from mixed-sequence DNA. Here we only note that the groove-binding of BETO and BOXTO in ctDNA cannot simply be seen as a binding to stretches of AT-sequences, in contrast to BEBO where there are strong similarities in the dissociation from ctDNA and poly(dA-dT)2.
Dissociation of intercalating dyes from ctDNA. As a spin-off to our study of groove-bound cyanine dyes, we were able to compare the dissociation of an extensive set of intercalating dyes (Table 1). The remarkable difference in behaviour between BO-PRO and TO-PRO is interesting in view of the theory put forward by Wilson et al. (14). The slope of TO-PRO (–0.74) is similar to that of other divalent intercalators such as PI (–0.85) and DAPI in GC (–0.99). BO-PRO on the other hand has a slope (–0.08) that is much closer to the value of –0.12 originally predicted by Wilson et al. for a simple intercalation process, without the need to invoke the counterion-condensation arguments used to explain the much larger slopes observed with PI, and with DAPI in poly(dG-dC)2. Thus, BO-PRO and TO-PRO possibly represent the two limiting intercalation cases presented by Wilson et al. (Table 1). The collected data in Figure 6C also indicate that intercalators based on the BO chromophore have unusually fast dissociations. BO dissociates about 50–100 times faster than EB (at 100 and 5 mM salt, respectively) and a similar difference holds for the divalent equivalents BO-PRO and PI with 20 and 140 times faster dissociation for BO-PRO at the same salt concentrations.
Electrophoretic dissociation
Table 2 shows that BETO, BOXTO and BEBO all dissociate more slowly during electrophoresis (at 50 mM ionic strength) than the intercalating BO (half-time 7 min) and TO (4.3 min under similar electrophoresis conditions) (4). The increase by a factor between 14 and 19 compared to BO makes the groove-bound dyes useful for fluorescent DNA-staining in gel electrophoresis.
The trends among the dyes regarding dissociation rates in the gel, mirror those observed in free solution (Table 2). The groove-binders dissociate more slowly than BO also in the gels, BO-PRO is faster than TO-PRO, and BEBO is faster than BO (albeit BETO and BOXTO are slower than TO-PRO in contrast to in solution). Thus, the trends observed with valence and binding mode generally agree well between dissociation in gels and solution, in spite of the strongly stabilizing effect of the gel on the DNA binding (Table 2). This indicates that the inherent rate of dissociation of the complex is the major factor for the stability of the DNA–dye complexes in the gel. Similar stabilization of protein–DNA complexes has been ascribed to the diffusion of dissociated ligands being retarded by a caging property of the gel (20). The major determining molecular parameter for the stabilization should then be the size of the dye, because the degree of hindrance to the diffusion of the free dye will depend on the ratio between its size and the pore size (21). The fact that all dyes here have similar sizes when compared on the length-scale of the average pore radius of the gel (250 nm) (22) may therefore explain why the dissociations are slowed down by the same order of magnitude (∼105 times) and the trends in the free-solution and gel half-times generally agree. There are differences, however. The DNA-complexes with BETO, BEBO and BOXTO are all less stabilized than with BO (Table 2) in spite of its smaller size. The data therefore suggest that groove-binders are less stabilized by the presence of the gel than intercalators, a picture reinforced by the comparatively large stabilization with TO-PRO and BO-PRO. One possibility is that the hindered diffusion in particular increases the probability of reformation of the pre-complex which is assumed to be involved in the intercalation process.
CONCLUSIONS
By introducing groove-bound cyanine dyes, we have obtained fluorescent DNA-stains with reduced sensitivity to ionic strength in their dissociation. The success of this approach is somewhat surprising, since groove-binders are predicted to be more salt-sensitive than an intercalator of the same charge (Table 1). The expected overall reduction in affinity due to the concomitant lower electrostatic attraction with BOXTO seems to be offset by the groove-binding mode. The extra stabilization is significant, to the extent that the monovalent BOXTO in fact dissociates even more slowly than the divalent TO-PRO. As a result, in BOXTO we have obtained a very interesting candidate for fluorescent DNA-staining. Further improvement could be to prepare dimeric forms, which can be expected to exhibit superior dissociation properties based on the success of this approach in the intercalative case. Another approach is the threading strategy used for ruthenium complexes (23,24).
SUPPLEMENTARY MATERIAL
Supplementary Material is available at NAR Online.
Acknowledgments
ACKNOWLEDGEMENTS
Financial support from the Swedish Research Council is gratefully acknowledged.
REFERENCES
- 1.Perkins T.T., Smith,D.E. and Chu,S. (1999) Single polymers in elongational flows: dynamic, steady-state and population-averaged properties. In Nguyen,T.Q. and Kausch,H.-H. (eds.), Flexible Polymer Chains in Elongational Flow. Springer, pp. 283–334. [Google Scholar]
- 2.Smith S.B., Aldridge,P.K. and Callis,J.B. (1989) Observation of individual DNA molecules undergoing gel electrophoresis. Science, 243, 203–206. [DOI] [PubMed] [Google Scholar]
- 3.Han J. and Craighead,H.G. (2000) Separation of long DNA molecules in a microfabricated entropic trap array. Science, 288, 1026–1029. [DOI] [PubMed] [Google Scholar]
- 4.Benson S.C., Mathies,R.A. and Glazer,A.N. (1993) Heterodimeric DNA-binding dyes designed for energy transfer: stability and applications of the DNA complexes. Nucleic Acids Res., 21, 5720–5726. [DOI] [PMC free article] [PubMed] [Google Scholar]
- 5.Becker M.M. and Dervan,P.B. (1979) Molecular recognition of nucleic acid by small molecules. Binding affinity and structural specificity of bis(methidium)spermine. J. Am. Chem. Soc., 101, 3664–3666. [Google Scholar]
- 6.Larsson A. and Åkerman,B. (1995) Period times and helix alignment during the cyclic migration of DNA in electrophoresis gels studied with fluorescence microscopy. Macromolecules, 28, 4441–4454. [Google Scholar]
- 7.Markström M., Cole,K.D. and Åkerman,B. (2002) DNA electrophoresis in gellan gels. The effect of electroosmosis and polymer additives. J. Phys. Chem. B, 106, 2349–2356. [Google Scholar]
- 8.Carlsson C., Larsson,A. and Jonsson,M. (1996) Influence of optical probing with YOYO on the electrophoretic behavior of the DNA molecule. Electrophoresis, 17, 642–651. [DOI] [PubMed] [Google Scholar]
- 9.Karlsson H.J., Lincoln,P. and Westman,G. (2003) Synthesis and DNA binding studies of a new asymmetric cyanine dye binding in the minor groove of [poly(dA-dT)]2. Bioorg. Med. Chem., 11, 1035–1040. [DOI] [PubMed] [Google Scholar]
- 10.Karlsson H.J., Eriksson,M., Perzon,E., Åkerman,B., Lincoln,P. and Westman,G. (2003) Groove-binding unsymmetrical cyanine dyes for staining of DNA: syntheses and characterization of the DNA-binding. Nucleic Acids Res., 31, 6227–6234. [DOI] [PMC free article] [PubMed] [Google Scholar]
- 11.Kapuscinski J. (1990) Interactions of nucleic acids with fluorescent dyes: spectral properties of condensed complexes. J. Histochem. Cytochem., 38, 1323–1329. [DOI] [PubMed] [Google Scholar]
- 12.Cosa G., Focsaneanu,K.S., McLean,J.R.N., McNamee,J.P. and Scaiano,J.C. (2001) Photophysical properties of fluorescent DNA-dyes bound to single- and double-stranded DNA in aqueous buffered solution. Photochem. Photobiol., 73, 585–599. [DOI] [PubMed] [Google Scholar]
- 13.Wilson W.D., Tanious,F.A., Barton,H.J., Jones,R.L., Fox,K., Wydra,R.L. and Strekowski,L. (1990) DNA sequence dependent binding modes of 4′,6-diamidino-2-phenylindole (DAPI). Biochemistry, 29, 8452–8461. [DOI] [PubMed] [Google Scholar]
- 14.Wilson W.D., Krishnamoorthy,C.R., Wang,Y.H. and Smith,J.C. (1985) Mechanism of intercalation: ion effects on the equilibrium and kinetic constants for the interaction of propidium and ethidium with DNA. Biopolymers, 24, 1941–1961. [DOI] [PubMed] [Google Scholar]
- 15.Larsson A., Carlsson,C., Jonsson,M. and Albinsson,B. (1994) Characterization of the binding of the fluorescent dyes YO and YOYO to DNA by polarized light spectroscopy. J. Am. Chem. Soc., 116, 8459–8465. [Google Scholar]
- 16.Wilson W.D., Tanious,F.A., Ding,D., Kumar,A., Boykin,D.W., Colson,P., Houssier,C. and Bailly,C. (1998) Nucleic acid interactions of unfused aromatic cations: evaluation of proposed minor-groove, major-groove and intercalation binding modes. J. Am. Chem. Soc., 120, 10310–10321. [Google Scholar]
- 17.Wang L., Kumar,A., Boykin,D.W., Bailly,C. and Wilson,W.D. (2002) Comparative thermodynamics for monomer and dimer sequence-dependent binding of a heterocyclic dication in the DNA minor groove. J. Mol. Biol., 317, 361–374. [DOI] [PubMed] [Google Scholar]
- 18.Baliga R. and Crothers,D.M. (2000) On the kinetics of distamycin binding to its target sites on duplex DNA. Proc. Natl Acad. Sci. USA, 97, 7814–7818. [DOI] [PMC free article] [PubMed] [Google Scholar]
- 19.Baliga R. and Crothers,D.M. (2000) The kinetic basis for sequence discrimination by Distamycin A. J. Am. Chem. Soc., 122, 11751–11752. [Google Scholar]
- 20.Cann J.R. (1998) Theoretical studies on the mobility-shift assay of protein–DNA complexes. Electrophoresis, 19, 127–141. [DOI] [PubMed] [Google Scholar]
- 21.Åkerman B. (2001) Dynamics of confined polymers. In Nalwa,H.S. (ed.), Handbook of Surfaces and Interfaces of Materials. Academic Press, San Diego, CA, Vol. 2, pp. 431–479. [Google Scholar]
- 22.Pernodet N., Maaloum,M. and Tinland,B. (1997) Pore size of agarose gels by atomic force microscopy. Electrophoresis, 18, 55–58. [DOI] [PubMed] [Google Scholar]
- 23.Önfelt B., Lincoln,P. and Norden,B. (1999) A molecular staple for DNA: threading bis-intercalating [Ru(phen)2dppz]2+ dimer. J. Am. Chem. Soc., 121, 10846–10847. [Google Scholar]
- 24.Wilhelmsson L.M., Westerlund,F., Lincoln,P. and Norden,B. (2002) DNA-binding of semirigid binuclear ruthenium complex Δ,Δ-[µ-(11,11′-bidppz)(phen)4Ru2]4+: extremely slow intercalation kinetics. J. Am. Chem. Soc., 124, 12092–12093. [DOI] [PubMed] [Google Scholar]
Associated Data
This section collects any data citations, data availability statements, or supplementary materials included in this article.