


Abstract
Differential scanning calorimetry and UV thermal denaturation have been used to determine a complete thermodynamic profile for the bis-intercalative interaction of the peptide antibiotic echinomycin with DNA. The new calorimetric data are consistent with all previously published binding data, and afford the most rigorous and direct determination of the binding enthalpy possible. For the association of echinomycin with DNA, we found ΔG° = –7.6 kcal mol–1, ΔH = +3.8 kcal mol–1 and ΔS = +38.9 cal mol–1 K–1 at 20°C. The binding reaction is clearly entropically driven, a hallmark of a process that is predominantly stabilized by hydrophobic interactions, though a deeper analysis of the free energy contributions suggests that direct molecular recognition between echinomycin and DNA, mediated by hydrogen bonding and van der Waals contacts, also plays an important role in stabilizing the complex.
INTRODUCTION
Studies on the DNA binding behavior of the antibiotic echinomycin (Fig. 1) have afforded an uniquely valuable insight into general mechanisms whereby small molecules can recognize DNA as a target for useful biological effects. The impetus for this kind of work has predominantly centered on the possibility of exploiting new motifs associated with DNA binding for drug development in experimental cancer chemotherapy (1–3). Not only was echinomycin the first substance shown to bind to DNA in a bifunctional intercalative fashion (4), and as such has provided a paradigm for bis-intercalation by other drugs (5–7), but its structural resemblance to actinomycin has enabled fruitful comparisons that have illuminated important aspects of peptide antibiotic–DNA interaction (8). Although both antibiotics bind specifically to double-helical B-form DNA in the minor groove of the double helix at sequences containing at least two G·C base pairs, and both are dependent upon interaction with the purine 2-amino group as a means of identifying their preferred binding sites, the nature of those sites is different for the two drugs: actinomycin recognizes sequences containing the 5′GpC3′ dinucleotide step whereas echinomycin recognizes 5′CpG3′ with a strong tendency to prefer flanking A·T pairs arranged in an alternating purine–pyrimidine fashion (8,9). Actinomycin has found a lasting place in the clinic for the treatment of various uncommon and fast-growing cancers, but echinomycin was eventually withdrawn from clinical trial on account of its toxicity without marked therapeutic benefit (10). However, as an example of a well investigated DNA binding drug whose action at the molecular level has been thoroughly dissected it is almost unique, having engaged the attention of molecular biologists and biophysical chemists across a wide range of disciplines.
Figure 1.

Structure of echinomycin. The solvent (water) accessible surface area of echinomycin is shown on the right side of the figure.
Among the latter have been several groups concerned with structural studies (11–13) as well as the application of footprinting and transcription stop assays to study the molecular basis of nucleotide sequence recognition (14–16), but curiously few workers have attempted to determine the precise thermodynamics of the echinomycin–DNA interaction. This is unlikely to be due to lack of interest, though the manifest complexity of the kinetics and thermodynamics of the actinomycin–DNA interaction (17,18) may have served as something of a deterrent. It is more likely attributable to the difficulty of making accurate binding measurements with so insoluble a ligand, a problem that was circumvented in the earliest studies by the development of solvent–partition analysis (19). In the first report of bis-intercalation by echinomycin it was noted that the equilibrium constant for echinomycin binding to calf thymus DNA at low ionic strength showed no detectable variation with temperature, leading to the conclusion that ΔH must be close to zero and the reaction driven by a large positive entropy change (4). At higher ionic strength, however, the value of ΔS appeared to fall drastically to near zero and the ΔH of binding became moderately large and negative. These estimates were, however, derived from Scatchard plots fitted by straight lines. When the same data were subsequently fitted by the much better treatment of McGhee and von Hippel (20) based upon a more realistic site-exclusion model, the numbers changed to indicate negative enthalpy and positive entropy irrespective of ionic strength (21). It was obvious that the extraction of thermodynamic parameters from the existing binding data was hopelessly dependent upon the model employed to analyze them, though the apparent value of ΔH (∼–3 kcal mol–1) did lie between the large negative values previously reported for acknowledged intercalating agents such as ethidium bromide, proflavine and daunomycin and the value of +2 kcal mol–1 determined for actinomycin D (22). The dilemma was not resolved several years later when kinetic studies of the dissociation and association reactions were conducted, providing estimates of the activation energy of the antibiotic–DNA interaction but revealing a considerable lack of agreement between kinetic constants determined by different means (3,23,24). It was, however, observed that reliable estimates of ΔH and ΔS might have to await direct determination of ΔH by microcalorimetry (21). It has been a long wait.
We have used the combined approaches of differential scanning calorimetry (DSC) and thermal denaturation monitored by UV absorbance. DSC detects enthalpy changes as directly as possible, and, with the application of Hess’s law, allows ligand binding enthalpies to be determined even for poorly soluble ligands like echinomycin. Optically monitored melting curves obtained as a function of increasing ligand concentration may be analyzed using the rigorous statistical mechanical theories of Crothers (25) and McGhee (26) to obtain estimates of the ligand binding constant, enthalpy and site size, providing an independent check on binding parameters determined by DSC. This combined approach proved to be invaluable in the characterization of the binding thermodynamics of the ultratight DNA binding bisanthracycline WP631 (27). We now report the results of applying these experimental methods to the study of the interaction between echinomycin and DNA.
MATERIALS AND METHODS
Materials
The biosynthesis and purification of echinomycin have been described previously (1,28). The antibiotic was initially dissolved in DMSO, and diluted into BPE buffer as indicated. A molar extinction coefficient of 11 500 M–1 cm–1 at 325 nm in aqueous buffer solution was used to determine the concentration of echinomycin (1). BPE buffer (6 mM Na2HPO4, 2 mM NaH2PO4 and 1 mM Na2EDTA, pH 7.0) was used throughout this work.
DNA preparation
Herring sperm DNA (42% GC; Boehringer Mannheim, Indianapolis, IN) was sonicated, phenol extracted and purified as previously described (29). A molar extinction coefficient of 12 858 M–1 (bp) cm–1 at 260 nm was used for DNA concentration determinations.
UV melting studies
UV DNA melting curves were determined using a Cary 3E UV/visible spectrophotometer (Varian, Inc., Palo Alto, CA), equipped with a thermoelectric temperature controller. Sonicated herring sperm DNA in BPE buffer was used for melting studies. Solutions of DNA [final concentration 5.0 × 10⁻⁵ M (bp)] containing the antibiotic at known molar ratios were prepared by direct mixing with aliquots from a stock solution of echinomycin, followed by incubation for 12 h at 24°C to ensure equilibration. Samples were heated at a rate of 1°C min–1, while continuously monitoring the absorbance at 260 nm. Primary data were transferred to the graphics program Origin (Microcal, Inc., Northampton, MA) for plotting and analysis.
Differential scanning calorimetry
DSC experiments utilized a Microcal MC2 instrument (Microcal, Inc.) along with its DA2 software (July 1986 version) for data acquisition and analysis. Sonicated herring sperm DNA at a concentration of 1 mM (bp) in BPE buffer was used for all experiments. A scan rate of 1°C min–1 was used. Primary data were corrected by subtraction of a buffer–buffer baseline, normalized to the concentration of DNA base pairs, and further baseline corrected using the Cp (0) software option. Baseline corrected, normalized data were transferred to the Origin graphics software package for integration and plotting. Samples for DSC of DNA plus echinomycin were prepared by weighing appropriate amounts of solid antibiotic and dissolving the material directly into 2 ml of 1 mM DNA solution. Any undissolved antibiotic was removed by low speed centrifugation. The exact amount of echinomycin bound to the DNA was then determined spectrophotometrically.
Determination of DNA binding constants
The DNA binding constant of echinomycin was determined by UV melting studies. Assuming no interaction of ligand with single-stranded DNA, McGhee (26) derived the equation:
![]()
where Tm0 is the melting temperature of the DNA alone, Tm is the melting temperature in the presence of saturating amounts of ligand, ΔHm is the enthalpy of DNA melting (per mol bp), R is the gas constant, KTm is the ligand binding constant at Tm, L is the free ligand concentration and n is the ligand site size.
The DNA binding constant of echinomycin at lower temperatures was estimated by use of the van’t Hoff equation:
![]()
where K is the DNA binding constant of echinomycin at temperature T (K), and ΔHb is the enthalpy of binding of echinomycin to DNA determined by DSC.
The DNA binding constant of echinomycin was also determined by analysis of complete UV melting curves at less than saturating drug concentrations, using McGhee’s theory of DNA melting in the presence of ligands (26). A detailed description of the theory is given in the original paper (26). Briefly, if echinomycin is assumed not to bind to single-stranded DNA, complete melting curves at a given ligand concentration may be calculated by McGhee’s algorithm from the parameters Tm0, ΔHm, s, σ, ωh, ΔHb, K and n. The parameters are defined as follows: Tm0 is the melting temperature of the DNA in the absence of ligand; ΔHm is the enthalpy for DNA melting in the absence of ligand; s is the equilibrium constant for forming a helix base pair from two coil nucleotides; σ is the nucleation parameter for forming a single-stranded base pair within a stretch of helix; ωh is the cooperative parameter for ligand binding to helical base pairs; ΔHb is the enthalpy for ligand binding to helical base pairs; K is the DNA binding constant; and n is the neighbor exclusion parameter, the number of DNA base pairs in the binding site. In order to generate melting curves, Tm0, ΔHm, s, ωh and ΔHb were independently determined and constrained. The parameters K, σ and n were estimated by successive approximation. Each parameter was systematically adjusted to produce ‘best fit’ curves that gave a minimum value of the sum-of-squares of residuals (SSR), the differences between observed and calculated values of melting curves, i.e. SSR = ∑(yobs – ycalc)2. In this fitting process, one parameter (K, n, σ) was varied to construct different melting curves while all other parameters were constrained to a given value. The data derived from these calculated melting curves were used to generate SSR profiles (27). A FORTRAN program for calculating the DNA melting curves according to McGhee’s theory was kindly provided by Dr James McGhee and was edited and recompiled by Dr Susan Wellman.
RESULTS
UV melting studies and DSC were used to determine the binding constant for the interaction of echinomycin with herring sperm DNA in BPE buffer (16 mM total Na+). In the absence of echinomycin, the melting temperature (Tm) of herring sperm DNA was measured as 67.7°C. In the presence of 20 µM echinomycin, a concentration sufficient to saturate the DNA lattice, the Tm was increased to 87.7°C (see Fig. 3). The enthalpy of DNA melting in the absence of ligand (ΔHm) was determined by DSC to be 6900 cal mol–1 bp. If we assume that the ligand site size is 4 bp (11,14) and the free ligand concentration is 5 µM (equal to the saturated free concentration of echinomycin in aqueous buffer solution) the DNA binding constant of echinomycin at the melting temperature (87.7°C) was calculated to be 1.7 × 10⁶ M–1 by application of equation 1. Correction of these values to lower temperature requires knowledge of the DNA binding enthalpy, which was determined by DSC.
Figure 3.

Thermal denaturation of herring sperm DNA alone (leftmost curve) and in the presence of increasing concentrations of echinomycin. The echinomycin concentrations used are listed in Table 1. Solid lines represent the primary experimental data. The dashed lines represent the best fit to the experimental data using McGhee’s statistical mechanical model for the melting of DNA–ligand complexes.
Figure 2 shows the results of DSC experiments for the melting of herring sperm DNA in the presence and absence of echinomycin. These experiments afford a determination of the enthalpy of echinomycin binding to DNA in the most direct and rigorous way. From the area under the peak for DNA melting alone (Fig. 2A) an enthalpy for duplex melting may be obtained directly:
Figure 2.

Results of DSC experiments. Melting curves are shown for herring sperm DNA at 1 mM (bp) concentration (A) and for an identical DNA solution with saturating amounts (0.16 mol antibiotic/mol bp) of echinomycin added (B). The areas under the peaks provide direct estimates of the enthalpy for melting of the DNA duplex (A) and the echinomycin–DNA complex (B).
duplex ↔ 2(single strands) ΔH1 = 6900 (±600) cal mol–1
The error estimate is the standard deviation from six determinations. From the melting of the echinomycin–DNA complex (Fig. 2B), the enthalpy of the overall reaction may also be determined as follows:
duplex-echinomycin ↔ 2(single strands) + echinomycin
ΔH2 = 6300 (±600) cal mol–1
The error estimate in this case is derived from three replicate experiments. The enthalpy for dissociation of echinomycin from DNA may be obtained from these data by application of Hess’s law:
duplex-echinomycin ↔ duplex + echinomycin
ΔH3 = ΔH2 – ΔH1 = –600 (±850) cal mol–1
In order to obtain the enthalpy for association between echinomycin and DNA, the sign of ΔH3 must be changed, and it must be divided by the binding ratio (rb) used in the actual DSC experiment. This leads to:
ΔHb = –(ΔH3 / rb) = –(–600 cal mol–1 / 0.16 mol echinomycin/mol bp) = +3800 cal mol–1
Echinomycin binding to DNA is thus characterized by a comparatively small, positive enthalpy.
Once the binding enthalpy (ΔHb) has been determined, the DNA binding constant of echinomycin at 20°C is calculated to be 5.0 × 10⁵ M–1 by using the standard van’t Hoff equation (equation 2).
A more rigorous, albeit laborious, estimate of the binding constant and site size may be obtained by analysis of the complete thermal denaturation profiles of DNA in the presence of echinomycin at several concentrations. Figure 3 shows the primary thermal denaturation data, along with best fits to McGhee’s model, as described above. Table 1 summarizes our best estimates of the binding parameters at several echinomycin concentrations. This analysis yields K = 4.5 × 10⁵ M–1 and n = 5.3 bp at 20°C. Notably and importantly, single values of K and n can very accurately fit the melting data over a wide range of echinomycin concentrations. It should also be noted that in several cases the simulated concentration of echinomycin was different from the analytical concentration used in the experiments, especially at high antibiotic concentrations (Table 1). The appropriate echinomycin concentration to be used should be the free ligand concentration at the Tm. The observed differences between the analytical and optimized echinomycin concentrations may stem from the low solubility of echinomycin in aqueous solution, so that the total concentration overestimated the concentration of the free drug. Deviation between observed and calculated melting curves at a very high or low fraction coiled is probably due to baseline difficulties when normalizing the experimental data.
Table 1. Binding parameters from melting of herring sperm DNA in the presence of echinomycina.
| [DNA] (M bp) | [echino] (M) | K (M–1) | n (bp) | [echino]sim (M) | σ |
|---|---|---|---|---|---|
| 5.0 × 10⁻⁵ | 0 | 0 | 0 | 0 | 2.8 × 10⁻³ |
| 5.0 × 10⁻⁵ | 2.5 × 10⁻⁶ | 4.5 × 10⁵ | 5.3 | 2.9 × 10⁻⁶ | 2.3 × 10⁻³ |
| 5.0 × 10⁻⁵ | 4.0 × 10⁻⁶ | 4.5 × 10⁵ | 5.3 | 4.2 × 10⁻⁶ | 2.4 × 10⁻³ |
| 5.0 × 10⁻⁵ | 5.0 × 10⁻⁶ | 4.6 × 10⁵ | 5.3 | 4.9 × 10⁻⁶ | 2.4 × 10⁻³ |
| 5.0 × 10⁻⁵ | 1.0 × 10⁻⁵ | 4.5 × 10⁵ | 5.3 | 7.3 × 10⁻⁶ | 2.7 × 10⁻³ |
| 5.0 × 10⁻⁵ | 2.0 × 10⁻⁵ | 4.5 × 10⁵ | 5.3 | 1.05 × 10⁻⁵ | 3.4 × 10⁻³ |
a[DNA] is the concentration of herring sperm DNA. [echino] is the concentration of echinomycin used in the experiments. K is the binding constant at 20°C. n is the binding site size. [echino]sim is the concentration of echinomycin used in the simulation. σ is the nucleation parameter used in the simulation.
Analysis of thermal denaturation data by the McGhee model is both laborious and tedious, since the algorithm used to compute melting profiles does not lend itself to incorporation into non-linear least-squares fitting routines, and best fits must be obtained by successive approximation. To assure the reader that this task has been performed in the most rigorous way, Figure S1 (Supplementary Material) shows the SSR plots for the binding constant and site size. The SSR plot defines the error space for the parameter estimation (27). Figure S1 shows that we have indeed defined a minimum in the residuals with our best estimate of K and n. The estimates of the binding constant obtained by the shift in Tm values and by analysis of complete melting curves are in excellent agreement, when the difference in the assumed value of n in the former method is taken into account.
We can now derive a complete thermodynamic profile for the association of echinomycin with DNA. By applying the standard Gibbs equation, the free energy change for binding may be estimated to be ΔG° = –RT ln K = –7.6, –8.3 and –10.3 kcal mol–1, respectively, for 20, 37 and 87.7°C. The calorimetrically derived enthalpy estimate is ΔH = +3.8 kcal mol–1. From the standard relation ΔG = ΔH – TΔS, an entropy of +38.9 (at 20°C), + 39.0 (at 37°C) and +39.1 (at 87.7°C) cal mol–1 K–1 may be calculated. The signs of these thermodynamic parameters indicate unambiguously that echinomycin binding to DNA is entropically driven.
DISCUSSION
The results presented here describe the most direct determination of the thermodynamics of echinomycin binding to DNA. Echinomycin is sparingly soluble in water (<5 µM), making accurate determination of its interaction with DNA difficult and challenging. The combined DSC/UV melting approach used here provides perhaps the only direct means of evaluating the echinomycin–DNA binding enthalpy.
Echinomycin binds to DNA, at 20°C, with a small, positive enthalpy of +3.8 kcal mol–1, a favorable free energy of –7.6 kcal mol–1 and an entropy of +38.9 cal mol–1 K–1. Echinomycin binding to DNA is clearly entropically driven, with TΔS = –11.4 kcal mol–1. The positive signs of both ΔH and ΔS, and their magnitudes, are hallmarks of a predominantly hydrophobically driven binding reaction. That such is the case is not surprising, since echinomycin carries no net charge and has a large water-to-octanol partition coefficient. One caveat concerning these thermodynamic values needs to be mentioned. Echinomycin binds selectively to particular 4–5 bp sequences, with a distribution of microscopic binding constants. The macroscopic thermodynamic values determined here are complex weighted averages of the microscopic binding parameters, weighted by the frequencies of the specific sequences within the herring sperm genome. Despite this averaging, the thermodynamic profile we determined is an invaluable quantitative measure of echinomycin binding, and provides a firm basis for understanding the molecular forces that drive complex formation.
The binding constants determined here (Table 1) are in excellent agreement with values determined previously using the phase partition method (1,21). However, previous estimates of the binding enthalpy were derived from the indirect van’t Hoff method (21), a procedure that is fraught with error (30). Those estimates, the best possible at the time, suggested that the echinomycin binding enthalpy was small and negative (∼–3 kcal mol–1), a value that is still consistent with binding being entropically driven. The discrepancy between van’t Hoff derived enthalpy estimates and our more direct calorimetrically determined values is hardly surprising, given the inherent difficulties in measuring temperature-dependent binding constants by the phase partition method.
Wakelin and Waring (21) examined the salt dependence of the binding of echinomycin to DNA. From their data, the value δlog K / δlog [Na+] = –0.43 may be determined. Even though echinomycin is uncharged, its DNA binding constant is manifestly salt dependent. The reason for this derives from a subtle polyelectrolyte effect described by Wilson and Lopp (31) and by Friedman and Manning (32). Intercalators lengthen and unwind DNA, increasing the phosphate spacing along the helix axis. As a result, the charge density of the duplex decreases, releasing condensed counterions and providing an entropically favorable contribution to the binding free energy. The observed value of δlog K / δlog [Na+] = –0.43 for echinomycin is twice the value of –0.22 predicted by Friedman and Manning (32) for monointercalators. Since echinomycin is unambiguously known to be a bisintercalator, the large value is fully consistent with its proved binding mode. The polyelectrolyte contribution to the free energy of echinomycin–DNA binding is ΔGpe = –RT (–0.43) ln [Na+]. At the 16 mM Na+ concentrations used in these studies, ΔGpe = –1.04 kcal mol–1, a substantial contribution to the overall free energy of –7.6 kcal mol–1. Under similar conditions, singly charged monointercalators would typically have ΔGpe contributions of –2 to –3 kcal mol–1 (33).
The results presented here demonstrate the utility of DSC as a method for studying interactions of sparingly soluble compounds with their receptors. The use of thermal denaturation methods in general (25,26) and DSC in particular (34) in studies of ultratight binding reactions has been emphasized. Moreover, the present studies reveal another advantage. By forming the DNA complex of a poorly soluble ligand like echinomycin, one may reliably measure the heat of dissociation by DSC and the application of Hess’s law. No other approach affords as direct a measure of binding enthalpies for such ‘problem’ ligands.
One insurmountable difficulty in characterizing the thermodynamics of the echinomycin–DNA interaction arises over the determination of heat capacity changes (ΔCp) that may accompany binding. The DNA binding of many intercalators is accompanied by small, negative heat capacity changes ranging from –100 to –200 cal mol–1 K–1 (35). Since ΔCp = δΔH / δT, this means that binding enthalpy values are temperature dependent. ΔCp values for intercalators have been determined with difficulty by isothermal titration calorimetry, a method that cannot be used for echinomycin because of its poor solubility. Our hands are tied, and we can devise no way to obtain ΔCp for echinomcycin binding experimentally. The enthalpy value determined here by DSC refers to the melting temperature of the echinomycin–DNA complex (87°C). A negative heat capacity change would cause ΔH to become more positive at lower temperatures, exaggerating the entropic driving force for binding. The fact that a constant enthalpy value may be used to simulate DNA melting curves over a wide range of echinomycin concentrations (Fig. 3 and Table 1), suggests that ΔCp may in fact be small in magnitude. We have done the best we can do, and a calorimetric enthalpy at one temperature is far better than one determined by van’t Hoff analysis.
After obtaining the thermodynamic parameters, it is possible to dissect the binding free energy into contributions from the processes that lead to complex formation. The free energy of association between a drug and DNA may be divided into the following five contributions (reviewed in 35,36):
ΔGobs = ΔGconf + ΔGt+r + ΔGhyd + ΔGpe + ΔGmol 3
where ΔGobs is the observed binding free energy, which can be calculated from the DNA binding constant (K) by the standard Gibbs equation: ΔGobs = –RT ln K; ΔGconf is the free energy contribution from conformational changes in the DNA and drug upon complex formation; ΔGt+r is the free energy contribution resulting from losses of translational and rotational freedom when forming the DNA–drug complex; ΔGhyd is the free energy for the hydrophobic transfer of drug from solution to the DNA binding sites; ΔGpe is the electrostatic free energy contribution from the release of condensed counterions from the DNA; ΔGmol is the free energy contribution from the formation of weak non-covalent bonds including hydrogen bonds, van der Waals interactions and other weak forces upon complex formation. For the echinomycin–DNA interaction, ΔGobs was determined to be –7.6 kcal mol–1. The contribution from conformational changes upon formation of two intercalation sites is unfavorable and is estimated to be +8 kcal mol–1 (37). The free energy associated with loss of translational and rotational freedom has been estimated to be ∼+14.9 (±3) kcal mol–1 (38). In order to form a stable echinomycin–DNA complex, these two positive free energy contributions must be overwhelmed by favorable contributions. As discussed above, the interaction between echinomycin and DNA appears to be largely driven by a hydrophobic contribution. Since we cannot derive a ΔCp for the binding reaction and do not have a coordination file for the echinomycin–DNA complex, it is difficult to compute the hydrophobic binding free energy. Our best estimate for hydrophobic transfer free energy may be obtained from changes of solvent accessible surface area (ΔSASA) using a triostin A–DNA complex and the equation: ΔGhyd = –22(±5) × ΔSASA cal mol–1 (38) since the echinomycin–DNA structure is known to be similar to the triostin A–DNA structure (11). ΔSASA was computed to be 791 Å2 for the triostin A–d(GCGTACGC)2 complex (39) using HyperChem software (Hypercube, Inc., Toronto, Canada). Therefore, ΔGhyd = –17.4 (±4.0) kcal mol–1, a large and favorable free energy contribution. As discussed above, ΔGpe = –1.04 kcal mol–1. After adding the four free energy contributions, the calculated free energy change (kcal mol–1) is:
ΔGcalc = ΔGconf + ΔGr+t + ΔGhyd + ΔGpe + ΔGint
= 8 + 14.9 + (–17.4) + (–1) + ΔGint
= 4.5 + ΔGint
With an assumption of ΔGcalc = ΔGobs = –7.6 kcal mol–1, a value of ΔGint = –12.1 kcal mol–1 is obtained. This computation implies that forces associated with direct contacts between echinomycin and DNA contribute significantly to the overall free energy of complex formation. This finding is consistent with the previous structural studies in which three major molecular interactions (hydrogen bonding, van der Waals interactions and base stacking) were found to be greatly involved in stabilizing the DNA–echinomycin complex (11,40). The other major driving force for formation of the echinomycin–DNA complex, namely the hydrophobic transfer of the antibiotic into the intercalation sites, is reflected in the positive enthalpy value directly measured by DSC, and in the changes of ΔSASA. Together, these two large, favorable energetic contributions combined with a minor polyelectrolyte contribution overcome the unfavorable free energy costs from conformational changes and the reduction of translational and rotational freedom, thus driving the formation of the echinomycin–DNA complex.
Figure 4 furnishes a comparison of the thermodynamics of interaction between selected compounds and DNA. These include the minor groove binder Hoechst 33258, the intercalators actinomycin D and daunorubicin, and the bisintercalator WP631. Even though echinomycin and actinomycin D are unambiguously intercalators, their thermodynamic profiles resemble that of the groove binder Hoechst 33258 more than those of daunorubicin and WP631. Both echinomycin and actinomycin D, however, have bulky peptide moieties that fill the minor groove. These groove interactions evidently dominate the binding thermodynamics, and yield a distinctive stamp that distinguishes echinomycin and actinomycin D from other intercalators.
Figure 4.
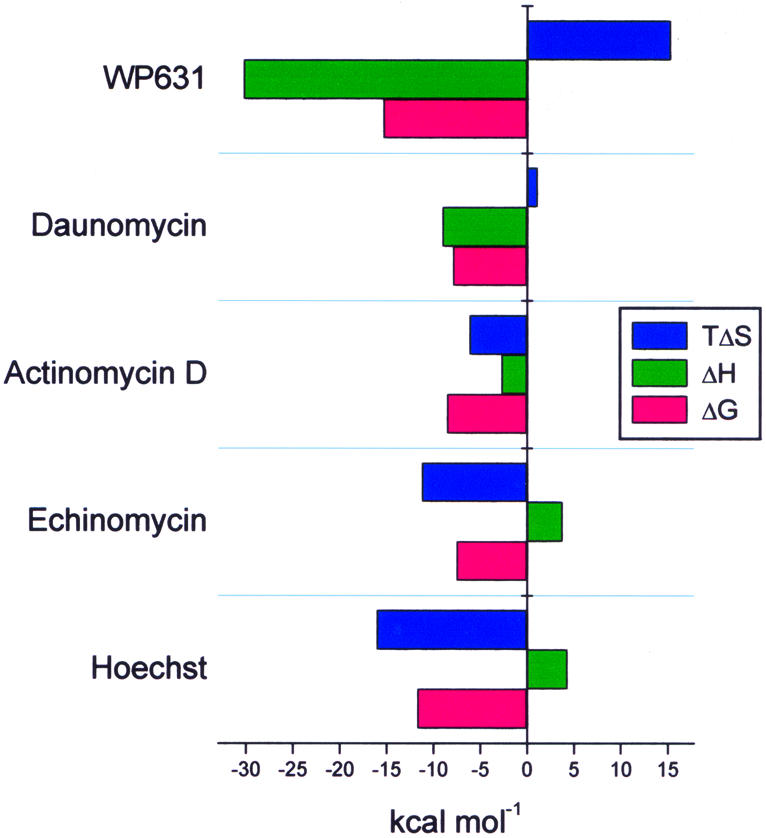
Comparison of the binding thermodynamics for several well characterized DNA-interactive compounds: WP631 (27), daunomycin (41), actinomycin D (42), echinomycin (this work) and Hoechst 33258 (43).
SUPPLEMENTARY MATERIAL
Supplementary Material is available at NAR Online.
Acknowledgments
ACKNOWLEDGEMENTS
This work was supported by grants (to M.J.W.) from the European Union and Cancer Research UK, and by grant CA35635 (to J.B.C.) from the National Institutes of Health and an FIU start-up fund (to F.L.).
REFERENCES
- 1.Waring M.J. (1979) Echinomycin, triostin, and related antibiotics. In Hahn,F.E. (ed.), Antibiotics V/2: Mechanism of Action of Antieukaryotic and Antiviral Compounds. Springer-Verlag, Berlin/Heidelberg/New York, pp. 173–194. [Google Scholar]
- 2.Waring M.J. (1990) The molecular basis of specific recognition between echinomycin and DNA. In Pullman,B. and Jortner J. (eds), Molecular Basis of Specificity in Nucleic Acid–Drug Interactions (23rd Jerusalem Symposium on Quantum Chemistry and Biochemistry). Kluwer, Dordrecht, The Netherlands pp. 225–245. [Google Scholar]
- 3.Waring M.J. (1993) Echinomycin and related quinoxaline antibiotics. In Neidle,S. and Waring,M.J. (eds), Molecular Aspects of Anticancer Drug–DNA Interactions. Macmillan, London, UK, Vol. 1, pp. 213–242. [Google Scholar]
- 4.Waring M.J. and Wakelin,L.P.G. (1974) Echinomycin: a bifunctional intercalating antibiotic. Nature, 252, 653–657. [DOI] [PubMed] [Google Scholar]
- 5.Wakelin L.P., Romanos,M., Chen,T.K., Glaubiger,D., Canellakis,E.S. and Waring,M.J. (1978) Structural limitations on the bifunctional intercalation of diacridines into DNA. Biochemistry, 17, 5057–5063. [DOI] [PubMed] [Google Scholar]
- 6.Laugaa P., Delepierre,M., Leon,P., Garbay-Jaureguiberry,C., Markovits,J., Le Pecq,J.B. and Roques,B.P. (1987) Monomers, dimers and trimers of acridines and 7H-pyridocarbazoles as antitumor drugs: NMR-derived structures of DNA complexes and structure-activity relationships. In Chagas,C. and Pullman,B. (eds), Molecular Mechanisms of Carcinogenic and Antitumour Activity. Pontificiae Academiae Scientiarum, Vatican City/Scripta Varia, Vol. 70, p. 275. [Google Scholar]
- 7.Wakelin L.P.G. and Waring,M.J. (1990) DNA intercalating agents. In Sammes,P.G. (ed.), Comprehensive Medicinal Chemistry. Pergamon Press, Oxford, UK, Vol. 2, pp. 703–724. [Google Scholar]
- 8.Gale E.F., Cundliffe,E., Reynolds,P.E., Richmond,M.H. and Waring,M.J. (1981) The Molecular Basis of Antibiotic Action. Wiley, London, UK. [Google Scholar]
- 9.Jennewein S. and Waring,M.J. (1997) Footprinting of echinomycin and actinomycin D on DNA molecules asymmetrically substituted with inosine and/or 2,6-diaminopurine. Nucleic Acids Res., 25, 1502–1510. [DOI] [PMC free article] [PubMed] [Google Scholar]
- 10.Muss H.B., Blessing,J.A., Baker,V.V., Barnhill,D.R. and Adelson,M.D. (1990) Echinomycin (NSC 526417) in advanced ovarian cancer. A phase II trial of the gynecologic oncology group. Am. J. Clin. Oncol., 13, 299–301. [DOI] [PubMed] [Google Scholar]
- 11.Ughetto G., Wang,A.H., Quigley,G.J., van der Marel,G.A., van Boom,J.H. and Rich,A. (1985) A comparison of the structure of echinomycin and triostin A complexed to a DNA fragment. Nucleic Acids Res., 13, 2305–2323. [DOI] [PMC free article] [PubMed] [Google Scholar]
- 12.Gao X.L. and Patel,D.J. (1988) NMR studies of echinomycin bisintercalation complexes with d(A1-C2-G3-T4) and d(T1-C2-G3-A4) duplexes in aqueous solution: sequence-dependent formation of Hoogsteen A1.T4 and Watson–Crick T1.A4 base pairs flanking the bisintercalation site. Biochemistry, 27, 1744–1751. [DOI] [PubMed] [Google Scholar]
- 13.Sheldrick G.M., Heine,A., Schmidt-Bäse,K., Pohl,E., Jones,P.G., Paulus,E. and Waring,M.J. (1995) Structures of quinoxaline antibiotics. Acta Crystallogr. B, 51, 987–999. [DOI] [PubMed] [Google Scholar]
- 14.Van Dyke M.M. and Dervan,P.B. (1984) Echinomycin binding sites on DNA. Science, 225, 1122–1127. [DOI] [PubMed] [Google Scholar]
- 15.Low C.M., Drew,H.R. and Waring,M.J. (1984) Sequence-specific binding of echinomycin to DNA: evidence for conformational changes affecting flanking sequences. Nucleic Acids Res., 12, 4865–4879. [DOI] [PMC free article] [PubMed] [Google Scholar]
- 16.Phillips D.R., White,R.J., Dean,D. and Crothers,D.M. (1990) Monte-Carlo simulation of multisite echinomycin–DNA interactions detected by in vitro transcription analysis. Biochemistry, 29, 4812–4819. [DOI] [PubMed] [Google Scholar]
- 17.Muller W. and Crothers,D.M. (1968) Studies of the binding of actinomycin and related compounds to DNA. J. Mol. Biol., 35, 251–290. [DOI] [PubMed] [Google Scholar]
- 18.Bittman R. and Blau,L. (1975) Stopped-flow kinetic studies of actinomycin binding to DNAs. Biochemistry, 14, 2138–2145. [DOI] [PubMed] [Google Scholar]
- 19.Waring M.J., Wakelin,L.P.G. and Lee,J.S. (1975) A solvent-partition method for measuring the binding of drugs to DNA. Application to the quinoxaline antibiotics echinomycin and triostin A. Biochim. Biophys Acta, 407, 200–212. [DOI] [PubMed] [Google Scholar]
- 20.McGhee J.D. and von Hippel,P.H. (1974) Theoretical aspects of DNA–protein interactions: cooperative and non-cooperative binding of large ligands to a one-dimensional homogeneous lattice. J. Mol. Biol., 86, 469–489. [DOI] [PubMed] [Google Scholar]
- 21.Wakelin S.P. and Waring,M.J. (1976) The binding of echinomycin to deoxyribonucleic acid. Biochem. J., 157, 721–740. [DOI] [PMC free article] [PubMed] [Google Scholar]
- 22.Quadrifoglio F. and Crescenzi,V. (1974) On the binding of actinomycin and of daunomycin to DNA: a calorimetric and spectroscopic investigation. Biophys. Chem., 2, 64–69. [DOI] [PubMed] [Google Scholar]
- 23.Fox K.R., Wakelin,L.P. and Waring,M.J. (1981) Kinetics of the interaction between echinomycin and deoxyribonucleic acid. Biochemistry, 20, 5768–5779. [DOI] [PubMed] [Google Scholar]
- 24.Fox K.R. and Waring,M.J. (1984) Stopped-flow kinetic studies on the interaction between echinomycin and DNA. Biochemistry, 23, 2627–2633. [DOI] [PubMed] [Google Scholar]
- 25.Crothers D.M. (1971) Statistical thermodynamics of nucleic acid melting transitions with coupled binding equilibria. Biopolymers, 10, 2147–2160. [DOI] [PubMed] [Google Scholar]
- 26.McGhee J.D. (1976) Theoretical calculations of the helix–coil transition of DNA in the presence of large, cooperatively binding ligands. Biopolymers, 15, 1345–1375. [DOI] [PubMed] [Google Scholar]
- 27.Leng F., Priebe,W. and Chaires,J.B. (1998) Ultratight DNA binding of a new bisintercalating anthracycline antibiotic. Biochemistry, 37, 1743–1753. [DOI] [PubMed] [Google Scholar]
- 28.Gauvreau D. and Waring,M.J. (1984) Directed biosynthesis of novel derivatives of echinomycin. II. Purification and structure elucidation. Can. J. Microbiol., 30, 730–738. [DOI] [PubMed] [Google Scholar]
- 29.Chaires J.B., Dattagupta,N. and Crothers,D.M. (1982) Studies on interaction of anthracycline antibiotics and deoxyribonucleic acid: equilibrium binding studies on interaction of daunomycin with deoxyribonucleic acid. Biochemistry, 21, 3933–3940. [DOI] [PubMed] [Google Scholar]
- 30.Chaires J.B. (1997) Possible origin of differences between van’t Hoff and calorimetric enthalpy estimates. Biophys. Chem., 64, 15–23. [DOI] [PubMed] [Google Scholar]
- 31.Wilson W.D. and Lopp,I.G. (1979) Analysis of cooperativity and ion effects in the interaction of quinacrine with DNA. Biopolymers, 18, 3025–3041. [DOI] [PubMed] [Google Scholar]
- 32.Friedman R.A. and Manning,G.S. (1984) Polyelectrolyte effects on site-binding equilibria with application to the intercalation of drugs into DNA. Biopolymers, 23, 2671–2714. [DOI] [PubMed] [Google Scholar]
- 33.Chaires J.B. (1996) Dissecting the free energy of drug binding to DNA. Anticancer Drug Design, 11, 569–580. [PubMed] [Google Scholar]
- 34.Brandts J.F. and Lin,L.N. (1990) Study of strong to ultratight protein interactions using differential scanning calorimetry. Biochemistry, 29, 6927–6940. [DOI] [PubMed] [Google Scholar]
- 35.Chaires J.B. (1997) Energetics of drug–DNA interactions. Biopolymers, 44, 201–215. [DOI] [PubMed] [Google Scholar]
- 36.Haq I. (2002) Thermodynamics of drug–DNA interactions. Arch. Biochem. Biophys., 403, 1–15. [DOI] [PubMed] [Google Scholar]
- 37.Macgregor R.B. Jr, Clegg,R.M. and Jovin,T.M. (1987) Viscosity dependence of ethidium–DNA intercalation kinetics. Biochemistry, 26, 4008–4016. [DOI] [PubMed] [Google Scholar]
- 38.Spolar R.S. and Record,M.T.,Jr (1994) Coupling of local folding to site-specific binding of proteins to DNA. Science, 263, 777–784. [DOI] [PubMed] [Google Scholar]
- 39.Wang A.H., Ughetto,G., Quigley,G.J. and Rich,A. (1986) Interactions of quinoxaline antibiotic and DNA: the molecular structure of a triostin A–d(GCGTACGC) complex. J. Biomol. Struct. Dyn., 4, 319–342. [DOI] [PubMed] [Google Scholar]
- 40.Gallego J., Luque,F.J., Orozco,M., Burgos,C., Alvarez-Builla,J., Rodrigo,M.M. and Gago,F. (1994) DNA sequence-specific reading by echinomycin: role of hydrogen bonding and stacking interactions. J. Med. Chem., 37, 1602–1609. [DOI] [PubMed] [Google Scholar]
- 41.Chaires J.B., Satyanarayana,S., Suh,D., Fokt,I., Przewloka,T. and Priebe,W. (1996) Parsing the free energy of anthracycline antibiotic binding to DNA. Biochemistry, 35, 2047–2053. [DOI] [PubMed] [Google Scholar]
- 42.Bailey S.A., Graves,D.E., Rill,R. and Marsch,G. (1993) Influence of DNA base sequence on the binding energetics of actinomycin D. Biochemistry, 32, 5881–5887. [DOI] [PubMed] [Google Scholar]
- 43.Haq I., Ladbury,J.E., Chowdhry,B.Z., Jenkins,T.C. and Chaires,J.B. (1997) Specific binding of Hoechst 33258 to the d(CGCAAATTTGCG)2 duplex: calorimetric and spectroscopic studies. J. Mol. Biol., 271, 244–257. [DOI] [PubMed] [Google Scholar]
Associated Data
This section collects any data citations, data availability statements, or supplementary materials included in this article.