Abstract
Because of its very low titer, varicella-zoster virus (VZV) infectivity is usually transferred by passage of trypsin dispersed infected cells. Previously, we observed that gC biosynthesis was markedly delayed in monolayers inoculated with cell free virus. In this report, we investigated the kinetics of gC expression in more detail and included studies of monolayers inoculated with trypsin dispersed infected cells, the more traditional method of VZV infection. Extensive imaging analyses disclosed that gC was detectable in some inoculum cells, but little gC biosynthesis occurred during the first 48 hpi in the newly infected underlying monolayer. In contrast, during the first 24–48 hpi, expression of VZV gE and gB was easily detectable. Using real-time RT-PCR, we found a delay in accumulation of VZV gC transcripts that paralleled the delay in expression of VZV gC protein. Treatment with hexamethylene bisacetamide (HMBA) increased expression of both gC protein and gC mRNA. HMBA treatment also increased virus titer by 4-fold, but paradoxically reduced plaque size in the titration assay. Finally, we examined skin vesicles from cases of chickenpox and zoster in humans and observed abundant amounts of gC expression. In short, this report documents an unexpected delay in both gC mRNA and protein production under all conditions of VZV infection of cultured cells.
Introduction
VZV is a very cell associated virus when propagated in cell culture. In addition, the infectivity titers are extremely low, usually less than 100,000 plaque forming units per 25 sq. cm. monolayer. Furthermore, the majority of viral particles produced in cell culture have an aberrant appearance because they are envelopes without capsids (Carpenter et al., 2008). Explanations for the above observations are a subject of continuing research. To this end, we have been investigating the biosynthesis and maturation of several VZV structural glycoproteins found in the envelope of the virion, including gE, gI, gB, and gH. These glycoproteins are synthesized and traffic through the trans-Golgi network en route to the outer plasma membrane within the expected 18–24 hour replication cycle of an alphaherpesvirus (Grose, 2006). In sharp contrast, when we recently examined the biosynthesis of VZV gC in infected cells after inoculation with cell free virus, we discovered that the glycoprotein was difficult to detect in the first 48 hpi (Storlie et al., 2006).
There have been clues that gC production is erratic in the VZV cell culture system. In early studies with different VZV strains, the observation was made that a low passage laboratory strain produced abundant amounts of gC, while the attenuated VZV Oka vaccine strain apparently produced only limited quantities of VZV gC (Kinchington et al., 1990a; Kinchington et al., 1990b). Earlier reports also suggested that VZV subcultured repeatedly in cell culture can spontaneously lose its ability to produce gC. However, sequencing subsequently demonstrated that some of these strains retained an intact gC gene and interest waned. Nevertheless, our interest was rekindled when we were able to document a markedly delayed gC biosynthesis in several VZV cell culture systems, using better antibody detection reagents and imaging technology than was available over 15 years ago, when the earlier studies were performed(Storlie et al., 2006). In this study, we expand our earlier studies to include more detailed analyses of gC expression and localization after inoculation of monolayers with trypsin dispersed infected cells under conditions used by VZV investigators in the past decades (Gershon, Cosio, and Brunell, 1973; Grose, 1980). Further, we correlate the temporal appearance of gC transcripts with gC gene products. Finally, we confirm that the gC protein is actually produced in abundance during VZV infection in skin vesicles, a major site of complete infectious virion formation in infected humans with varicella and zoster.
There is a secondary importance to this study. Because of the abundance of early and definitive HSV replication studies (Honess and Roizman, 1974; Stingley et al., 2000), VZV investigators have largely assumed that this related VZV alpha herpesvirus would closely follow the same triphasic replication pattern, including a coordinated passage through immediate early (IE), early and late phases within an 18–24 hour period(Grose and Ng, 1992). As we will show below, the delayed VZV gC biosynthesis in cell culture indicates the opposite, namely, that one component of VZV replication in cultured cells deviates from the HSV model in a manner that was not predictable based on previously published data.
Results
Observation of delayed VZV gC expression in landscape views
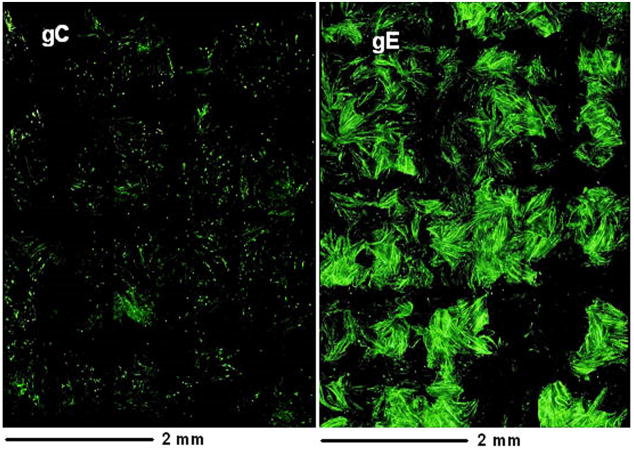
In our previous paper (Storlie et al., 2006), we examined monolayers for the appearance of specific VZV glycoproteins, usually after inoculation with cell free virus prepared by sonication of infected cells. Three major VZV glycoproteins gE, gI and gH were detected in the first 24 hpi but gC was not detected. This result was unexpected based on the long held assumption that the replication cycle of VZV, an alpha herpesvirus, would mirror that of the prototypic HSV-1 alpha herpesvirus. In our current investigation, we selected an inoculum of trypsin-dispersed infected cells from a monolayer with advanced CPE. This technique is by far the most common method for transfer of infectivity in all published VZV papers over the past 40 years. Our initial goal was to demonstrate that limited expression and localization of gC were not simply due to artifactual selection criteria. To this end, we prepared monolayers on circular coverslips that were 12 mm in diameter. Then we inoculated the monolayers with infected cells and collected photographs after immunostaining for gE and gC. An example of an infected monolayer is shown in Fig. 1. We obtained 96 side-by-side images and then assembled them in a single figure. The actual size of the figure is 4 × 6 mm, or approximately 20% of the area of the entire coverslip. The monolayer was not permeabilized, so only surface glycoproteins were detected by the fluoroprobes. As was clearly apparent, gE expression was abundant while gC expression was limited. Thus, we confirmed that our gC observations were not based on biased selection criteria during microscopy.
Fig. 1.
Landscape views showing VZV gE and gC expression on the surface of infected cells at 48 hpi. Replicate monolayers were infected with trypsin dispersed VZV-32 infected cells at 1:8 ratio. At 48 hpi, two were fixed and immunolabeled with mouse MAb 3B3 for gE and mouse MAb 233 for gC respectively. Both were then linked to the Alexa 488 fluorescent antibody and viewed in a Olympus BX-51 fluorescent microscope. Each panel is a montage (8×12 = 96 images) of fluorescence images taken at the same settings at 200 X, resulting in a composite image that shows a 4 × 6 mm area of the cellular monolayer. The surface labeling of gE was abundant, corresponding to virus induced syncytia, while gC surface labeling was very sparse with only one small gC positive syncytium. Note: both gC and gE are immunolabeled green in this figure.
Comparison of VZV gB expression with that of gC
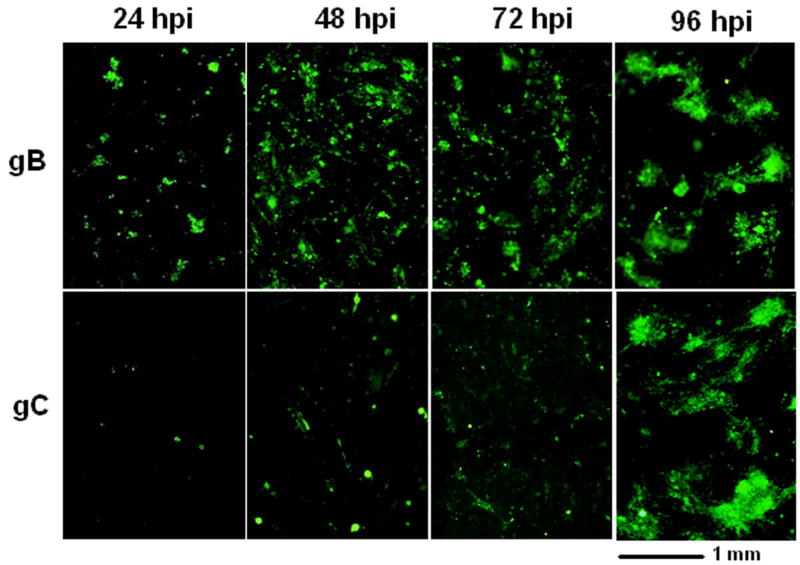
In all previous studies using either cell free virus or infected cells as inocula, we had compared the expression of three major glycoproteins gE, gI and gH with that of gC. But we had never investigated the temporal expression of another major VZV glycoprotein, namely gB (Heineman and Hall, 2002; Montalvo and Grose, 1987). To extend our investigations, we prepared replicate monolayers and inoculated them with infected cells. The non-permeabilized monolayers were immunostained at 24, 48, 72 and 96 hpi with antibodies against gB and gC (Fig. 2). The surface expression of gB closely followed that of gE, gI and gH, namely, gB expression was detectable at 24–48 hpi while that for gC was delayed further, as expected.
Fig. 2.
Relative expression of VZV gB and gC on the surface of infected cells at different time points post infection. Replicate monolayers were inoculated with trypsin-dispersed VZV-32 infected cells at a 1:8 ratio. At each time point, two samples were fixed and immunolabeled with mouse MAb 233 (gC) and mouse MAb 158 (gB) respectively, then linked to the Alexa 488 fluoroprobe. Each panel is a composite of 200 X images showing a 2.2 × 2.5 mm area of infected monolayer. Note: both gC and gB are immunolabeled green in this figure.
Detection of gC on a minority of inoculum cells
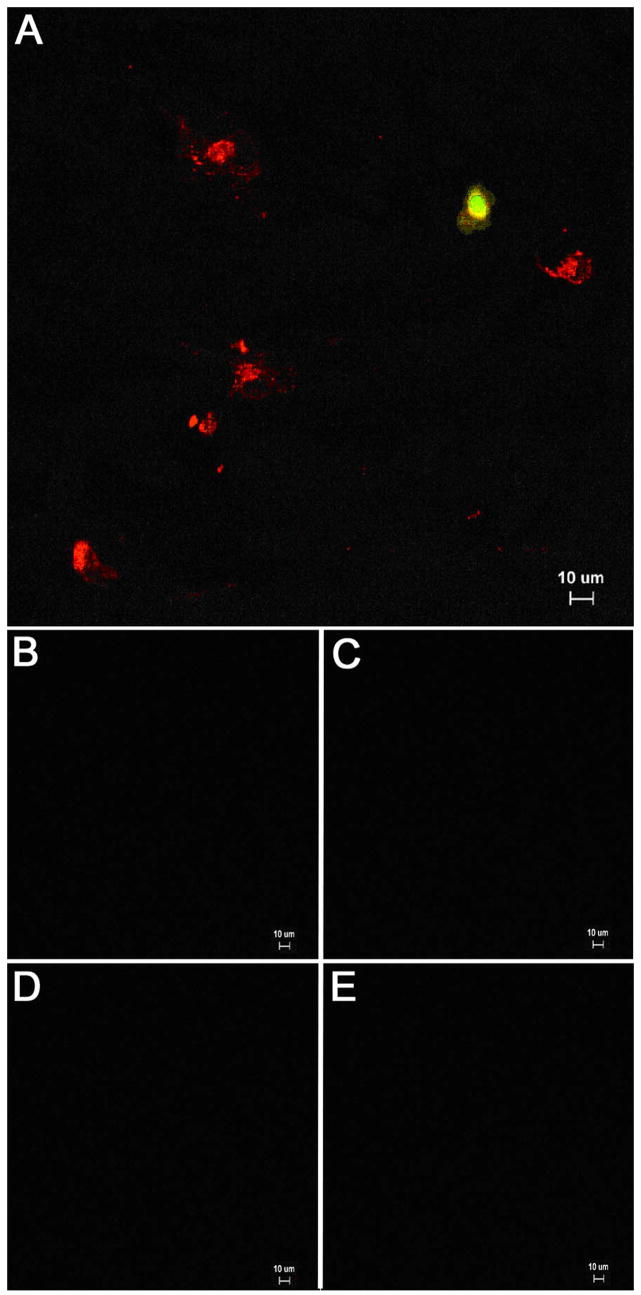
As we carried out the above experiments, we repeatedly observed a small number of cells that stained intensely for gC at early times after infection, i.e., within the first 24 hpi. Similar gC-positive cells had never been observed in our earlier experiments, where we imaged monolayers at multiple timepoints after inoculation with sonicated preparations of cell free virus. Thus, we postulated that these gC-positive cells were inoculum cells. For our next VZV cell-associated passage experiments, an infected monolayer was trypsin-dispersed, then the cells were resuspended in medium and aliquoted onto newly passaged monolayers. Low magnification imaging of VZV infected monolayers at 4 hpi disclosed that most inoculum cells were gE-positive but not gC-positive. However, about 1 out of 6–7 inoculum cells stained positively for both gE and gC (Fig. 3). Control experiments also were performed to assure that the VZV-specific antibody reagents did not adhere to uninfected monolayers.
Fig. 3.
Detection of VZV gE and gC in inoculum cells at 4 hpi. (A) A monolayer was inoculated with infected cells at a 1:8 ratio. At 4 hpi, the sample was fixed and permeabilized, then immunolabeled with mouse MAb 3b3 against gE (red) and rabbit Ab R19 against gC (green), followed by Alexa 546 and 488 secondary antibodies. The sample was viewed on an Olympus BX-51 fluorescence microscope at a magnification of 200 X. Six inoculum cells expressing gE alone were visible in the image. One inoculum cell expressed both gE and gC (yellow). Note the absence of any immunolabel in underlying monolayer at 4 hpi. (B) Control for MAB 3B3 against uninfected cells. (C) Control for R19 Ab against uninfected cells, (D) Control for MAb 233 against uninfected cells. (E) Control for guinea pig anti-E Ab against uninfected cells. The latter two reagents are used in Fig. 4 & 5.
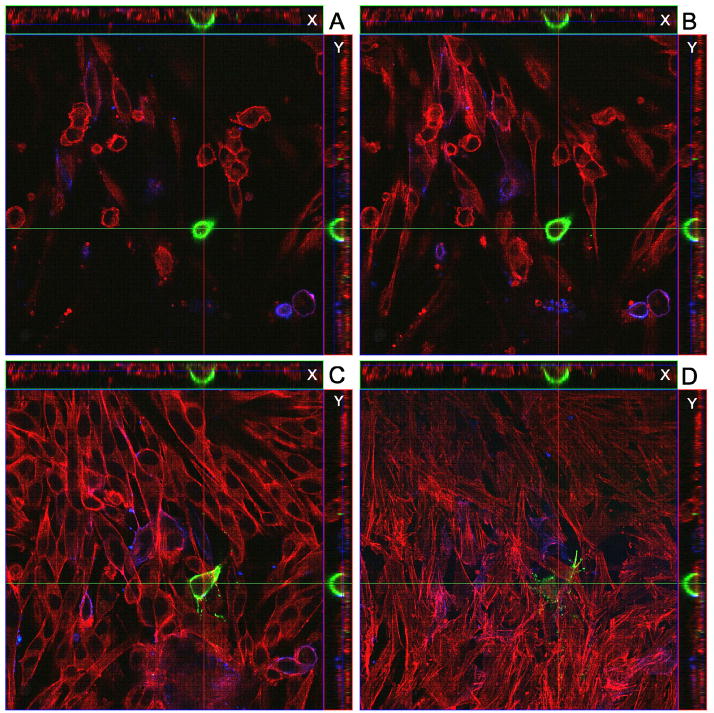
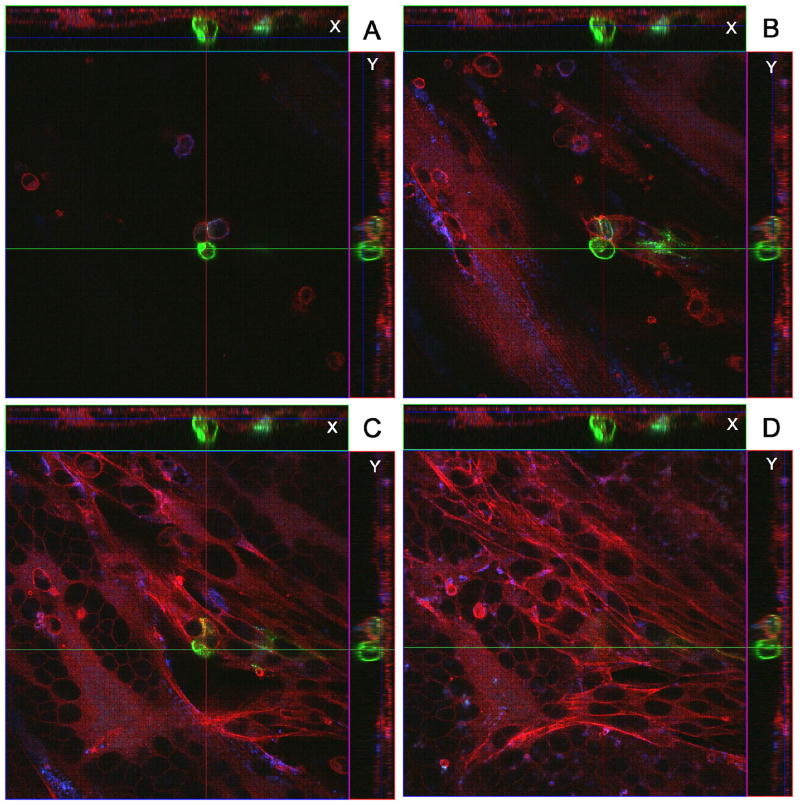
When imaging was performed at 24 and 48 hpi, we confirmed that strongly positive gC signals were found on a subset of infected inoculum cells (Fig. 4 & 5). The localization of immunostained cells was carefully defined after obtaining multiple Z-stacks of images. When the Z-stacks were examined in either the X or the Y axis, the gC positive cells were consistently observed at the surface of the monolayer. Occasionally at 48 hpi, projections were observed from the gC positive cells across the monolayer (Fig. 5). When infected monolayers were imaged at 48 hpi, we also noted that syncytia were forming beneath the gC-positive inoculum cells but the syncytia contained no gC-positive proteins. In other words, gC continued to lag behind that of gE.
Fig. 4.
Identification of a VZV gC-positive inoculum cell at 24 hpi. A cellular monolayer was infected with trypsin-dispersed VZV-32 infected cells at a 1:8 ratio, then fixed at 24 hpi and immunolabeled with mouse MAb 233 for gC and guinea pig Ab for gE and stained with Alexa phalloidin 555, goat anti-mouse 488 and goat anti-guinea pig 633 secondary antibodies. The sample was viewed in a Zeiss LSM 510 confocal microscope and a Z-stack (10 slices, 2 um thick) of images at 400 X was taken, showing a gC-positive inoculum cell on the cellular monolayer. Panels A–D show four slices from the Z-stack. Panel A is slice 7 (top most), B is slice 6, C is slice 4 and D is slice 2 (bottom most). Each panel includes the view from the Z direction with smaller side panels showing the view from X and Y, respectively.
Fig. 5.
Identification of a VZV gC-positive inoculum cell at 48 hpi. All conditions were the same as described in legend to Fig. 4. The sample was then viewed in a Zeiss LSM 510 confocal microscope and a Z-stack (15 slices, 2 um thick) of images at 400 X was taken, showing a gC-positive inoculum cell on the cellular monolayer. Panels A–D show four slices from the Z-stack. Panel A is slice 11 (top most), B is slice 7, C is slice 5 and D is slice 3 (bottom most). Each panel includes the view from the Z direction with smaller side panels showing the view from X and Y, respectively. Note the small syncytium in the lower left corner of panels C and D, beneath plane of the gC-positive cell.
Further evidence about localization of gC-containing inoculum cells
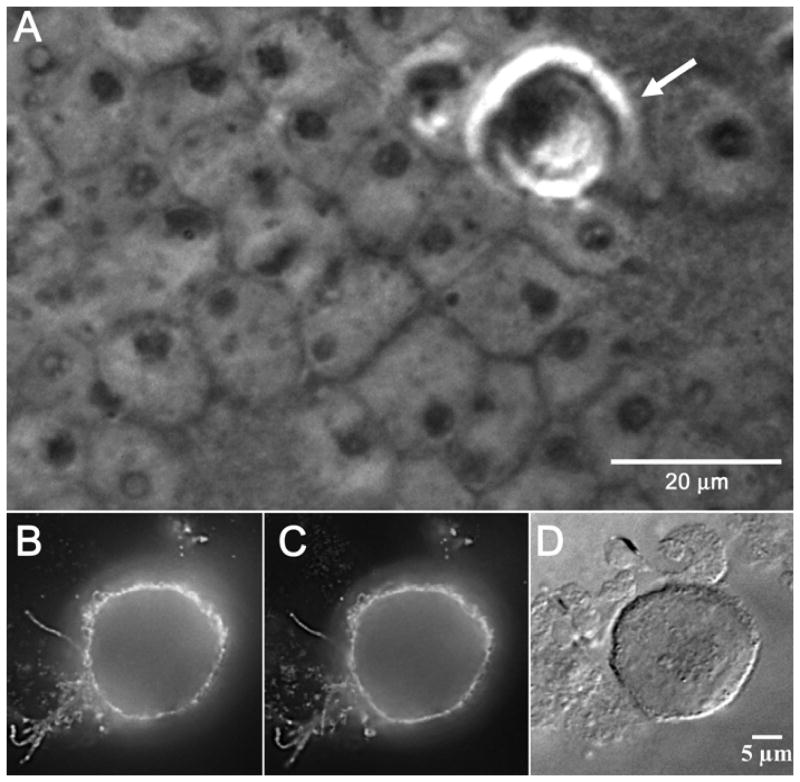
In order to document with greater certainty that the gC-containing cells were indeed the inoculum cells, we carried out an additional series of imaging experiments with phase contrast microscopy and differential interference contrast (DIC). Phase contrast microscopy enhances the contrast of phased objects in the sample being imaged, in other words, a phased object shifts the phase of light as the light passes through it. An infected inoculum cell is more optically dense than a normally transparent uninfected cell. Likewise, DIC microscopy enhances the contrast of optically dense material in a transparent and unstained sample by presenting an image of the interference between two beams of polarized light that have taken slightly different paths through the sample (because of prisms in the microscope). As shown in Fig. 6, newly transferred inoculum cells were often rolled into optically dense spheres resting on the surface of an optically less dense monolayer. These dense inoculum cells on the cell surface were immunostained simultaneously with both anti-gC MAb and anti-gC polyclonal antibodies (panels B and C).
Fig. 6.
Identification of VZV inoculum cells by different light microscopic techniques. A cellular monolayer was infected with trypsin dispersed VZV-32 infected cells at a 1:8 ratio, fixed at 48 hpi and immunolabeled with two gC antibodies: mouse MAb 233 and rabbit Ab R19. The sample was then stained with the goat anti-mouse Alexa 488 and goat anti-rabbit Alexa 546 secondary antibodies and viewed in an Olympus BX-51 light microscope, using the phase contrast, DIC and fluorescence settings. Panel A shows a high contrast phase object in the upper right corner that is an inoculum cell (arrow). Below it can be seen the nuclei of the cells in the underlying monolayer. Panels B and C are fluorescent images of a VZV infected inoculum cell immunolabeled with gC antibodies mouse MAb 233 and rabbit Ab R19, respectively. Panel D is a DIC image of the same immunolabeled inoculum cell.
Passaging of inoculum cells directly onto glass coverslips
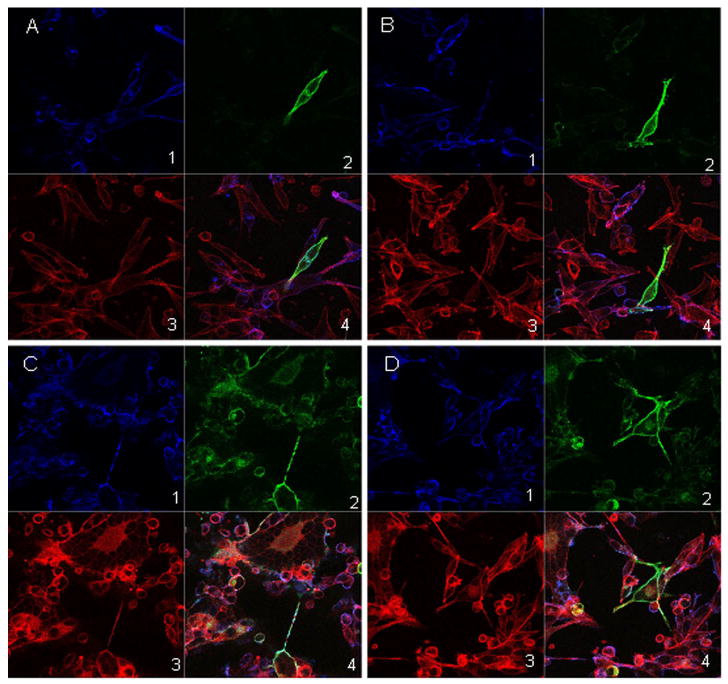
In all prior experiments about gC production by inoculum cells, we passaged the trypsin dispersed cells onto an uninfected monolayer. In order to observe the pattern of gC biosynthesis in the absence of an underlying monolayer, we passaged trypsin dispersed inoculum cells directly onto glass coverslips. The cells were taken from an infected monolayer with 75% CPE at 72 hpi. The cultured cells were immunostained with anti-gC and anti-gE antibodies (Fig 7). At 24 hr after subculturing, gC was detectable in a few inoculum cells while gE was found in most cells, in a pattern similar to that seen in Fig. 3 above. At 48 hr after subculturing, gC was seen in a majority of the inoculum cells. Thus, gC biosynthesis in an infected cell was accelerated by the process of trypsin dispersion and adherence to a glass surface.
Fig. 7.
VZV glycoprotein expression in infected inoculum cells plated directly onto coverslips. VZV-32 infected cells were plated onto poly-L-lysine coated glass coverslips, incubated, fixed and immunolabeled with guinea pig Ab for gE (blue) and mouse MAb 233 for gC (green), then stained with Alexa phalloidin 555 (red), goat anti-mouse 488 and goat anti-guinea pig 633 secondary antibodies. The samples were viewed with a Zeiss LSM-510 confocal fluorescence microscope. Panels A and B are images from 24 hr and panels C and D are images from 48 hr. Within each panel; sub-panels 1–4 show gE (blue), gC (green), phalloidin (red) and composite (blue, green and red) respectively.
Treatment of infected cells with HMBA
We have previously demonstrated that VZV gC production is accelerated by hexamethylene bisacetamide (HMBA) treatment of monolayers after inoculation with cell free virus (Storlie et al., 2006). HMBA is also known to increase the titer of other herpesviruses under certain conditions, e.g., herpes simplex virus-1 and Marek’s Disease Virus (Denesvre et al., 2007; Yang et al., 2002). To further define the conditions whereby VZV replication is affected by HMBA treatment, we added HMBA to the medium overlying monolayers inoculated with infected cells. The results demonstrated that HMBA treatment promoted an earlier expression of VZV gC, which was detected approximately 24 hr before its appearance in untreated infected cells (data not shown). In other words, the imaging results were very similar to those previously described after treatment of infected monolayers inoculated with cell free virus, namely, appearance of gC was accelerated (Storlie et al., 2006).
Analysis of gC transcripts in newly infected cells
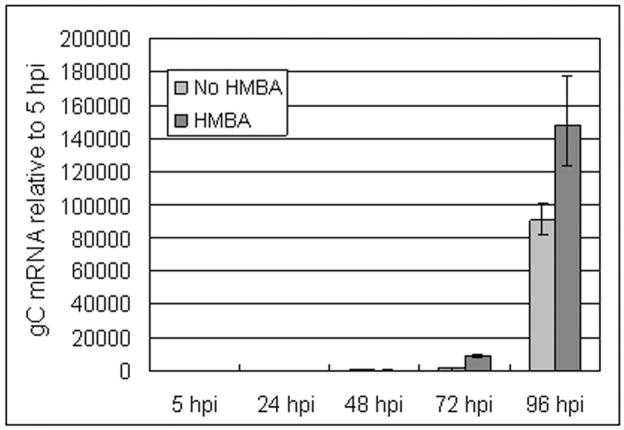
Earlier researchers who had reported the absence of gC protein from certain VZV strains had hypothesized a transcriptional mechanism for this absence (Kinchington et al., 1990a). We tested whether a delay in gC transcript accumulation could account for the delay in protein expression. Additionally, we compared levels with and without HMBA treatment. As noted earlier in this report, most of the gC protein immunolabeling during the first 48 hpi was on the inoculum cells. These inoculum cells would be older and more differentiated. In order to avoid the potentially confusing detection of gC transcripts in inoculum cells, we decided to measure gC transcripts in cells inoculated with cell free virus. We selected real-time RT-PCR to determine if delayed VZV gC expression resulted from a parallel delay in gC transcript appearance. We treated cells at 0 hpi and added fresh HMBA every 24 hpi thereafter. Two independent real-time RT-PCR experiments were carried out; both revealed a remarkable delay in the appearance of gC transcripts (Fig. 8). HMBA treatment led to increased gC transcript levels 24 hours earlier than untreated (Fig. 8). Relatively high gC transcript levels were not found until 96 hpi in the untreated sample. Thus, these mRNA findings corroborated our earlier imaging results about the delayed appearance of gC protein.
Fig. 8.
Measurement of VZV gC transcription after infection of cultured cells. The figure shows a comparison of VZV gC transcription between untreated infections and HMBA treated infections. Monolayers were inoculated with cell free virus. Treated cells were grown in 2.5 mM HMBA dissolved in tissue culture medium. Real-time RT-PCR was performed in quadruplicate to detect mRNA, as described in Methods. Data were analyzed with Applied Biosystems RQ Manager 1.2 software. Error bars indicate 95% confidence intervals.
Effect of gC expression on syncytial spread and titer
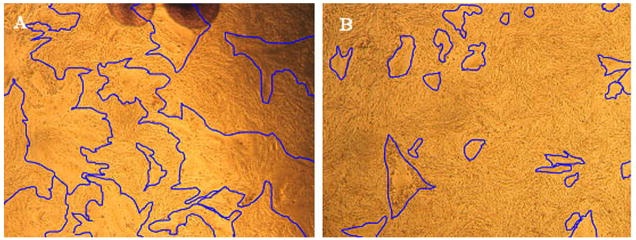
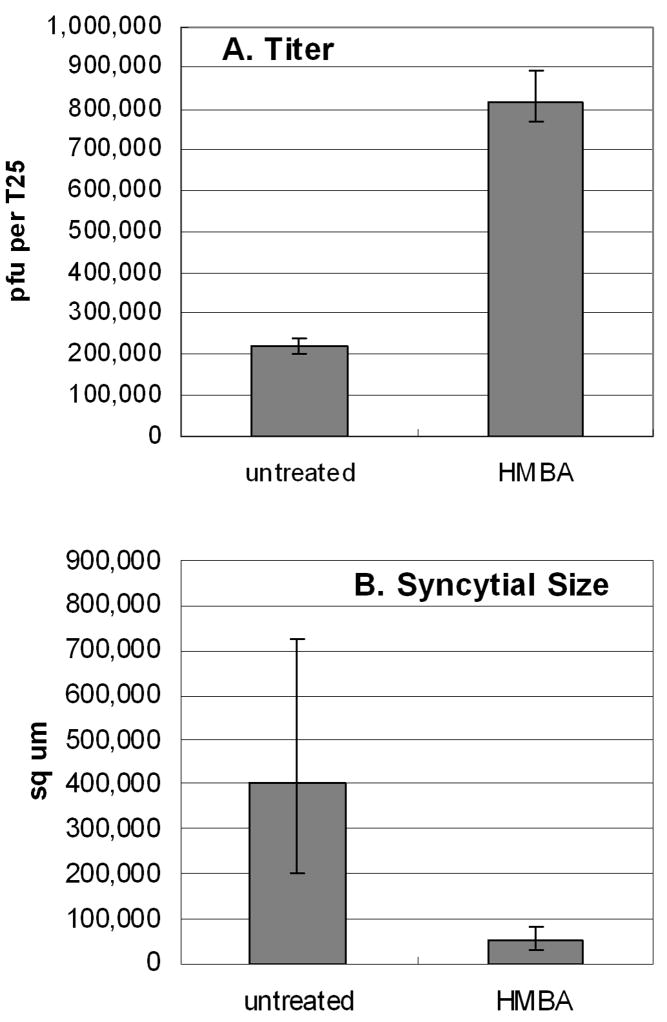
VZV is renowned for its low titer in infected cells. Based on our results described above, we postulated that HMBA treatment would increase the titer of virus. To examine this question, we first infected multiple monolayers with untreated trypsin-dispersed infected cells as inoculum. One set of monolayers was simultaneously treated with HMBA and another set was left untreated. After 72 hpi, these monolayers were disrupted and the titers were assayed. These cultures were photographed prior to harvesting them for titration. Unexpectedly, we observed that the HMBA treated monolayers generally had noticeably smaller syncytia than those in untreated infections. The areas within each syncytium were calculated with a NIH software program called Image J. Examples of syncytial sizes are illustrated in Fig. 9, where syncytia are outlined in both untreated and treated cells at a 72 hpi time point. In an untreated monolayer, a small syncytium including tens of cells was 40 × 150 um or 6000 sq um, a medium sized syncytium was 300 × 500 um or 150,000 sq um, while a large syncytium was 10× larger or 1,500,000 sq um. Paradoxically, although HMBA treatment resulted in a reduction in average syncytial size, the same treatment led to a four fold increase in titer when compared to untreated cells (Fig. 10).
Fig. 9.
Measurement of syncytial size in VZV infected cells with and without HMBA treatment. Monolayers were inoculated with cell free virus and incubated for 72 hr. Syncytia in representative areas of digital optical images of the infected cells were outlined using the freehand selection tool in ImageJ software. (A) Untreated infected cells; (B) HMBA treated infected cells.
Fig. 10.
Effect of HMBA treatment on VZV titer and syncytial size at 72 hpi. A. Titer of cell-free virus in the presence or absence of HMBA treatment. HMBA was added at time of infection and a cell-free inoculum was generated at 72 hpi by sonication. Four 24-well plates were inoculated with the serially diluted sonicated sample. The procedure was repeated independently for both untreated and HMBA treated monolayers. B. Size of syncytia (sq microns) in treated and untreated infections. Syncytial size was quantified using the ROI function in NIH ImageJ (See Fig. 9). Eight randomly chosen syncytia in each infected monolayer were measured. The error bars in both graphs correspond to the 95% confidence interval.
VZV gC protein in human zoster vesicles
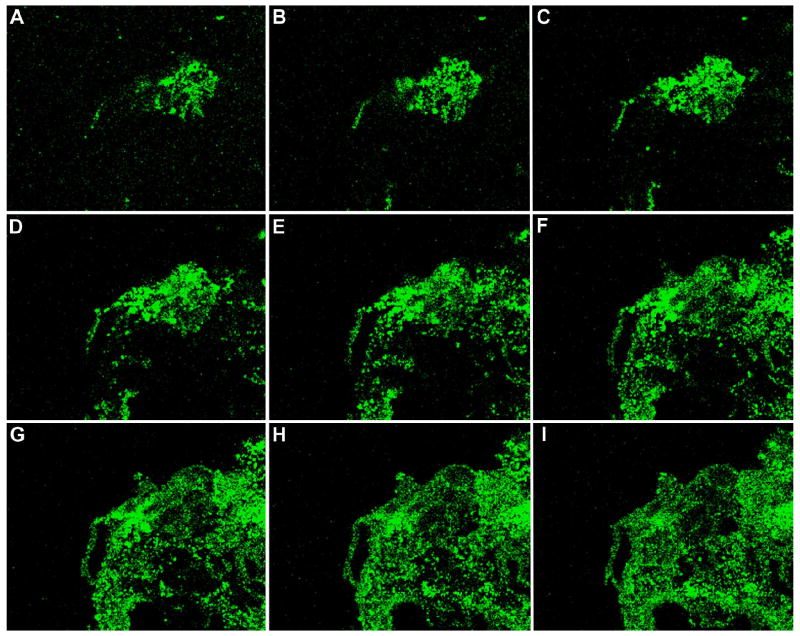
Whether or not VZV gC is produced in human zoster vesicles has never been investigated, because reagents were not available in the past. In a much earlier report, we investigated which viral proteins were detected in human varicella and zoster vesicles by our first panel of MAb reagents; these antibodies were produced after immunization of mice with live VZV infected cultured cells (Weigle and Grose, 1983). But we did not probe with any anti-gC antibody reagents. Therefore, we retrieved the same skin biopsy samples in order to examine whether gC protein was expressed in these vesicles. When we immunolabeled human varicella and zoster vesicles with MAb 233 and a secondary fluorophore, we observed an abundance of gC-specific staining in all vesicles (Fig. 11). We purposely included serial images through an entire vesicle because of the necessity to document that we exerted no selection bias when preparing the figure.
Fig. 11.
Detection of VZV gC protein in serial sections through an entire paraffin-embedded human vesicle. This biopsy was from a patient with zoster. The serial sections were freed of paraffin and immunolabeled with mouse MAb 233 against gC, then linked with the Alexa 488 fluorophore. All images were taken on a Zeiss LSM 510 confocal microscope at a magnification of 200 X. The origin of the VZV vesicle biopsy was described in a previous publication (Weigle and Grose, 1983).
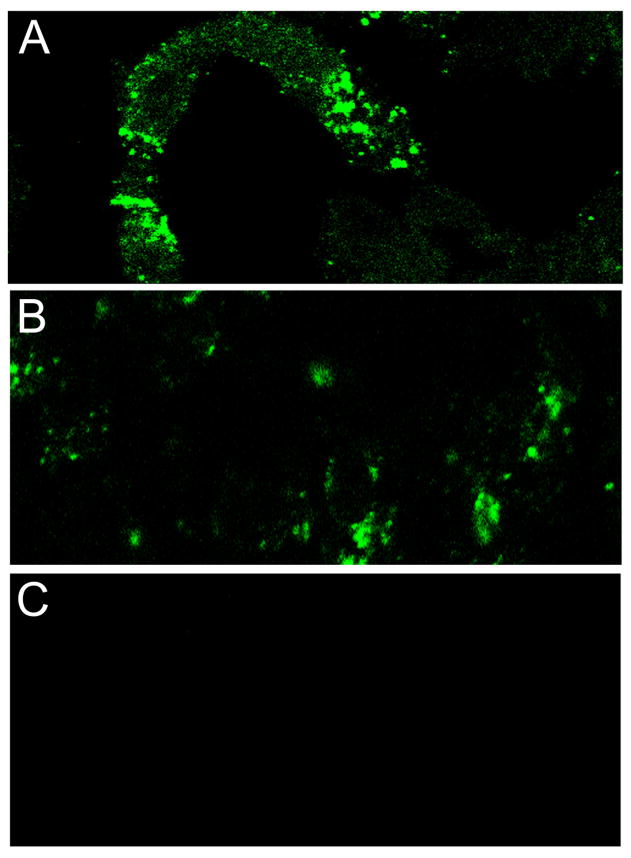
As a positive control experiment, we also immunostained vesicles for the gE glycoprotein and the IE62 major regulatory protein (Fig. 12). As anticipated, gE was easily detectable and present in similar amounts to gC within every examined vesicle. We had not previously tested an anti-IE62 antibody on human vesicles. The IE62 protein was distributed in a less organized pattern than either gE or gC, although still detectable in every vesicle sample tested. Control samples incubated with secondary antibodies alone were negative (Fig. 12). Thus, these new experiments both confirmed and expanded our original investigations of VZV protein production within a human vesicle, which were carried out 25 years ago with less sophisticated imaging technology (Weigle and Grose, 1983).
Fig. 12.
Detection of VZV gE and IE62 in sections of a human vesicle. This biopsy was from the same patient as in Fig. 11. Sections A and B were immunolabeled with mouse MAb 3B3 for gE and mouse MAb 5C6 for IE62, respectively. The Alexa 488 secondary antibody was then applied to both sections. Secondary Alexa 488 antibody alone was applied to section C (goat anti-mouse) as a negative control. All images were taken on a Zeiss LSM 510 confocal microscope at a magnification of 200 X.
Discussion
Our results document under all conditions of VZV infection an unexpected pattern for delayed gC expression that is completely different from four other major VZV glycoproteins (gE, gI, gH and gB), and markedly different from any HSV glycoprotein also. The studies illustrated in the figures were carried out with VZV-32 strain, a completely sequenced strain. We also repeated many of the studies herein with the commonly used but non-sequenced VZV-Ellen strain; the results were very similar (data not shown). In HSV-1 infection, the true late gC gene product is the last major glycoprotein to be expressed; its mRNA is relatively abundant by 5 hpi and the protein is expressed at high levels within a single HSV replication cycle of about 14 hours (Levine et al., 1990; Swain, Peet, and Galloway, 1985; Zhang et al., 1987).
The extended delay in VZV gC expression in the newly infected monolayer until 48–72 hr after inoculation may explain some of the anomalous and sometimes conflicting findings about VZV gC in the literature. For example, the interesting observation that VZV variants producing little or no gC arise spontaneously after multiple passages in cell culture may be explained by the results in this report (Kinchington et al., 1990a; Kinchington et al., 1990b). In the latter situation, if a monolayer were inoculated with cells obtained from an infected monolayer before maximal gC production, and if this process were repeated multiple times, eventually the newly infected monolayer would exhibit little or no gC expression (even though the virus contained an intact gC gene and still could produce gC if given sufficient incubation time). Prior comparisons between a gC null virus and a gC positive parental virus may need to be re-investigated under conditions that assure substantial gC production by the gC positive parent (Cohen and Seidel, 1994). Similarly, prior experiments demonstrating inhibition of VZV entry by heparin may have been influenced by variable gC expression (Zhu et al., 1995). In general, we conclude that most prior studies of VZV infection in cultured cells by ourselves and others over the past decades have been carried out under conditions in which gC production was markedly delayed. We cannot yet say whether this delay in gC expression is restricted to gC alone or may signal unanticipated alterations in expression of other gene products in the late phase of VZV replication.
Following the identification of a delay in protein expression, we postulated that delayed transcription may account for the delayed gC expression. To this end, we examined VZV glycoprotein C at the transcript level. We wished to identify if the extremely low levels we found at the protein level correlated with extremely low levels of gC RNA and to test the effect of HMBA on gC transcript levels. Our real time RT-PCR results correlated with our previous findings at the protein level, supporting the hypothesis that gC expression was delayed in cell culture. While they do not rule out the possibility that a posttranscriptional block also exists to gC expression, the RT-PCR data showed that a delay in transcript accumulation alone could account for the delay in gC protein expression. Our results also explain why some VZV microarray analyses have detected gC mRNA at relatively early timepoints after infection. Namely, these VZV studies have used infected cells as the inoculum (Cohrs et al., 2006). Thus, the investigators have carried over gC mRNA in inoculum cells that will produce small amounts of gC protein in the first 24 hpi. Another group examined VZV gene expression at a single late time point after co-cultivation at a 1:1 ratio of infected and uninfected cells (Kennedy et al., 2005). Their method of infection leads to more rapid progression of cytopathic effect, whereby their time point at 72 hpi would be equivalent to our time point at 96 hpi (Fig. 8). Since their cultures were harvested only at maximal cytopathic effect, they did not detect the relative delay in gC transcription observed by us during the first 24–48 hpi.
The associations between (i) increased gC production and increased cell free virus in vivo and (ii) increased gC production and decreased syncytial size in vitro are not without precedent. Genomic analyses have revealed that VZV gC shares high homology with Marek’s disease virus glycoprotein C. Interestingly, MDV is another alpha herpesvirus that has been termed highly cell associated. Because MDV also fails to produce cell free virus in cell culture, infectivity is usually transferred within cells in the same manner as VZV. For years it has been noticed that MDV gC production tends to decline with repeated passaging in cultured cells and that strains lacking gC altogether are attenuated (de Boer, Pol, and Oei, 1987). Furthermore, MDV gC deletion mutants have a more syncytial phenotype in tissue culture (Tischer et al., 2005). In its natural host, a MDV gC frameshift mutant strain has been shown to have lost its ability to spread from chicken to chicken. Repair of the MDV gC gene, in conjunction with two other ORFs: UL13 (VZV ORF47 protein kinase ortholog) and US2, which VZV lacks, resulted in restoration of horizontal transmission (Jarosinski et al., 2007). Finally, in order to facilitate production of infectious virus, cytodifferentiating agents such as n-butyrate and HMBA are frequently added to MDV infected monolayers (Denesvre et al., 2007; Parcells et al., 2001).
The positive effect of HMBA treatment on VZV titer has at least three possible explanations, some of which may be overlapping. The first is the model proposed by Yang et al. (2002) in their studies of HSV-1 lacking VP16, namely, that HMBA treatment enhances the overall expression of HSV IE and early genes. The second model was suggested by Storlie et al. (2006), namely, that HMBA treatment induces higher levels of Pbx/Hox transcription factors and these factors attach to putative binding sites located in the promoter region of VZV gC (ORF14); the Pbx/Hox binding sites were defined after an extensive bioinformatics search. Thirdly, HMBA treatment has been shown to slow transition of eukaryotic cells into the DNA synthesis phase and instead induce changes characteristic of cellular differentiation, presumably providing a preferred cellular milieu for not only VZV infection but also MDV infection, as noted in the preceding paragraph (Preston and McFarlane, 1998;Denesvre et al., 2007). Of note, Pbx/Hox transcription factors are critical for both hair follicle and feather follicle development (see below).
In its natural host, MDV only assembles complete viral particles in the feather follicle (Baigent et al., 2007). Infectious VZV particles are abundant in skin vesicles during varicella and zoster infection. Electron micrographs illustrating the presence of numerous enveloped virions within a VZV vesicle have been published(Grose, 1994; Tournier, Cathala, and Bernhard, 1957). Varicella vesicles are often found in hair follicles(Weigle and Grose, 1983). The varicella exanthem usually appears first in the hair of the scalp. As suggested by MDV investigators (Osterrieder et al., 2006), we concur that there appear to be several previously unappreciated similarities between general properties of MDV and VZV in sites of assembly (feather follicle and hair follicle), and MDV gC and VZV gC glycoproteins, in particular.
Materials and Methods
Viruses and cells
The genome of VZV-32 strain has been completely sequenced (Peters et al., 2006). VZV-32 strain is maintained at passages less than 20. VZV-Ellen is a frequently used VZV laboratory strain that has been passaged more than 90 times (Gershon, Cosio, and Brunell, 1973). All strains were propagated and passaged in human melanoma cells (Mewo) in minimal essential medium supplemented with 8% fetal bovine serum and Penstrep (Invitrogen) antibiotics. Infected cell monolayers used for inocula were harvested 3–4 days post infection, when they showed >70 % cytopathic effect. Trypsin-dispersed infected cells were subcultured at a ratio of 1 infected cell to 8 uninfected cells (Grose and Brunell, 1978). For preparation of cell free virus, infected monolayers were dislodged into a sterile plastic tube containing 2 ml medium lacking bovine serum; the tube was placed in crushed ice and subjected to sonication for 10 sec with a Sonicator Model W-220 outfitted with a steel microprobe, purchased from Heat Systems-Ultrasonics, Inc. (Grose et al., 1979). After sonication, the tube was centrifuged at 800 rpm for 10 min in a Damon/IEC CRU-5000 centrifuge. Titrations were performed as described in the same 1979 report.
Treatment of VZV infected monolayers and measurement of syncytia
At the time of infection in some experiments, some monolayers were incubated with medium containing 2.5 mM hexamethylene bisacetamide (HMBA; Aldrich Chemicals) (Preston and McFarlane, 1998; Yang et al., 2002). A 100x stock solution was made by dissolving HMBA into 1 ml dimethyl sulfoxide and 19 ml medium. Measurement of VZV-induced syncytial size was performed with ImageJ software. Specifically, images of syncytia taken with a digital camera through the objective of a light microscope at 10X were imported into ImageJ. Selected syncytia were outlined with the freehold tool in ImageJ, then added to the Region of Interest Manager for measurement of area. Conversion to sq microns were done in the Set Scale window of ImageJ, which specifically sets the number of pixels per micron.
Fluorescence microscopy imaging experiments
Antibody probes included the following reagents: murine monoclonal antibody (MAb) against gC clone 233, rabbit polyclonal monospecific anti-gC antibody R19, murine MAb 158 against gB, mouse MAb 3B3 against gE, guinea pig polyclonal monospecific anti-gE, and mouse MAb 5C6 against VZV IE62. Most antibodies were produced in this laboratory by published techniques (Grose, 1990; Grose et al., 1983). The rabbit anti-gC antibody was extensively adsorbed against uninfected cells to remove any non-specific reactivity. Secondary fluorophores included goat anti-rabbit 488; goat anti-mouse 546; goat anti-mouse 488, goat anti-guinea pig 633, from Molecular Probes. Immunofluorescent images were generated using a Zeiss LSM 510 confocal microscope with an automated Z stage or an Olympus BX-51 immunofluorescence microscope with automated X and Y stages. For the imaging of untreated and treated cells, cells were fixed in 2% paraformaldehyde and, where applicable, permeabilized in 0.05% triton-X in PBS following standard protocols (Storlie et al., 2006).
Real-time reverse-transcription PCR (RT-PCR)
Total RNA was extracted from uninfected and VZV infected melanoma cells at the given time points using Qiagen RNEasy mini kit. Polyadenylated RNA was converted to cDNA using OligoDT primers for glyceraldehyde 3-phosphate dehydrogenase (GAPDH) normalized experiments. Invitrogen SuperScriptTM First-Strand Synthesis System for RT-PCR was used for first strand synthesis. Real-time PCR was performed using Power SYBR Green PCR Master Mix available from Applied Biosystems. Primers for amplification of ORF14 (gC) and GAPDH included the following: ORF14F1 5′-CGG CGG AAT ACA ATC CAT ACC-3′ and ORF14R1 5′-CCG GTC GTT AGA CGC ATG T-3′ and GAPDHF2 5′-ACA CCC ACT CCT CCA CCT TTG-3′ and GAPDHR2 5′-CAT ACC AGG AAA TGA GCT TGA CAA-3′. Each primer set yielded an amplicon of approximately 70 nucleotides. Primers were validated by comparing the CT of the standard curves of each of the amplification curves generated with each of the primer pairs listed above, showing them to have equivalent amplification efficiencies. CT is defined as the fractional PCR cycle number at which the reporter fluorescence is greater than the threshold. Quadruplicates of the various treated and untreated samples were amplified with the respective primers to generate amplification curves, which were processed using SDS 2.4 software (Applied Biosystems). The curves were normalized with the endogenous control curves, and the resulting CT was compared to the calibrator, in this case the untreated infected cells using the SDS RQ Manager 1.2 software. Confidence intervals were automatically calculated using RQ Manager 1.2 set to 95% confidence interval.
Acknowledgments
This research was supported in part by NIH grant AI22795 and a stipend from the VZV Research Foundation. We thank Elaine Smith for statistical assistance. We thank other members of John Storlie’s microbiology thesis defense committee for their advice and encouragement during the course of these investigations (J. Butler, M. Feiss, R. Roller and D. Bonthius).
Footnotes
Publisher's Disclaimer: This is a PDF file of an unedited manuscript that has been accepted for publication. As a service to our customers we are providing this early version of the manuscript. The manuscript will undergo copyediting, typesetting, and review of the resulting proof before it is published in its final citable form. Please note that during the production process errors may be discovered which could affect the content, and all legal disclaimers that apply to the journal pertain.
References
- Baigent SJ, Smith LP, Currie RJ, Nair VK. Correlation of Marek’s disease herpesvirus vaccine virus genome load in feather tips with protection, using an experimental challenge model. Avian Pathol. 2007;36(6):467–74. doi: 10.1080/03079450701639319. [DOI] [PubMed] [Google Scholar]
- Carpenter JE, Hutchinson JA, Jackson W, Grose C. Egress of light particles among filopodia on the surface of Varicella-Zoster virus-infected cells. J Virol. 2008;82(6):2821–35. doi: 10.1128/JVI.01821-07. [DOI] [PMC free article] [PubMed] [Google Scholar]
- Cohen JI, Seidel KE. Absence of varicella-zoster virus (VZV) glycoprotein V does not alter growth of VZV in vitro or sensitivity to heparin. J Gen Virol. 1994;75(Pt 11):3087–93. doi: 10.1099/0022-1317-75-11-3087. [DOI] [PubMed] [Google Scholar]
- Cohrs RJ, Gilden DH, Gomi Y, Yamanishi K, Cohen JI. Comparison of virus transcription during lytic infection of the Oka parental and vaccine strains of Varicella-Zoster virus. J Virol. 2006;80(5):2076–82. doi: 10.1128/JVI.80.5.2076-2082.2006. [DOI] [PMC free article] [PubMed] [Google Scholar]
- de Boer GF, Pol JM, Oei HL. Biological characteristics of Marek’s disease vaccine CVI-988 clone C1. Vet Q. 1987;9(Suppl 1):16S–28S. doi: 10.1080/01652176.1987.9694135. [DOI] [PubMed] [Google Scholar]
- Denesvre C, Blondeau C, Lemesle M, Le Vern Y, Vautherot D, Roingeard P, Vautherot JF. Morphogenesis of a highly replicative EGFPVP22 recombinant Marek’s disease virus in cell culture. J Virol. 2007;81(22):12348–59. doi: 10.1128/JVI.01177-07. [DOI] [PMC free article] [PubMed] [Google Scholar]
- Gershon A, Cosio L, Brunell PA. Observations on the growth of varicella-zoster virus in human diploid cells. J Gen Virol. 1973;18:21–31. doi: 10.1099/0022-1317-18-1-21. [DOI] [PubMed] [Google Scholar]
- Grose C. The synthesis of glycoproteins in human melanoma cells infected with varicella-zoster virus. Virology. 1980;101(1):1–9. doi: 10.1016/0042-6822(80)90478-x. [DOI] [PubMed] [Google Scholar]
- Grose C. Glycoproteins encoded by varicella-zoster virus: biosynthesis, phosphorylation, and intracellular trafficking. Annu Rev Microbiol. 1990;44:59–80. doi: 10.1146/annurev.mi.44.100190.000423. [DOI] [PubMed] [Google Scholar]
- Grose C. Varicella zoster virus infections: chickenpox, shingles and varicella vaccine. In: Glaser R, Jones JF, editors. Herpesvirus Infections. Marcel Dekker; New York: 1994. pp. 117–185. [Google Scholar]
- Grose C, Brunell PA. Varicella-zoster virus: isolation and propagation in human melanoma cells at 36 and 32 degrees C. Infect Immun. 1978;19(1):199–203. doi: 10.1128/iai.19.1.199-203.1978. [DOI] [PMC free article] [PubMed] [Google Scholar]
- Grose C, Edwards DP, Friedrichs WE, Weigle KA, McGuire WL. Monoclonal antibodies against three major glycoproteins of varicella-zoster virus. Infect Immun. 1983;40(1):381–8. doi: 10.1128/iai.40.1.381-388.1983. [DOI] [PMC free article] [PubMed] [Google Scholar]
- Grose C, Maresova L, Medigeshi G, Scott G, Thomas G. Endocytosis of varicella-zoster virus glycoproteins: virion envelopment and egress. In: Sandri-Goldin R, editor. Advances in Alpha Herpesviruses. Academic Press; London: 2006. [Google Scholar]
- Grose C, Ng TI. Intracellular synthesis of varicella-zoster virus. J Infect Dis. 1992;166(Suppl 1):S7–12. doi: 10.1093/infdis/166.supplement_1.s7. [DOI] [PubMed] [Google Scholar]
- Grose C, Perrotta DM, Brunell PA, Smith GC. Cell-free varicella-zoster virus in cultured human melanoma cells. J Gen Virol. 1979;43(1):15–27. doi: 10.1099/0022-1317-43-1-15. [DOI] [PubMed] [Google Scholar]
- Heineman TC, Hall SL. Role of the varicella-zoster virus gB cytoplasmic domain in gB transport and viral egress. J Virol. 2002;76(2):591–9. doi: 10.1128/JVI.76.2.591-599.2002. [DOI] [PMC free article] [PubMed] [Google Scholar]
- Honess RW, Roizman B. Regulation of herpesvirus macromolecular synthesis. I. Cascade regulation of the synthesis of three groups of viral proteins. J Virol. 1974;14(1):8–19. doi: 10.1128/jvi.14.1.8-19.1974. [DOI] [PMC free article] [PubMed] [Google Scholar]
- Jarosinski KW, Margulis NG, Kamil JP, Spatz SJ, Nair VK, Osterrieder N. Horizontal transmission of Marek’s disease virus requires US2, the UL13 protein kinase, and gC. J Virol. 2007;81(19):10575–87. doi: 10.1128/JVI.01065-07. [DOI] [PMC free article] [PubMed] [Google Scholar]
- Kennedy PGE, Grinfeld E, Craigon M, Vierlinger K, Roy D, Forster T, Ghazal P. Transcriptomal analysis of varicella-zoster virus infection using long oligonucleotide-based microarrays. J Gen Virol. 2005;86(10):2673–2684. doi: 10.1099/vir.0.80946-0. [DOI] [PubMed] [Google Scholar]
- Kinchington PR, Ling P, Pensiero M, Gershon A, Hay J, Ruyechan WT. A possible role for glycoprotein gpV in the pathogenesis of varicella-zoster virus. Adv Exp Med Biol. 1990a;278:83–91. doi: 10.1007/978-1-4684-5853-4_9. [DOI] [PubMed] [Google Scholar]
- Kinchington PR, Ling P, Pensiero M, Moss B, Ruyechan WT, Hay J. The glycoprotein products of varicella-zoster virus gene 14 and their defective accumulation in a vaccine strain (Oka) J Virol. 1990b;64(9):4540–8. doi: 10.1128/jvi.64.9.4540-4548.1990. [DOI] [PMC free article] [PubMed] [Google Scholar]
- Levine M, Krikos A, Glorioso JC, Homa FL. Regulation of expression of the glycoprotein genes of herpes simplex virus type 1 (HSV-1) Adv Exp Med Biol. 1990;278:151–64. doi: 10.1007/978-1-4684-5853-4_16. [DOI] [PubMed] [Google Scholar]
- Montalvo EA, Grose C. Assembly and processing of the disulfide-linked varicella-zoster virus glycoprotein gpII(gB) J Virol. 1987;61(9):2877–84. doi: 10.1128/jvi.61.9.2877-2884.1987. [DOI] [PMC free article] [PubMed] [Google Scholar]
- Osterrieder N, Kamil JP, Schumacher D, Tischer BK, Trapp S. Marek’s disease virus: from miasma to model. Nat Rev Microbiol. 2006;4(4):283–94. doi: 10.1038/nrmicro1382. [DOI] [PubMed] [Google Scholar]
- Parcells MS, Lin SF, Dienglewicz RL, Majerciak V, Robinson DR, Chen HC, Wu Z, Dubyak GR, Brunovskis P, Hunt HD, Lee LF, Kung HJ. Marek’s disease virus (MDV) encodes an interleukin-8 homolog (vIL-8): characterization of the vIL-8 protein and a vIL-8 deletion mutant MDV. J Virol. 2001;75(11):5159–73. doi: 10.1128/JVI.75.11.5159-5173.2001. [DOI] [PMC free article] [PubMed] [Google Scholar]
- Peters G, Tyler S, Grose C, Severini A, Gray M, Upton C, Tipples G. A full genome phylogenetic analysis of varicella-zoster virus reveals a novel origin of replication-based genotyping scheme and evidence of recombination between major circulating clades. J Virol. 2006;80(19):000–000. doi: 10.1128/JVI.00715-06. [DOI] [PMC free article] [PubMed] [Google Scholar]
- Preston CM, McFarlane M. Cytodifferentiating agents affect the replication of herpes simplex virus type 1 in the absence of functional VP16. Virology. 1998;249(2):418–26. doi: 10.1006/viro.1998.9314. [DOI] [PubMed] [Google Scholar]
- Stingley SW, Ramirez JJG, Aguilar SA, Simmen K, Sandri-Goldin RM, Ghazal P, Wagner EK. Global Analysis of Herpes Simplex Virus Type 1 Transcription Using an Oligonucleotide-Based DNA Microarray. J Virol. 2000;74(21):9916–9927. doi: 10.1128/jvi.74.21.9916-9927.2000. [DOI] [PMC free article] [PubMed] [Google Scholar]
- Storlie J, Jackson W, Hutchinson J, Grose C. Delayed biosynthesis of varicella-zoster virus glycoprotein C: upregulation by hexamethylene bisacetamide and retinoic acid treatment of infected cells. J Virol. 2006;80(19):9544–56. doi: 10.1128/JVI.00668-06. [DOI] [PMC free article] [PubMed] [Google Scholar]
- Swain MA, Peet RW, Galloway DA. Characterization of the gene encoding herpes simplex virus type 2 glycoprotein C and comparison with the type 1 counterpart. J Virol. 1985;53(2):561–9. doi: 10.1128/jvi.53.2.561-569.1985. [DOI] [PMC free article] [PubMed] [Google Scholar]
- Tischer BK, Schumacher D, Chabanne-Vautherot D, Zelnik V, Vautherot JF, Osterrieder N. High-level expression of Marek’s disease virus glycoprotein C is detrimental to virus growth in vitro. J Virol. 2005;79(10):5889–99. doi: 10.1128/JVI.79.10.5889-5899.2005. [DOI] [PMC free article] [PubMed] [Google Scholar]
- Tournier P, Cathala F, Bernhard W. Ultrastructure and intracellular development of varicella virus: observations by electron microscopy. Presse Med. 1957;65(52):1229–34. [PubMed] [Google Scholar]
- Weigle KA, Grose C. Common expression of varicella-zoster viral glycoprotein antigens in vitro and in chickenpox and zoster vesicles. J Infect Dis. 1983;148(4):630–8. doi: 10.1093/infdis/148.4.630. [DOI] [PubMed] [Google Scholar]
- Yang WC, Devi-Rao GV, Ghazal P, Wagner EK, Triezenberg SJ. General and specific alterations in programming of global viral gene expression during infection by VP16 activation-deficient mutants of herpes simplex virus type 1. J Virol. 2002;76(24):12758–74. doi: 10.1128/JVI.76.24.12758-12774.2002. [DOI] [PMC free article] [PubMed] [Google Scholar]
- Zhang YF, Devi-Rao GB, Rice M, Sandri-Goldin RM, Wagner EK. The effect of elevated levels of herpes simplex virus alpha-gene products on the expression of model early and late genes in vivo. Virology. 1987;157(1):99–106. doi: 10.1016/0042-6822(87)90318-7. [DOI] [PubMed] [Google Scholar]
- Zhu Z, Gershon MD, Ambron R, Gabel C, Gershon AA. Infection of cells by varicella zoster virus: inhibition of viral entry by mannose 6-phosphate and heparin. Proc Natl Acad Sci U S A. 1995;92(8):3546–50. doi: 10.1073/pnas.92.8.3546. [DOI] [PMC free article] [PubMed] [Google Scholar]


