Abstract
The blood vessel diameter is often measured in microcirculation studies to quantify the effects of various stimuli. The intravital video microscopy is used to measure the change in vessel diameter by first recording the video and analyzing it using electronic calipers or by using image shearing technique. Manual measurement using electronic calipers or image shearing is time-consuming and prone to measurement error, and automated measurement can serve as an alternative that is faster and more reliable. In this paper, a new feature-based tracking algorithm is presented for automatically measuring diameter of vessels in intravital video microscopy image sequences. Our method tracks the vessel diameter throughout the entire image sequence once the diameter is marked in the first image. The parameters were calibrated using the intravital videos with manual ground truth measurements. The expriment with 10 synthetic videos and 20 intravital microscopy videos, including 10 fluorescence confocal and 10 non-confocal transmission, shows that the measurement can be performed accurately.
Keywords: Microcirculation, Image sequence, Feature tracking
1 Introduction
In microcirculation studies, the blood vessel diameter is often measured to help quantify the effects of various stimuli [12]. Typically, intravital video microscopy is used to observe blood vessels in vivo [5]; video image sequences are recorded of the subjects and analyzed using electronic calipers or image shearing to obtain diameter measurements [7]. Image sequences frequently span several minutes of time resulting in the acquisition of several thousand images.
The current manual measurement methods utilize the unsurpassed pattern recognition ability of the brain to align targets during the viewing of the video sequence. For the operator to measure the diameter in this manner is a time-consuming task that is prone to measurement error and operator fatigue. To solve these problems, we have utilized a new feature-based tracking algorithm that permits diameter tracking in low contrast, moving vessels. In this paper, a computer algorithm is presented which, once the diameter is marked in the first image frame, automatically computes the diameter for all subsequent image frames. The automated method uses an image feature tracking algorithm based on the seed points in the first image frame.
While the specific task of measuring vessel diameter in intravital microscopy image sequences using computer vision techniques has not received much attention, there have been many proposed algorithms and techniques for object tracking and vessel measurements for other applications in other imaging modalities which may be adapted to the problem domain of this paper.
Magers et al. [10] proposed a method for measuring microvascular diameters in video microscopy. Their algorithm used feature tracking with cross-correlation in one dimensional search space. Due to the constrained search space, the method would not be able to deal with the shifting of the vessel. They validated the method with 3 video microscopic images, and the manual repositionings of the wall locations were required.
Many previously proposed methods attempt to locate the boundary of the vessel lumen and tissue using optimization algorithms. Schmugge et al. [14] proposed a method for segmentation of vasculature in intravital microscopy. They first segmented the vessels with sharp edges using a snake-based algorithm. The vessels with less sharp edges were then located based on the ”bridges” between the segmented vessels. ROC analysis showed that their algorithm is able to get more vessels with lower sharpness.
Sonka et al. [15] developed an automated method for analysis of brachial ultrasound image sequences. Vessel tracking is achieved using a knowledge-based method. The method first identifies the vascular region of interest (ROI). This is followed by automated learning of vascular border properties which involves fine-tuning several matching parameters. The vessel borders are then detected in the image sequence using the globally optimal graph-search based border detection approach. Their automated method showed more accurate vessel diameter measurements in synthetic images than the two human observers. For the ultrasound image sequences, the method outperformed manual methods by displaying a decrease in analysis bias and increased reproducibility.
Tyml et al. [16] proposed a method to measure arteriolar diameter and hemodynamic resistance in intravital video microscopy images. Their algorithm required several markings of each edge along the lumen. The locations of vessel walls were estimated based on these markings, and the perpendicular distances between two walls were used to get a diameter estimate. Their method would require markings on every image frame of the sequence, thus making it unsuitable for automatic measurement in a sequence of multiple frames.
The algorithms using boundary determination to measure the vessel diameters work well only if there is a clear distinction between the lumen and tissues surrounding the vessel. The previous methods using feature-based tracking cannot deal with shifting of the vessels which is common in intravital video microscopy images. Our work focuses on the accurate measurement of the vessel diameter using image registration and image feature tracking that can deal with the shifting vessels.
1.1 Image registration
Image registration is a technique used when comparing the images taken at different times, by different sensors or from different viewpoints.[1] The registration algorithm tries to find the optimal transformation of an image with respect to the reference template. Image registration can be thought of as image template matching where the template of interest is the entire image.
Image registration is widely employed in various modalities of medical images such as X-ray, computed tomography (CT), magnetic resonance (MR), and ultrasound.[2, 3, 8, 9] The need for image registration arises in clinical settings as proper integration of useful data obtained from the separate images is often desired.[11] Pluim et al.[13] proposed a rigid registration method for 3D clinical images including MR, CT, and positron emission tomography (PET). Their registration algorithm used both mutual information and gradient information present in the images.
For processing of temporal image sequence, such as intravital video microscopy, each image frame needs to be registered to the first frame of the sequence. Ideally, the outcome of the registration on an intravital video microscopy would be a video with no vessel movement.
1.2 Image template matching
The task of vessel diameter tracking can be thought of as tracking top and bottom vessel wall locations throughout the image sequence. Image template matching is a simple algorithm that is widely used to track an object of interest within a temporal sequence of images. The template matching algorithm finds the optimal match of the template according to a similarity measure.
The template matching algorithm has four main components: feature space, search space, search strategy, and similarity metric.[1] The feature space refers to the information present within the template, and the search space defines the area within which to search for the best match. The search strategy and the similarity metric determine how to search for the best match and how to determine the similarity between the reference template and each match candidate.
There are various similarity measures to consider for template matching. Some widely used metrics include sum of absolute differences, sum of squared differences, and cross-correlation. For 2D discrete signals, such as image pixels, SSD and correlation can be computed from Equations 1 and 2, respectively.
| (1) |
| (2) |
where I1 and I2 are two m × n subimages that are being compared.
Cross-correlation is known to be sensitive to noise and intensity variation, and normalized correlation is often used as a more robust measure. Normalized correlation can be computed from Equation 3.
| (3) |
where σI1 and σI2 are the standard deviation of the pixel intensities within the subimages I1 and I2, respectively.
This paper is organized as follows. Section 2 contains the details of our algorithm, calibration of the algorithm parameters, design of the experiment, and description of the data sets. Section 3 reports the results from the synthetic and intravital microscopy image sequences. A discussion of the results follows in Section 4. Section 5 concludes with the relevance of the results to the problem of vessel diameter measurement.
2 Methods and Materials
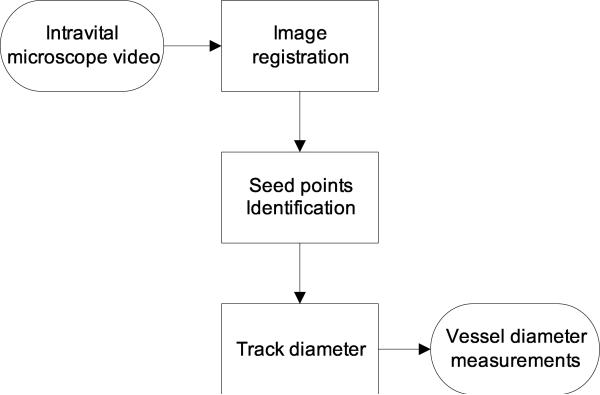
Figure 1 shows a typical intravital image as seen through the microscope. The algorithm has been developed to fit the specific need of tracking vessel diameters in intravital image sequences. Our automated method is composed of three steps: image registration, patch definition, and diameter tracking. The overview of the method is outlined as a flowchart in Figure 2.
Figure 1.
Typical example of intravital image as seen through the microscope. The magnification on site is 1420x.
Figure 2.
An overview of the proposed automated method.
2.1 Image Registration
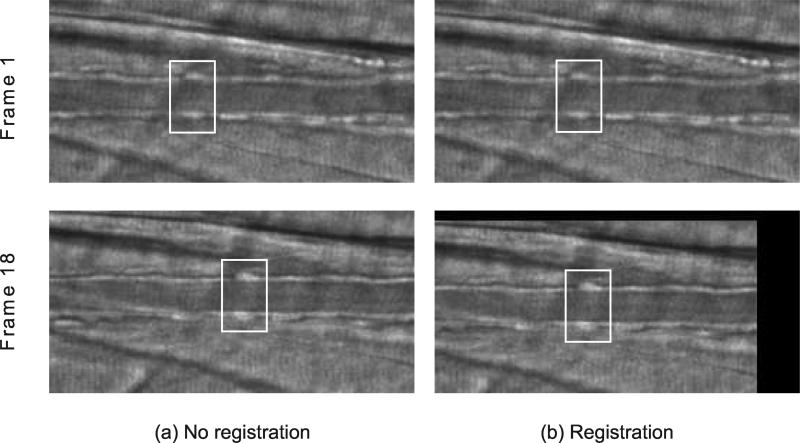
First, the image sequence is registered to reduce horizontal shifts among image frames. Each image frame is shifted appropriately so that it yields the least difference when compared to the first frame of the sequence. The sum of squared differences in pixel intensities was used to compare images.
The effect of running image registration is illustrated in Figure 3. A black border is created as a result of shifting the image frame toward the best location. Registering the image sequence results in less horiozontal movement of the vessel within the image sequence and therefore allows for smaller horizontal search space and faster tracking.
Figure 3.
Image registration. White box is drawn around a fixed region for better illustration. Running registration on an image sequence reduces the shift of the vessel, allowing for smaller search space and faster tracking. Two columns are shown for the image sequence before registration (a) and after registration (b).
2.2 Patch Definition
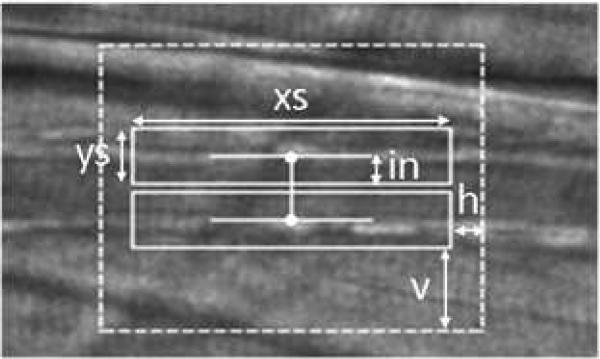
After the image registration process, the user must define two points in the first frame indicating the lumen diameter, one point on each side of the vessel lumen. For each point specified by the user, a surrounding box is established. Throughout this paper, we refer to these boxes as “patches”. The properties of the patches are determined by the user-specified parameters (Figure 4). The algorithm attempts to find the locations of the two patches in new frames based on the reference patches. The reference patch can be the corresponding patch in the first frame of the sequence, previous frame, or the blend of both. The details for defining reference patch is discussed in Section 2.3.
Figure 4.
User-specified parameters. The size of patches are determined by xs and ys, and the search area is determined by h and v. The parameter in is used to offset the patches.
The Euclidean distance between the two patches is considered the vessel diameter. It should also be noted that most of the interesting features lie outside of vessel walls. Blood may be flowing within the vessels, or the vessel may be so narrow that the patches include the opposite vessel wall. The patches may need to be shifted outward to reduce errors due to these distractions. The amount of shifting is user-specified with the parameter in, as shown in Figure 4.
The patch size and search space can be determined by observing each image sequence before running the tracking. The patch size needes to be thick enough to include the vessel wall and surrounding tissues and to be reasonably wide without overlapping any background patterns. The search space should be established so that the maximum movements of the patches were covered.
2.3 Tracking
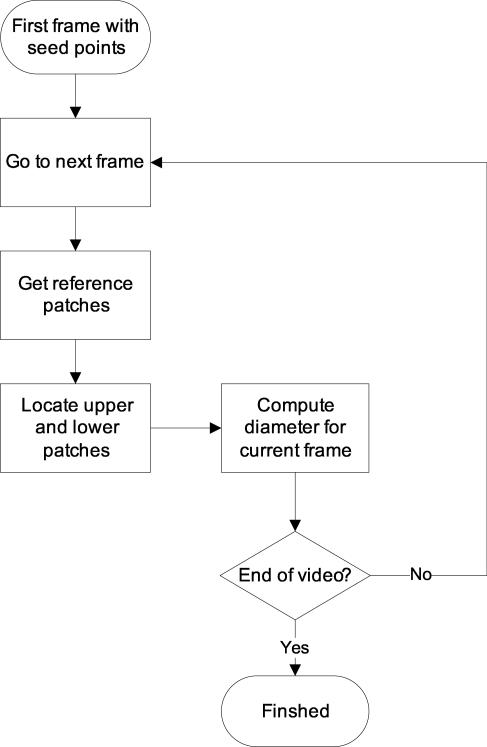
After two patches have been established, we search for new patch locations in the subsequent frames that best match the reference patch. Our approach is depicted in Figure 6 and outlined in Figure 5 as a flowchart. Starting with the seed points in the first frame of the video, we establish reference patches (Section 2.3.1) and locate upper and lower patches based on the reference patches (Section 2.4). The diameter is then computed in each frame by taking the distance between top and bottom patches.
Algorithm 1.
Linear exhaustive search with linked patches
| Matchmax = –1 |
| p1 = p(x, y1) |
| p2 = p(x, y2) |
| for all xi ∈ search area do |
| y1j = argmaxy{Match(p1, p(xi, y)) | y ∈ search area} |
| y2j = argmaxy{Match(p2, p(xi, y)) | y ∈ search area} |
| Matchi = Match(p1, p(xi, y1j)) + Match(p2, p(xi, y2j)) |
| if Matchi > Matchmax then |
| Matchmax = Matchi |
| x′ = xi; ; ; |
| end if |
| end for |
Figure 6.
Vessel diameter measurement by tracking two objects (patches). Image sequence of a vessel with N frames is shown.
Figure 5.
An overview of the tracking algorithm. Starting from the seed points on the first frame, the diameter is tracked on every subsequent frame in the video.
To track the patches, we need to determine how to define the reference patch and how to evaluate the similarity of the new patch candidate to the reference patch. In other words, we need to know where to compare each candidate to (reference patch) and how to compare them (matching metric).
2.3.1 Reference patch
Determining the best frame from which to get the reference patches is not an easy task and can vary for different cases. Always using the patches in the first frame may work well for the cases where the shapes of vessel walls do not vary across the image sequence. Using the patches in the previous frame has an advantage that it can adapt to varying intensities throughout the sequence. It may also be useful to define the reference patches to be a blend of these two options.
To paramaterize how the reference patches are defined, we introduce a variable α. Equation 4 show how α is used to define the reference patch at frame t.
| (4) |
where RP (t) is the reference patch used in frame t, and P(t) is the best matching patch in frame t using RP(t) as a reference. P(1) and RP(1) correspond to user-defined seed points in the first frame of the sequence. Both RP and P represent the set of pixel intensities for given patches, and the operations in Equation 4 are done for each pixel in the patches.
α controls how much patch information is coming from the located patches from the previous frame and how much is coming from the reference patches used for the previous frame. The reference patch will always be the first frame's patch when α is zero and the previous frame's patch when α is one.
2.3.2 Matching metric
Two possible options for the matching metric are SSE (sum of squared errors) and correlation. Equations 5 and 6 show how these metrics are computed. The correlation metric (Equation 6) is based on Pearson's product-moment coefficient. Both metrics are normalized to range from 0 to 1. The user can specify which metric is used for locating the best matching patches in the image frames.
| (5) |
| (6) |
where X represents the current patch of interest being compared to the reference patch Y. In both equations, X and Y represent set of pixel intensities for given patches, and the operations are done for each pixel in the patches. In Equation 5, MAX is the maximum possible SSE between X and Y and is used as a normalizing constant (for an 8-bit image, 255 × patch_area). The implicit assumptions are that the gray level pattern is approximately constant between successive frames and that local texture contains sufficient unambiguous information [6].
2.4 Linked Tracking
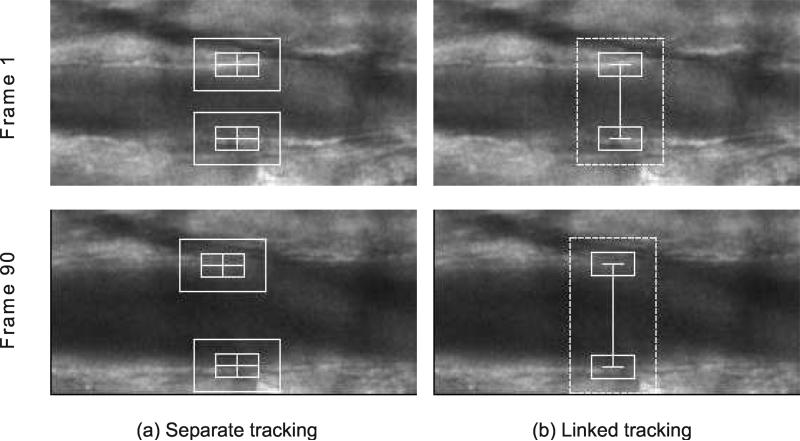
If separate feature tracking is used for each patch, it is possible that two patches will drift toward opposite directions as image frame progresses (Figure 7a). This is especially true for image sequences with shifting vessels. This will cause inaccurate estimation of vessel diameter, as we want to measure the length of a line perpendicular to vessel walls. To address this problem, the horizontal motion of the two patches is linked. Because the patches are linked, a new matching metric has to be introduced. Our algorithm uses the sum of the matching metrics for two patches being considered.
Figure 7.
Effect of linked tracking. For each tracking method, frames 1 and 16 of the image sequence are shown. Tracking two patches separately can result in drifting of the individual patches (a). Linking the patches prevent the drifting (b).
Instead of finding the best x and y coordinates separately for each patch, the best x coordinate is sought to maximize the matching metric for both patches, while for each patch the best y coordinate is sought separately within each x coordinate in search space. In other words, given two patches p1(x, y1) and p2(x, y2), the best matching locations p1′(x′, y′1) and p2′(x′, y′2) in the following frame are found using linear exhaustive search. The procedure for carrying out linear exhaustive search is outlined in Algorithm 1. Linking the patches in this way prevents them from drifting toward opposite directions. If the region of interest has shifted horizontally in the following image frame, both patches will shift horizontally by the same amount. Figure 7 shows the effect of linking the patches.
2.5 Parameter Optimization
Three parameters have been optimized for tracking vessel diameter: reference frame, matching metric, and patch size. To optimize tracking parameters, 6 intravital image sequences, 3 transmission and 3 fluorescence, were manually measured by an experienced rater.
The interactive web-based marking interface was developed for this purpose. The rater's task was to identify the same two points in all frames for each intravital sequence. For each case, a line was drawn in every 10 frames to indicate the diameter of the vessel. For these cases, mean errors for the diameter measurements were computed with respect to the manual ground truth, while varying the parameters to find the optimal value.
2.5.1 Reference frame and matching metric
First, the optimal values for reference frame (α) and the better matching metric to use for tracking were determined. The patch size was fixed to 125×20 pixels, and the diameter was tracked with five different α values in increments of 0.25 using both SSD and correlation metrics. This gave the trackings with 10 different parameter settings. SSD matching metric was used for the parameter sets 0-4, and correlation metric was used for the parameter sets 5-9. The α = 0 was used for the sets 0 and 5. The value of α was incremented by 0.25 for the sets 1-4 and 6-9. Table 1 summarizes 10 different parameter sets.
Table 1.
Parameter sets
| Parameter set |
Matching metric |
α |
|---|---|---|
| 0 | 0 | |
| 1 | 0.25 | |
| 2 | 0.5 | |
| 3 | 0.75 | |
| 4 |
SSE |
1 |
| 5 | Correlation | 0 |
| 6 | 0.25 | |
| 7 | 0.5 | |
| 8 | 0.75 | |
| 9 | 1 |
2.5.2 Patch size
The patch height should be tall enough to cover the entire vessel wall area and was fixed to 20 pixels. The optimal value of patch width was found by comparing the measurement results from the trackings with different patch widths. The α was set to zero, and the correlation metric was set to the optimal one for each image type as found in the previous section. The patch width was varied from 25 pixels to 250 pixels in increments of 25 pixels. For each case, mean error was calculated based on the ground truth measurements.
2.6 Experimental Design
The experiments were designed to determine whether our tracking algorithm correctly measures the vessel diameter through each intravital microscopy image sequence. Better tracking of the vessel should result in more accurate and consistent determination of the vessel diameter. The automated method was evaluated with 10 synthetic image sequences and 20 intravital image sequences.
For each image sequence, two seed points were determined by the author so that the points lie on the borders between the lumen and the vessel walls. The optimized parameters, as determined in the previous section, were used to run trackings. The SSD matching metric was used for tracking transmission microscopy images, and the correlation matching metric was used for fluorescence images. For all images, the patch size used for the experiments was 175×20 pixels, and the α value was set to 0.0.
2.6.1 Synthetic Image Sequences
The automated method was first tested with the synthetic sequences to evaluate the accuracy of the measurements. The ground truth measures were known for the synthetic data, and mean error was calculated for each sequence. Establishing ground truth for the intravital image sequences is a difficult task due to large number of image frames per case.
2.6.2 Intravital Image Sequences
To evaluate the performance on the intravital cases, the rater qualitatively evaluated the tracking results for 20 cases. The rater visually inspected the tracking results and rated each case on a scale of 1-5. The description of the scale is outlined in Table 3. The scores 4-5 were given to usable diameter measurements, the scores 1-2 were given to unusable results, and the score of 3 indicated the midpoint between usable and unusable results.
Table 3.
Criteria for qualitative evaluation
| Score | Description |
|---|---|
| 5 | Tracking is good for the entire sequence |
| 4 | There are frames where the measurement is off by 3 or less pixels |
| 3 | There are frames where the measurement is off by more than 3 pixels |
| 2 | There are several frames where the measurement is completely off |
| 1 | Loses track completely and shows random behavior |
2.7 Data Sets
All images were acquired on an Olympus BX50WI microscope through an Olympus UMPlanF1 water immersion objective (20x, 0.5 NA). Images were directed to a Nipkow disk scanning confocal head (CSU 22, Yokogawa) connected to an intensified CCD camera (XR Mega10, Stanford Photonics). The 10-bit images were digitally streamed to a terabyte RAID disk as 16-bit TIFF files at 30 frames per second (Piper software, Stanford Photonics).
There were two categories of intravital microscopy images, transmission and fluorescence. Fluorescence confocal images were collected from endothelial cells loaded with the calcium-sensitive fluorophore, fluo-4 [4] that were excited with the 488 nm laser line from Argon laser (DLS300Ar, Dynamic Laser). Non-confocal transmission images were acquired through the confocal optical path using brightfield illumination. Diameter changes were invoked with a pressure pulse of acetylcholine (20 pounds/in2, 0.5 seconds).
Confocal and transmission images were processed and converted to 8-bit TIFF stacks using ImageJ software macros. A rectangular region of interest along the vessel was clipped from each image sequence and rotated so that blood flow along the vessel was orientated left-to-right, cropped to 512×256 pixels, and scaled from 10-bits to 8-bits and temporally filtered (5 frame median) resulting in a final 6 frames per second. The final images had 410 frames with the resolution of 0.69 μm/pixel. The images were then uploaded to the server using a web-based interface.
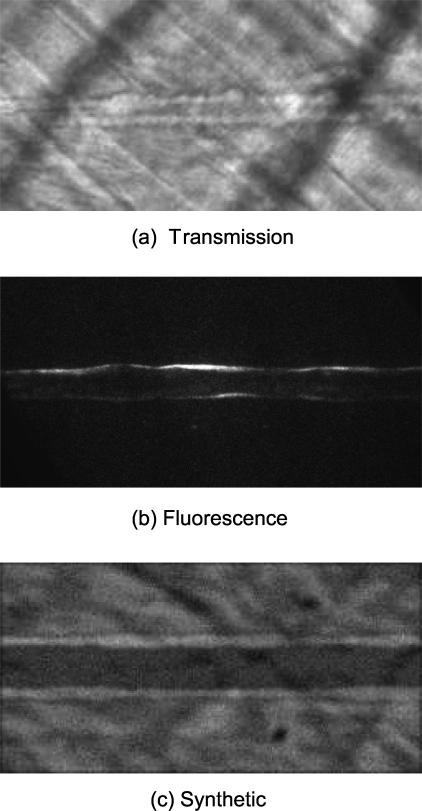
Both types of microscopy images were used for automated measurements of vessel diameter. The complete intravital microscopy data set was composed of 10 transmssion microscopy images and 10 fluorescence microscopy images. Figure 8 shows the example of transmission and fluorescence images that have been pre-processed.
Figure 8.
First frames from 3 cases are shown. The images have been pre-processed so that the vessel runs horizontally. (a) Transmission microscopy image, (b) fluorescence microscopy image, and (c) synthetic image. Total of 10 cases for each category were considered for the evaluation of our method. For the fluorescence image, brightness has been adjusted for better visibility.
In addition to intravital images, 10 synthetic image sequences were created. Each synthetic image sequence had 30 frames with resolution of 256×128 pixels. The synthetic sequences were created by taking a portion of the background from a real image sequence and overlaying two higher intensity lines meant to represent the vessel walls. The width of the walls was varied randomly by one pixel in either direction along the length of the vessel. The diameter of the vessel was also randomly varied throughout the sequence by up to five pixels per frame, and the entire vessel was shifted randomly in horizontal direction. Gaussian noise with varying variances were then applied to the images. To better model the intensity profile of the real vessel walls, Gaussian blurring with a σ of 1.0 was applied to the final images. A frame from one of the generated synthetic image sequences is depicted in Figure 8c.
3 Results
3.1 Parameter Optimization
Three parameters have been calibrated for tracking vessel diameter: reference frame, matching metric, and patch size. Total of 6 intravital image sequences were used to optimize tracking parameters.
3.1.1 Reference frame and matching metric
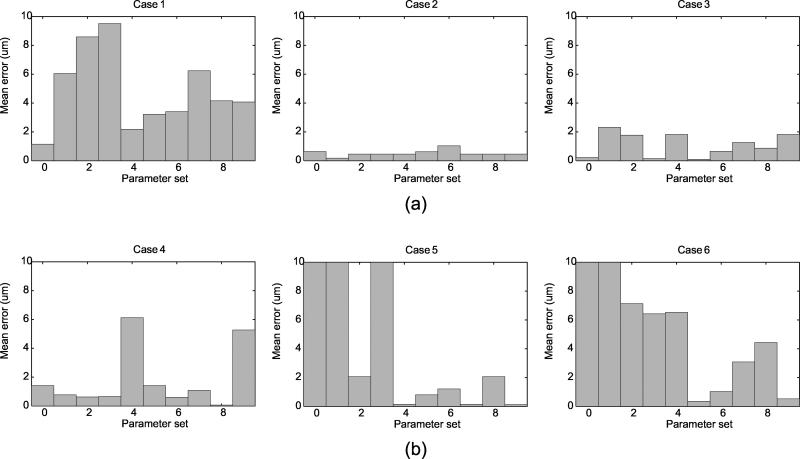
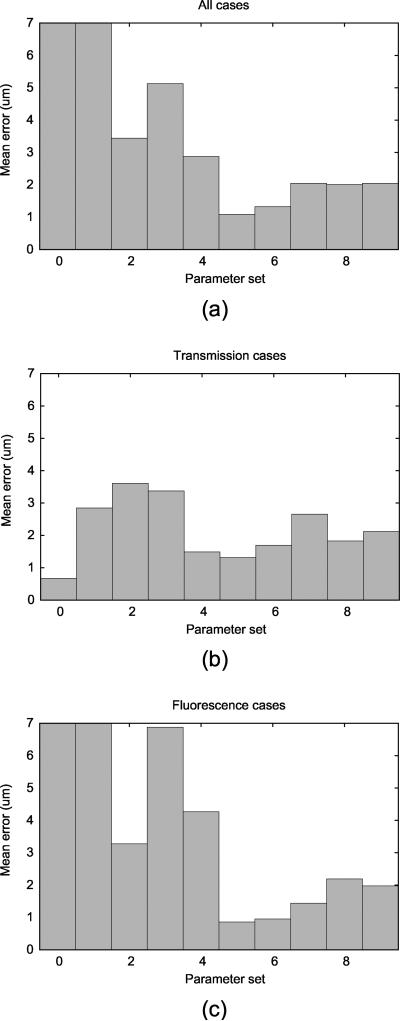
Figure 9 shows mean errors for 6 cases tracked using 10 parameter sets when compared to the manual ground truth. To compare the overall performance for the parameter sets, average mean error for all 6 cases was computed for each parameter set (Figure 10a). Further, the performance on two types of images, transmission and fluorescence, were also plotted against 10 parameter sets (Figures 10b,c). When all 6 cases were considered altogether, using the correlation metric with α = 0.0 tracked the diameter with the smallest error. However, when only transmission microscopy cases are considered, tracking using the SSD metric with α = 0.0 gave the best performance. For fluorescence microscopy cases, tracking using correlation metric with α = 0.0 resulted in the best performance.
Figure 9.
Mean error for the cases with manual measurements: (a) 3 transmission cases and (b) 3 fluorescence cases. 10 parameter sets were created by varying the matching metric and α value. Refer to 1 for details of the parameter sets. The parameter sets that gave error greater than 10 μm were considered invalid tracking and were clipped in the plot.
Figure 10.
Overall error for (a) all 6 cases, (b) transmission cases, (c) and fluorescence cases. The errors have been averaged for each parameter set. The parameter sets that gave error greater than 10 μm were considered invalid tracking and were clipped in the plot.
The trackings with the best performance were always run with α value of 0.0. This indicates that the diameter measurement yields the least error when the reference patch is taken from the previous frame. For each of the matching metrics (with α = 0.0), the mean measurement error is reported in Table 2 for transmission, fluorescence, and all image types. From Table 2, it is evident that using SSD based metric is optimal for tracking the vessel diameter in transmission microscopy, while correlation based metric is optimal for tracking in fluorescence microscopy.
Table 2.
Comparison of trackings using different matching metrics
| Image type | Mean error with SSD metric (μm) | Mean error with correlation metric (μm) |
|---|---|---|
| All | 3.44 | 1.70 |
| Transmission | 0.67 | 1.31 |
| Fluorescence | 3.27 | 0.86 |
3.1.2 Patch size
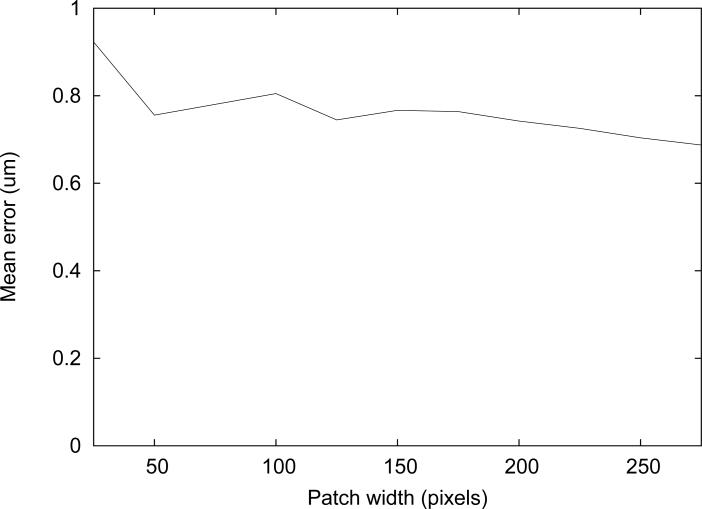
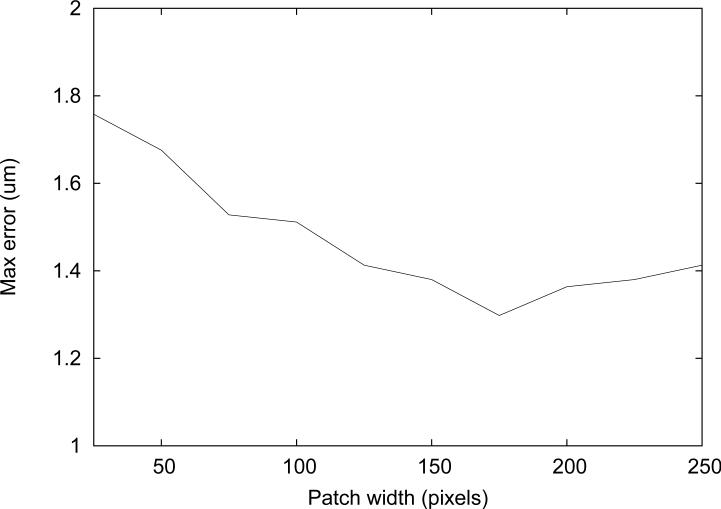
The average error for measurements in 6 cases was plotted against the patch width (Figure 11). Since robustness is important for measuring vessel diameter, the maximum error in six cases was also plotted against the patch width (Figure 12).
Figure 11.
Mean measurement error vs. patch width.
Figure 12.
Maximum measurement error vs. patch width.
The range of the average errors was under 0.1 μm for the patch width greater than 100 pixels. Small patch width, such as 25 pixels, resulted in the worst average performance, as expected since not enough features are included in the patch. The maximum error among the six cases is also worth considering for assessment of the algorithm's robustness. It is suspected that the tracking is not as robust when ran with the large patch width because it may include the background pattern that does not belong to the vessel wall itself.
The smallest maximum error was observed for the tracking with the patch width of 175. Although the smallest mean error was not observed with this patch width, it deviated by less than 0.1 μm from the best one. Therefore, 175×20 pixels was determined to be the optimal patch size and was used for the experiments.
3.2 Synthetic image sequences
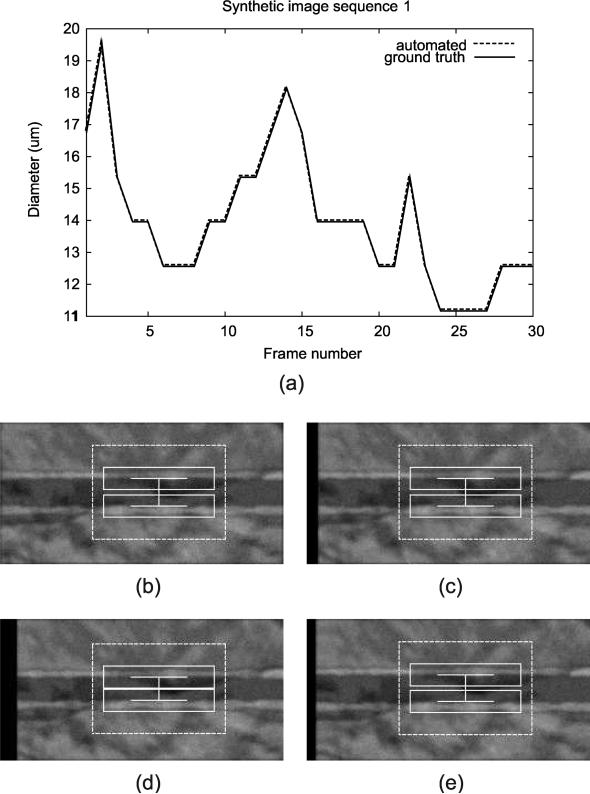
All synthetic image sequences were tracked successfully with the automated method. For synthetic cases, the results were very similar when using different paramter settings, and we report the numbers for the trackings using SSE matching metric and α value of 0. The average mean error in 10 cases was 0.0 pixel, indicating that the algorithm was able to track diameter correctly for all the frames in all cases. The resulting plot of the automated diameter measurements in a synthetic image sequence is shown in Figure 13.
Figure 13.
Tracking result for a synthetic image sequence, showing (a) diameter measurement plot through the entire sequence along with the screenshots at different frames: (b) Frame 1, (c) Frame 10, (d) Frame 25, and (e) Frame 30. Note that the automated measurements lie exactly on top of the ground truth.
3.3 Intravital image sequences
For intravital image sequences, mean errors for the diameter measurements were computed with respect to the manual ground truth. Figure 9 shows mean errors for 6 cases tracked using 10 parameter sets. To compare the overall performance for the parameter sets, average mean error for all 6 cases was computed for each parameter set (Figure 10a). Further, the performance on two types of images, transmission and fluorescence, were also plotted against 10 parameter sets (Figures 10b,c). When we consider all 6 cases together, using the correlation metric with α = 0 tracked the diameter with the smallest error. However, when only transmission microscopy cases are considered, tracking using the SSE metric with α = 0 gave the best performance. For fluorescence microscopy cases, tracking using correlation metric with α = 0 resulted in the best performance.
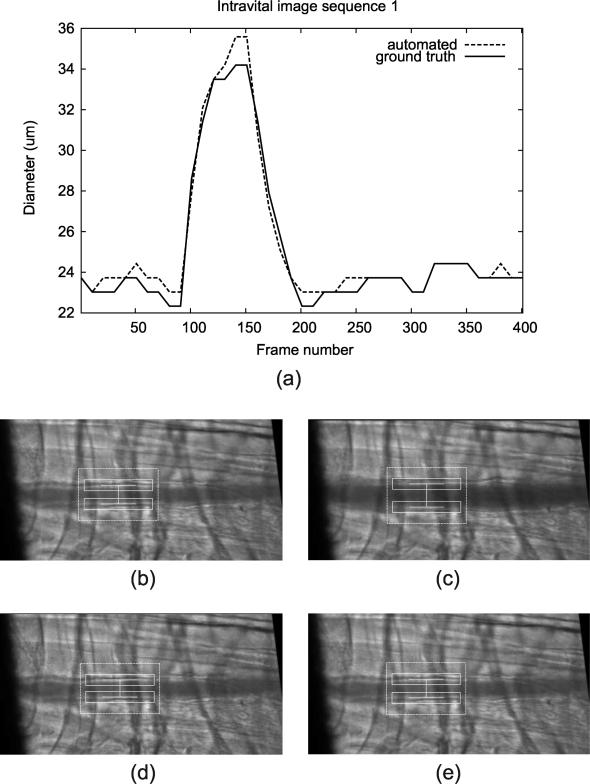
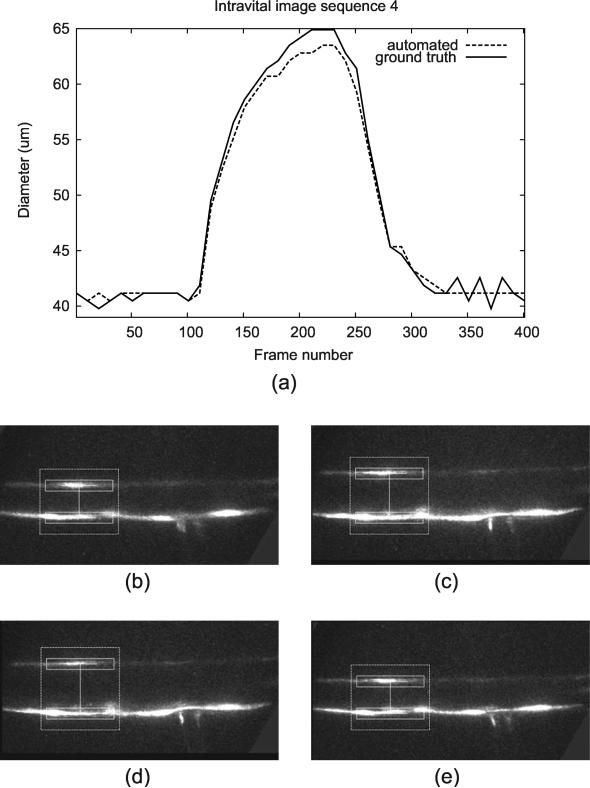
The result of qualitative evaluation on 20 intravital cases is shown in Table 4. Trackings on 19 intravital images were evaluated with scores 4 or above, and there was one case with the score of 3. The resulting plot of the automated diameter measurements along with the screenshots of different frames is shown in Figure 14 (transmission image) and Figure 15 (fluorescence image).
Table 4.
Qualitative evaluation on 20 cases
| Transmission cases | Tl | T2 | T3 | T4 | T5 | T6 | T7 | T8 | T9 | T10 |
| Score | 4 | 3 | 4 | 4 | 4 | 5 | 5 | 5 | 5 | 4 |
| Fluorescence cases | Fl | F2 | F3 | F4 | F5 | F6 | F7 | F8 | F9 | F10 |
| Score | 5 | 5 | 4 | 5 | 5 | 5 | 5 | 5 | 5 | 5 |
Figure 14.
Tracking result for a transmission microscopy image sequence, showing (a) diameter measurement plot through the entire sequence along with the screenshots at different frames: (b) Frame 1, (c) Frame 150, (d) Frame 250, and (e) Frame 350.
Figure 15.
Tracking result for a fluorescence microscopy image sequence, showing (a) diameter measurement plot through the entire sequence along with the screenshots at different frames: (b) Frame 1, (c) Frame 150, (d) Frame 230, and (e) Frame 350. The image brightness and contrast have been adjusted to improve visibility of the vessel.
4 Discussion
The automated method was able to successfully track vessel diameter on all synthetic image sequences in the presence of random translational movement and varying amounts of noise. The mean error of 0.0 pixel was achieved with the automated method for 10 synthetic cases, indicating the high accuracy of the measurements.
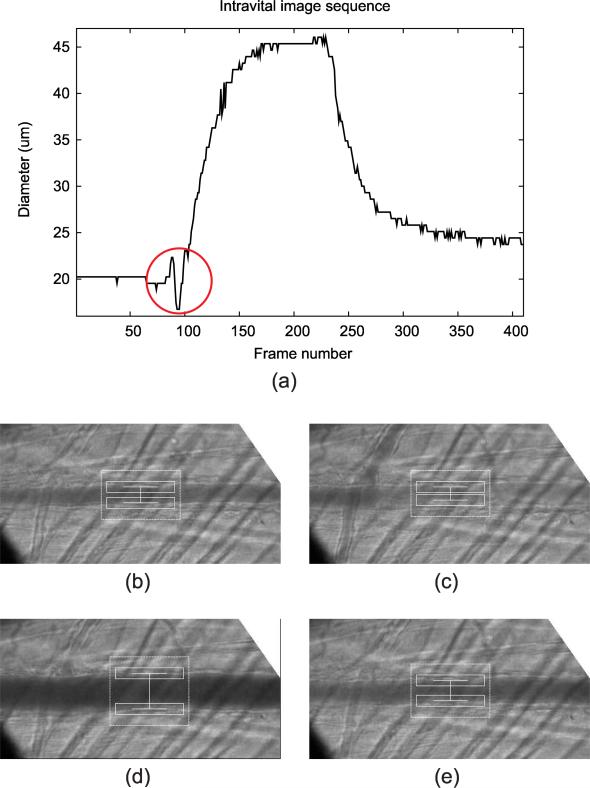
For the qualitative analysis on 20 intravital cases, the diameter trackings on 19 cases were evaluated as “usable” (score of 4 or higher) by an experienced rater. However, the tracking result for one case received a score of 3 (Figure 16), indicating that there were frames where the measurements were off by 3 or more pixels. For this particular case, there was a noticeable intensity change in bottom half of the lumen in frames 90-100. The algorithm was unable to correctly track the bottom vessel wall due to the hazy appearance of the lumen in these frames. Although the measurements were off for these frames, it recovered once the lumen intensity recovered to the original appearance at frame 100.
Figure 16.
Tracking result for the case that received the qualitative evaluation score of 3, showing (a) diameter measurement plot through the entire sequence along with the screenshots at different frames: (b) Frame 1, (c) Frame 95, (d) Frame 200, and (e) Frame 300. The correct tracking interfered as the lumen intensity brightens around frame 95. The erroneous measurement is marked with a circle in (a).
For two types of intravital image sequences, diameter tracking with different parameter sets gave the optimal results (Figure 10). For transmission microscopy, using SSD matching metric resulted in the lowest error, while correlation matching metric gave the lowest error for fluorescence microscopy.
It was shown that using SSD metric (parameter sets 0-4) for tracking on fluorescence images yield poor performance when compared to the tracking with correlation metric (parameter sets 5-9). The reason why the correlation metric works better than SSD metric in fluorescence microscopy seems to be in the nature of fluorescence images. In fluorescence images, the vessel walls appear as bright region on dark background, and the majority of the background pixels have intensities close to zero. The correlation metric indicates the similarity in the image pattern, rather than the similarity of individual pixel intensities. However, in transmission images, wider range of intensity values are present, and counting the differences in individual pixel intensities seem to result in better matches.
Tracking using α values greater than 0.0 did not lower the mean error for either image type. For both image types, setting α to 0.0 gave the best results. This indicates that using the previous frame's patch as a reference yields the best performance. The reason why any degree of frame averaging for the reference patch does not help seems to be the high on-site magnification of the microscopic image data. Even tiny movement of the subject can affect how a image frame appears and result in some distortion of particular frame.
The patch size was also varied, but on average no significant advantage was observed when using smaller or larger patches. However, it was observed that the mean error increases when the patch size becomes too small. The suspected reason for this is that small patches may not capture enough features of the vessel wall. Also, maximum error increased when the patch size was too large. The inclusion of the unnecessary background patterns with the large patch size seems to be the cause of this increase in maximum error. Considering that the robustness of the tracking algorithm was important, the optimal patch size was determined as 175×20.
5 Conclusion
An accurate and robust automated method to measure blood vessel diameter is crucial in obtaining quality results in microcirculation studies. Very little previous work has been done on this task, though there has been much work on measuring diameters in other imaging modalities for applications such as measuring arteries in ultrasound images, retinal vessels, and airways in CT. A feature-based algorithm was developed for an accurate measurement of the vessel diameter in intravital video microscopy image sequences. The automated diameter measurements were successful, and we believe that it will soon replace the current manual method with electronic calipers.
6 Acknowledgments
This work was supported in part by Grant No. HL18208 and HL76414 from National Institute of Health.
References
- 1.Brown LG. A survey of image registration techniques. ACM Computing Surveys. 1992;24(4):325–376. [Google Scholar]
- 2.Cox RW, Jesmanowicz A. Real-Time 3D Image Registration for Functional MRI. Magnetic Resonance in Medicine. 1999;42:1014–1018. doi: 10.1002/(sici)1522-2594(199912)42:6<1014::aid-mrm4>3.0.co;2-f. [DOI] [PubMed] [Google Scholar]
- 3.Davatzikos C, Prince JL, Bryan RN. Image registration based on boundary mapping. Medical Imaging, IEEE Transactions on. 1996;15(1):112–115. doi: 10.1109/42.481446. [DOI] [PubMed] [Google Scholar]
- 4.Duza T, Sarelius IH. Increase in endothelial cell Ca2+ in response to mouse cremaster muscle contraction. The Journal of Physiology. 2004;555(2):459–469. doi: 10.1113/jphysiol.2003.051029. [DOI] [PMC free article] [PubMed] [Google Scholar]
- 5.Gavins FNE, Chatterjee BE. Intravital micro-scopy for the study of mouse microcirculation in anti-inflammatory drug research: focus on the mesentery and cremaster preparations. J. Pharmacological and Toxicological Methods. 2004;49:1–14. doi: 10.1016/S1056-8719(03)00057-1. [DOI] [PubMed] [Google Scholar]
- 6.Giachetti A. Matching techniques to compute image motion. Image and Vision Computing. 2000;18:247–260. [Google Scholar]
- 7.Intaglietta M, Messmer K. Technological developments in the study of the microcirculation. Clinical and Applied Microcirculation Research. CRC Press; Boca Raton: 1995. pp. 139–148. [Google Scholar]
- 8.Krucker JF, LeCarpentier GL, Fowlkes JB, Carson PL. Rapid elastic image registration for 3-D ultrasound. Medical Imaging, IEEE Transactions on. 2002;21(11):1384–1394. doi: 10.1109/TMI.2002.806424. [DOI] [PubMed] [Google Scholar]
- 9.Maes F, Collignon A, Vandermeulen D, Marchal G, Suetens P. Multimodality image registration by maximization of mutualinformation. Medical Imaging, IEEE Transactions on. 1997;16(2):187–198. doi: 10.1109/42.563664. [DOI] [PubMed] [Google Scholar]
- 10.Magers S, Faber JE. Real-time measurement of microvascular dimensions using digital cross-correlation image processing. Journal of Vascular Research. 1992;29:241–247. doi: 10.1159/000158938. [DOI] [PubMed] [Google Scholar]
- 11.Maintz JA, Viergever MA. A survey of medical image registration. Medical Image Analysis. 1998;2(1):1–36. doi: 10.1016/s1361-8415(01)80026-8. [DOI] [PubMed] [Google Scholar]
- 12.Murrant CL, Sarelius IH. Local and remote arteriolar dilations initiated by skeletal muscle contraction. Am. J. Physiol. Heart Circ. Physiol. 2000;279:H2285–H2294. doi: 10.1152/ajpheart.2000.279.5.H2285. [DOI] [PubMed] [Google Scholar]
- 13.Pluim JW, Maintz JA, Viergever MA. Image registration by maximization of combined mutual information and gradient information. Medical Imaging, IEEE Transactions on. 2000;19(8):809–814. doi: 10.1109/42.876307. [DOI] [PubMed] [Google Scholar]
- 14.Schmugge S, Kamoun W, Villalobos J, Clemens M, Shin M. Segmentation of vasculature for intravital microscopy using bridging vessel snake. IEEE International Symposium on Biomedical Imaging. 2006:177–180. [Google Scholar]
- 15.Sonka M, Liang W, Lauer RM. Automated analysis of brachial ultrasound image sequences: early detection of cardiovascular disease via surrogates of endothelial function. IEEE Transactions on Medical Imaging. 2002 October;21(10):1271–1279. doi: 10.1109/TMI.2002.806288. [DOI] [PubMed] [Google Scholar]
- 16.Tyml K, Anderson D, Lidington D, Lakak H. A new method for assessing arteriolar diameter and hemodynamic resistance using image analysis of vessel lumen. American Journal of Physiology - Heart and Circulatory Physiology. 2003 May;284:1721–1728. doi: 10.1152/ajpheart.00741.2002. [DOI] [PubMed] [Google Scholar]


