Abstract
The slo3 gene encodes a K+ channel found only in mammalian testis. This is in contrast to slo1, which is expressed in many tissues. Genes pertaining to male reproduction, especially those involved in sperm production, evolve morphologically and functionally much faster than their nonsexual counterparts. A comparison of SLO3 channel amino acid sequences from several species revealed a high degree of structural divergence relative to their SLO1 channel paralogues. To reveal any biophysical differences accompanying this rapid structural divergence, we analyzed the functional properties of SLO3 channels from two species, bovine and mouse. We observed several functional differences including voltage range of activation, kinetics, and pH sensitivity. Although SLO3 channel proteins from these two species lack conservation in many structural regions, we found that the first two of these three functional differences map to the same loop structure in their RCK1 (regulator of K+ conductance 1) domain, which links the intermediate RCK1 subdomain to the C-terminal subdomain. We found that small structural changes in this region produce major changes in the voltage range of activation and kinetics. This rapidly evolving loop peptide shows the greatest length and sequence polymorphisms within RCK1 domains from many different species. In SLO3 channels this region may permit evolutionary changes that tune the gating properties in different species.
SLO3 encodes a high conductance potassium (K+) channel of the SLO potassium channel family (4). SLO3 channels were first cloned in 1998, from a testis cDNA library based on their homology to the BK (SLO1 channel). Several lines of evidence suggest that SLO3 expression is limited to mammalian testes. Reverse transcription-PCR experiments in mouse using total RNA from many tissues showed expression only in testes, and Northern analysis using RNA derived from many tissues in both mouse and human showed expression only in testes of both species. In contrast, the closely related paralogue SLO1 is widely expressed in many tissues (5–8). Expression of SLO3 channels in Xenopus oocytes showed that, like SLO1 channels, they express high conductance K+ channels, and their gating also includes a component of voltage sensitivity. However, they differ in several ways. Of greatest significance is their ion dependence of gating. SLO1 channels are sensitive to changes in intracellular Ca2+ at physiological concentrations, whereas SLO3 channels are not. On the other hand, SLO3 channels are highly sensitive to intracellular pH and are activated by both voltage and intracellular alkalinization (4). Because of its sensitivity to both pH and voltage, SLO3 could be involved in sperm capacitation and/or the acrosome reaction, which are essential steps in fertilization where changes in both intracellular pH and membrane potential are known to occur (reviewed in Refs. 9–11). In comparing the primary structures of SLO3 channel subunits among several mammalian species, we were struck by their low sequence conservation relative to SLO1 channel subunits. It has been shown that genes that mediate sexual reproduction are more divergent than genes expressed in nonreproductive tissues (1–3). This rapid evolution occurs both in unicellular organisms such as diatoms with little or no premating barriers and in mammals with complex mating behavior (12). Recently another gene encoding an ion channel whose expression is limited to male testes has also been shown to have unusually low sequence conservation among mammals. This gene, Catsper, is also apparently involved in the physiology of fertilization (13, 14).
The SLO3 channel gene has previously only been cloned and functionally expressed from mouse (4). Here we report the cloning and functional expression of the SLO3 gene from the bovine species (bSLO3)2 and show that functional differences between it and its mouse orthologue (mSLO3) map to a region in RCK1 with particularly low conservation.
MATERIALS AND METHODS
Cloning
bSLO3 was cloned by reverse transcription-PCR of bovine testes total RNA (obtained from Biochain). First strand cDNA was made using Powerscript reverse transcriptase (Clontech) and random hexamers. Specific primers were made to the predicted bovine sequence and used to amplify bSLO3 in convenient-sized pieces from the first strand cDNA with a Clontech Advantage-HF 2 PCR kit as well as with New England Biolabs Phusion high fidelity DNA polymerase. The pieces were ligated into our pOX oocyte expression vector to make a complete construct. The mSLO3 construct used is described (4).
Chimeras
The above-described bSLO3 construct and the mSLO3 construct described by Schreiber (4) were used to make chimeric constructs. Chimeric pieces were made either by PCR amplification or by a two-step overlap extension/PCR amplification (New England Biolabs Phusion polymerase) and then subcloned into convenient restriction sites in either the bSLO3 or the mSLO3 construct. The final chimeric amino acid sequences of the constructs, expressed as residue numbers from the protein sequences shown in Fig. 1, are as follows: 1) for Chim1: bSLO3, Met1–Asn168; mSLO3, Ser172–Lys455; and bSLO3, Ala453–His1141; 2) for Chim2: bSLO3, Met1–Asn168; mSLO3, Ser172–Lys862; and bSLO3, Arg848–Hsi1141; 3) for Chim3: mSLO3, Met1–Lys455; bSLO3, Ala453–Val631; and mSLO3, Met636–Lys1121; 4) for mSLO3-A: mSLO3, Met1–Lys455; bSLO3, Ala453–Ile470; and mSLO3, Cys474; 5) for mSLO3-B: mSLO3, Met1–Thr497; bSLO3, Ser495–Cys515; and mSLO3, Asn519–Lys1121; and 6) for mSLO3-C: mSLO3, Met1–Asp533; bSLO3, Phe531–His548; and mSLO3, Lys552–Lys1121. To create mSLO3-Ba and mSLO3-Bb, mSLO3 residues were replaced by the corresponding residues present in bSLO3 (see Fig. 5C) using the methods described above.
FIGURE 1.
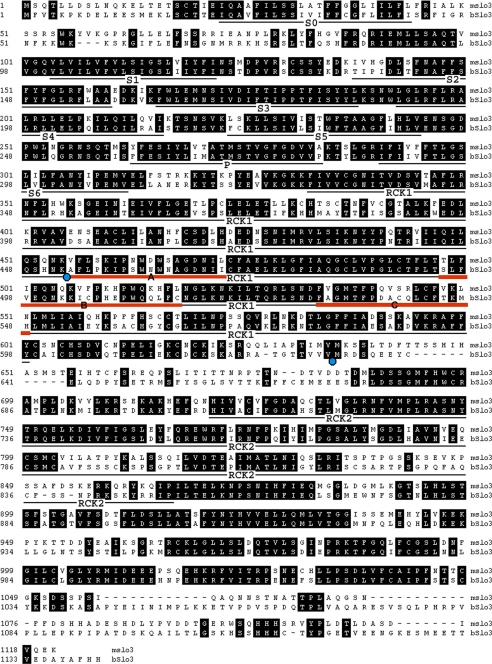
Interspecies (bovine-mouse) alignment of the amino acid sequences of SLO3 channel paralogues. Identical residues are shaded. A comparison of Fig. 1 and supplemental Fig. S1 reveals that SLO3 paralogues are highly divergent (62.1% identity) relative to SLO1 paralogues (98.2% identity) in the same species, suggesting a more rapid rate of evolution. Unusually rapid evolutionary change is characteristic of genes involved in sexual reproduction and especially in male reproduction. Hydrophobic segments surrounding the pore region are designated S0–S6. The limits of the bSLO3 sequence incorporated into chimera 3 are indicated by filled blue circles. The mSLO3-A, mSLO3-B, and mSLO3-C chimeric regions are indicated by red bars designated A, B, and C, respectively (see text). SLO3 and SLO1 channels have similar voltage sensors (underline S4) (15). The “calcium bowl” Ca2+-sensing site (16) present in SLO1 is not present in SLO3.
FIGURE 5.
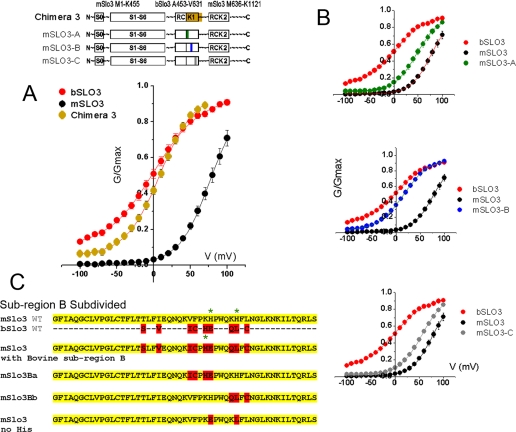
A small region in the distal part of the RCK1 domain has the most dramatic effect in changing the voltage range of activation of mSLO3 channels. A, G-V curve obtained from expression of chimera 3 compared with wild type G-V curves shows a G-V relation substantially shifted to negative values. Chimera 3 is a mSLO3-based construct containing only the distal half of RCK1 from bSLO3. Boltzmann fit of the chimera 3 G-V curve gave V½ and k values of +8.9 ± 1.98 mV and 23.97 ± 1.3 (n = 11), respectively. B, the small bSLO3 sequence in chimera 3 was subdivided and incorporated into three constructs, mSLO-A, mSLO3-B, and mSLO3-C. G-V relationships are shown for mSLO-A, mSLO3-B, and mSLO3-C chimeras. Their respective V½ parameters are 47 ± 3.15, 16.2 ± 1.42, and 56.1 ± 2.3 mV, and their respective k parameters are 23.5 ± 1.73, 26.5 ± 0.98, and 23.6 ± 0.91 (n = 12, 19, and 11) (means ± S.E.). The mSLO3-B G-V curve substantially resembled that of wild type bSLO3 with regard to its voltage parameters. C, subregion B was further subdivided. Using the mSLO3 wild type template, we incorporated four of the upstream residues of bovine subregion B to create mSLO3-Ba and three of the downstream bovine subregion B residues to create mSLO3-Bb. The respective V½ values of activation of these constructs are 42.4 ± 4.7 and 28.8 ± 1.5 mV, and the respective k values are 34.1 ± 2.5 and 30.2 ± 1.2 for mSLO3-Ba (n = 7) and mSLO3-Bb (n = 8). The sequence at the bottom shows the sequence of mSLO3 where two histidine residues have been replaced by the corresponding residues present in bSLO3. As shown in Fig. 6, the replacement of the histidine residues had no effect on the pH sensitivity of mSLO3 channels.
Core and Tail Constructs
Core and tail constructs were made by PCR amplification (New England Biolabs Phusion polymerase) of the areas of interest and subcloned into pOX. The amino acid sequences of the constructs, expressed as residue numbers from the protein sequences shown in Fig. 1, are as follows: bSLO3 core, bSLO3 Met1–Arg633; bSLO3 tail, bSLO3 Met632–His1141; mSlo3 core, mSLO3 Met1–Met636; and mSLO3 tail, and mSLO3 Met636–Lys1121.
Defolliculated Oocytes
Defolliculated oocytes were injected with 75 ng of cRNA from SLO3 using a Drummond Scientific nanoinjector (Broomall, PA). Injected oocytes were incubated at 18 °C in ND96 medium (96 mm NaCl, 2 mm KCl, 1.8 mm CaCl2, 1 mm MgCl2, 5 mm HEPES, pH 7.5, with NaOH). The oocytes were electrophysiologically analyzed 3–5 days after injection. Two-microelectrode voltage clamp recordings were obtained in ND96 plus 1 mm DIDS to block the endogenous chloride conductances. For patch-clamp experiments, the vitelline membranes were mechanically removed before recording. Inside-out patches were analyzed while perfusing the intracellular side of the membrane with a solution containing 140 mm potassium methanesulfonate, 30 mm KOH, 10 mm HEPES. pH was adjusted to 9 (with KOH) or to 5 with methanesulfonic acid. The pipette solution was 140 mm potassium methanesulfonate, 20 mm KOH, 10 mm HEPES, 2 mm MgCl2, 5 mm EGTA, pH 7. Pipette tip resistance ranged from 2 to 3 megaohms. The traces were acquired using an Axopatch 200A (Molecular Devices, Palo Alto, CA), digitized at 10 kHz, and filtered at 2 kHz. The data were analyzed using pClamp 9 (Molecular Devices), SigmaPlot 8 (Jandel Scientific, Corte Madera, CA), or Origin 6.0 (Microcal Software, Northampton, MA). Drugs and pharmacological agents used in this study were purchased from Sigma. The conductance-voltage (G-V) relationships of the wild type and mutant channels were obtained by converting the current values at steady state to conductances using the equation G = I/(Vm − Erev), where I is the K+ current at steady state, Vm is the test pulse potential, and Erev is the estimated reversal potential. The G-V curves were fitted with the Boltzmann equation, G = Gmin + [(Gmax − Gmin)/(1 + e(−(V − V½)/k))], where V½ is the voltage for the channel at half-activation, k = RT/zF, z is the number of equivalent gating charges, and F, R, and T have their usual meanings.
RESULTS
Low Interspecies Conservation for Bovine and Mouse SLO3 Channels Relative to SLO1 Channels
Fig. 1 and supplemental Fig. S1 show the primary structure of both SLO3 and SLO1 α subunits and show a comparative alignment in two species, bovine and mouse. The comparative alignments show that the SLO3 orthologues are far less conserved between these two species than are the SLO1 orthologues. SLO3 orthologues are only 62.1% identical in their amino acid sequence, whereas SLO1 orthologues are 99.4% identical. supplemental Table S1 shows that the relative low conservation of SLO3 channels is consistent among six species examined: bovine, mouse, human, canine, pig, and opossum. Within these species SLO3 pairwise identities range from 51.9 to 73.7%, whereas SLO1 identities range from 89.9 to 99.8%. This conspicuous difference in conservation is especially notable when considering that both SLO3 and SLO1 channel subunits are highly homologous, co-linear, and similar in size. Both are also similarly unique with respect to all other voltage-gated K+ channels in having an extracellular N terminus, which requires an extra membrane-spanning segment (labeled S0 in Fig. 1 and supplemental Fig. S1). These unique similarities suggest that SLO3 and SLO1 form a distinctive subfamily of potassium channels. (Note that the SLO2 paralogue lacks the S0 membrane-spanning domain and is somewhat more distant.)
A comparison of Fig. 1 and supplemental Fig. S1 shows that the functional regions (defined as the membrane-spanning domains S0 through S6) and the RCK1 and RCK2 regions have much less interspecies conservation in SLO3 than in SLO1; rapid evolutionary divergence is clearly taking place within these regions in SLO3 channels relative to SLO1 channels. Because these regions are known to determine and control the biophysical properties of channels belonging to the SLO family, it is likely that some of these evolutionary changes reflect changes in biophysical properties between the bovine and mouse orthologues. To investigate this possibility, we undertook a comparative study of the basic biophysical properties of bovine and mouse channels, with the intention of physically mapping any functional differences to the evolutionarily diverged structural domains.
Differences in the Biophysical Properties of bSLO3 and mSLO3 Channels
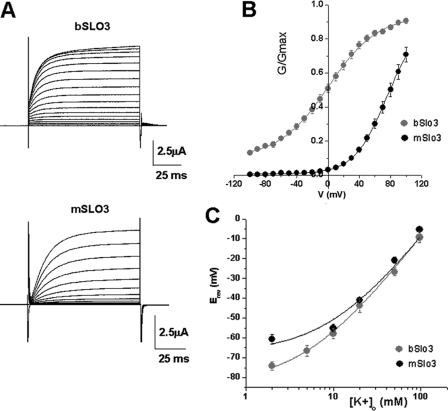
Fig. 2A shows a comparison of whole cell currents carried by bSLO3 and mSLO3 channels heterologously expressed in Xenopus oocytes. In the whole cell configuration, both bSLO3 currents and mSLO3 currents resemble a voltage-dependent delayed rectifier, showing little or no inactivation. One obvious difference between the two is that bSLO3 currents have a faster rate of rise in response to depolarizing voltage clamp step pulses than mSLO3 currents. This property is further discussed below. Another major difference between bSLO3 and mSLO3 currents is their voltage range of activation; Fig. 2B shows that bSLO3 activation is significantly more negative relative to mSLO3. bSLO3 currents are obvious at −60 mV, whereas mSLO3 current activation is not obvious until approximately +20 mV. The V½ of activation for bSLO3 currents is approximately +0.5 mV, which is considerably more negative than the half-activation voltage we estimate for mSLO3 of approximately +77 mV. (Schreiber et al. (4) estimated a V½ of +70 mV.) bSLO3 channels have unusually weak voltage dependence. Fitting the bSLO3 current-voltage relation with a Boltzmann function shows a slope factor of 31.7 mV for an e-fold change in conductance indicating a minimum equivalent gating charge of ∼0.8 e. This contrasts with the somewhat greater apparent voltage sensitivity of mSLO3, which we estimate has a minimum equivalent gating charge of ∼1.2 e. Such weak voltage sensitivity and left-shifted current-voltage relation for bSLO3 predict that a significant number of channels will be open throughout the physiologically relevant voltage range in sperm, including the resting potential. Because spermatozoa have a very high input resistance, the opening of only a few high conductance K+ channels such as SLO3 could have a profound impact on the resting potential and excitable properties of the cell.
FIGURE 2.
bSLO3 channels activate at more negative potentials than mSLO3 channels and are less voltage-dependent. A, families of whole cell currents from bSLO3 and mSLO3 channels expressed in Xenopus oocytes evoked by voltage steps from −90 to +100 mV in 10-mV steps at Vh = −70 mV. B, G-V relationships for bSLO3 and mSLO3 currents. bSLO3 channels activate at more negative potentials, and the currents have a more shallow conductance-voltage relation than mSLO3. Note that there is significant bSLO3 conductance at −100 mV. The data were fitted with the Boltzmann equation (see “Materials and Methods”) with V½ = 0.49 ± 2.1 mV, k = 31.7 ± 2.2 (n = 21) for bSLO3; and V½ = 77.1.6 ± 4.9, k = 21.2 ± 1.01 for mSLO3 (n = 9). C, reversal potentials (Erev) plotted at different external K+ concentrations to illustrate the relative selectivity for K+ over Na+ for bSLO3 and mSLO3 channels. Reversal potentials were obtained by measuring tail currents at different [K+]o. [Na+]o was also varied so that the total concentration of monovalent cations was 98 mm. The data were fitted with the Goldman-Hodgkin-Katz equation, Erev = RT/F*ln([K+]o + P*([Na+]o))/([K+]i + P*[Na+]i), where P is the Na+/K+ permeability ratio and varied freely. For bSLO3 reversal potentials were obtained at 2, 5, 10, 20, 50, and 97 mm [K+]o (n = 12, 8, 6, 7, 9, and 4, respectively), and the calculated pNa+/pK+ was 0.05. For mSLO3 reversal potentials were obtained at 2, 10, 20, 50, and 97 mm [K+]o (n = 8, 8, 2, 6, and 4, respectively), which yielded a pNa+/pK+of 0.1. Fits were performed using Sigmaplot (Jandel). Another indication that bSLO3 had higher selectivity for K+ over Na+ was the fact that the resting potentials of eggs injected with bSLO3 were more negative, e.g. −63.6 ± 2.1 mV (n = 16) versus −34.4 ± 2.7 mV (n = 9) for eggs injected with mSLO3.
The third difference noted between these two channels is their difference in selectivity for K+ over Na+. bSLO3 channels have a pK/pNa of ∼17 (Fig. 2C). Although this K+ selectivity over Na+ is somewhat low relative to many other types of K+ channels, it nevertheless is significantly higher than that of mSLO3 channels, which have unusually low selectivity for K+ over Na+; we measured pK/pNa to be ∼10 in the current study. (Schreiber et al. (4) reported a PK/PNa of ∼5 for mSLO3 channels.) The higher K+ selectivity of bSLO3 channels would allow them to contribute more to the hyperpolarization of the sperm plasma membrane. On the other hand, the reversal potential of mSLO3 channels would be more affected by the extracellular environment that sperm encounter on their journey to the egg. In high external Na+ environments, mSLO3 channels may have a depolarizing influence on the mouse sperm membrane potential. A fourth difference noted between bSLO3 and mSLO3 channels is their pH sensitivity, with bSLO3 showing somewhat less sensitivity to pH than mSLO3. Data relating to their pH sensitivity will be shown and discussed in Fig. 6.
FIGURE 6.
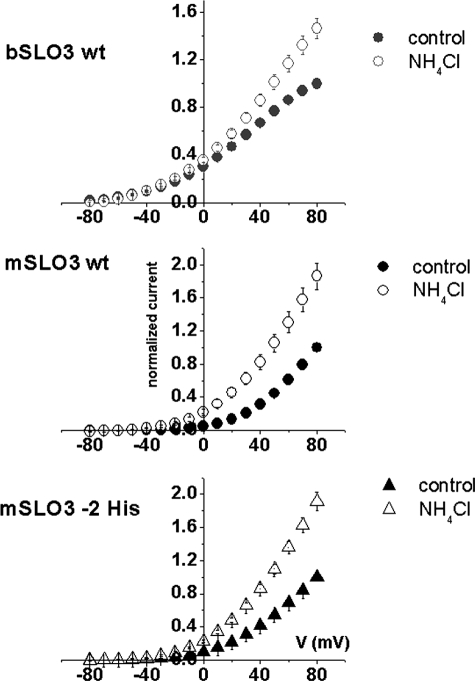
The removal of two histidine residues in mSLO3 subregion B does not affect pH sensitivity of mSLO3 channels. The I-V relationships are shown for: WT bSLO3 currents (top panel), WT mSLO3 currents (middle panel), and mSLO3−2 His mutant currents (bottom panel) in control conditions (filled symbols) and in the presence of 20 mm NH4Cl to alkalinize the intracellular medium (open symbols). The increases in the normalized current produced by intracellular alkalinization with NH4Cl measured at the value of the V½ of activation for each channel were 0.30 ± 0.009 to 0.36 ± 0.02 for WT bSLO3 (n = 7) at 0 mV, 0.8 ± 0.008 to 1.6 ± 0.14 at +70 mV for WT mSLO3 (n = 9), and 0.54 ± 0.01 to 1.1 ± 0.06 at +50 mV for the mSLO3–2 His mutant (n = 9). Note that intracellular alkalinization has less effect on WT bSLO3 than on WT mSLO3 channels, whereas the effect is very similar for both the WT mSLO3 channel and the mSLO3 mutant channel lacking two histidines (mSLO3 −2 His).
Similarities in the Biophysical Properties of bSLO3 and mSLO3 Channels
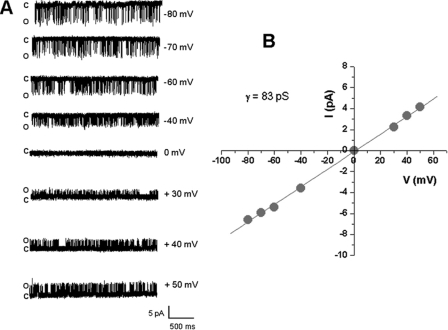
Like mSLO3 channels, bSLO3 channels are high conductance channels with very brief mean open times. Fig. 3 shows an inside-out patch containing bSLO3 with a conductance of 83 pS (84 ± 1.5 pS was the conductance measured in seven patches) in 140 mm symmetrical K+. mSLO3 channels have been reported to have a similar single channel conductance (77 pS) in symmetric 140 mm K+ (20). The mean open time values of bSLO3 channels vary from 0.18 ± 0.02 ms at −60 mV to 0.38 ± 0.07 ms at +50 mV at pHi 9 (n = 4). As predicted from the very shallow slope of its current-voltage relation, bSLO3 single channel openings are obvious throughout a wide voltage range, including negative voltages (Fig. 3).
FIGURE 3.
bSLO3 channels are high conductance K+ channels and are active over a wide voltage range. A, analysis of single channel openings in inside-out patches showed channel openings over a broad voltage range (shown from −80 to +50 mV). This is consistent with our whole cell measurements of the bSLO3 conductance-voltage relation showing activity over a broad voltage range (Fig. 2). B, a plot of single channel amplitudes at different voltages yielded a bSLO3 channel conductance of 83 pS in symmetrical 140 mm K+.
Mapping the Functional Domain Responsible for the Negative Voltage Range of Activation in bSLO3 Relative to mSLO3
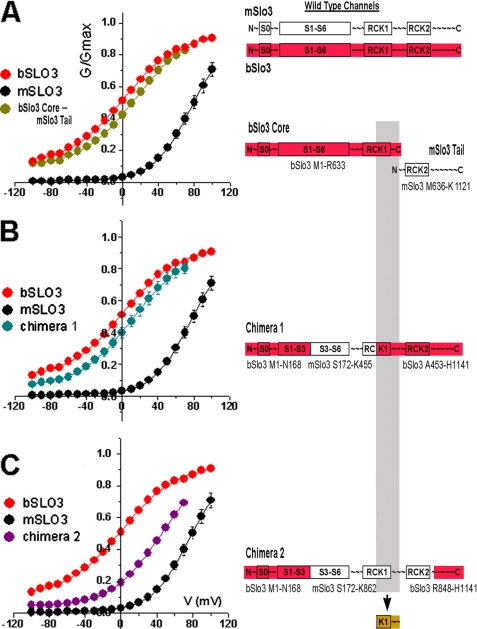
A striking difference in biophysical properties between bSLO3 and mSLO3 was the negative voltage range of bSLO3 current activation relative to mSLO3. Because there were so many differences in sequence between bSLO3 and mSLO3, we decided to narrow down the relevant region by creating interspecies (bovine and mouse) chimeric channel constructs involving large regions of the α subunits and testing each for its voltage range of activation. Our first approach in creating chimeric channels was to use a previously described technique (17–19) of creating core and tail regions from bovine and mouse α subunits and co-expressing the two constructs encoded on separate cRNAs. Note that we had previously used this technique to analyze SLO1 channels and had shown that co-injection of both core and tail cRNA into Xenopus oocytes produced SLO1 channels with functional properties indistinguishable from those of the wild type (17, 18). Furthermore we showed that functional channels can even be produced when co-expressing core and tail constructs from SLO1 and SLO3 channels (18). Using this approach we could mix and match the cores and tails from different species and compare the results. Core constructs of the α subunits were created for each of the two species beginning at the N terminus including membrane-spanning domains S0 through S6 and all of RCK1 and ending in the nonconserved linker region that joins RCK1 and RCK2 (Fig. 4A). C-terminal tail constructs were synthesized that began in the nonconserved linker region and extended through RCK2 to the C-terminal end of the channel subunit.
FIGURE 4.
The RCK1 region is important in determining the voltage range of activation of SLO3 channels. G-V curves from wild type bSLO3 and mSLO3 are compared with G-V curves for the following experimental constructs: A, co-expression of the bSLO3 core and mSLO3 tail. The G-V relation for this core and tail co-expression closely resembled that of wild type bSLO3 even though the tail containing RCK2 was from mSLO3. B, chimera 1 expression (bSLO3-based chimera containing the region of mSLO3 extending from S3 to the middle of RCK1) The G-V relation for this chimera also closely resembled that of wild type bSLO3. C, chimera 2 expression (same mSLO3 origin as chimera 1 but mSLO3 sequence extended through the entire RCK1 region). The G-V relation for this chimera was significantly shifted to more positive voltages. Each curve was fitted with a Boltzmann equation giving V½ values of +13 ± 3.8 mV (bSLO3 core-mSLO3 tail (n = 11)), +11.25 ± 4.8 mV (chimera 1 (n = 8)), and +44.0 ± 7.9 mV (chimera 2 (n = 11)) and k values of 29.9 ± 2.9, 29.4 ± 3.4, and 27.2 ± 2.4, respectively (means ± S.E.).
Our primary objective in doing the core and tail experiments was to determine whether structural domains in the tail region were a major determinant of the voltage range of activation. As a control we undertook the co-expression of mouse SLO3 core with mouse SLO3 tail. As expected, the currents produced in this experiment were indistinguishable from wild type mSLO3 currents (data not shown). In the next experiments we co-expressed the mouse tail with the bovine core to see whether the mouse tail region would cause a right shifted voltage range of activation when combined with the bovine core region. However, the currents in these experiments were virtually indistinguishable from wild type bovine (bSLO3) currents (Fig. 4A) in having a left-shifted voltage range of activation typical of bSLO3 and unlike mSLO3. These experiments suggested that the tail region, which contained the entire RCK2 domain, could be ruled out as the major determinant of the voltage range of activation.
To explore the importance of regions located in the core domain, three chimeras where then constructed to subdivide the core region between bSLO3 and mSLO3 (chimeras 1–3). These constructs are shown diagrammatically in Figs. 4 and 5. Experiments were then undertaken to analyze the voltage range of activation produced by each chimeric construct. Chimera 1 is a bSLO3-based chimera containing the region of mSLO3 extending from S3 to the middle of RCK1. When tested, these channels also had properties similar to wild type bSLO3 channels in that their voltage range of activation was left-shifted (Fig. 4B). This result suggested that the structural region responsible for the bSLO3 left-shifted voltage range of activation might be located outside of the S3 to mid-RCK1 region. Chimera 2 was used to assay the region to the right of the chimera 1 mSLO3-bSLO3 join point located in the middle of RCK1 because the mSLO3 insert had a common upstream origin with chimera 1 but extended through the entire RCK1 region (Fig. 4C, diagram). Chimera 2 channels, unlike chimera 1, expressed a current that had a more depolarized voltage range of activation and resulted in shifting the V½ of ∼40 mV to the right of wild type bSLO3 (see Fig. 4 legend). This represented a significant shift of the G-V curve toward the activation range of wild type mSLO3. The results of this experiment focused our attention on the distal half of RCK1 as being responsible for controlling the voltage range of activation in these SLO3 channel. This was because the influence of the RCK2 domain had been already ruled out by the results of the bSLO3 core-mSLO3 tail co-expression experiment shown in Fig. 4A, which produced currents with a G-V relation similar to wild type bSLO3 but included RCK2 in the mSLO3 tail. Thus, we narrowed down the critical region of the channel involved in determining the left-shifted voltage range of activation to the distal half of the RCK1 domain (Fig. 4, diagram, gray shading). To test whether this bSLO3 region alone was both necessary and sufficient to confer the left-shifted voltage range of activation, we created chimera 3, which was based on mSLO3 but contained the distal half of RCK1 from bSLO3 (diagram at top of Fig. 5). If our assumptions were correct, chimera 3, which contained mostly mSLO3 sequence except for the distal half of RCK1, should have a left-shifted G-V relation characteristic of wild type bSLO3. Fig. 5A shows the results of chimera 3 expression. Currents expressed by chimera 3 were indeed shifted almost entirely into the wild type bSLO3 voltage range, having a V½ of activation of +8.84 ± 1.98 mV (n = 11) to +0.49 ± 2.1 mV (n = 21) seen for bSLO3.
We next attempted to subdivide the distal half of the RCK1 region of bSLO3 to narrow down the region containing critical amino acid differences between bSLO3 and mSLO3 in this region, which might account for the shift in voltage range of activation. A comparison of amino acid sequence conservation in this region showed several areas of low conservation (Fig. 1). Three of these subregions (red bars A–C in Fig. 1) were chosen for analysis by creating three separate subunit constructs, mSLO3-A, mSLO3-B, and mSLO3-C by site-directed mutagenesis. Each of these three subunit constructs was identical to wild type mSLO3 except for the incorporation of bSLO3 residue substitutions from subregion A, B, or C. The results of functional expression of mSLO3-A, mSLO3-B, and mSLO3-C are shown in Fig. 5B. Of these three subregions of RCK1, subregion B clearly had the greatest effect in left shifting the voltage range of channel activation; chimera mSLO3-B had a V½ of 16.2 ± 1.42 mV (n = 19), which was closest to the V½ of 0.49 ± 2.1 mV (n = 21) of wild type bSLO3 and far left-shifted from wild type mSLO3 (V½ of 77.1. ± 4.9 (n = 9)). The incorporation of subregions A and C had much smaller effects (Fig. 5B).
Finally, we subdivided subregion B further to explore whether the amino acid residues determining the voltage range of activation within this region were distributed over the region, clustered, or even limited to a single residue (Fig. 5C). Thus, using the mSLO3 template, we incorporated four of the upstream residues of bovine subregion B to create mSLO3-Ba and three of the downstream bovine subregion B residues to create mSLO3-Bb (Fig. 5C). An analysis of the voltage range of activation of each of the constructs suggested that the amino acid residues determining this property were distributed over the region. Thus, whereas the entire subregion B from bovine incorporated into mSLO3 had a V½ of 16.2 ± 1.4 mV compared with that of WT mSLO3 (V½ of 77.1 ± 4.9 mV), both mSLO3-Ba and mSLO3-Bb were intermediate, with of V½ values of 42.4 ± 4.7 mV (n = 7) and 28.8 ± 1.5 mV (n = 8), respectively. Although mSLO3-Bb had a significantly larger effect on left shifting the voltage range of activation, it appears that several amino acid residues distributed across subregion B have significant effects on the voltage range of activation.
An additional functional property that differs between currents produced by bSLO3 and mSLO3 channels is their sensitivity to pH. When subjected to a rise in the intracellular pH induced by the application of NH4Cl to alkalinize the intracellular medium, currents from both channels increase in amplitude (Fig. 6) (4, 20). However, mSLO3 currents exhibit a somewhat larger relative increase than bSLO3 currents (Fig. 6 legend). We wondered whether this difference in pH sensitivity might be due to the fact that two histidine residues are conspicuously present in subregion B of mSLO3, whereas only one histidine residue is present in subregion B of bSLO3 (Fig. 5C, green asterisks; note also that the single His residue in bSLO3 is not in register with either of the two His residues present in mSLO3). To investigate this question, we replaced both of the histidine residues present in mSLO3 with the corresponding residues present in bSLO3 (glutamate and leucine) and tested currents produced by this construct for its pH sensitivity. The results of this experiment were negative; the replacement of both histidine residues in the mSLO3 subregion B sequence had no significant effect on the pH sensitivity of the channel (Fig. 6). Thus, although we cannot say definitively what the relationship is between pH sensitivity and voltage range of activation (or activation kinetics), it seems unlikely that the two histidine residues present in the mSLO3 subregion B area are central to the pH sensor.
RCK1 Subregion B Also Influences SLO3 Current Activation Kinetics
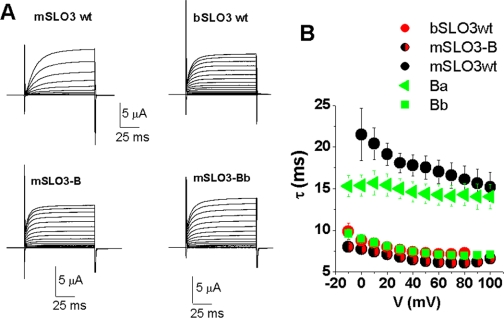
Another notable difference between wild type bSLO3 and mSLO3 channels is their difference in activation kinetics. bSLO3 currents activate faster and at more negative potentials than mSLO3 currents (Fig. 7A, bSLO3 wt and mSLO3 wt). To quantify macroscopic activation rates, we fitted a single exponential function to the first 22 ms of the activating currents at different voltages and plotted τact versus voltage (Fig. 7B). bSLO3 currents showed faster activation than mSLO3 currents at all voltages studied. Furthermore bSLO3 currents showed less voltage sensitivity in their rates of activation, in contrast to mSLO3 currents, which activate more rapidly at more positive voltages. Remarkably, we also found that chimera mSLO3-B, which is identical in amino acid sequence to wild type mSLO3 except for the small RCK1 subregion B from bSLO3, had current activation rates highly similar to those of wild type bSLO3 (Fig. 7). Additionally, mSLO3-B shows similar voltage dependence of activation rates to bSLO3 (Fig. 7B). This was unlike the currents produced by chimera mSLO3-A or mSLO3-C, which had activation rates and kinetic properties with greater similarity to wild type mSLO3 currents (data not shown).
FIGURE 7.
A subdivision of Subregion B confers bSLO3 kinetics on mSLO3 currents. A, current traces comparing the kinetics of activation of bSLO3, mSLO3, mSLO3-B chimera, and mSLO3-Bb chimera. The whole cell activation kinetics of the mSLO-B chimera and the mSLO3-Bb mutant resemble those of WT bSLO3. B, voltage dependence of the activation time constant (τact) of the same channels as in A. The bSLO3 τact and the mSLO-B and mSLO3-Bb τact are similarly voltage independent, only changing from ∼9 to 7 ms in the 0 to +80 voltage range, whereas mSLO3 τact is more voltage dependent, changing from ∼22 ms at 0 mV to 15 ms at +80 mV. mSLO3-Ba has τact values similar to mSLO3 but shows less voltage dependence with τact values ranging from 15 to 14 ms in the same voltage range.
Finally, we analyzed the kinetics of mSLO3-Ba and mSLO3-Bb, which subdivided subregion B (Fig. 5C), to explore whether the amino acid residues determining the kinetics of activation could be narrowed to yet a smaller region. An analysis of the kinetics of mSLO3-Ba and mSLO3-Bb showed that the kinetics of mSLO3-Bb channels were remarkably similar to those of wild type bSLO3, whereas mSLO3-Ba channels behaved more like wild type mSLO3. Again, this illustrated the large changes in channel behavior conferred by small structural changes in the subregion B area.
Where Is Subregion B?
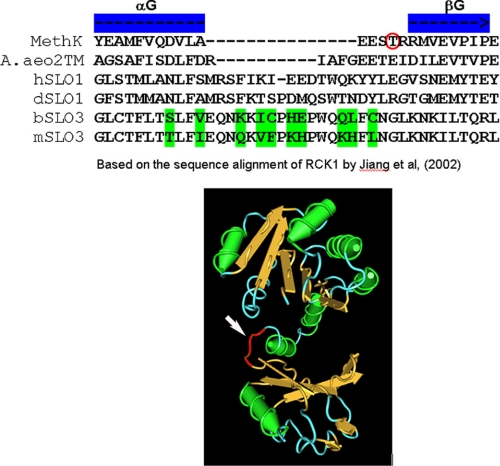
A prior alignment analysis of the amino acid sequences of RCK (regulator of K+ conductance) domains produced an alignment of RCK1 domains from both eukaryotic (SLO1) and prokaryotic potassium channels (21). Because the sequence of SLO3 potassium channels is co-linear and conserved with that of SLO1 potassium channels, we were able to add the SLO3 RCK1 domain to that alignment (Fig. 8). This alignment revealed that subregion B is a loop between the αG helix and the βG strand of the RCK1 domain and serves to link the αG helix of the intermediate subdomain to the C-terminal subdomain. Remarkably, it is this loop region that contains the greatest sequence and length polymorphisms among RCK1 domains of many species, as shown by the RCK1 sequence alignment of Jiang et al. (21). This region also has unusually low sequence conservation in bovine and mouse SLO3 channels (Figs. 1 and 8). Possible implications of this finding are discussed below.
FIGURE 8.
Physical location of Subregion B within RCK1. Alignment of the amino acid sequences of the RCK1 domains of both eukaryotic (SLO3 and SLO1) and prokaryotic potassium channels (MethK and A. aeo2TM) based on the work of Jiang et al. (21) show the position of subregion B. Because the sequence of SLO3 potassium channels is co-linear and conserved with that of SLO1 potassium channels, we were able to add the SLO3 RCK1 domain to that alignment. This alignment revealed that subregion B is a loop between the αG helix and the βG strand of the RCK1 domain and serves to link the αG helix of the intermediate subdomain to the C-terminal subdomain. This loop region contains the greatest sequence and length polymorphisms among RCK1 domains of many species, as shown by the RCK1 sequence alignment of Ref. 21. This region also has unusually low sequence conservation in bovine and mouse SLO3 channels (see Fig. 1A, as well as this figure). The arrow in the three-dimensional molecular diagram indicates the loop position as based on the crystal structure (21). The presence of RCK domains in SLO1 channels was first reported by Jiang et al. (21), who inferred their presence in SLO1 channels by their sequence homology to the RCK domains of MthK and other prokaryotic ion channels. The presence of RCK domains in SLO3 channels is inferred by the high amino acid sequence homology of the mSLO1 and mSLO3 paralogues (4). Notably, the sequence identity between the putative RCK1 domains of SLO1 and SLO3 channels is much higher (>50%) than the sequence identity between putative RCK1 domains of SLO1 and MthK channels (<20%), from which the presence of RCK domains in SLO1 family channels was originally inferred. A published study has also concluded that both RCK1 and RCK2 domains are present in all SLO family channels, SLO1, SLO2, and SLO3 (30).
It should be mentioned that a reciprocal effect was not observed when mSLO3 subregion B was introduced into bSLO3. This reciprocal construct did not shift the voltage range of activation from the bSLO3 range to more positive values characteristic of mSLO3. It appears that, unlike mSLO3, there are several regions in bSLO3 that strongly influence its voltage range of activation. Even the large region from mSLO3 extending from S3 all the way through RCK2 and inserted into bSLO3 to form chimera 2 (Fig. 4C, diagram) only shifted the voltage range of activation a little more than halfway into the positive voltage range of mSLO3 (Fig. 4C, graph). Thus, the voltage range of activation in bSLO3 channels may involve functions or interactions of the N terminus through the S3 region, or even of the extreme C terminus, which are relatively less important in mSLO3 channels.
DISCUSSION
Here we report the cloning and expression of a SLO3 orthologue from bovine species (bSLO3) and compare its sequence and functional properties with that of the previously cloned SLO3 channel from mouse (mSLO3). We found a significantly low degree of conservation in both sequence and functional properties in the SLO3 orthologues when compared with the very high degree of conservation in SLO1 orthologues in the same two species. This is despite the fact that SLO3 and SLO1 paralogues are highly homologous and co-linear. Despite their similarity, SLO3 channels seem to be driven by evolutionary pressures that radically differ from those influencing the evolution of SLO1 channels. Because SLO3 channels are only found in Mammalia, whereas SLO1 channels are found even in invertebrate phyla, it is reasonable to assume that SLO3 channels appeared relatively late in evolution, probably as a result of duplication of the SLO1 gene followed by evolutionary differentiation.
The pattern of tissue distribution of these two proteins is also very different. SLO3 is only found in testis and localized in male reproductive cells (4), whereas SLO1 is widespread and found in many tissues including neurons and muscle. SLO1 appears to be optimized for many different roles in many different organs. Thus, its rate of change over time may be limited by its use in multiple roles. On the other hand, the role of SLO3 may be restricted to a reproductive function that requires continual optimization as species evolve and/or conditions change. In general, it is known that the spatial pattern of expression of a gene is a major determinant of its evolutionary rate of change (22, 23) because genes of different functional classes may evolve under different selective pressures. At one extreme, genes involved in sex and reproduction evolve most rapidly (2, 24), and this is particularly true for those expressed in the male reproductive tract (25).
The differing functional properties of SLO3 channels from bovine and mouse species may have important consequences for the physiology of fertilization in these two species. Because of their left-shifted range of activation, bSLO3 channels are more likely to contribute to the resting potential of bovine sperm. Also, the higher K+ selectivity of bSLO3 channels would allow them to contribute more to hyperpolarization of the sperm plasma membrane, a factor that may be important in capacitation (9–11, 26). On the other hand, mSLO3 channels that activate at more positive voltages and have lower selectivity for K+ appear less suited for a role in capacitation. Recently, a pH-sensitive K+ current was detected in mouse sperm by direct voltage clamp recordings (27, 28) and may be the native current carried by mSLO3 channels. Nevertheless, the physiological function of SLO3 channels remains unknown and will probably require the physiological analysis of a SLO3 gene knock-out mutant to be resolved.
In MthK channels the opening and closing of the gating ring result from the movement of individual RCK subunits around two hinge points of the flexible interface. One is at Ser230 between the N-terminal lobe and the intermediate subdomain. The other one is at Thr261 within the loop between the intermediate subdomain and the C-terminal subdomain (29). Amazingly, an alignment of the amino acid sequence of the SLO3 RCK1 domain with that of MthK shows that subregion B corresponds to the same loop between the intermediate subdomain and the C-terminal subdomain (Fig. 8). Indeed, the alignment suggests that the distal end of subregion B may well contain a hinge point analogous to MthK Thr261 (Fig. 8, red circled residue). This loop region appears to be a major determinant of channel function in that we found that very small structural changes produce large changes in channel activation and kinetics. It remains to be determined why channel function is so sensitive to amino acid residue composition in this loop area and what the critical factors are relative to, length, charge, bulk, or other physical properties. Given this sensitivity to composition, it is tempting to speculate that the high degree of sequence divergence seen in this RCK1 region in several potassium channel types and species (Fig. 8) represents an evolutionary adaptation of channel properties for a multitude of purposes.
Supplementary Material
Acknowledgments
We thank La Toya Smith and Gonzalo Budelli and Marisa Jackson for technical assistance, Dr. Patricio Rojas for helpful discussions, and Travis Hage for helpful comments on the manuscript.
This work was supported, in whole or in part, by National Institutes of Health Grants R21 HD056444 (to C. S.) and R24 RR017342 and R01 GM067154 (to L. S.).

The on-line version of this article (available at http://www.jbc.org) contains supplemental Fig. S1 and Table S1.
- b
- bovine
- m
- mouse
- DIDS
- 4,4′-diisothiocyanostilbene-2,2′-disulfonic acid
- WT
- wild type
- pS
- picosiemens.
REFERENCES
- 1.Wyckoff G. J., Wang W., Wu C. I. (2000) Nature 403, 304–309 [DOI] [PubMed] [Google Scholar]
- 2.Swanson W. J., Vacquier V. D. (2002) Nat. Rev. Genet. 3, 137–144 [DOI] [PubMed] [Google Scholar]
- 3.Torgerson D. G., Kulathinal R. J., Singh R. S. (2002) Mol. Biol. Evol. 19, 1973–1980 [DOI] [PubMed] [Google Scholar]
- 4.Schreiber M., Wei A., Yuan A., Gaut J., Saito M., Salkoff L. (1998) J. Biol. Chem. 273, 3509–3516 [DOI] [PubMed] [Google Scholar]
- 5.Butler A., Tsunoda S., McCobb D. P., Wei A., Salkoff L. (1993) Science 261, 221–224 [DOI] [PubMed] [Google Scholar]
- 6.Orio P., Rojas P., Ferreira G., Latorre R. (2002) News Physiol. Sci. 17, 156–161 [DOI] [PubMed] [Google Scholar]
- 7.Atkinson N. S., Robertson G. A., Ganetzky B. (1991) Science 253, 551–555 [DOI] [PubMed] [Google Scholar]
- 8.Wang Z. W., Saifee O., Nonet M. L., Salkoff L. (2001) Neuron 32, 867–881 [DOI] [PubMed] [Google Scholar]
- 9.Visconti P. E., Westbook V. A., Chertihin O., Demarco I., Sleight S., Diekman A. B. (2002) J. Reprod. Immunol. 53, 133–150 [DOI] [PubMed] [Google Scholar]
- 10.Breitbart H. (2003) Cell. Mol. Biol. 49, 321–327 [PubMed] [Google Scholar]
- 11.Darszon A., Nishigaki T., Wood C., Treviño C. L., Felix R., Beltrán C. (2005) Int. Rev. Cytol. 243, 79–172 [DOI] [PubMed] [Google Scholar]
- 12.Fay J. C., Wyckoff G. J., Wu C. I. (2001) Genetics 158, 1227–1234 [DOI] [PMC free article] [PubMed] [Google Scholar]
- 13.Podlaha O., Webb D. M., Tucker P. K., Zhang J. (2005) Mol. Biol. Evol. 22, 1845–1852 [DOI] [PMC free article] [PubMed] [Google Scholar]
- 14.Cai X., Clapham D. E. (2008) PLoS 3, e3569. [DOI] [PMC free article] [PubMed] [Google Scholar]
- 15.Bezanilla F. (2008) Nat. Rev. Mol. Cell Biol. 9, 323–332 [DOI] [PubMed] [Google Scholar]
- 16.Schreiber M., Salkoff L. (1997) Biophys J. 73, 1355–1363 [DOI] [PMC free article] [PubMed] [Google Scholar]
- 17.Wei A., Solaro C., Lingle C., Salkoff L. (1994) Neuron 13, 671–681 [DOI] [PubMed] [Google Scholar]
- 18.Schreiber M., Yuan A., Salkoff L. (1999) Nat. Neurosci. 2, 416–421 [DOI] [PubMed] [Google Scholar]
- 19.Xia X. M., Zhang X., Lingle C. J. (2004) J. Neurosci. 24, 5585–5591 [DOI] [PMC free article] [PubMed] [Google Scholar]
- 20.Zhang X., Zeng X., Xia X. M., Lingle C. J. (2006) J. Gen. Physiol. 128, 301–315 [DOI] [PMC free article] [PubMed] [Google Scholar]
- 21.Jiang Y., Lee A., Chen J., Cadene M., Chait B. T., MacKinnon R. (2002) Nature 417, 515–522 [DOI] [PubMed] [Google Scholar]
- 22.Civetta A., Singh R. S. (1995) J Mol. Evol. 41, 1085–1095 [DOI] [PubMed] [Google Scholar]
- 23.Duret L., Mouchiroud D. (2000) Mol. Biol. Evol. 17, 68–74 [DOI] [PubMed] [Google Scholar]
- 24.Singh R. S., Kulathinal R. J. (2000) Genes Genet. Syst. 75, 119–130 [DOI] [PubMed] [Google Scholar]
- 25.Coulthart M. B., Singh R. S. (1988) Mol. Biol. Evol. 5, 182–191 [DOI] [PubMed] [Google Scholar]
- 26.Arnoult C., Kazam I. G., Visconti P. E., Kopf G. S., Villaz M., Florman H. M. (1999) Proc. Natl. Acad. Sci. U.S.A. 96, 6757–6762 [DOI] [PMC free article] [PubMed] [Google Scholar]
- 27.Navarro B., Kirichok Y., Clapham D. E. (2007) Proc. Natl. Acad. Sci. U.S.A. 104, 7688–7692 [DOI] [PMC free article] [PubMed] [Google Scholar]
- 28.Martínez-López P., Santi C. M., Treviño C. L., Ocampo-Gutiérrez A. Y., Acevedo J. J., Alisio A., Salkoff L. B., Darszon A. (2009) Biochem. Biophys. Res. Commun. 381, 204–209 [DOI] [PMC free article] [PubMed] [Google Scholar]
- 29.Ye S., Li Y., Chen L., Jiang Y. (2006) Cell 126, 1161–1173 [DOI] [PubMed] [Google Scholar]
- 30.Kim H. J., Lim H. H., Rho S. H., Eom S. H., Park C. S. (2006) J. Biol. Chem. 281, 38573–38581 [DOI] [PubMed] [Google Scholar]
Associated Data
This section collects any data citations, data availability statements, or supplementary materials included in this article.


