

Abstract
Analysis of the pattern of nucleotide diversity in 222 independent viral sequence datasets showed the prevalence of purifying selection. In spite of the higher mutation rate of RNA viruses, our analyses revealed stronger evidence of the action of purifying selection in RNA viruses than in DNA viruses. The ratio of nonsynonymous to synonymous nucleotide diversity was significantly lower in RNA viruses than in DNA viruses, indicating that nonsynonymous mutations have been removed at a greater rate (relative to the mutation rate) in the former than in the latter. Moreover, statistics that measure the occurrence of rare polymorphisms revealed significantly a greater excess of rare nonsynonymous polymorphisms in RNA viruses than in DNA viruses but no difference with respect to synonymous polymorphisms. Since rare nonsynonymous polymorphisms are likely to be undergoing the effects of purifying selection acting to eliminate them, this result implies a stronger signature of ongoing purifying selection in RNA viruses than in DNA viruses. Across datasets from both DNA viruses and RNA viruses, we found a negatively allometric relationship between nonsynonymous and synonymous nucleotide diversity; in other words, nonsynonymous nucleotide diversity increased with synonymous nucleotide diversity at a less than linear rate. These findings are most easily explained by the occurrence of slightly deleterious mutations. The fact that the negative allometry was more pronounced in RNA viruses than in DNA viruses provided additional evidence that purifying selection is more effective in the former than in the latter.
Keywords: DNA virus, immune selection, nucleotide diversity, purifying selection, RNA virus
1. Introduction
The genomes of viruses are encoded in a range of different types of nucleic acid molecule, such as double-stranded DNA (dsDNA); single-stranded DNA (ssDNA); positive-strand single-stranded RNA (ssRNA); and negative-strand ssRNA. These differences in genome composition may be expected to have an impact on viral population biology. Viruses with RNA genomes are known to have mutation rates per site per replication that are three to four orders of magnitude greater than those of viruses with DNA genomes (Domingo and Holland 1997; Drake et al. 1998), a difference that is attributed to the error-prone nature of viral RNA-dependent RNA polymerases (Reanney 1982). Given that most mutations in coding regions are deleterious, a high mutation rate in turn may be expected to give rise to the accumulation of deleterious mutations (“Muller’s ratchet”), unless recombination allows such mutations to be purged by purifying selection (Chao 1988, 1997). RNA viruses also have short replication times in comparison to some DNA viruses and thus can generate very large populations within an infected host, but it is expected that the effective population size of the virus as a whole will be greatly reduced by severe bottlenecks in transmission (Escarmis et al. 2006; Manrubia et al. 2005).
In addition to differences based on genome composition, viruses are expected to face widely different selection pressures depending on the taxon of cellular organisms that they infect. The most obvious such differences are between viruses infecting vertebrate animals and those infecting other hosts. Vertebrates are unique in possessing the mechanisms of specific (or “adaptive”) immunity, which involves somatically generated receptors that make possible highly specific recognition of foreign proteins (Klein and Hořejši 1997). There is experimental evidence that recognition by the vertebrate class I major histocompatibility complex (MHC) and cytotoxic T cell (CTL) receptors gives rise to positive selection favoring changes in viral proteins that lead to escape from recognition by this system; for example, in simian immunodeficiency virus and hepatitis C virus (Allen et al. 2000; Erickson et al. 2001; Evans et al. 1999; O’Connor et al. 2004; Weiner et al. 1995). In addition, statistical analyses have provided evidence of past escape mutation in CTL epitopes of a number of viruses (Moore et al. 2002; Suzuki 2006). Likewise, there is statistical evidence that epitopes for host neutralizing antibodies (immunoglobulins) have been subject to selection favoring amino acid replacements in a variety of viruses (Fitch et al. 1991; Suzuki 2006; Yang et al. 2003).
The unique selection pressures imposed on viruses by the vertebrate specific immune system have apparently given rise to the viral envelope, a structure that is apparently unique to viruses infecting vertebrates. This structure, which surrounds the virus particles of many (though not all) viruses infecting vertebrates, consists of a lipid bilayer derived from a host cell compartment plus virally encoded glycoproteins. Envelope glycoproteins are frequent targets for host antibodies and provide many examples of proteins that have evolved rapidly, apparently as a result of positive selection driven by host immune recognition (Fitch et al. 1991; Hughes et al. 2007; Piontkivska and Hughes 2006; Suzuki 2006; Yang et al. 2003).
Although epitopes for vertebrate host MHC/CTL and antibody recognition are apparently subject to positive selection, there is abundant evidence that the predominant form of selection acting on viral protein-coding genes is purifying selection, which acts to eliminate deleterious mutations (Hughes 2005; Hughes 2007; Hughes and Hughes 2005; Hughes et al. 2007; Jerzak et al. 2005; Nei 1983; Pybus et al. 2007; Saitou and Nei 1986; Suzuki and Gojobori 1997). Evidence of the ubiquity of purifying selection is provided by the observation that, in the vast majority of protein-coding genes of viruses, as of cellular organisms, the number of synonymous nucleotide substitutions per synonymous site (dS) exceeds the number of nonsynonymous nucleotide substitutions per nonsynonymous site (dN). This relationship generally holds for most of the gene even when positive selection (indicated by dN > dS) is acting on a portion of the protein, such as an epitope in a viral protein (Piontkivska and Hughes 2006).
Woelk and Holmes (2002) estimated mean dN /dS in genes encoding surface proteins of two categories of RNA viruses infecting vertebrates: (1) those spread by an arthropod vector (arboviruses); and (2) those spread by other means. Mean dN /dS was consistently lower in the former than in the latter, suggesting that arboviruses are subject to particularly strong purifying selection on surface proteins of viral particles. They hypothesized that the more intense purifying selection in arboviruses arises from constraints due to interaction of the arbovirus with two different hosts, the arthropod and the vertebrate, each with its own defense mechanisms. However, in general there is little understanding of factors associated with the strength of purifying selection on different proteins of viruses infecting different hosts.
Here we analyze patterns of purifying selection in 222 sequence datasets sampled from populations representing a wide variety of viral lineages. There are two aspects of DNA sequence polymorphism that provide evidence regarding different aspects of purifying selection (Hughes 2005; Hughes and Hughes 2007a). As mentioned previously, dS > dN is indicative of purifying selection acting to remove or at least decrease in frequency certain deleterious nonsynonymous mutations; and the relative magnitudes of dN and dS provide evidence of the strength and/or the effectiveness of purifying selection acting on such mutations. Moreover, the disproportional occurrence of rare nonsynonymous variants is indicative of ongoing purifying selection acting to remove slightly deleterious nonsynonymous mutations from the population (Nachman et al. 1994, 1996; Hughes et al. 2003; Hughes 2005; Hughes and Hughes 2007a). We examine both of these aspects of purifying selection in order to test for distinctive patterns associated with viral genomic composition and host characteristics.
2. Methods
2.1. Sequence Data
Analyses were based on 222 sequence datasets derived from 206 separate accessions in the NCBI Popset database, representing protein coding genes from 117 virus lineages, representing 27 families and the four major groups of viruses classified by genome composition (Table 1 and Supplementary Table S1). No retrovirus datasets were included. The 117 virus lineages included separate viral species as well as phylogenetically distinct types or lineages of the same species (e.g., hepatitis C virus types and influenza virus A genotypes). When more than one such type or lineage was included from the same viral species, we used preliminary phylogenetic analyses in order to verify that the lineages were indeed phylogenetically distinct. When the Popset database included two or more accessions of sequences from the same locus and the same viral lineage, we combined separate accessions if they were similar in length. However, when these accessions differed substantially in length, we chose the accession or accessions providing longer sequences. On the other hand, a single Popset accession might sometimes give rise to more than one of our datasets if that accession included sequence for more than one gene or for more than one distinct virus species or type.
Table 1.
Numbers of viral sequence datasets used in analyses.
| Virus group | Family | Host |
||
|---|---|---|---|---|
| Vertebrate (no vector) | Vertebrate (arthropod vector) | Plant | ||
| dsDNA | Adenoviridae | 4 | 0 | 0 |
| Asfarviridae | 0 | 1 | 0 | |
| Herpesviridae α | 15 | 0 | 0 | |
| Herpesviridae β | 8 | 0 | 0 | |
| Herpesviridae γ | 10 | 0 | 0 | |
| Iridoviridae | 1 | 0 | 0 | |
| Papillomaviridae | 8 | 0 | 0 | |
| Phycodnaviridae | 0 | 0 | 2 | |
| Poxviridae | 12 | 0 | 0 | |
| ssDNA | Circoviridae | 8 | 0 | 0 |
| Geminiviridae | 0 | 0 | 5 | |
| Parvoviridae | 2 | 0 | 0 | |
| ssRNA negative-strand | Arenaviridae | 5 | 0 | 0 |
| Bunyaviridae | 1 | 3 | 0 | |
| Orthomyxoviridae | 26 | 0 | 0 | |
| Paramyxoviridae | 28 | 0 | 0 | |
| Rhabdoviridae | 5 | 0 | 0 | |
| ssRNA positive-strand | Astroviridae | 5 | 0 | 0 |
| Benyvirus | 0 | 0 | 1 | |
| Bromoviridae | 0 | 0 | 5 | |
| Caliciviridae | 2 | 0 | 0 | |
| Closteroviridae | 0 | 0 | 6 | |
| Flaviviridae | 18 | 22 | 0 | |
| Flexiviridae | 0 | 0 | 3 | |
| Potyviridae | 0 | 0 | 15 | |
| Tombusviridae | 0 | 0 | 1 | |
Sequences were aligned with the CLUSTAL X program (Thompson et al. 1997). Datasets chosen for analysis met the following criteria: (1) no more than one dataset represented a given gene in a given viral lineage; (2) each dataset included at least 4 sequences and at least 30 codons; (3) each dataset included at least one synonymous and at least one nonsynonymous nucleotide difference; (4) the synonymous nucleotide diversity (πS; see below) did not exceed 0.5; and (5) there was a single polymorphic site in at least 25% of codons with one or more polymorphic sites (see below). The mean number of sequences per dataset was 27.0 ± 2.5 (S.E.); the median was 16.0 (range 4-210). There were 157 (70.7%) data sets with at least 10 sequences. No differences in the results were seen when the analyses were conducted using only these 157 data sets. The mean number of codons compared was 249.6 ± 12.8; the median was 197.0 (range 30-1240). Overall, these comparisons involved 5,990 sequences and a total of 4,278,708 nucleotide sites.
Based on information regarding protein function from van Regenmortel et al. (2000) and from sequence database annotations, proteins were classified as exposed on the surface of virus particles or non-exposed. Exposed proteins included envelope glycoproteins in the case of viruses possessing an envelope or proteins on the capsid surface in those lacking an envelope.
2.2. Statistical Methods
We used Nei and Gojobori’s (1986) method to estimate the number of synonymous nucleotide substitutions per synonymous site (dS) and the number of nonsynonymous nucleotide substitutions per nonsynonymous site (dN). In preliminary analyses, complicated methods making more assumptions (Li 1993; Yang and Nielsen 2000) yielded essentially identical results, as has been found in other studies when the number of substitutions per site is small, as in the present data (Hughes and French 2007). Within each of the 222 sequence datasets, we computed the synonymous nucleotide diversity (πS), which is the mean of dS values for all pairwise comparisons; and the nonsynonymous nucleotide diversity (πN), which is the mean of dN values for all pairwise comparisons (Nei and Kumar 2000).
In order to examine the relative frequency of rare alleles at synonymous and nonsynonymous sites, we compared the average number of nucleotide differences and the number of segregating sites (Tajima 1989) separately for synonymous and nonsynonymous sites (Rand and Kann 1996; Hughes 2005; Hughes and Hughes 2007a). To avoid ambiguous cases, we computed these quantities excluding all codons with two or more polymorphic sites. In most datasets, there was only a single polymorphic site at the vast majority of codons; for all 222 datasets, the median percentage of polymorphic codons having a single polymorphic site was 92.4%.
For synonymous polymorphisms at codons having a single polymorphic site, we computed the difference Ks − S*s. Ks is the mean number of synonymous nucleotide differences for all pairwise comparisons among the n allelic sequences in the data set. If Ss is the number of synonymous segregating sites, then
| (1) |
The divisor in equation (1) is a factor providing an adjustment for sample size (n) and is given by the following (Tajima 1989):
| (2) |
Similarly, for nonsynonymous polymorphisms at codons having a single polymorphic site, we computed the difference Kn − S*n. Kn is the mean number of nonsynonymous nucleotide differences for all pairwise comparisons among the n allelic sequences in the data set; and, if Sn is the number of segregating nonsynonymous sites
| (3) |
The differences Ks − S*s and Kn − S*n constitute the numerator of Tajima’s (1989) D statistic computed separately for synonymous and nonsynonymous polymorphisms, respectively. We then computed the ratio of this difference to the absolute value of the minimum possible value of the difference, which would occur if all polymorphisms were singletons (Schaeffer 2002). We designate this ratio Qsyn in the case of synonymous polymorphisms and Qnon in the case of nonsynonymous polymorphisms. Comparing Qsyn and Qnon provides an index of the relative abundance of rare alleles at synonymous and nonsynonymous sites, with a strongly negative value indicating an abundance of rare alleles (Hughes and Hughes 2007a). Note that, unlike Tajima’s D, these ratios are independent of sample size and thus can be compared between datasets of different size.
Tajima’s D provides a test of neutrality that depends on the assumption of mutation-drift equilibrium (Tajima 1989; Nei and Kumar 2000). For example, a recent population bottleneck can yield a negative value of D in the absence of purifying selection. However, in the present analyses, we are not attempting to test for neutrality but merely to use Qsyn and Qnon as convenient indices of the relative abundance of rare variants at synonymous and nonsynonymous sites, respectively. Note also that, since a bottleneck should affect both synonymous and nonsynonymous polymorphisms equally (Tajima 1989), a marked and consistent difference between Qsyn and Qnon is likely to be due to selection on nonsynonymous sites.
We compared median values of πS, πN, Qsyn, and Qnon among groups of viruses using nonparametric statistical methods because the distribution of these variables was not normal. However, preliminary analyses using parametric methods generally yielded similar results (not shown). In order to examine the relationship between πS and πN, we first transformed these variables to improve normality by taking the natural logarithm. The hypothesis of a normal distribution could not be rejected for log-transformed values of πN (Anderson-Darling test, P = 0.74). We regressed the logarithm of πN on that of πS, making use of allometric regression techniques that have been widely used in biology (Sokal and Rohlf 1981). All statistical analyses were conducted using the Minitab statistical package, release 13 (http://www.minitab.com/). We avoided so-called codon based methods because these assume 100% knowledge of the phylogenetic tree and an absence of recombination, conditions rarely if ever met in the case of allelic sequences (Hughes et al. 2006). Because each of the 222 datasets was phylogenetically distinct from the others, sequence polymorphism within each dataset was statistically as well as phylogenetically independent from that in other datasets.
3. Results
3.1. Evidence of Purifying Selection
A plot of nonsynonymous nucleotide diversity (πN) vs. synonymous nucleotide diversity (πS) in 222 datasets sampling viral nucleotide sequence polymorphism showed that πS exceeded πN in a substantial majority of cases (211 of 222 datasets or 95%; P < 0.001; sign test; Figure 1). Of the 11 datasets with πN greater than πS, none showed a significant difference between πN and πS by the conservative Z-test; but this unusual pattern was nonetheless suggestive of positive Darwinian selection. These 11 datasets involved genes encoding the following proteins: the Meq oncoprotein of gallid herpesvirus 2; the EBNA-1 protein of human herpesvirus 4; the K1 glycoprotein of human herpesvirus 8; the A4 protein of tomato chlorotic vein virus; the C2 TrAP protein of Tomato yellow leaf curl Sardinia virus; glycoprotein G of human respiratory syncytial virus subgroup B; hemagglutinin protein of influenza virus A H1N2; matrix protein 2 of influenza virus A H7N2; the capsid protein of human astrovirus type 8; protein p25 of beet necrotic yellow vein virus; and the coat protein of grapevine B virus. Thus five of the 11 datasets with possible positive selection were from DNA viruses, and six were from RNA viruses. Seven were from viruses infecting vertebrates, and four from plant viruses. Only two (glycoprotein G of human respiratory syncytial virus subgroup B and hemagglutinin protein of influenza virus A H1N2) involved surface proteins of viruses infecting vertebrates.
Figure 1.
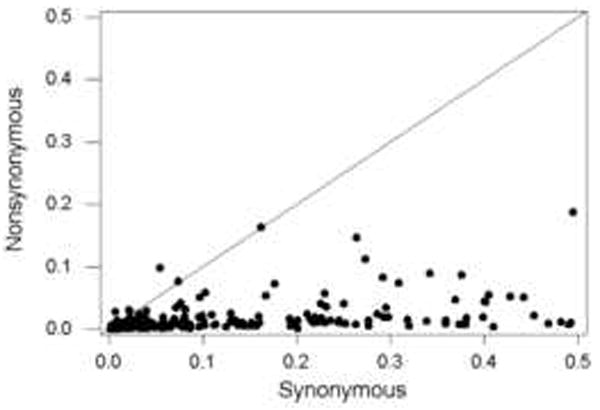
Plot of nonsynonymous nucleotide diversity (πN) vs. synonymous nucleotide diversity (πS) in 122 independent virus sequence datasets. The line is a 45° line. Sign test of equality of paired πN and πS values: P < 0.001.
Considering only codons with a single polymorphic site, we compared the mean number of nucleotide differences (K) with the number of segregating synonymous sites adjusted for sample size (S*) separately for synonymous and nonsynonymous polymorphisms. This comparison provides a measure of the incidence of rare polymorphisms, which in turn reflects ongoing purifying selection (Tajima 1989). In the case of synonymous sites, Ks exceeded S*s in 109 datasets, while the reverse was true in 113 datasets (Figure 2A); thus there was no significant tendency for either of the two quantities to be the larger (N.S.; sign test.). By contrast, Kn exceeded S*n in only 45 of the datasets, while the reverse was true in 177 datasets (Figure 2B); the difference was highly significant (P < 0.001; sign test). For all 222 datasets, the median value of Qsyn was −0.0189, while that of Qnon was −0.411. The difference between medians was highly significant (P < 0.001; Wilcoxon signed rank test). Thus, the results indicate a general tendency toward rare polymorphisms, indicative of ongoing purifying selection, at nonsynonymous but not at synonymous sites.
Figure 2.
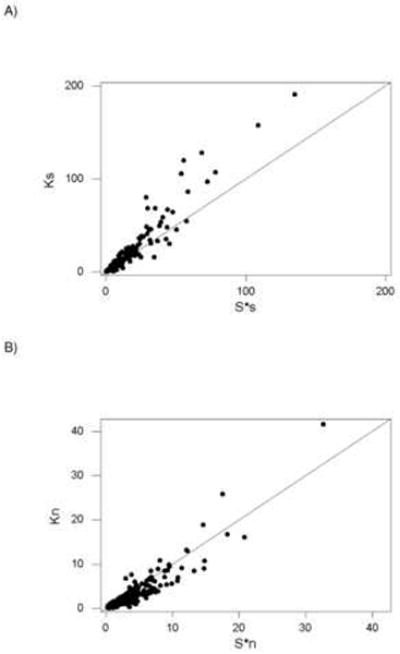
Plots of (A) mean number of synonymous differences (Ks) vs. the adjusted number of synonymous segregating sites (S*s); and (B) mean number of nonsynonymous differences (Kn) vs. the adjusted number of nonsynonymous segregating sites (S*n) based on 1-substitution codons in 222 virus sequence datasets. In each case, the line is a 45° line. Sign test of the equality of paired Ks and S*n: N.S. Sign test of the equality of paired Kn and S*n: P < 0.001.
3.2. Comparison of DNA and RNA Viruses
Comparison of datasets from DNA and RNA viruses showed substantial differences with respect to variables associated with aspects of purifying selection (Table 2). Median πS was significantly greater in datasets from RNA viruses than in those from DNA viruses, but DNA viruses and RNA viruses did not differ with respect to median πN (Table 2). As a consequence, the median of the πN / πS ratio was significantly greater in DNA viruses than in RNA viruses (Table 2). Because DNA viruses and RNA viruses did not differ with respect to the G+C content at third codon positions (GC3, Table 2), it is unlikely that a compositional bias affecting the observed level of synonymous substitution can account for these results. DNA viruses and RNA viruses did not differ significantly with respect to median Qsyn; but median Qnon was significantly more negative in RNA viruses than in DNA viruses (Table 2). The results thus indicate a more effective action of purifying selection in RNA viruses than in DNA viruses.
Table 2.
Median (with range) of variables describing polymorphism in DNA and RNA virus sequence datasets.
| Variable | DNA viruses (N = 76) | RNA viruses (N = 146) | P (Mann-Whitney test) |
|---|---|---|---|
| πS | 0.0239 (0.0016-0.4530) | 0.0869 (0.0015-0.4951) | < 0.001 |
| πN | 0.0065 (0.0003-0.1630) | 0.0076 (0.0003-0.1875) | N.S. |
| πN / πS | 0.2569 (0.0316-4.3281) | 0.0879 (0.0055-2.4400) | < 0.001 |
| Qsyn | -0.0454 (-0.9814-2.9425) | 0.0018 (-1.3471-15.4082) | N.S. |
| Qnon | -0.4316 -1.0426-2.9972) | -0.6252 (-1.5634-2.4001) | 0.004 |
| GC3 (%) | 49.7 (23.3-96.5) | 46.8 (25.4-73.7) | N.S. |
Within the DNA viruses, there were not significant differences between dsDNA virus datasets (N = 61) and ssDNA virus datasets (N = 15) with respect to median πN / πS or Qnon (not shown). Likewise within RNA viruses, there were not significant differences between negative-strand RNA virus datasets (N = 68) and positive-strand RNA virus datasets (N = 78) with respect to median πN / πS or Qnon (not shown). Thus, as far as could be detected from the available data, there were differences with respect to the effectiveness of purifying selection between DNA and RNA viruses but not between the major subgroups of these two major groups of viruses.
3.3. Synonymous and Nonsynonymous Nucleotide Diversity
In order to examine further the relationship between synonymous and nonsynonymous nucleotide diversity in DNA and RNA viruses, we conducted an analysis of covariance using a general linear model procedure to test for effects on log πN of viral group (DNA virus vs. RNA virus); of the covariate log πS; and of group-by-covariate interaction. There was a significant effect (P < 0.001) of the covariate, reflecting the strong linear correlation between log πS and log πN (r = 0.636; P < 0.001). There was also a highly significant effect (P < 0.001) of viral group, indicating a higher mean log πN in DNA viruses than in RNA viruses, adjusting for the linear effect of the covariate πS. The adjusted mean log πN for DNA viruses was −4.48 ± 0.12 (S.E.), corresponding to a mean πN of 0.0114 ± 0.0015; and the adjusted mean log πN for RNA viruses was −5.06 ± 0.08, corresponding to a mean πN of 0.0064 ± 0.0005. Moreover, there was a significant (P = 0.003) group-by-covariate interaction, indicating that the slope of the relationship between πN and πS differed significantly between DNA viruses and RNA viruses.
In order to investigate this interaction, we conducted allometric regression of log πN on log πS separately for DNA viruses and RNA viruses (Figure 3). For DNA viruses, we obtained the allometric equation πN = 0.116 πS 0.788 (R2 = 59.2%: P < 0.001), whereas for RNA viruses the equation was πN = 0.028 πS 0.500 (R2 = 33.2%: P < 0.001). The difference in the exponents of these relationships is illustrated by the difference in slopes of the regression lines on log-log axes (Figure 3). The allometric exponent for DNA viruses (0.788) was significantly different from both 1.0 (t = 2.81; 74 d.f.; P < 0.01) and from 0.5 (t = 3.83; 74 d.f.; P < 0.001). The allometric exponent for RNA viruses (0.500) was significantly different from 1.0 (t = 9.84; 144 d.f.; P < 0.001). The results thus show that for both DNA viruses and RNA viruses, πN increased as a function of πS at a rate significantly less than linear (which would correspond to an exponent of 1.0). Moreover, the deviation from linearity was significantly more pronounced in the case of RNA viruses than in the case of DNA viruses.
Figure 3.

Plot on logarithmic axes of nonsynonymous nucleotide diversity (πN) vs. synonymous nucleotide diversity (πS) in (A) 76 DNA virus datasets; and (B) 146 RNA virus data sets. In each case, the line is the linear regression of log πN on log πS: for DNA viruses, log πN = -2.15 + 0.788 log πS (equivalently, πN = 0.166 πS 0.788), R2 = 59.2%; P < 0.001); for RNA viruses, log πN = -3.58 + 0.500 log πS (equivalently, πN = 0.028 πS 0.500), R2 = 33.2%; P < 0.001).
3.4. Host Differences
In order to assess the effects of selection due to interaction with host defenses, particularly those of the vertebrate immune system, we compared median πN / πS ratios separately for genes encoding exposed and nonexposed proteins of viruses classified as follows: (1) DNA viruses infecting vertebrates with no arthropod vector; (2) RNA viruses infecting vertebrates with no arthropod vector: (3) RNA viruses infecting vertebrates and spread by an arthropod vector; and (4) RNA viruses infecting plants (Figure 4). These four categories accounted for 214 (96.4%) of the datasets. Overall, there was a highly significant difference among categories (Kruskal-Wallis test; P < 0.001). On the basis of individual comparisons with a simultaneous error rate (Dunn 1964), five categories of genes showed median πN / πS significantly greater than that of exposed proteins from arthropod-borne RNA viruses: both exposed and non-exposed proteins from DNA viruses infecting vertebrates; exposed proteins from non-arthropod-borne RNA viruses; and both exposed and non-exposed proteins from RNA viruses infecting plants (Figure 4). Thus, consistent with the findings of Woelk and Holmes (2002), the results supported the hypothesis that purifying selection is relaxed on exposed proteins of RNA viruses infecting vertebrates except in the case of those with arthropod vectors.
Figure 4.
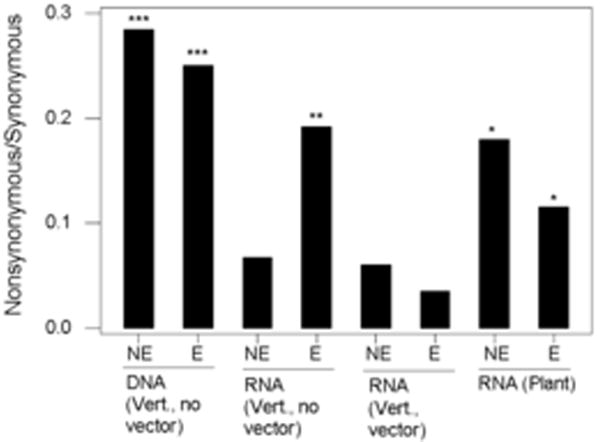
Median ratio of nonsynonymous nucleotide diversity (πN) to synonymous nucleotide diversity (πS) in virus sequence datasets classified by virus and host characteristics. Vert. = vertebrate host. NE = non-exposed protein; E = exposed protein. Kruskal-Wallis test for overall difference among medians: P < 0.001. Individual comparisons to E for RNA (Vert., vector): * P < 0.05; ** P < 0.01; *** P < 0.001. Numbers of datasets were as follows: DNA (Vert., no vector): 39 NE, 29 E; RNA (Vert., no vector): 57 NE, 34 E; RNA (Vert., vector) 9 NE, 15 E; RNA (Plant) 13 NE, 18 E.
The categorization of datasets by host and protein exposure revealed three categories with unusually low πN / πS: genes encoding non-exposed proteins of RNA viruses infecting vertebrates without arthropod vectors; and genes encoding both exposed and non-exposed proteins of vector borne RNA viruses (Figure 4). In order to test whether the unusually strong purifying selection on genes in these categories (here designated “highly conserved categories”) might be responsible for the observed differences between DNA viruses and RNA, we excluded the highly conserved categories and then compared datasets from DNA viruses infecting vertebrates with those from the remaining groups of RNA viruses (Table 3). Even excluding the highly conserved categories, median πN / πS and median Qnon were significantly greater in DNA viruses than in RNA viruses (Table 3). Thus the differences in these measures between DNA viruses and RNA viruses did not depend on the inclusion of genes from highly conserved categories.
Table 3.
Median (with range) of variables describing polymorphism in DNA and RNA virus sequence datasets excluding those in highly conserved categories.
| Variable | DNA viruses infecting vertebrates (no arthropod vector) (N = 68) | RNA viruses infecting plants and vertebrates (no arthropod vector, exposed proteins only) (N = 65) | P (Mann-Whitney test) |
|---|---|---|---|
| πS | 0.0229 (0.0016-0.4422) | 0.0695 (0.0015-0.4951) | 0.001 |
| πN | 0.0057 (0.0003-0.1122) | 0.0104 (0.0004-0.1875) | N.S. |
| πN / πS | 0.2662 (0.0316-4.3281) | 0.1705 (0.0172-2.4400) | < 0.001 |
| Qsyn | -0.0755 (-0.9814-2.9425) | -0.0171 (-1.3471-15.4082) | N.S. |
| Qnon | -0.3589 -1.0124-2.9972) | -0.5947 (-1.2838-1.8424) | 0.016 |
| GC3 (%) | 50.1 (23.3-96.5) | 44.2 (30.4-73.3) | N.S. |
When allometric regression was applied to DNA viruses infecting vertebrates without an arthropod vector, the resulting equation, πN = 0.133 πS 0.821 (R2 = 61.9%: P < 0.001), was very similar to that obtained for all DNA virus datasets (see above). The exponent differed significantly from both 1.0 (t = 2.29; 66 d.f.; P < 0.05) and from 0.5 (t = 3.86; 66 d.f.; P < 0.001). The allometric equation for RNA viruses excluding highly conserved categories was πN = 0.050 πS 0.582(R2 = 42.2%: P < 0.001). The exponent differed significantly from both 1.0 (t = 4.97; 63 d.f.; P < 0.001). Thus, whether or not datasets in the highly conserved categories were included, the results showed a nonlinear relationship between πN and πS, with the deviation from linearity significantly more pronounced in the case of RNA viruses than in the case of DNA viruses.
4. Discussion
Analysis of the pattern of nucleotide diversity in 222 independent viral sequence datasets showed the prevalence of purifying selection. Nonsynonymous nucleotide diversity (πN) exceeded synonymous nucleotide diversity (πS) in all but 11 datasets. Moreover, there was evidence of a tendency toward the occurrence of rare polymorphisms at nonsynonymous sites but not at synonymous sites, as expected nonsynonymous polymorphisms include slightly deleterious mutations subject to ongoing purifying selection. The 11 datasets with πN > πS included two genes for which positive selection is well documented: the K1 gene of human herpesvirus 8 (Hughes and Hughes 2007b) and the hemagglutinin gene of influenza virus A (Fitch et al. 1991). The other datasets with πN > πS may be considered candidates for positive selection. It would be of interest to test for biological factors that might give rise to such selection, particularly revealing in viruses that infect plants and thus are not exposed to the selective pressures arising from vertebrate specific immunity.
We tested for rare polymorphisms by computing statistics (Qsyn and Qnon) that compare the average number of nucleotide differences and the number of segregating sites (Tajima 1989) separately for synonymous and nonsynonymous sites. Overall, Qnon showed significantly more negative values than Qsyn, supporting the hypothesis that there is an excess of rare nonsynonymous polymorphisms due to ongoing purifying selection against slightly deleterious nonsynonymous variants. Tajima (1989) noted that, in a non-equilibrium situation, his D statistic may show a negative value as a result of a recent bottleneck rather than selection. However, the bottleneck effect should impact all types of polymorphism equally (Tajima 1989). The fact that our data show a significant difference between synonymous and nonsynonymous sites strongly implicates selection at the latter, even though the viral populations examined may have been subject to population bottlenecks or founder effects.
DNA viruses and RNA viruses differ in a number of important biological properties, most notably in the much higher mutation rate of the latter. In spite of the higher mutation rate of RNA viruses, our analyses revealed stronger evidence of the action of purifying selection in RNA viruses than in DNA viruses. The ratio πN / πS was significantly lower in RNA viruses than in DNA viruses, indicating that nonsynonymous mutations have been removed at a greater rate (relative to the mutation rate) in the former than in the latter. Moreover, Qnon, which measures the occurrence of rare nonsynonymous polymorphisms, revealed significantly more such polymorphisms in RNA viruses than in DNA viruses. On the contrary, Qsyn, which measures the occurrence of rare synonymous polymorphisms, did not show a significant difference between RNA viruses and DNA viruses.
Since rare nonsynonymous polymorphisms are likely to be undergoing the effects of purifying selection acting to eliminate them (Hughes 2005), the fact that a difference between RNA viruses and DNA viruses was seen in the case of nonsynonymous and polymorphisms but not in the case of synonymous polymorphisms points to selection as the factor responsible. Though population bottlenecks can cause an excess of rare polymorphisms, a bottleneck alone should impact all types of polymorphism equally (Tajima 1989). Pybus and colleagues (2007) recently reported evidence of slightly deleterious polymorphisms in RNA viruses. Our results reveal a stronger signature of purifying selection in RNA viruses than in DNA viruses, implying that purifying selection has been more effective in reducing the frequency of slightly deleterious nonsynonymous variants in RNA viruses than in DNA viruses.
Like Woelk and Holmes (2002), we found evidence of stronger purifying selection on surface proteins of DNA viruses infecting vertebrates and spread by arthropod vectors than of other DNA viruses infecting vertebrates. In the latter, there was evidence of stronger purifying selection on genes encoding proteins not exposed on the surface of virus particles than of surface proteins (including envelope glycoproteins). The relaxation of purifying selection on surface proteins of viruses infecting vertebrates doubtless reflects at least in part selection favoring escape mutants in epitopes for host neutralizing antibodies (Piontkivska and Hughes 2006). Nonetheless, even when the relatively conserved categories of RNA virus genes were excluded from the analysis, the results still showed evidence of stronger purifying selection in RNA viruses than in DNA viruses.
Across datasets from both DNA viruses and RNA viruses, we found a negatively allometric relationship between πN and πS; in other words, πN increased with increasing πS at a less than linear rate. This finding, contrary to the prediction of strict neutrality, is most easily explained by the occurrence of slightly deleterious mutations. In the comparison of closely related sequences (indicated by low πS), slightly deleterious nonsynonymous mutations are relatively abundant, leading to relatively high πN in comparison to πS. By contrast, in the comparison of more distantly related sequences, purifying selection has been able to remove or decrease in frequency many slightly deleterious mutations, leading to decrease in the magnitude of πN in comparison to πS. The finding of negative allometry in the relationship between nonsynonymous and synonymous polymorphisms is thus consistent with the “nearly neutral theory of molecular evolution” (Ohta 2002). The fact that the negative allometry was more pronounced in RNA viruses than in DNA viruses provides evidence that purifying selection is more effective in the latter than in the former.
Factors associated with more effective purifying selection in RNA viruses than in DNA viruses might include larger effective population sizes in the former than in the latter. Because of their rapid replication rates, RNA viruses can achieve very high within-host numbers, probably much higher than those of DNA viruses (Manrubia et al. 2005). Nonetheless, because severe population bottlenecks probably accompany transmission from one host to another in all viruses, across hosts RNA viruses may not necessarily have effective populations substantially larger than those of DNA viruses.
On the assumption that recombination plays a key role in eliminating slightly deleterious mutations and that most nonsynonymous mutations are slightly deleterious, it is predicted that genomes or genomic regions with low recombination rates will in general show elevated accumulation of nonsynonymous mutations. This prediction is supported by data from sex chromosomes (Berlin and Ellegren 2006; Wykoff et al. 2002), mitochondrial genomes (Nachman et al. 1994, 1996; Rand and Kann 1996) and Drosophila genomic regions with different recombination rates (Haddrill et al. 2007). There is evidence of homologous recombination in DNA viruses (Thiry et al. 2004; Wilkinson and Weller 2003) and in both positive strand (Agol 2006; Lukashev 2005; Twiddy and Holmes 2003; Worobey and Holmes 1999) and negative-strand (Hughes 2007; Kukkonen et al. 2005; Spann et al. 2003) ssRNA viruses. Nonetheless, it seems probable that, because of their compact genomes, RNA viruses have considerably higher rates of recombination per nucleotide site than those of many DNA viruses, particularly dsDNA viruses, whose genomes are much larger. Evidence in Marburg virus that purifying selection can act to decrease the frequency of nonsynonymous variants in comparison to that of very closely linked synonymous variants suggests that recombination can operate on a very fine scale in this negative-strand ssRNA virus (Hughes 2007). Thus, a higher recombination rate per nucleotide probably plays a major role in the more effective purifying selection observed in RNA viruses in comparison to DNA viruses.
In future research, computer simulations might provide further evidence regarding the hypotheses suggested by the present analyses. By realistically modeling rates of mutation and of recombination, as well as population parameters such as within-host population sizes and the effects of population bottlenecks in host-to-host transmission, such simulations might provide quantitative predictions regarding the effects of these factors on observed patterns of nucleotide diversity in different viral taxa.
Supplementary Material
Acknowledgments
This research was supported by grant GM43940 from the National Institutes of Health to A.L.H.
Abbreviations
- CTL
cytotoxic T lymphocyte
- dsDNA
double stranded DNA
- dS
number of synonymous nucleotide substitutions per synonymous site
- dN
number of nonsynonymous nucleotide substitutions per nonsynonymous site
- MHC
major histocompatibility complex
- πS
synonymous nucleotide diversity
- πN
nonsynonymous nucleotide diversity
- ssDNA
single-stranded DNA
- ssRNA
single-stranded RNA
Footnotes
Publisher's Disclaimer: This is a PDF file of an unedited manuscript that has been accepted for publication. As a service to our customers we are providing this early version of the manuscript. The manuscript will undergo copyediting, typesetting, and review of the resulting proof before it is published in its final citable form. Please note that during the production process errors may be discovered which could affect the content, and all legal disclaimers that apply to the journal pertain.
References
- Agol VI. Molecular mechanisms of poliovirus variation and evolution. Curr Top Microbiol Immunol. 2006;299:211–259. doi: 10.1007/3-540-26397-7_8. [DOI] [PubMed] [Google Scholar]
- Allen TM, et al. Tat-specific CTL select for SIV escape variants during resolution of primary viremia. Nature. 2000;407:386–390. doi: 10.1038/35030124. [DOI] [PubMed] [Google Scholar]
- Berlin S, Ellegren H. Fast accumulation of nonsynonymous mutations on the female-specific W chromosome in birds. J Mol Evol. 2006;62:66–72. doi: 10.1007/s00239-005-0067-6. [DOI] [PubMed] [Google Scholar]
- Chao L. Evolution of sex in RNA viruses. J Theor Biol. 1988;133:99–112. doi: 10.1016/s0022-5193(88)80027-4. [DOI] [PubMed] [Google Scholar]
- Chao L. Evolution of sex and the molecular clock in RNA viruses. Gene. 1997;205:301–308. doi: 10.1016/s0378-1119(97)00405-8. [DOI] [PubMed] [Google Scholar]
- Domingo E, Holland JJ. RNA virus mutations and fitness for survival. Annu Rev Microbiol. 1997;51:151–178. doi: 10.1146/annurev.micro.51.1.151. [DOI] [PubMed] [Google Scholar]
- Drake JW, Charlesworth B, Charlesworth D, Crow JF. Rates of spontaneous mutation. Genetics. 1998;148:1667–1686. doi: 10.1093/genetics/148.4.1667. [DOI] [PMC free article] [PubMed] [Google Scholar]
- Dunn OJ. Multiple comparisons using rank sums. Technometrics. 1964;6:241–252. [Google Scholar]
- Erickson AL, Kimura Y, Igarishi S, Eichelberger J, Houghton M, Sidney J, McKinney D, Sette A, Hughes AL, Walker CM. The outcome of hepatitits C virus infection is predicted by escape mutations in epitopes targeted by cytotoxic T lymphocytes. Immunity. 2001;15:883–895. doi: 10.1016/s1074-7613(01)00245-x. [DOI] [PubMed] [Google Scholar]
- Ecarmís S, Lázaro E, Manrubia SC. Population bottlenecks in quasispecies dynamics. Curr Top Microbiol Immunol. 2006;299:141–170. doi: 10.1007/3-540-26397-7_5. [DOI] [PubMed] [Google Scholar]
- Evans DT, et al. Virus-specific cytotoxic T-lymphocyte responses select for amino-acid variation in simian immunodeficiency virus Env and Nef. Nature Med. 1999;5:1270–1276. doi: 10.1038/15224. [DOI] [PubMed] [Google Scholar]
- Fitch WM, Leiter JM, Li X, Palese P. Positive Darwinian evolution in human influenza A viruses. Proc Natl Acad Sci USA. 1991;88:4270–4274. doi: 10.1073/pnas.88.10.4270. [DOI] [PMC free article] [PubMed] [Google Scholar]
- Haddrill PR, Halligan DL, Tomaras D, Charlesworth B. Reduced efficacy of selection in regions of the Drosophila genome that lack crossing over. Genome Biology 2007. 2007;8:R18. doi: 10.1186/gb-2007-8-2-r18. [DOI] [PMC free article] [PubMed] [Google Scholar]
- Hughes AL. Evidence for abundant slightly deleterious polymorphisms in bacterial populations. Genetics. 2005;169:533–538. doi: 10.1534/genetics.104.036939. [DOI] [PMC free article] [PubMed] [Google Scholar]
- Hughes AL. Micro-scale signature of purifying selection in Marburg virus genomes. Gene. 2007;392:266–272. doi: 10.1016/j.gene.2006.12.038. [DOI] [PubMed] [Google Scholar]
- Hughes AL, French JO. Homologous recombination and the pattern of nucleotide substitution in Ehrlichia ruminantium. Gene. 2007;387:31–37. doi: 10.1016/j.gene.2006.08.003. [DOI] [PubMed] [Google Scholar]
- Hughes AL, Hughes MA. Patterns of nucleotide difference in overlapping and non-overlapping reading frames of papillomavirus genomes. Virus Research. 2005;113:81–88. doi: 10.1016/j.virusres.2005.03.030. [DOI] [PubMed] [Google Scholar]
- Hughes AL, Hughes MA. Coding sequence polymorphism in avian mitochondrial genomes reflects population histories. Mol Ecol. 2007a;16:1369–1376. doi: 10.1111/j.1365-294X.2007.03242.x. [DOI] [PubMed] [Google Scholar]
- Hughes AL, Hughes MA. Nucleotide substitution at the highly polymorphic K1 locus of human herpesvirus 8 (Kaposi’s sarcoma-associated herpesvirus) Infect Genet Evol. 2007b;7:110–115. doi: 10.1016/j.meegid.2006.06.002. [DOI] [PubMed] [Google Scholar]
- Hughes AL, Packer B, Welch R, Bergen AW, Chanock SJ, Yeager M. Widespread purifying selection at polymorphic sites in human protein-coding loci. Proc Natl Acad Sci USA. 2003;100:15754–15757. doi: 10.1073/pnas.2536718100. [DOI] [PMC free article] [PubMed] [Google Scholar]
- Hughes AL, Friedman R, Glenn NL. The future of data analysis in evolutionary genomics. Curr Genomics. 2006;7:227–234. [Google Scholar]
- Hughes AL, Hughes MA, Friedman R. Variable intensity of purifying selection on cytotoxic T-lymphocyte epitopes in hepatitis C virus. Virus Research. 2007;123:147–153. doi: 10.1016/j.virusres.2006.08.012. [DOI] [PubMed] [Google Scholar]
- Jerzak G, Bernard KA, Kramer LD, Ebel GD. Genetic variation in West Nile virus from naturally infected mosquitos and birds suggests quasispecies structure and strong purifying selection. J Gen Virol. 2005;86:2175–2183. doi: 10.1099/vir.0.81015-0. [DOI] [PMC free article] [PubMed] [Google Scholar]
- Kimura M. Preponderance of synonymous changes as evidence for the neutral theory of molecular evolution. Nature. 1977;267:275–276. doi: 10.1038/267275a0. [DOI] [PubMed] [Google Scholar]
- Klein J, Hořejši V. Immunology. 2. Blackwell; London: 1997. [Google Scholar]
- Kukkonen SK, Vaheri A, Plyusnin A. L protein, the RNA-dependent RNA polymerase of hantaviruses. Arch Virol. 2005;150:533–556. doi: 10.1007/s00705-004-0414-8. [DOI] [PubMed] [Google Scholar]
- Li W-H. Unbiased estimates of the rates of synonymous and nonsynonymous substitution. J Mol Evol. 1993;36:96–99. doi: 10.1007/BF02407308. [DOI] [PubMed] [Google Scholar]
- Lukashev AN. Role of recombination in evolution of enteroviruses. Rev Med Virol. 2005;15:157–167. doi: 10.1002/rmv.457. [DOI] [PubMed] [Google Scholar]
- Manrubia SC, Ecarmís S, Domingo E, Lázaro E. High mutation rates, bottlenecks, and robustness of RNA viral quasispecies. Gene. 2005;347:273–282. doi: 10.1016/j.gene.2004.12.033. [DOI] [PubMed] [Google Scholar]
- Moore CB, John M, James IR, Christiansen FT, Witt CS, Mallal SA. Evidence of HIV-1 adaptation to HLA-restricted immune responses at a population level. Science. 2002;296:1439–1443. doi: 10.1126/science.1069660. [DOI] [PubMed] [Google Scholar]
- Nachman MW, Boyer SN, Aquadro CF. Nonneutral evolution at the mitochondrial NADH dehydrogenase subunit 3 gene in mice. Proc Natl Acad Sci USA. 1994;91:6364–6368. doi: 10.1073/pnas.91.14.6364. [DOI] [PMC free article] [PubMed] [Google Scholar]
- Nachman MW, Brown WM, Stoneking M, Aquadro CF. Nonneutral mitochondrial DNA variation in humans and chimpanzees. Genetics. 1996;142:953–963. doi: 10.1093/genetics/142.3.953. [DOI] [PMC free article] [PubMed] [Google Scholar]
- Nei M. Genetic polymorphism and the role of mutation in evolution. In: Nei M, Koehn RK, editors. Evolution of Genes and Proteins. Sinauer; Sunderland MA: 1983. pp. 165–190. [Google Scholar]
- Nei M, Gojobori T. Simple methods for estimating the numbers of synonymous and nonsynonymous nucleotide substitutions. Mol Biol Evol. 1986;3:418–426. doi: 10.1093/oxfordjournals.molbev.a040410. [DOI] [PubMed] [Google Scholar]
- Nei M, Kumar S. Molecular Evolution and Phylogenetics. Oxford University Press; New York: 2000. [Google Scholar]
- O’Connor DH, et al. A dominant role for CD8+-T-lymphocyte selection in Simian Immunodeficiency Virus sequence variation. J Virol. 2004;78:14012–14022. doi: 10.1128/JVI.78.24.14012-14022.2004. [DOI] [PMC free article] [PubMed] [Google Scholar]
- Ohta T. Near-neutrality in evolution of genes and gene regulation. Proc Natl Acad Sci USA. 2002;99:16134–16137. doi: 10.1073/pnas.252626899. [DOI] [PMC free article] [PubMed] [Google Scholar]
- Piontkivska H, Hughes AL. Patterns of sequence evolution at epitopes for host antibodies and cytotoxic T-lymphocytes in human immunodeficiency virus type 1. Virus Research. 2006;116:98–105. doi: 10.1016/j.virusres.2005.09.001. [DOI] [PubMed] [Google Scholar]
- Pybus OG, Rambaut A, Belshaw R, Freckleton RP, Drummond AJ, Holmes EC. Phylogenetic evidence for deleterious mutation load in RNA viruses and its contribution to viral evolution. Mol Biol Evol. 2007;24:845–852. doi: 10.1093/molbev/msm001. [DOI] [PubMed] [Google Scholar]
- Rand DM, Kann LM. Excess amino acid polymorphism in mitochondrial DNA: contrasts among genes from Drosophila, mice, and humans. Mol Biol Evol. 1996;13:735–748. doi: 10.1093/oxfordjournals.molbev.a025634. [DOI] [PubMed] [Google Scholar]
- Reanney DC. The evolution of RNA viruses. Annu Rev Microbiol. 1982;36:47–73. doi: 10.1146/annurev.mi.36.100182.000403. [DOI] [PubMed] [Google Scholar]
- Saitou N, Nei M. Polymorphism and evolution of influenza A virus genes. Mol Biol Evol. 1986;3:57–74. doi: 10.1093/oxfordjournals.molbev.a040381. [DOI] [PubMed] [Google Scholar]
- Schaeffer SW. Molecular population genetics of sequence length diversity in the Adh region of Drosophila pseudoobscura. Genet Res. 2002;80:163–175. doi: 10.1017/s0016672302005955. [DOI] [PubMed] [Google Scholar]
- Sokal RR, Rohlf FJ. In: Biometry. 2. Freeman WH, editor. San Francisco: 1981. [Google Scholar]
- Spann KM, Collins PL, Teng MN. Genetic recombination during coinfection of two mutants of human respiratory syncytial virus. J Virol. 2003;77:11201–11211. doi: 10.1128/JVI.77.20.11201-11211.2003. [DOI] [PMC free article] [PubMed] [Google Scholar]
- Suzuki Y. Natural selection on the influenza virus genome. Mol Biol Evol. 2006;23:1902–1911. doi: 10.1093/molbev/msl050. [DOI] [PubMed] [Google Scholar]
- Suzuki Y, Gojobori T. The origin and evolution of Ebola and Marburg viruses. Mol Biol Evol. 1997;14:800–806. doi: 10.1093/oxfordjournals.molbev.a025820. [DOI] [PubMed] [Google Scholar]
- Tajima F. Statistical methods to test for nucleotide mutation hypothesis by DNA polymorphism. Genetics. 1989;123:585–595. doi: 10.1093/genetics/123.3.585. [DOI] [PMC free article] [PubMed] [Google Scholar]
- Thiry E, Meurens F, Muylkens B, McVoy M, Gogev S, Thiry J, Vanderplasschen A, Epstein A, Keil G, Schynts F. Recombination in alphaherpesviruses. Rev Med Virol. 2006;15:89–103. doi: 10.1002/rmv.451. [DOI] [PubMed] [Google Scholar]
- Thompson JD, Gibson TJ, Plewniak F, Jeanmougin F, Higgins DG. The CLUSTAL_X windows interface: flexible strategies for multiple sequence alignment aided by quality analysis tools. Nucleic Acids Res. 1997;25:4876–4882. doi: 10.1093/nar/25.24.4876. [DOI] [PMC free article] [PubMed] [Google Scholar]
- Twiddy SS, Holmes EC. The extent of homologous recombination in members of the genus Flavivirus. J Gen Virol. 2003;84:429–440. doi: 10.1099/vir.0.18660-0. [DOI] [PubMed] [Google Scholar]
- Van Regenmortel MH, Fauquet CM, Bishop DH, Carstens EB, Estes MK, Lemon SM, Maniloff J, Mayo MA, McGeoch DJ, Pringle CR, Wickner RB, editors. Virus Taxonomy. Academic Press; San Diego: 2000. [Google Scholar]
- Weiner A, Erickson AL, Kansopon J, Crawford K, Muchmore E, Hughes AL, Houghton M, Walker CM. Persistent hepatitis C virus infection in a chimpanzee is associated with emergence of a cytotoxic T lymphocyte escape variant. Proc Natl Acad Sci USA. 1995;92:2755–2759. doi: 10.1073/pnas.92.7.2755. [DOI] [PMC free article] [PubMed] [Google Scholar]
- Wilkinson DE, Weller SK. The role of DNA recombination in herpes simplex virus DNA replication. IUBMB Life. 2003;55:451–458. doi: 10.1080/15216540310001612237. [DOI] [PubMed] [Google Scholar]
- Woelk CH, Holmes EC. Reduced positive selection in vector-borne RNA viruses. Mol Biol Evol. 2002;19:2333–2336. doi: 10.1093/oxfordjournals.molbev.a004059. [DOI] [PubMed] [Google Scholar]
- Worobey M, Holmes EC. Evolutionary aspects of recombination in RNA viruses. J Gen Virol. 1999;80:2535–2543. doi: 10.1099/0022-1317-80-10-2535. [DOI] [PubMed] [Google Scholar]
- Wyckoff GJ, Joyce L, Wu C-I. Molecular evolution of functional genes on the mammalian Y chromosome. Mol Biol Evol. 2002;19:1633–1636. doi: 10.1093/oxfordjournals.molbev.a004226. [DOI] [PubMed] [Google Scholar]
- Yang Z, Nielsen R. Estimating synonymous and nonsynonymous substitution rates under realistic evolutionary models. Mol Biol Evol. 2000;17:32–43. doi: 10.1093/oxfordjournals.molbev.a026236. [DOI] [PubMed] [Google Scholar]
- Yang W, Bielawski JP, Yang Z. Widespread adaptive evolution in the human immunodeficiency virus type 1 genome. J Mol Evol. 2003;57:212–217. doi: 10.1007/s00239-003-2467-9. [DOI] [PubMed] [Google Scholar]
Associated Data
This section collects any data citations, data availability statements, or supplementary materials included in this article.