

Abstract
The dynamics of cellular organelles reveals important information about their functioning. The spatio-temporal movement patterns of vesicles in growing pollen tubes are controlled by the actin cytoskeleton. Vesicle flow is crucial for morphogenesis in these cells as it ensures targeted delivery of cell wall polysaccharides. Remarkably, the target region does not contain much filamentous actin. We model the vesicular trafficking in this area using as boundary conditions the expanding cell wall and the actin array forming the apical actin fringe. The shape of the fringe was obtained by imposing a steady state and constant polymerization rate of the actin filaments. Letting vesicle flux into and out of the apical region be determined by the orientation of the actin microfilaments and by exocytosis was sufficient to generate a flux that corresponds in magnitude and orientation to that observed experimentally. This model explains how the cytoplasmic streaming pattern in the apical region of the pollen tube can be generated without the presence of actin microfilaments.
Introduction
Cells are highly compartmentalized structures and specific cellular activities are spatially confined to certain types of organelles. The dynamics of cellular organelles reveal important information about their functions and mutual interactions. One important role of organelle movement is the transport and delivery of material from the site of synthesis to the site of usance or release. This type of targeted long distance transport is often carried out by vesicles, which are small, membrane-bound organelles. Their small size, typically between 50 and 150 nm, makes the quantification of their movements a challenge for optical microscopy, especially when they are densely packed. However, the combination of high temporal resolution confocal microscopy and spatio-temporal image correlation spectroscopy has recently demonstrated that the movement patterns of densely packed vesicles can be quantified in space and time (1).
An example for dense and extremely dynamic vesicle trafficking occurs in rapidly growing plant cells. Expansion of cellular surface in walled cells necessitates the delivery of cell wall material and membrane to the site of expansion. Much of the required material is delivered in the form of secretory vesicles whose motion requires spatial and temporal coordination to ensure targeted discharge at the location of growth (1–4). In general, organelle transport is mediated by the cytoskeleton, and motor proteins linking the organelles with the cytoskeletal elements provide the propelling force. In plant cells, vesicle transport is mainly actin-myosin driven.
Vesicle trafficking in growing plant cells
Among the fastest growing plant cells is the pollen tube, a cellular protuberance formed by a pollen grain upon contact with a receptive stigma. The function of the pollen is to transport the male gametes from the anther of the donor flower to the female gametes located in the ovule of the receptor flower. Similar to other cells with an invasive lifestyle such as fungal hyphae, root hairs, and neuronal growth cones (5–8), pollen tubes display tip growth. In this type of growth, all growth activity is confined to a very small area on the cellular surface, the apex (9). Continuous addition of cell wall material and turgor-driven expansion of the existing cell wall at the apex result in the formation of a rapidly elongating, cylindrical tube. Because of the rapid growth rate and the spatial confinement of growth activity, vesicle trafficking in these cells is extremely dense and dynamic, thus making them a very suitable system for the study of vesicle transport.
Mechanics of pollen tube growth
From a mechanical point of view, pollen tube growth is defined by two simultaneously occurring processes—the continuous addition of cell wall material, and the mechanical deformation of the existing viscoplastic cell wall, driven by the hydrostatic turgor pressure. The spatial confinement of the growth activity to the apex is reflected in a polar distribution of the cytoplasmic contents (Fig. 1). The apical region, i.e., the growing region of the cell, beginning with the hemispherical tip of the tube and reaching to a distance of approximately one tube radius behind the tip, is almost exclusively filled with vesicles. The absence of bigger organelles gives it a clear appearance in the optical microscope (Fig. 1 A), as compared to the granular shank of the cell that is densely packed with various types of organelles such as mitochondria, plastids, Golgi stacks, and endoplasmic reticulum. Labeling the vesicles with the lipophilic styryl dyes FM 4-64 or FM 1-43 has revealed that in angiosperm pollen tubes, the space they occupy in the apical region has the shape of an inverted cone filling the extreme apex and pointing toward the rear of the cell (Fig. 1, E and F (1,10,11)). This cone-shaped apical region is also relatively free of prominent filamentous actin cables, whereas the cylindrical distal portion of the cell is filled by longitudinally arranged actin arrays (Fig. 1, B and C (12)).
Figure 1.
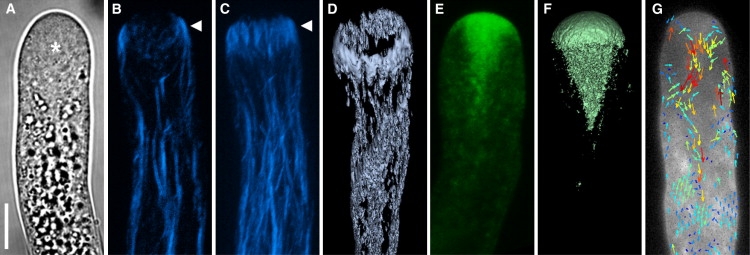
Cytoarchitecture of the apical region of Lilium longiflorum pollen tubes. (A) Brightfield micrograph revealing the difference between the smooth appearance of the apical cytoplasm (asterisk) and the granular texture of the shank. (B–D) Filamentous actin forming the apical fringe (arrowhead) revealed by label with rhodamine phalloidin. (B) Single optical section. (C) Projection of z-stack of the same tube as in panel B. (D) Surface rendering of three-dimensional z-stack reconstruction, tilted slightly to reveal spatial configuration of the apical actin fringe. (E–G) Vesicles visualized by label with FM1-43. (E) Single optical section. (F) Surface rendering of three-dimensional z-stack reconstruction revealing spatial configuration of the inverted vesicle cone. (G) Vector map of vesicle flux resulting from STICS analysis of a time series of confocal laser scanning micrographs. Panel G, details of the experiment and STICS analysis, were first published by Bove et al. (1) (reprinted with permission; copyright American Society of Plant Biologists). Fluorescence micrographs are false-colored. The images in this panel do not show the same tube. Bar = 10 μm. Pollen culture, fluorescent label, and image acquisition for all figures are detailed in the Supporting Material.
In the transition zone between the two regions, or the subapex, these arrays become finer and form a fringelike configuration at the shoulder region of the apical dome (Fig. 1 D, and Figs. 2 and 3). This fringe is always in close proximity to the continuously advancing apex of the cell. The position of this fringe is believed to be controlled by signaling cascades involving the subapical cytoplasmic alkaline band and the cytosolic Ca2+ gradient present in the tube apex. Both regulate the rate of assembly of G-actin into F-actin mediated by Ca2+ and pH activated proteins. These ion gradients thus limit the polymerization and bundling of the actin-cytoskeleton in a space-dependent manner (13–18). Although generally the term “actin fringe” in pollen tubes denotes only the ring-shaped arrangement of actin filaments in the subapical cortex of the cell (12,19), for the purpose of our model here, we define it as the complete actin array bordering the inverted vesicle cone (marked in gray in Fig. 3). The role of the fringe in the control of cytoplasmic streaming, vesicle delivery, and actin polymerization is the subject of this article. It should be noted that “cytoplasmic streaming” is a term used in the biology community to designate the intracellular movements of organelles, which in the optical microscope resemble a streaming process. In reality, this process is the sum of individually controlled movements of organelles through the cytoplasmic space. Most of these movements occur along cytoskeletal arrays. The cytosol, the liquid surrounding the organelles, is not the cause for the organelle movements, but it is likely to be dragged along passively. We discuss below the role of the surrounding liquid.
Figure 2.
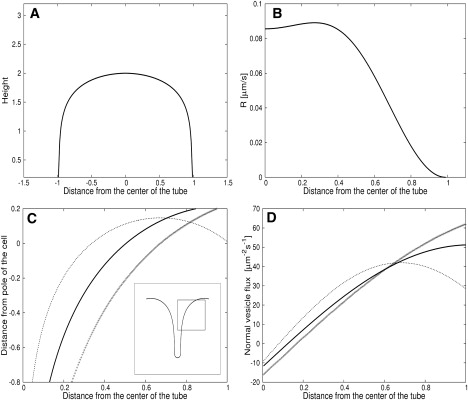
Geometry of the apical cone and vesicle delivery and absorption rates at its boundaries. (A) Shape of the apical cell wall during steady viscoplastic orthogonal growth. (B) Cell wall vesicle deposition rate necessary to sustain the steady viscoplastic growth. The details of their calculation are found in the Supporting Material. (C) Right-hand side of the actin profile given by Eq. 10. (Solid line) (m, b) = (−π/L, −π/2). (Dotted line) (m, b) = (−3π/2, −π/2). (Crosses) (m, b = − 5π/6L, − 4π/6). The inset shows two symmetric halves of the actin fringe profile. The half-circle at the tail end of the profile is due to capillary effects (Supporting Material). (D) Vesicle flux normal to the actin fringe given by Eq. 11. (Solid line) (m, b) = (−π/L, −π/2). (Dotted line) (m, b) = (−3π/2, −π/2). (Crosses) (m, b = −5π/6L, −4π/6). In all cases, λ = 1. The units of the x- and y axis are multiples of the pollen tube radius.
Figure 3.
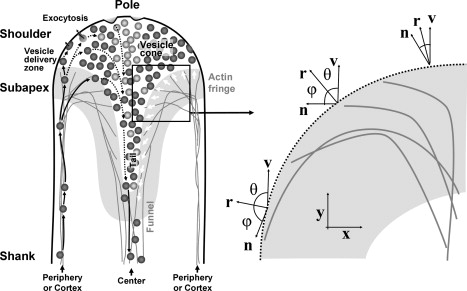
(Left) Schematic drawing illustrating the principal directions of vesicle motion (left half of the tube) and orientation of the actin filaments bordering the vesicle cone (open arrows in right half) in the apical region of a pollen tube. After delivery into the apical region on the actin filaments forming the fringe, vesicles are released into the apical cytoplasm in an annulus-shaped zone (vesicle delivery zone). Vesicles that succeed in contacting the plasma membrane undergo exocytosis. Vesicles that do not succeed in contacting the plasma membrane stream rearwards within the cone-shaped vesicle pool. Many of these vesicles are recirculated back into the forward stream immediately in the subapical region (not shown). Solid arrows indicate actin-myosin-guided vesicle movement, dashed arrows indicate movements that are presumably governed by diffusion. Objects are not drawn to scale. For clarity, except for vesicles, no other organelle or the cell wall is drawn. This figure is based on results by Bove et al. (1) and Zonia and Munnik (54). (Right) Orientation of the vectors along the actin fringe profile. The values r, n, and v are the vector normal to the profile, the microfilament orientation vector, and the growth vector of the cytoskeleton, respectively. The profile of the actin fringe is such that the angle ϕ between the normal vector and the actin microfilament orientation is equal to the angle θ between the normal vector and the growth direction, the y axis. Once the orientation vector n is fixed, the shape of the fringe profile can be determined.
Time-lapse imaging has revealed that in the shank of the pollen tube, the spatial pattern of organelle motions results in a bidirectional movement along parallel bundles of F-actin. Forward movement occurs in the periphery of the tube and rearward flow occurs in the center of the shank (19,20). Bigger organelles that can easily be observed in the optical microscope were found to reverse their movement direction at a certain distance from the growing tip to enter the rearward flow, thus generating a reverse-fountain pattern (21). This flow pattern also applies to the relatively smaller vesicles, with the exception that they actually enter the cytoplasmic region closest to the tip before flowing rearward (Fig. 1 G (1,2)).
High temporal resolution confocal microscopy of living pollen tubes revealed that in the shank of the tube, vesicles display rapid, long-distance movements that are clearly guided by the longitudinally oriented actin filaments. In contrast, in the apical clear zone of the tube, the vesicles show more erratic, random motion. Spatio-temporal image correlation spectroscopy revealed that in the apex, the average velocities of the vesicles vary over small distances (1).
Both the absence of prominent actin cables and the erratic character of vesicle dynamics in the tip suggest that vesicle movement is not propelled or guided by an actin-myosin mechanism in this region. Our objective was to model the dynamics of both the actin cytoskeleton and the vesicle movement, to help us better understand their combined role for pollen tube growth. To have predictive value, such a theoretical model needs to be able to reproduce the characteristic distribution of vesicles in the apical region as well as the experimentally observed relative movement rates and spatial patterns. One of the principal goals was to demonstrate that although vesicle delivery toward the apical region is mediated by an actin-myosin mechanism, movement through the cone region does not require active transport or cytoskeletal guidance.
Actin polymerization
It is unknown where in the pollen tube and by which mechanism actin polymerization takes place. However, to be able to advance together with the elongating pollen tube tip, it is safe to presume that the apical actin arrays need to polymerize continuously. Inhibitor studies have shown that actin polymerization activity in the pollen tube is more sensitive than, and thus independent from, the capacity of actin to guide organelle movement (22).
In angiosperm pollen tubes, actin filaments are oriented with their barbed (plus) ends pointing toward the apex in the cortical cytoplasm and away from the tip in the center of the cell (23). This explains how organelle transport can occur in opposite directions in these two regions as myosin-driven transport occurs mainly toward the plus-end of actin filaments (21,24–27). However, although this configuration of the actin array is consistent with enhanced polymerization activity toward the apex in the cytoplasm, it is not quite clear how the central actin arrays keep up with the advancing tip.
Both fluorescence micrographs and transmission electron images (23) suggest, however, that the orientation of individual actin filaments in the subapical region is not necessarily parallel to the longitudinal axis of the cell and that microfilaments can even form curved shapes in this region. This change of orientation along the radial axis is crucial to explain both actin microfilament growth through polymerization of G-actin monomers and direction of the vesicle flux toward the apical vesicle cone. Actin polymerization and vesicle motion are therefore closely related, since both have to satisfy the constraints set by the polarity of the actin microfilaments.
From a physical point of view, one can therefore ask how the polymerization of the G-actin monomers, i.e., a diffusion problem with sink and source terms at the boundary, creates the observed funnel shape of the fringe. Although not having the exact same symmetry, this funnel shape has certain similarities with the finger shape created by dendritic crystal growth in a channel (28,29). The two problems have many common origins, since dendritic crystal growth is essentially the diffusion process of a solute in a channel which, by preventing the solute from escaping from the setup, plays a role analogous to the cell wall in the pollen tube. Here we exploit this analogy and adopt a strategy for modeling that is similar to that used in the past for dendritic crystal growth.
Objectives and outline
Our objectives are to demonstrate that
-
1.
The spatial and temporal patterns of vesicle motion in the apical region of the pollen tube can be explained without cytoskeletal guidance in the clear zone, and
-
2.
The constant shape of the apical actin fringe can be explained by its continuous advancement and the varying orientation of its polymerizing ends.
We establish a theoretical model that helps us in understanding how the apical actin fringe advances through actin polymerization while at the same time delivering and removing vesicles to and from the apical cone, thus controlling the movements of these organelles through the apical cytoplasmic space. We adopt the following strategy: First, we obtain the geometry of the cell wall forming the expanding apex using a viscoplastic model of a steadily growing tube (based on the model for root hair growth in (30)). The details of the calculation are found in the Supporting Material. Then, we model the aggregation of actin filaments to obtain their orientation at the border of the apical cytoplasmic space. We use this orientation, and a steady-state assumption, to model the protrusion of the actin fringe array in two dimensions from which we deduce the geometry for the inverted apical cone (see Profile of the Actin Fringe, below, and the Supporting Material). Finally, we model the vesicle flux based on the assumption that the organelles diffuse freely in the inverted apical cone. The addition and removal of vesicles via actin-mediated transport and the removal by fusion with the apical plasma membrane (exocytosis) are taken into account by imposing suitable boundary conditions (see Vesicle Diffusion and Cytoplasmic Streaming).
See Table 1 for explanation of variables used in this article.
Table 1.
Explanation and typical value of different variables used in the model
| Parameter | Symbol | Value | Source | |
|---|---|---|---|---|
| Vesicle flux | j | |||
| Average vesicle density | 〈V3D〉 | 62 μm−3 | ∗ | |
| Actin monomer concentration | G | 10–50 μM | (58,59) | |
| Diffusion constant | D | 0.1–103μm2/s | (60,61) | |
| Unit vector normal to the actin fringe | r | |||
| Average net vesicle deposition rate | R | 0.00041 μm/s | ∗ | |
| Unit vector of actin microfilament polarity | n | |||
| Angle between the actin polarity and the x axis | Θ(x) | |||
| Angle between the r and the tube growth direction | θ | |||
| Angle between n and r | ϕ | |||
| Stress in the cell wall | σ | 25 MPa | (6) | |
| Strain rate in the cell wall | 0–0.1 min−1 | (6) | ||
| Maximum growth rate of a single microfilament | vMF | 0.25 μm/s | (62) | |
| Vesicle delivery rate | vve | 0.45 μm/s | (1) | |
| Length of microfilament per added monomer | ν | 2.2 nm | (32) | |
| Steady growth rate, in the y direction, of the cytoskeleton | vp | 0.1–0.4 μm/s | (63) | |
| Profile of the actin fringe | y(x) |
Values calculated in this article.
Theory
Profile of the actin fringe
In this section, we present a calculation of the shape of the actin fringe, based on the assumption that it maintains a steady profile while advancing in the y direction and that it satisfies the constraints of the tread-milling model (31,32) for microfilament polymerization. Furthermore, we assume that the fringe advances forward at a steady rate equal to the pollen tube growth rate. We begin by using a model for the actin filament aggregation (33–38) to calculate the polarity, or orientation Θ(x), of the microfilaments (MF) along the actin front, in the fringe (23). For this purpose, we fix our coordinate system such that the tube grows in the positive y-direction. As detailed in the Supporting Material, we obtain the following filament angle Θ(x) between the barbed (plus) ends of the filaments and the x axis
| (1) |
As an initial condition for the actin filament aggregation model, we set the filaments with plus-ends pointing toward the apex at the periphery of the tube and with plus-ends pointing away from the apex in the center of the tube. These orientations are consistent with the orientations measured in the center and the periphery of angiosperm pollen tubes (23). We can now use this variable orientation of the filaments along the actin front to understand the variable protrusion rate of this front and how it forms a stable V-shape. The elongation rate, or polymerization rate, vMF of a single actin microfilament, according to the treadmilling model (32), is given by
| (2) |
and depends on the local G-actin concentration G, the length per monomer v and the net rates kon and koff at which actin monomers polymerize at the barbed end of the actin microfilament. There are other proteins and factors such as branching, capping, and uncapping, that contribute to the polymerization of individual actin filaments and actin fronts pushing a membrane (31,32). In the absence of experimental quantification of the spatial distribution of such agents in the pollen tube, we neglect those factors and focus on the effect of the orientation change along the actin front observed in pollen tubes (23). Actin monomers are added along the orientation of the microfilament, described by the vector n. Consequently, the profile of the actin network will protrude at a rate
| (3) |
in a direction along r, that is normal to the profile (Fig. 3). The multiplicative factor n·r ensures that the normal growth rate is maximal when the microfilaments are at a right angle to the actin profile and point out of the network. The profile stays in place when the microfilaments are parallel to the profile and retracts when the microfilaments are at a right angle to the profile but point with barbed ends into the network. Here r is a unit vector normal to the profile and n is a unit vector giving the average orientation of the actin microfilaments. The dependence of the protrusion rate of an actin front on the filament orientation has been observed in lamellipodia (39). As discussed in the Supporting Material, we assume that the microfilament orientation along the x axis in the network is given by Eq. 1.
We will use this model to derive a profile y(x) for the actin network advancing at a steady rate equal to the growth rate of the pollen tube. Using the relation
for the vector describing the orientation of the microfilaments and
| (4) |
we obtain
| (5) |
We will now use the assumption that the cytoskeleton profile advances at a constant rate vp in the y direction. This constant growth or advancement rate in the y direction can be related to the protrusion rate dr/dt in the direction normal to the profile. Using the angle θ between the normal vector r and the y direction, one obtains
| (6) |
This expression has been used for the calculation of the steady growth profile in the case of diffusion-limited dendritic crystal growth and fluid finger propagation (28,29). Equating the left-hand side of Eq. 6 to the right-hand side of Eq. 3 gives
| (7) |
This relation has been obtained by expressing the right-hand side of Eq. 3 as vMF|n‖r| cos ϕ, where ϕ is the angle between the normal vector and the actin microfilament orientation. Since both n and r have unit length, we can interpret the equation as follows: the profile of the actin fringe must be such that the angle ϕ between the normal vector and the actin microfilament orientation is equal to the angle θ between the normal vector and the y axis, the direction of the overall actin cytoskeleton growth. This condition is illustrated in Fig. 3. It is important to note that for these regions of low profile curvature we neglect any surface tension between the cytoplasm and the actin network. Using cos θ = ry = (1 + y′2)−1/2, we can express Eq. 7 in terms of y′ and Θ(x):
| (8) |
We obtain an ordinary differential equation for the profile of the actin fringe
| (9) |
which has the solution
| (10) |
Here λ = vp/vMF and m is the slope in the expression Θ(x) = mx + b. The profile velocity vp and the maximum filament growth rate vMF must be similar such that vp/vMF ≃ 1. The approximation of λ being constant on the fringe is based on the assumption that the concentration G of G-actin monomers, and thus vMF, is a constant. The profile of the actin fringe for different values of m, b in the function Θ(x) is shown in Fig. 2 C. By adding the left-hand side and separating the two halves of the profile by a distance corresponding to one-fifth of the cell radius, we obtain an actin fringe that recovers the funnel shape with “shoulders” observed experimentally. Once the profile on the actin fringe is found, the vesicle flux at the fringe is obtained by evaluating Eq. 14 with Eqs. 7 and 8:
| (11) |
For various values of m and b, this flux is shown in Fig. 2 D.
Vesicle diffusion and cytoplasmic streaming
In the pollen tube shank, the vesicles are pulled along actin filaments by motor proteins (40,41) and the cytosol is dragged along by this active movement of suspended particles. However, in the apical inverted cone, there is not much filamentous actin that could serve to guide actin-myosin driven vesicle movement. And although the vesicles clearly display Brownian dynamics in this region (42–44), it is unknown whether the cytosol, the fluid surrounding the vesicles, is moving in the actin-free zone. Technical limitations have precluded quantitative measurements of individual vesicle dynamics in the densely packed apex hitherto.
Therefore, we resort to the calculation of various dimensionless numbers to determine whether bulk fluid movement or diffusion dominates the motion of vesicles in the apex. The Reynolds number is the ratio of inertial to viscous forces. For a mass density ρ = 103 kg/m3, a tube radius r = 6.5 μm, a velocity v = 0.45 μm/s, and a dynamic viscosity η = 10−3 kg/m/s (45), the Reynolds number is Re = ρvr/η = 2.9 × 10⁻⁶. Accordingly, inertial (convective) forces are negligible (40,45–47), such that viscous (advection due to the surrounding fluid) and diffusive (vesicle collisions) forces determine the motion of vesicles. This regime is called Stokes flow, and in this regime the movement of the cytosol (i.e., the solvent) is described by the Stokes equation ∇p = η∇2v (46). The question remains whether the movement of the bulk fluid cytosol or the collision of vesicles dominates vesicle movement. The Peclet number Pe = vrv/D, where rv is the vesicle radius and D is the diffusion constant, gives us the ratio of the adjective (due to the surrounding fluid) to diffusive forces. The vesicle diffusion constant can be estimated from the evolution of the vesicle staining density-density correlation function (1). A broadening of the correlation function of 0.5 μm occurred in 0.1 s, which is consistent with a translational diffusion coefficient of DT = 〈r2/4Δt〉 = 0.625 μm2/s (46). For a vesicle radius rv = 0.075 μm, the Peclet number is Pe = 0.054. Based on this number, we neglect the motion of the surrounding fluid and assume that the motion of vesicles in the apex is dominated by collision between vesicles (Brownian dynamics or diffusion). A mathematical analysis of the velocity field in the surrounding cytosol would require information on the pressure and stresses in the cytosol but also the proper treatment of the boundary conditions formed by the outer surfaces of the individual vesicles (in addition to the cell wall and the actin fringe) (46). This difficult problem has been addressed with the boundary integral approach (48,49) and the boundary element method (50), but its solution is beyond the scope of this article.
In our model, the vesicle flux is constrained by the following sources and sinks:
-
1.
There is continuous flow of vesicles in the direction of the plus-ends of actin filaments in the polymer network modeled previously, resulting essentially in an addition of vesicles in the periphery and a removal in the center.
-
2.
A certain number of vesicles is absorbed by the fusion process (exocytosis) at the plasma membrane located in an annular region around the very tip of the tube.
We model the vesicle flow using Fick's law j = −D∇V on the domain bounded above by the cell wall calculated in the Supporting Material and below by the fringe calculated in the previous section. The average vesicle flow velocity v can be related to the flux j = Vv, where V is the local vesicle density. Furthermore, the requirement of vesicle number conservation (continuity equation) leads to the diffusion equation, Eq. 12. This description is justified by the observation that organelles in pollen tubes display Brownian motion (42–44). The change in vesicle density V(x, y) is given by the diffusion equation
| (12) |
in the clear zone of the apex. To solve this equation, the boundary conditions must be specified on the cell wall and the fringe. The flux of vesicles normal to the cell wall r·j = r· (−D∇V) is given by the absorption of vesicle due to the fusion process
| (13) |
where Vol denotes the volume of one vesicle and the net deposition rate R is calculated in the Supporting Material (Fig. 2 B). We can estimate the average vesicle flux normal to the cell wall due to fusion at 〈jR〉 = 0.156 s−1 μm−2 from Vol = 0.0026 μm3 and R = 0.0244 μm/min. The net flux of vesicles normal to the actin fringe is generated by the addition of vesicles to the clear zone (inverted cone) from actin filaments with barbed ends oriented toward the tip and by vesicle recovery onto centrally located filaments that are oriented with the barbed ends pointing rearward:
| (14) |
The quantity vve denotes the maximum rate at which vesicles are delivered into the apical cytoplasm. We can estimate the normal vesicle flux at the actin fringe (in the tube center) by . Here 〈V3D〉 = 62.0 μm−3 is the average three-dimensional vesicle density in the apical cone (1). Comparing the numbers reveals a difference of two orders of magnitude between the vesicle flux at the plasma membrane and that normal to the actin fringe. This difference explains why the vesicle flow pattern predicted by our model is largely controlled by the orientation of actin filaments. Since the orientation of the microfilaments also controls the normal protrusion rate of the actin cytoskeleton, the right-hand side of Eq. 14 is proportional to the protrusion rate of the actin cytoskeleton described by Eq. 3 (Fig. 2 D). The constant term a represents myosin-mediated vesicle binding onto a microfilament that is oriented parallel to the fringe profile. The constant a is adjusted in such a way that the total number of vesicles entering the clear zone equals the total number of vesicles leaving the clear zone, i.e., the net flux is zero.
Results
A steady growth analysis (30) was used to calculate the shape of the apical cell wall during its viscoplastic expansion. The resulting cell wall shape, that minimizes the mechanical stress induced by the turgor pressure, is shown in Fig. 2 A. The material necessary for the steady elongation of the cell wall is supplied by vesicles. The cell wall thus constitutes a target (i.e., a sink) for these organelles (Fig. 2 B).
The orientation of the barbed (plus) ends of the actin microfilaments varies continuously along the radial axis to adopt the observed configuration (23), which minimizes the mechanical stress in the actin polymer network (51). Once the steady shape of the advancing actin fringe is assumed, its profile is a direct consequence of the orientation of the actin microfilaments (Fig. 2 C). This constraint is illustrated in Fig. 3. The orientation of the microfilaments also determines the direction in which the vesicles are delivered to or removed from the apical cone and the magnitude of their velocity (Fig. 2 D). Addition (positive values in Fig. 2 D) occurs in the periphery of the cell, removal (negative values) in the center. The fringe thus constitutes a source and sink for the vesicles. The motion of the vesicles in the apical cone is modeled with the diffusion equation together with the boundary conditions described above, which are solved with MatLab (The MathWorks, Natick, MA). After an integration time of 10 s, the vesicle density reaches a steady state shown in Fig. 4, A and C. The average density from the simulations is rescaled to 209 μm−2. This average vesicle density is obtained by dividing the number of vesicles present in a typical lily pollen tube apex (average of 81,247 vesicles (1)) by the area of the clear zone (389 μm2). In the biological sample, this average density corresponds to the density visible on a projection of a z-stack image series. Our model indicates a clear density gradient from the front of the cell to the tail of the vesicle cone. This spatial profile of vesicle density is consistent with observations in the fluorescence microscope (1,11) and the transmission electron microscope (4).
Figure 4.
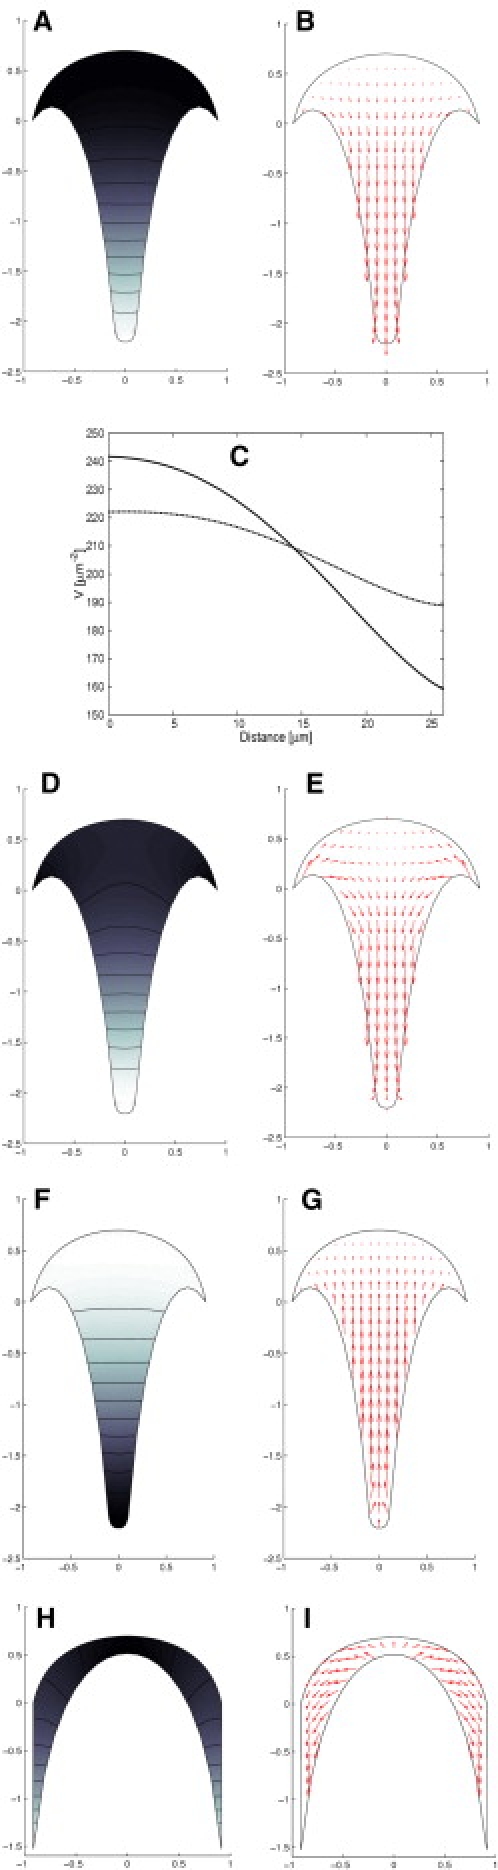
(A) Vesicle density in the clear zone of the pollen tube. Lighter shades indicate low density whereas dark shades indicate high density. The units of the x- and y axis are multiples of the cell radius. (B) The vesicle flux in the cell apex reveals the reverse fountain pattern. The relative magnitude of the flux velocity is given by the length of the arrows. (C) (Solid line) Vesicle density as a function of the distance from the tip, along the axis of symmetry of the tube (the y axis). The vesicle density from the simulation is rescaled such that its average is 209 μm−2 (1). (Dashed line) Vesicle density for a rapidly growing tube. The growth rate and the net vesicle fusion rate at the cell wall are 50 times larger. (D) Vesicle density in a rapidly growing pollen tube. (E) Vesicle flux in a rapidly growing pollen tube. (F) Vesicle distribution for an actin orientation identical to an angiosperm pollen tube but with inverted vesicle delivery at the fringe due to reverse myosin activity. (G) Vesicle flux for an actin orientation identical to an angiosperm pollen tube but with inverted vesicle delivery at the fringe due to reverse myosin activity. (H) Geometry of apex and density of vesicle in a gymnosperm pollen tube. This geometry is obtained by inverting the microfilament orientation at the fringe boundaries. The MF orientation profile used is . (I) Vesicle flux in a gymnosperm pollen tube. For 5 μm, 〈R〉 = 1.22 μm/min.
In addition to providing information on vesicle density, our model yields the relative speed and direction of vesicle motion at each coordinate in the vesicle cone. The resulting vesicle flux j (Fig. 4 B) is in excellent agreement with experimental data. Quantitative analysis of vesicle dynamics (1) revealed a vesicle flux with a direction field described by a reverse fountain pattern, qualitatively identical to the one our model produces. The microscopic observations showed very slow vesicle motion at the immediate tip of the pollen tube whereas vesicles move rapidly in the tail region of the cone. Our model is consistent with this change in the vesicle motion.
The absence of significant vesicle motion at the very tip of the cell is due to the small value of the vesicle fusion rate at the cell wall. Since the average vesicle fusion rate is directly proportional to the pollen tube growth rate, we can model the change in the flux pattern due to an increase in pollen tube growth rate. Fig. 4 E shows the vesicle motion in a rapidly growing tube. The pattern was obtained by multiplying the net vesicle fusion rate by 50 (R = 1.22 μm/min when averaged over the cell wall). Although this value of R corresponds to a tube growth rate (v = 350 μm/min) that is much higher than any value observed in vitro (22), the numerical simulation displays the observed robustness of the streaming pattern to changes in the growth rate.
Our model, and especially the V-shape of the apical zone, relies on the fact that actin microfilaments are oriented with their barbed ends forward at the periphery and rearward in the center of the tube, a typical configuration in angiosperm pollen tubes (23). In gymnosperm pollen tubes, the flow direction of cytoplasmic organelles is reversed, forming a fountainlike streaming pattern (52). However, it is unknown whether this flow pattern is due to an inversion of the orientation of actin filaments (i.e., barbed ends toward the rear in the periphery and toward the front in the center), or whether a different type of myosin moves vesicles from the barbed ends of the actin filaments toward their pointed ends (53). To find out which of the two alternatives is more likely we tried to model both. First, we let vesicles move in the opposite direction to the actin polarity on actin filaments that are oriented and polymerize according to the conditions mentioned above for angiosperm pollen tubes. The vesicle flow now displays a fountain pattern (Fig. 4 G), but the shape of the vesicle cone remains identical to that of the angiosperm pollen tube. Importantly, a high density of vesicles is now present in the tail of the cone, whereas the density is low close to the plasma membrane (Fig. 4 F).
Next, we inverted the orientation of the actin filaments. Actin arrays in the periphery now point forward with their barbed ends, and the central array points rearward. We chose
| (15) |
for this approach. Not only do these inverse initial conditions result in a fountainlike flow pattern (Fig. 4 H), they also lead to a very different shape of the apical vesicle population (Fig. 4 I). Instead of an inverted cone, the apical vesicle population is now crescent-shaped. Inspection of available fluorescence micrographs reveals that vesicles in gymnosperm pollen tubes indeed accumulate in such a crescent-shaped conformation (44,52), whereas the configuration shown in Fig. 4 F does not correspond to any phenomenon found in living pollen tubes.
Discussion
The goal of this work was to model the dynamics of vesicles in the apical region of growing pollen tubes and to relate it to the polymerization of the actin arrays bordering the apical vesicle cone. Our data show that a viscoplastic model of the cell wall and a steady-state model for the actin polymerization provide adequate inlet and outlet boundary conditions for the diffusive motion of the vesicles. When solved together, these constraints lead to a vesicle flux whose magnitude and direction are in agreement with the vesicle motion observed experimentally (1,11,54). The continuity of the vesicle motion at the apical fringe, i.e., the conservation of the total volume of cell wall material, was used to solve the model.
The robustness of our model is demonstrated by its applicability to a system that operates quite differently, the gymnosperm pollen tube. Inversion of the actin filaments in our model produces exactly the streaming and vesicle distribution patterns that are observed experimentally (44,52). By contrast, inversion of the movement direction of the organelles, putatively mediated by a myosin motor protein operating in the opposite direction, does not produce any patterns that can be observed experimentally. This is consistent with the fact that no myosin molecules operating in unconventional direction have been identified in plants hitherto. It must be mentioned, however, that microtubules seem to be more important in gymnosperm pollen tubes, compared to their role in angiosperm counterparts (55). Drug-induced microtubule depolymerization inhibits elongation in gymnosperm pollen tubes and changes the motion patterns of organelles. However, the authors postulate that this effect is mediated by the microtubules' control of the actin array. This is corroborated by the finding that the microtubule disruption causes a reversal of organelle streaming in gymnosperm pollen tubes (52). This reversal from fountain- to inverse fountain-streaming is accompanied by a rearrangement of the actin array. Hence, these experiments are consistent with the results of our modeling. No information on the orientation of actin filaments in gymnosperm pollen tube is available, but our model predicts that actin arrays are oriented with their barbed ends toward the apex in the central cytoplasmic region, and rearward in the periphery. Vesicles are predicted to move toward the barbed ends of the arrays. Together these conditions result in the flow and distribution patterns observed experimentally.
In view of the simplistic assumptions of the model, the agreement with experimental observations is encouraging. A very important test of the vesicle diffusion picture would be the prediction of the vesicle flux after a disruption of the tubular shape of the pollen tube, e.g., through a mechanical constriction of the tube or by the application of an agent causing swelling of the apex without interfering with actin functioning. However, such tests require modeling beyond the limits of our current steady-state cell wall analysis. Refinements of the model should include a better calculation of the granular flow of the cytoplasm, a heterogeneous and polydisperse medium (i.e., containing components of different sizes). Furthermore, the spatial variation of G-actin and calcium concentrations, as well as their effects on the actin polymerization process, was not taken into account. Given the cytoplasmic calcium gradient in the clear zone of the pollen tube apex (56) and the role played by calcium during actin polymerization (57), calcium and G-actin concentrations should be considered in a future model of the polymerization process. Experimental validations of this model include a detailed determination of the polarization of the actin microfilaments in the subapical region.
Supporting Material
Two figures are available at http://www.biophysj.org/biophysj/supplemental/S0006-3495(09)-01296-X.
Supporting Material
Acknowledgments
We thank Prof. Luca Cortelezzi for insightful discussions.
We are thankful for the generous support of this research by the Natural Sciences and Engineering Research Council of Canada and by Le Fonds Québécois de la Recherche sur la Nature et les Technologies.
References
- 1.Bove J., Vaillancourt B., Kroeger J., Hepler P., Wiseman P. Magnitude and direction of vesicle dynamics in growing pollen tubes using spatiotemporal image correlation spectroscopy (STICS) and fluorescence recovery after photobleaching (FRAP) Plant Physiol. 2008;147:1646–1658. doi: 10.1104/pp.108.120212. [DOI] [PMC free article] [PubMed] [Google Scholar]
- 2.Geitmann A., Dumais J. Not-so-tip-growth. Plant Signal. Behav. 2009;4:136–138. doi: 10.4161/psb.4.2.7633. [DOI] [PMC free article] [PubMed] [Google Scholar]
- 3.Derksen J., Rutten T., Lichtscheidl I., de Win A., Pierson E. Quantitative analysis of the distribution of organelles in tobacco pollen tubes: implications for exocytosis and endocytosis. Protoplasma. 1995;188:267–276. [Google Scholar]
- 4.Lancelle S., Hepler P. Ultrastructure of freeze-substituted pollen tubes of Lilium longiflorum. Protoplasma. 1992;167:215–230. [Google Scholar]
- 5.Kroeger J., Geitmann A., Grant M. Model for calcium dependent oscillatory growth in pollen tubes. J. Theor. Biol. 2008;253:363–374. doi: 10.1016/j.jtbi.2008.02.042. [DOI] [PubMed] [Google Scholar]
- 6.Dumais J., Long S., Shaw S. The mechanics of surface expansion anisotropy in Medicago truncatula root hairs. Plant Physiol. 2004;136:3266–3275. doi: 10.1104/pp.104.043752. [DOI] [PMC free article] [PubMed] [Google Scholar]
- 7.Bartnicki-Garcia S., Bracker C., Giertz G., Lopez-Franco R., Lu H. Mapping the growth of fungal hyphae: orthogonal cell wall expansion during tip growth and the role of turgor. Biophys. J. 2000;79:2382–2390. doi: 10.1016/S0006-3495(00)76483-6. [DOI] [PMC free article] [PubMed] [Google Scholar]
- 8.Schaefer A., Kabir N., Forscher P. Filopodia and actin arcs guide the assembly and transport of two populations of microtubules with unique dynamic parameters in neuronal growth cones. J. Cell Biol. 2002;158:139–152. doi: 10.1083/jcb.200203038. [DOI] [PMC free article] [PubMed] [Google Scholar]
- 9.Geitmann A., Steer M. The architecture and properties of the pollen tube cell wall. In: Malhò R., editor. The Pollen Tube. Plant Cell Monographs 3. Springer Verlag; Berlin: 2006. [Google Scholar]
- 10.Malhó R., Castanho-Coelho P., Pierson E., Derksen J. Endocytosis and membrane recycling in pollen tubes. In: Šamaj, Baluška F., Menzel D., editors. Plant Endocytosis. Springer Verlag; Berlin: 2005. [Google Scholar]
- 11.Parton R., Fischer-Parton S., Watahiki M., Trewavas A. Dynamics of the apical vesicle accumulation and the rate of growth are related in individual pollen tubes. J. Cell Sci. 2001;114:2685–2695. doi: 10.1242/jcs.114.14.2685. [DOI] [PubMed] [Google Scholar]
- 12.Lovy-Wheeler A., Wilsen K., Baskin T., Hepler P. Enhanced fixation reveals the apical cortical fringe of actin filaments as a consistent feature of the pollen tube. Planta. 2005;221:95–104. doi: 10.1007/s00425-004-1423-2. [DOI] [PubMed] [Google Scholar]
- 13.Feijó J. The pollen tube oscillator: towards a molecular mechanism of tip growth. In: Cresti M., Cai G., Moscatelli A., editors. Fertilization in Higher Plants. Springer Verlag; Berlin: 1999. [Google Scholar]
- 14.Yokota E., Tominaga M., Mabuchi I., Tsuji Y., Staiger C. Plant villin, lily P-135-ABP, possesses G-actin binding activity and accelerates the polymerization and depolymerization of actin in a Ca2+-sensitive manner. Plant Cell Physiol. 2005;46:1690–1703. doi: 10.1093/pcp/pci185. [DOI] [PubMed] [Google Scholar]
- 15.Hepler P. Calcium: a central regulator of plant growth and development. Plant Cell. 2005;17:2142–2155. doi: 10.1105/tpc.105.032508. [DOI] [PMC free article] [PubMed] [Google Scholar]
- 16.Hwang J.-U., Gu Y., Lee Y.-J., Yang Z. Oscillatory ROP GTPase activation leads the oscillatory polarized growth of pollen tubes. Mol. Biol. Cell. 2005;16:5385–5399. doi: 10.1091/mbc.E05-05-0409. [DOI] [PMC free article] [PubMed] [Google Scholar]
- 17.Kost B. Spatial control of Rho (Rac-Rop) signaling in tip-growing plant cells. Trends Cell Biol. 2008;18:119–127. doi: 10.1016/j.tcb.2008.01.003. [DOI] [PubMed] [Google Scholar]
- 18.Cai G., Cresti M. Organelle motility in the pollen tube: a tale of 20 years. J. Exp. Bot. 2009;60:495–508. doi: 10.1093/jxb/ern321. [DOI] [PubMed] [Google Scholar]
- 19.de Win A., Pierson E., Derksen J. Rational analyses of organelle trajectories in tobacco pollen tubes reveal characteristics of the actomyosin cytoskeleton. Biophys. J. 1999;76:1648–1658. doi: 10.1016/S0006-3495(99)77324-8. [DOI] [PMC free article] [PubMed] [Google Scholar]
- 20.Yokota E., Shimmen T. Isolation and characterization of plant myosin from pollen tubes of lily. Protoplasma. 1994;177:153–162. [Google Scholar]
- 21.Lovy-Wheeler A., Cardenas L., Kunkel J., Hepler P. Differential organelle movement on the actin cytoskeleton in lily pollen tubes. Cell Motil. Cytoskeleton. 2007;64:1724–1769. doi: 10.1002/cm.20181. [DOI] [PubMed] [Google Scholar]
- 22.Vidali L., McKenna S., Hepler P. Actin polymerization is essential for pollen tube growth. Mol. Biol. Cell. 2001;12:2534–2545. doi: 10.1091/mbc.12.8.2534. [DOI] [PMC free article] [PubMed] [Google Scholar]
- 23.Lenartowska M., Michalska A. Actin filament organization and polarity in pollen tubes revealed by myosin II subfragment 1 decoration. Planta. 2008;228:891–896. doi: 10.1007/s00425-008-0802-5. [DOI] [PubMed] [Google Scholar]
- 24.Begg D., Rodewald R., Rebhun L. The visualization of actin filament polarity in thin sections. J. Cell Biol. 1978;79:846–852. doi: 10.1083/jcb.79.3.846. [DOI] [PMC free article] [PubMed] [Google Scholar]
- 25.Adams R., Pollard T. Propulsion of organelles isolated from Acanthamoeba along actin filaments by myosin-I. Nature. 1986;322:752–756. doi: 10.1038/322754a0. [DOI] [PubMed] [Google Scholar]
- 26.Sheetz M., Spudich J. Movement of myosin-coated fluorescent beads on actin cables in vitro. Nature. 1983;303:31–35. doi: 10.1038/303031a0. [DOI] [PubMed] [Google Scholar]
- 27.Kuznetsov S., Langford G., Weiss D. Actin-dependent organelle movement in squid axoplasm. Nature. 1992;356:722–725. doi: 10.1038/356722a0. [DOI] [PubMed] [Google Scholar]
- 28.Langer J. Dendrites, viscous fingers, and the theory of pattern formation. Science. 1983;243:1150–1156. doi: 10.1126/science.243.4895.1150. [DOI] [PubMed] [Google Scholar]
- 29.Pelcé P. Oxford University Press; Oxford: 2000. New Visions on Form and Growth. [Google Scholar]
- 30.Dumais J., Shaw S., Steele C., Long S., Ray P. An anisotropic-viscoplastic model of plant cell morphogenesis by tip growth. Int. J. Dev. Biol. 2006;50:209–222. doi: 10.1387/ijdb.052066jd. [DOI] [PubMed] [Google Scholar]
- 31.Edelstein-Keshet L., Ermentrout G.B. Models for spatial polymerization dynamics of rod-like polymers. J. Math. Biol. 2000;40:64–96. doi: 10.1007/s002850050005. [DOI] [PubMed] [Google Scholar]
- 32.Mogilner A., Edelstein-Keshet L. Regulation of actin dynamics in rapidly moving cells: a quantitative analysis. Biophys. J. 2002;83:1237–1258. doi: 10.1016/S0006-3495(02)73897-6. [DOI] [PMC free article] [PubMed] [Google Scholar]
- 33.Civelekoglu G., Edelstein-Keshet L. Modeling the dynamics of F-actin in the cell. Bull. Math. Biol. 1994;56:587–616. doi: 10.1007/BF02460713. [DOI] [PubMed] [Google Scholar]
- 34.Alt W. Mathematical models in actin-myosin interactions. In: Wohlfahrt-Bottermann K.E., editor. Nature and Function of Cytoskeletal Proteins in Motility and Transport. Gustav Fischer Verlag; Stuttgart: 1987. [Google Scholar]
- 35.Mogilner A., Edelstein-Keshet E. Selecting a common direction. I. how orientational order can arise from simple contact responses between interacting cells. J. Math. Biol. 1995;33:619–660. [Google Scholar]
- 36.Mogilner A.I., Edelstein-Keshet L. Spatio-angular order in populations of self-aligning objects: formation of oriented patches. Physica D. 1996;89:346–367. [Google Scholar]
- 37.Mogilner A., Edelstein-Keshet E., Ermentrout G. Selecting a common direction. II. peak-like solutions representing total alignment of cell clusters. J. Math. Biol. 1996;34:811–842. [PubMed] [Google Scholar]
- 38.Spiros A., Edelstein-Keshet L. Testing a model for the dynamics of actin structures with biological parameter values. Bull. Math. Biol. 1998;60:275–305. doi: 10.1006/bulm.1997.0022. [DOI] [PubMed] [Google Scholar]
- 39.Koestler S., Auinger S., Vinzenz M., Rottner K., Small J. Differentially oriented populations of actin filaments generated in lamellipodia collaborate in pushing and pausing at the cell front. Nat. Cell Biol. 2008;10:306–313. doi: 10.1038/ncb1692. [DOI] [PubMed] [Google Scholar]
- 40.Yoneda M., Nagai R. Structural basis of cytoplasmic streaming in characean internodal cells. A hydrodynamic analysis. Protoplasma. 1988;147:64–76. [Google Scholar]
- 41.Houtman D., Pagonabarraga I., Lowe C., Esseling-Ozdoba A., Emons A. Hydrodynamic flow caused by active transport along cytoskeletal elements. Europhys. Lett. 2007;78:18001–18005. [Google Scholar]
- 42.de Win A., Knuiman B., Pierson E., Geurts H., Kengen H. Development and cellular organization of Pinus sylvestris pollen tubes. Sex. Plant Reprod. 1996;9:93–101. [Google Scholar]
- 43.Terasaka O., Niitsu T. Differential roles of microtubule and actin-myosin cytoskeleton in the growth of Pinus pollen tubes. Sex. Plant Reprod. 1994;7:264–272. [Google Scholar]
- 44.Wang X., Teng Y., Wang Q., Li X., Sheng X. Imaging of dynamic secretory vesicles in living pollen tubes of Picea meyeri using evanescent wave microscopy. Plant Physiol. 2006;141:1591–1603. doi: 10.1104/pp.106.080168. [DOI] [PMC free article] [PubMed] [Google Scholar]
- 45.Leonetti M. Cell movement by osmotic current. Europhys. Lett. 1995;32:561–565. [Google Scholar]
- 46.Ciofalo M., Collins M., Hennessy T. WIT Press; Southampton: 1999. Nanoscale Fluid Dynamics in Physiological Processes. [Google Scholar]
- 47.Pickard W. The role of cytoplasmic streaming in symplastic transport. Plant Cell Environ. 2003;26:1–15. [Google Scholar]
- 48.Yoon B., Kim S. A boundary collocation method for the motion of two steroids in Stokes flow: hydrodynamics and colloidal interactions. Int. J. Multiph. Flow. 1990;16:639–650. [Google Scholar]
- 49.Xijun F., Yeow Y. A boundary method equation method for the Stokes problem of multiparticle systems. Phys. Fluids A. 1992;4:1074–1076. [Google Scholar]
- 50.Pozrikidis C. Cambridge University Press; Cambridge: 1992. Boundary Integral and Singularity Methods for Linearized Viscous Flow. [Google Scholar]
- 51.Chandrasekhar S. 2nd Ed. Cambridge University Press; Cambridge: 1992. Liquid Crystals. [Google Scholar]
- 52.Justus C., Anderhag P., Goins J., Lazzaro M. Microtubules and microfilaments coordinate to direct a fountain streaming pattern in elongating conifer pollen tube tips. Planta. 2004;219:103–109. doi: 10.1007/s00425-003-1193-2. [DOI] [PubMed] [Google Scholar]
- 53.Wells A., Lin A., Chen L.-Q., Safer D., Cain S. Myosin VI is an actin-based motor that moves backwards. Nature. 1999;401:505–508. doi: 10.1038/46835. [DOI] [PubMed] [Google Scholar]
- 54.Zonia L., Munnik T. Vesicle trafficking dynamics and visualization of zones of exocytosis and endocytosis in tobacco pollen tubes. J. Exp. Bot. 2008;59:861–873. doi: 10.1093/jxb/ern007. [DOI] [PubMed] [Google Scholar]
- 55.Anderhag P., Hepler P., Lazzaro M. Microtubules and microfilaments are both responsible for pollen tube elongation in the conifer Picea abies (Norway spruce) Protoplasma. 2000;214:141–157. [Google Scholar]
- 56.Hepler P. Tip growth in pollen tubes: calcium leads the way. Trends Plant Sci. 1997;2:79–80. [Google Scholar]
- 57.Vantard M., Blanchoin L. Actin polymerization processes in plant cells. Curr. Opin. Plant Biol. 2002;5:502–506. doi: 10.1016/s1369-5266(02)00300-x. [DOI] [PubMed] [Google Scholar]
- 58.Cooper J. The role of actin polymerization in cell motility. Annu. Rev. Physiol. 1991;53:585–605. doi: 10.1146/annurev.ph.53.030191.003101. [DOI] [PubMed] [Google Scholar]
- 59.Marchand J.-B., Moreau P., Paoletti A., Cossart P., Carlier M.-F. Actin-based movement of Listeria monocytogenes: actin assembly results from the local maintenance of uncapped filament barbed ends at the bacterium surface. J. Cell Biol. 1995;130:331–343. doi: 10.1083/jcb.130.2.331. [DOI] [PMC free article] [PubMed] [Google Scholar]
- 60.Luby-Phelps K. Cytoarchitecture and physical properties of cytoplasm: volume, viscosity, diffusion, intracellular surface area. Int. Rev. Cytol. 2000;192:189–221. doi: 10.1016/s0074-7696(08)60527-6. [DOI] [PubMed] [Google Scholar]
- 61.Mastro A., Keith A. Diffusion in the aqueous compartment. J. Cell Biol. 1984;99:180–187. doi: 10.1083/jcb.99.1.180s. [DOI] [PMC free article] [PubMed] [Google Scholar]
- 62.Abraham V., Krishnamurthi V., Taylor D., Lanni F. The actin-based nanomachine at the leading edge of migrating cells. Biophys. J. 1999;77:1721–1732. doi: 10.1016/S0006-3495(99)77018-9. [DOI] [PMC free article] [PubMed] [Google Scholar]
- 63.Pierson E., Miller D., Callaham D., Shipley A., Rivers B. Pollen tube growth is coupled to the extracellular calcium ion flux and the intracellular calcium gradient: effect of BAPTA-type buffers and hypertonic media. Plant Cell. 1994;6:1815–1828. doi: 10.1105/tpc.6.12.1815. [DOI] [PMC free article] [PubMed] [Google Scholar]
Associated Data
This section collects any data citations, data availability statements, or supplementary materials included in this article.