Abstract
The mitochondrial F1Fo-ATPase performs the terminal step of oxidative phosphorylation. Small molecules that modulate this enzyme have been invaluable in helping decipher F1Fo-ATPase structure, function, and mechanism. Aurovertin is an antibiotic that binds to the β subunits in the F1 domain and inhibits F1Fo-ATPase-catalyzed ATP synthesis in preference to ATP hydrolysis. Despite extensive study and the existence of crystallographic data, the molecular basis of the differential inhibition and kinetic mechanism of inhibition of ATP synthesis by aurovertin has not been resolved. To address these questions, we conducted a series of experiments in both bovine heart mitochondria and E. coli membrane F1Fo-ATPase. Aurovertin is a mixed, noncompetitive inhibitor of both ATP hydrolysis and synthesis with lower Ki values for synthesis. At low substrate concentrations, inhibition is cooperative suggesting a stoichiometry of two aurovertin per F1F0-ATPase. Furthermore, aurovertin does not completely inhibit the ATP hydrolytic activity at saturating concentrations. Single-molecule experiments provide evidence that the residual rate of ATP hydrolysis seen in the presence of saturating concentrations of aurovertin results from a decrease in the binding change mechanism by hindering catalytic site interactions. The results from these studies should further the understanding of how the F1Fo-ATPase catalyzes ATP synthesis and hydrolysis.
INTRODUCTION
Aurovertin is an antibiotic from the fungus, Calcarisporium arbuscula 1, and is best known for its ability to inhibit oxidative phosphorylation 2,3. Inhibition is mediated by binding to β subunits in the F1 portion of the F1F0-ATPase in mitochondria 4, yeast 5, and Escherichia coli (E. coli) 6,7. While each F1 domain contains three β subunits 8 and each β subunit contains one aurovertin binding site 4, the number of aurovertin molecules bound per F1 has been a subject of debate. Issartel and colleagues found that each mitochondrial and bacterial F1 contained three aurovertin binding sites, one of high affinity (Kd < 1 μM) and the other two of lower affinity (Kd ~4–6 μM)9,10. In contrast, Chang and Penefsky determined that mitochondrial F1 contained two high-affinity aurovertin binding sites in the presence of substrate (ATP or ATP + Mg2+), but only one site in the absence of substrate 11. Several other studies have also determined that each F1 possesses either one 12–14 or two 15–17 aurovertin binding sites, depending on the assay conditions. The crystal structure of aurovertin bound to isolated bovine heart F1 in its ADP-inhibited form demonstrates two molecules of aurovertin bound, one in the βTP subunit (thought to contain ADP + Pi when the enzyme is actively hydrolyzing ATP) and one in the βE subunit (devoid of substrate during ATP hydrolysis) 18.
Aurovertin is a significantly more potent inhibitor of ATP synthesis than hydrolysis 2,19–22. In fact, inhibition of ATP hydrolysis by aurovertin is never complete, with residual enzymatic activity remaining despite saturating concentrations of the inhibitor 3,9,16,23. Hence, it has been proposed that the enzyme retains some residual activity even in the presence of drug 10. However, these mechanisms have not been adequately addressed.
A detailed understanding of the mechanism of F1Fo-ATPase inhibition would be helpful in clarifying both the stoichiometry of aurovertin binding to F1 and how inhibition of ATP hydrolysis by aurovertin differs from inhibition of ATP synthesis. However, the literature surrounding aurovertin inhibition kinetics is not consistent. While most studies agree that the mechanism by which aurovertin inhibits ATP hydrolysis is not competitive, they differ in their exact descriptions. Many reports describe aurovertin as an uncompetitive inhibitor 2,11,24,25; in others, the inhibitory mechanism is described as complex uncompetitive 1, noncompetitive hyperbolic 26, or partial mixed inhibition, depending on the assay conditions 10.
Several studies have demonstrated that aurovertin binds to the F1Fo-ATPase with higher affinity in the presence of nucleotide 2,7,11,27, suggesting that the inhibition mechanism is uncompetitive. However, aurovertin also affects the ATPase activity in the absence of nucleotide, demonstrating that the inhibition mechanism is not purely uncompetitive (since an uncompetitive inhibitor should have no effect on the enzyme activity when substrate is absent). In fact, aurovertin activates ATP hydrolysis at low concentrations of substrate 26, which may result from its ability to increase the affinity of isolated β subunits for ATP 28 or facilitate the dissociation of the inhibitor protein, IF1, from the F1 domain 29. Additionally, with one exception10, the kinetic models of aurovertin inhibition of ATP hydrolysis fail to account for the residual activity of the complex at saturating aurovertin concentrations.
In contrast to hydrolysis, the mechanism of inhibition of ATP synthesis by aurovertin has not been defined. To help clarify the mechanism of inhibition of F1Fo-ATPase by aurovertin, we pursued a series of experiments examining the affinity, stoichiometry, and kinetics of aurovertin binding to both bovine heart mitochondria and E. coli membrane F1Fo-ATPase. The data presented here help clarify the stoichiometry of aurovertin binding to F1, provide the first kinetic models of both ATP hydrolysis and synthesis inhibition by aurovertin accounting for all its observed properties, and using single-molecule enzymology experiments, provide support for a molecular basis for residual enzymatic activity in the presence of saturating aurovertin concentrations.
MATERIALS AND METHODS
Reagents
Aurovertin B was obtained from Sigma (St. Louis, MO). For kinetic assays, aurovertin was dissolved in dimethyl sulfoxide (DMSO) to prepare a 10 mM stock solution, and was diluted in the assays to the appropriate concentration with 1% DMSO final. Bovine hearts were supplied by Dunbar Meat Packing (Milan, MI).
Bovine ATPase steady-state kinetic assay
SMPs were prepared from bovine heart mitochondria, as previously described 30. ATP hydrolytic activity of SMPs was measured by coupling the production of ADP to the oxidation of NADH, under conditions of varied ATP (0.1–2.0 mM) 31. ATP synthetic activity of SMPs was measured by coupling production of ATP to reduction of NADP+, under conditions of varied ADP (1.875–1200 μM) 31. In both assays, SMPs were incubated with aurovertin or DMSO control for 5 min prior to the addition of substrate or coupling reagents.
E. coli ATPase steady-state kinetic assay
E. coli everted membrane vesicles were prepared from E coli strain LE392, as previously described 32. ATP hydrolytic activity was measured using the coupled assay described above for bovine, with E. coli membranes at a concentration of 33 μg mL−1 and KCN (5 mM) to inhibit chemiosmotic phosphorylation.
Analysis of kinetic data
The apparent kinetic parameters at each concentration of aurovertin were determined by fitting the Michealis-Menten equation to the dependence of initial velocity (v) on substrate concentration. Kinetic parameters were plotted versus inhibitor concentration, generating secondary plots of the effect of aurovertin on the kinetic parameters of ATP hydrolysis and synthesis. These secondary plots were fit using eqs 1–4,
| (1) |
| (2) |
| (3) |
| (4) |
where kapp is the apparent kinetic parameter in the presence of inhibitor, k is the kinetic parameter in the absence of inhibitor, I is the inhibitor, Ki is the inhibition constant, Ki(E) and Ki(ES) are the inhibition constants describing the competitive and uncompetitive portions of mixed inhibition, respectively, Vmax1 and Vmax2 are the maximal catalytic rates of the enzyme-substrate complex (ES) in the absence and presence of aurovertin, respectively, and n(E) and n(ES) are the cooperativity factors for the competitive and uncompetitive inhibition constants, respectively.
To identify the model that best describes the bovine kinetic data, three-dimensional fits of the dependence of initial velocity (v) on both substrate concentration (S) and inhibitor (I) were performed. For catalysis of ATP hydrolysis, the data were fit with eq 5 for derived for special mixed inhibition, accounting for the residual activity that remains at saturating concentrations of aurovertin. For synthesis, the data were fit with eq 6 derived for mixed inhibition.
| (5) |
| (6) |
Single-molecule enzymology
In order to fluorescently label the F1Fo-ATP synthase for FRET microscopy, two different plasmids were used to introduce cysteine mutations in either the γ subunit of F1 (plasmid pRA114 33) or the b subunits of Fo (plasmid pRR76 34). The F1 domain was labeled with Rhodamine 110 maleimide as a FRET donor at the cysteine at position γ106. The Fo domain was labeled with Cy5-bismaleimide as the FRET acceptor via crosslinking of two cysteines at position b64. Fluorophore-labeled F1Fo-ATP synthase enzymes were reconstituted into liposomes and stored at −80°C until use as reported previously 34. Briefly, the Cy5-bismaleimide-labeled F1Fo-ATP synthases were introduced into liposomes. The unlabeled F1 domains of the membrane-embedded F1Fo-ATP synthases were then removed in the absence of Mg2+. Finally, Rhodamine 110-labeled F1 domains were introduced to successfully reconstitute FRET-labeled F1Fo-ATP synthases in liposomes.
Confocal single-molecule FRET microscopy
The custom-built confocal microscope was based on an Olympus IX71 as described 33. The 488 nm line of an argon ion laser (model 2020, Spectra Physics) was attenuated to 150 μW before focusing into the buffer solution by a water immersion objective (40 x, N.A. 1.15, Olympus). The proteoliposome solution was placed on a microscope coverslide as a droplet of 25 to 50 μl. Scattered laser light was blocked by a dichroic beam splitter (DCXR 488, AHF, Tubingen, Germany). Fluorescence was collected in two spectral ranges using interference filters (AHF). The FRET donor was detected between 497 to 567 nm, and the FRET acceptor at λ > 595 nm. Single photons were detected by two avalanche photodiodes (SPCM AQR-14, Perkin Elmer) and registered by a TCSPC device (PC card SPC-630, Becker & Hickl, Berlin, Germany). Photon bursts of FRET-labeled ATP synthases in the fluorescence time trajectories were visualized with the software ‘Burst-Analyzer’ and marked for subsequent manual and for HMM-based FRET level analysis 35.
RESULTS
ATP hydrolysis inhibition kinetics using bovine submitochondrial particles (SMPs)
To examine inhibition of ATP hydrolysis by aurovertin, SMPs were prepared from bovine heart mitochondria 30. Hydrolytic activity was measured using an NADH-coupled assay in the presence of varying concentrations of MgATP and aurovertin 31. The F1Fo-ATPase has three identical catalytic sites that have different affinities for nucleotide. The concentration range of MgATP examined spans that for transitioning from a slow rate of hydrolysis with only one catalytic site filled with MgATP to a physiologic rate with multiple bound MgATP 36.
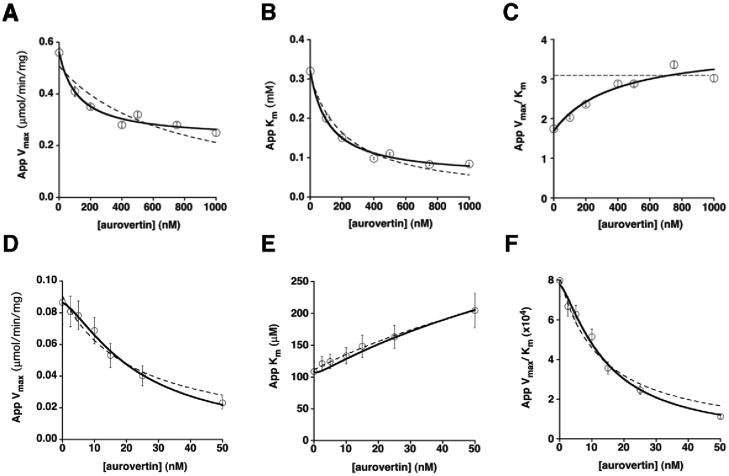
Aurovertin decreases the apparent values for Vmax and Km (Figure 1A and B), consistent with an uncompetitive mechanism of inhibition. The decrease in the apparent Km value for ATP at increasing aurovertin concentrations indicates that the inhibitor has a higher affinity for the species that builds up at saturating ATP (ATPase with several bound MgATP) than the species that builds up under Vmax/Km conditions (E or E•MgATP), consistent with previous observations2,11. However, the value of Vmax/Km increases by 50% at saturating aurovertin concentrations (Figure 1C), which is not typical of uncompetitive inhibition. For a simple kinetic mechanism, a purely uncompetitive inhibitor should only bind to the ligand-bound form of an enzyme (i.e., the ES complex) and not to free E and therefore the value of Vmax/Km should be independent of the inhibitor concentration. The increase in the value of Vmax/Km upon addition of aurovertin demonstrates that this inhibitor interacts with the enzyme species that builds up under these conditions (E or E•MgATP, where MgATP is bound to the high affinity ATP site 36). Therefore, aurovertin interacts with more than one ATPase species, thereby demonstrating a mixed mechanism of inhibition of ATP hydrolysis.
Figure 1.
Aurovertin inhibition of the F1Fo-ATPase in bovine SMPs. ATP hydrolysis: Aurovertin decreases both the apparent Vmax (A) and Km (B), and increases the apparent Vmax/Km (C). The plots of the kinetic parameters in panels A, B, and C were fit using either eq 1 for a purely uncompetitive inhibitor (dotted lines) or eq 2–4 for a mixed inhibitor with residual activity of the enzyme-substrate-inhibitor (ESI) complex (solid lines), as described in Materials and Methods. Fits shown are with all n values set equal to 1. ATP synthesis: Aurovertin decreases both the apparent Vmax (D) and Vmax/Km (F), and increases the apparent Km (E). The Vmax and Vmax/Km plots were fit using eq 1 and the plot of Km was fit using eq 3, consistent with mixed inhibition. The fits are shown with n(E) and n(ES) both set equal to 1 (dotted lines), and with n(E) = 2, n(ES) = 1 (solid lines).
To evaluate whether residual ATPase activity is retained in the presence of saturating concentrations of aurovertin, as previously observed 3,9,16,23, the dependence of the values of the apparent Vmax and Km on the aurovertin concentration (Figure 1A and B) was fit using either a model that assumes Vmax goes to zero with increasing inhibitor concentrations (Eq 1, n=1, dotted lines) or one that assumes the ESI complex that builds up at saturating concentrations of substrate and inhibitor has residual catalytic activity regardless of inhibitor concentration (Eq 2–4, n=1, solid lines). The model assuming residual ATPase activity at saturating aurovertin is a significantly better fit to the data (R2 for Vmax = 0.98 versus 0.84; R2 for Km = 0.99 versus 0.96). This fit indicates that saturating aurovertin only decreases the value of Vmax for catalysis of ATP hydrolysis by ~2.5-fold.
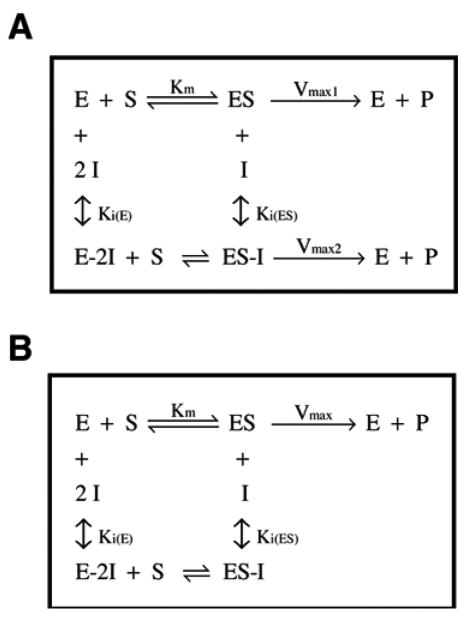
Three-dimensional (3D) fits of the initial velocity (v) data varying both the concentration of MgATP and aurovertin were then performed to obtain values of the kinetic constants using all of the data (Table I). The 3D fits were performed using eq 5 (Materials and Methods) derived for a mixed inhibitor with residual activity at saturating inhibitor. This equation also allows for cooperative inhibition of the ATPase by aurovertin. The values of n(E) and n(ES) describe the cooperativity for the competitive and uncompetitive inhibition constants, respectively. Several combinations for n(E) and n(ES) were tested in the 3D model; the model fit the data best with either n(E) and n(ES) both set equal to 1 or with n(E) = 2 and n(ES) = 1 (R2 = 0.989 and 0.988, respectively; see Table I). The crystal structure of ADP-inactivated bovine enzyme reveals two molecules of aurovertin bound to F1 18. The hydrolysis inhibition kinetics are consistent with either one or two aurovertin molecules bound to the species that builds up under Vmax/Km conditions (free E or E•ATP) and one molecule bound to the species that builds up under Vmax conditions (E•ATP2 or E•ATP3, Figure 2A). However, the cooperativity values (n(E) and n(ES)) only describe a lower limit for the stoichiometry of inhibition.
Table I.
Kinetic parameters for aurovertin inhibition of ATP hydrolysis.
| System | Model | n(E) | n(ES) | Vmax1 (μmol min−1 mg−1) | Vmax2 (μmol min−1 mg−1) | Km (mM) | Ki(E) (nM) | Ki(ES) (nM) | R2 |
|---|---|---|---|---|---|---|---|---|---|
| Bovine | eq 5 | 1 | 1 | 0.57 ± 0.01 | 0.23 ± 0.01 | 0.36 ± 0.02 | 820 ± 250 | 119 ± 17 | 0.989 |
| Bovine | eq 5 | 2 | 1 | 0.58 ± 0.01 | 0.22 ± 0.01 | 0.33 ± 0.01 | 960 ± 250 | 120 ± 17 | 0.988 |
| E. coli | eq 5 | 2 | 1 | 0.32 ± 0.01 | 0.06 ±0.01 | 0.19 ± 0.01 | 430 ± 70 | 150 ± 20 | 0.981 |
| E. coli | eq 6 | 2 | 1 | 0.31 ± 0.01 | — | 0.18 ± 0.01 | 1100 ± 400 | 290 ± 20 | 0.972 |
Parameters (±SE) were obtained from 3D fits of v, [S], and [I], using either eq 5 or eq 6, as described in Materials and Methods. Vmax1 and Vmax2 are the maximal catalytic rates of the ES and ESI complexes, respectively. Ki(E) and Ki(ES) are the inhibition constants for the competitive and uncompetitive portions of mixed inhibition, respectively. n(E) and n(ES) are the cooperativity factors for the competitive and uncompetitive inhibition constants, respectively. The 3D fits did not converge with the bovine data using either eq 6, or eq 5 when both n(E) and n(ES) are equal to 2.
Figure 2.
Proposed models for inhibition of the bovine F1Fo-ATPase by aurovertin. (A) ATP hydrolysis. (B) ATP synthesis.
ATP synthesis inhibition kinetics using bovine submitochondrial particles (SMPs)
Synthetic activity was measured in bovine SMPs 30 using an NADP+-coupled assay in the presence of varying concentrations of ADP and aurovertin 31. Aurovertin causes a decrease in the values for apparent Vmax and Vmax/Km (Figure 1D and F) and a >2-fold increase in the value of the apparent Km (Figure 1E), consistent with a mixed mechanism of inhibition. To evaluate the fit of this model to the data, and to examine the cooperativity factors, n(E) and n(ES), , 3D fits of the dependence of the initial velocity, v, on the concentration of both MgADP and aurovertin were performed using eq 6 (Materials and Methods) derived for a mixed inhibitor with no residual activity at saturating inhibitor. Similar to the hydrolysis data, the synthesis model fit best with n(E) = 2 and n(ES) = 1 (R2 = 0.980; see Table II), consistent with two aurovertin molecules bound cooperatively to the enzyme species that builds up under Vmax/Km conditions (free E or E•ADP) and one aurovertin bound to the enzyme at saturating substrate during ATP synthesis (E•ADP2 or E•ADP3, Figure 2B). In contrast to hydrolysis, inhibition of ATP synthesis is best described by a model in which the value of Vmax decreases to zero at saturating aurovertin, in line with previous observations that residual catalytic activity is only present during ATP hydrolysis 2,19–22.
Table II.
Kinetic parameters for aurovertin inhibition of ATP synthesis.
E. coli hydrolysis inhibition kinetics
To examine whether E. coli F1Fo-ATPase shows a similar mechanism of inhibition by aurovertin, hydrolytic activity was measured in everted E. coli membranes in the presence of varying concentrations of ATP and aurovertin 32. In this case, aurovertin decreases the values of the apparent Vmax and Vmax/Km (Figure 3A and C), while the value of Km varies little as the inhibitor concentration increases (Figure 3B). The plots of the apparent kinetic parameters were fit using the same equations as in bovine hydrolysis (Eq. 2–4), assuming that the enzyme retains residual catalytic activity at saturating inhibitor concentrations. This model was a good fit for the data (see Figures 3A–C). To evaluate whether the model was an appropriate global fit for the data, 3D fits of the dependence of the initial velocity, v, on the concentration of MgATP and aurovertin were performed using eq 5 (Materials and Methods) for a mixed inhibitor with residual activity at saturating inhibitor, with n(E) = 2 and n(ES) = 1. The fit obtained with ~20% residual activity at saturating aurovertin is modestly better than that obtained assuming no residual activity (eq 6) with n(E) = 2 and n(ES) = 1 (see Table I).
Figure 3.
Aurovertin inhibition of ATP hydrolysis in E. coli membranes. Aurovertin decreases the apparent Vmax (A) and Vmax/Km (C), while the apparent Km remains relatively constant (B). These data were fit using eq 2–4 for a mixed inhibitor with residual activity of ESI, as described in Materials and Methods.
Single-molecule enzymology
The residual catalytic activity measured from steady-state kinetics is an average value, which can be the result of an ensemble of many enzymes in various complexes. In this case, some enzymes may be working at maximum turnover while others are blocked irreversibly, there may be intermittent but reversible blockade of enzymes 37, or conformational dynamics in each individual enzyme may be slowed. Unlike steady-state kinetics, single-molecule enzymology is capable of discriminating between these possible mechanisms. To probe the molecular basis for the observed inhibition kinetics, we measured the catalytic turnover of single liposome-reconstituted F1Fo-ATPase from E. coli during ATP hydrolysis in the presence and absence of aurovertin.
ATP hydrolysis at millimolar concentrations of ATP is associated with a 120°-stepped rotation of the central stalk subunits γ and ε with respect to the static peripheral subunits b2 38,39 and subunit a 40. To monitor rotary subunit motion in the F1Fo-ATPase, we labeled the off-axis cysteine residue γ106C with a rhodamine 110 donor fluorophore for intramolecular fluorescence resonance energy transfer (FRET) to the acceptor fluorophore Cy5-bismaleimide at the b subunit dimer residue 64 34. During rotation the distance between these fluorophore positions is expected to vary between 2.0 to 7.5 nm in three steps according to previous single-molecule FRET data 34,38. These FRET data measured distances with 1 ms time resolution, which allowed for real time observation of the 120°-stepped rotation. To achieve single-molecule detection conditions, we diluted the reconstituted FRET-labeled F1Fo-ATPase to ~100 pM concentration so that each freely diffusing F1Fo-ATPase in a liposome traversing the femtoliter-sized confocal detection volume was unambiguously separated from the following enzyme in time. The FRET-labeled F1Fo-ATPase excited by the laser generated a burst of fluorescence photons from both fluorophores with a rhodamine110/Cy5 intensity ratio depending on the actual FRET efficiency (i.e. the distance between the fluorophores), that is, the relative γ subunit orientation. The mean diffusion time of the FRET-labeled F1Fo-ATPase through the detection volume was about 35 ms.
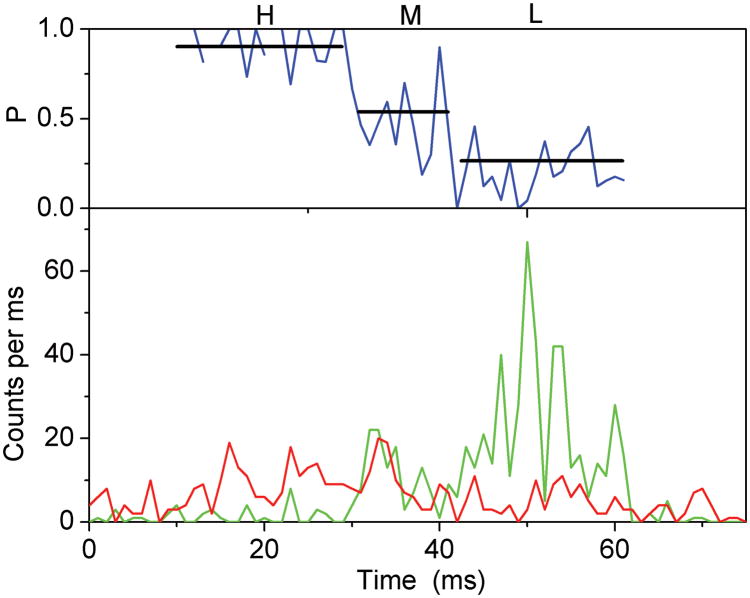
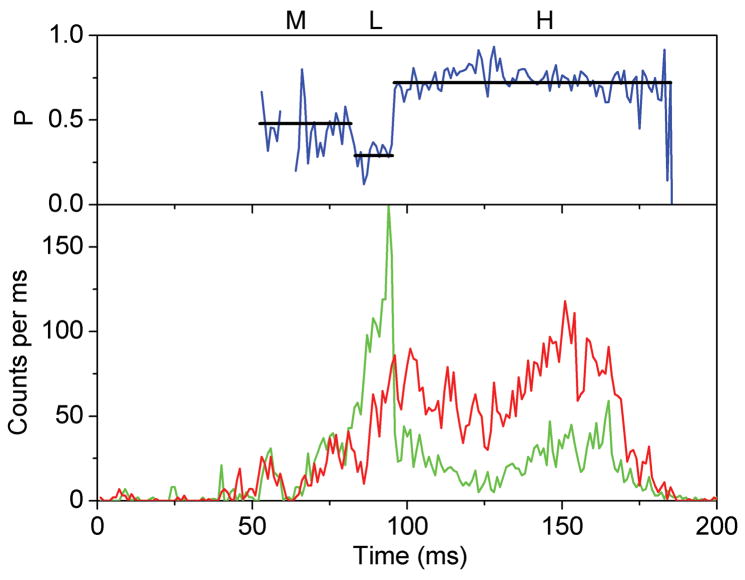
Stepped rotation of γ during ATP hydrolysis resulted in rapid sequential changes of three FRET efficiency levels. However, due to the limited observation times between 20 ms to ~ 700 ms for individual proteoliposomes diffusing arbitrarily through the laser focus, only the fast rotating F1Fo-ATPases were identified. FRET levels that changed with a single photon burst were identified by manual data analysis of the time trajectories using the proximity factor P=IA/(ID+ IA) with IA, the background-corrected fluorescence intensity in the FRET acceptor (Cy5) channel, and ID, the background-corrected fluorescence intensity in the FRET donor (rhodamine110) channel. Accordingly, 11.5 percent of 3381 observed F1Fo-ATPases exhibited three or more apparently distinct FRET levels. A single F1Fo-ATPase with three FRET levels observed during ATP hydrolysis is shown in Figure 4A. Also in the presence of saturating (20 μM) aurovertin, photon bursts with sequential changes of three FRET efficiencies were found (Figure 4B), and a similar fraction of F1Fo-ATPases showed stepwise changing FRET levels, i.e. 10.4 percent of 3685 marked photon bursts.
Figure 4.
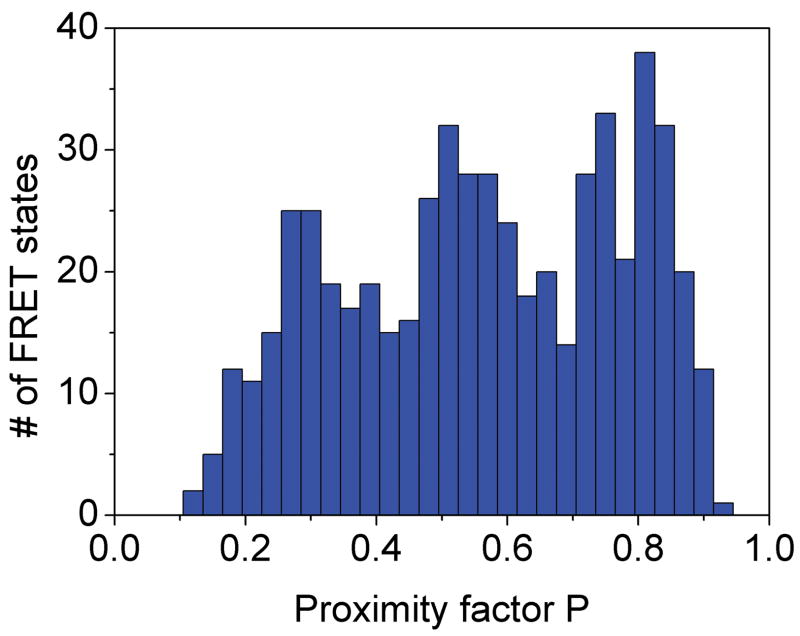
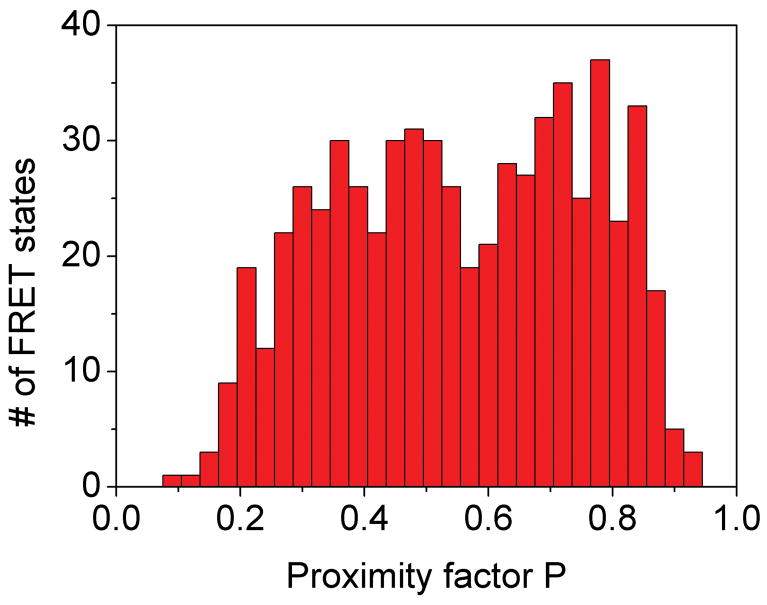
Photon bursts and proximity factor distributions of single FRET-labeled F1Fo-ATPases from E. coli in liposomes in the presence of 1 mM ATP (A) and 1 mM ATP with 20 μM aurovertin (B). The F1Fo-ATPase was labeled with rhodamine 110 at the rotating γ subunit and with Cy5-bismaleimide crosslinking the static b2 subunits. Background-corrected fluorescence time trajectories of FRET donor (ID, green) and acceptor (IA, red) are shown in the lower panel and the corresponding proximity factor P=IA/(ID+IA) as blue trace in the upper panel. The sequential transitions of three proximity factor levels within the burst indicate stepwise rotation of γ. The intermediate FRET level (M) in the absence of aurovertin has a dwell time of 10 ms (A). The intermediate FRET level (L) in the presence of aurovertin has a dwell time of 15 ms (B). (C, D) Distribution of proximity factors of FRET-labeled F1Fo-ATPases upon ATP hydrolysis. (C) Distribution of FRET levels of rotating F1Fo-ATPase in the presence of 1 mM ATP showing three or more levels within single photon bursts (556 levels in total). (D) Distribution of FRET levels in the presence of ATP plus 20 μM aurovertin (617 levels in total). Thresholds of minimal FRET level dwells of 10 ms, minimal mean photon count rates of 5 counts per ms, maximal peak intensities of 150 counts per ms, and fluctuations of the proximity factor P of less than 0.15 in each FRET level were applied.
The stopping orientations of the γ subunit in actively rotating F1Fo-ATPases were analyzed from the manually assigned FRET levels; therefore, proximity factor P values were classified in four states. For 0<P<0.1, the F1Fo-ATPase was thought to be in a likely “donor-only” state lacking the FRET acceptor dye. For 0.1<P<0.4, the FRET level was labeled as low (L), with the orientation of the γ subunit at the largest distance of γ106 to the b dimer; 0.4<P<0.7, the FRET level was medium (M); and for 0.7<P<1, the FRET level was high (H) representing the shortest distance between γ106 and the b dimer. Only F1Fo-ATPases with three and more FRET levels, but no “donor-only” state, were selected. Additional threshold criteria were applied to find well-defined FRET levels (minimum number of 5 counts per ms in each channel, maximum peak counts less than 150 per ms, limited fluctuations of the proximity factor P less than 0.15 in each FRET level). The histogram of FRET levels found in F1Fo-ATPases during ATP hydrolysis are shown in Figure 4C. Similarly, the proximity factor histogram in the presence of aurovertin was built (Figure 4D). For comparison, we fit three Gaussian distributions to each histogram. In the presence of saturating ATP, the P maxima were found at L=0.29, M=0.54 and H=0.79, and in the presence of aurovertin and ATP the maxima were found at L=0.31, M=0.51 and H=0.75. The widths of all Gaussians are similar at about 0.15. The similarities between the observed maxima at both conditions indicate that thee same three γ subunit orientations occur in single rotating ATP synthases. However, the histograms show broadened FRET levels compared to previous results 39, which could be due to a lower brightness of the fluorophores 40 or by specific photophysical properties (i.e., reversible fluorophore quenching by the local amino acid environment at position γ106, as previously reported 41). In addition, flexibility in this part of the γ subunit could be anticipated from the detection of sub-steps during ATP hydrolysis 42 and from recent compliance measurements of single F1Fo-ATPases 43.
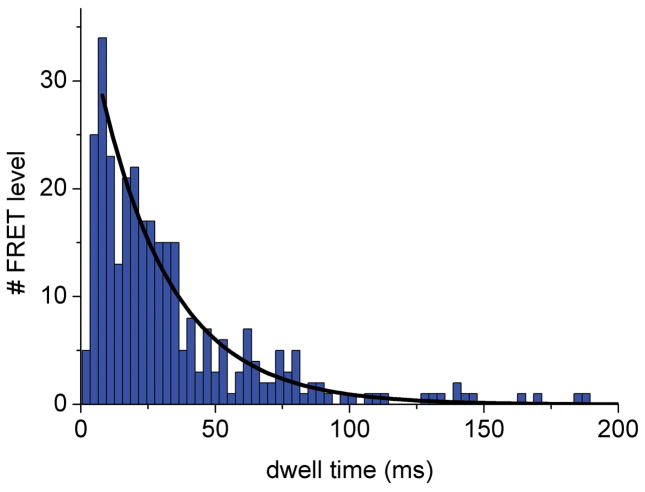
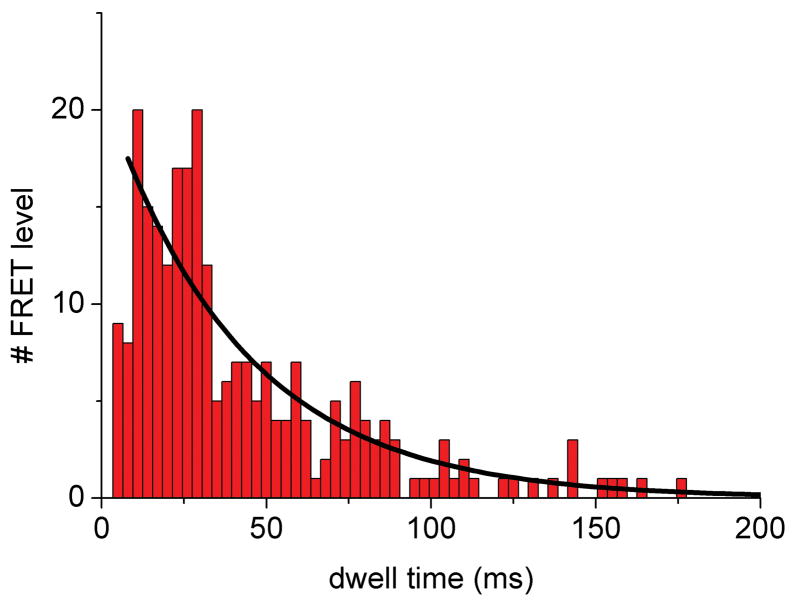
Dwell times of the intermediate FRET levels in photon bursts of single ATP synthases were determined by manually assigning the switching points in the FRET time trajectories. Time binning of 1 ms was chosen 44. For example, the duration of the intermediate FRET levels within the photon burst of the ATP synthase shown in Figure 4A was 10 ms for the M level. These intermediary FRET levels were added to dwell time histograms after re-binning to 3 ms (Figure 5). Single-enzyme turnover rates were calculated as follows: in the presence of 1 mM ATP a mean dwell time of 27 ms was found for a specific γ orientation using a mono-exponential decay fit (Figure 5, black curves). This corresponds to a single-enzyme turnover of 37 ATP s−1, which was in agreement with previous single-molecule FRET data 34 and biochemical ensemble measurements 45. In the presence of aurovertin during ATP hydrolysis, the mean dwell time increased to 42 ms for each γ orientation resulting in a turnover of 22 ATP s−1. The relative number of rotating ATP synthases did not change significantly, suggesting a decrease in rotational speed in the presence of aurovertin. Calculating the turnover ratio in the presence and absence of aurovertin yielded a remaining activity of about 60 percent at 20 μM drug (the enzyme concentration in the SMPs is ~100 pM). This value is significantly larger than the corresponding residual activity of F1Fo-ATPases in everted E. coli membrane particles (20%, Table I). Preliminary studies suggest that the discrepancy results from non-specific binding of aurovertin within the lipid membrane. However, in our inhibition studies we extrapolate to saturating aurovertin since the effective concentration of the drug is lower in the artificial liposomes. We have observed a similar discrepancy between membrane particles and artificial proteoliposomes for another hydrophobic F1Fo-ATPase inhibitor, Bz-423 31 (R. Reuter, unpublished results). Therefore, a direct relation between the membrane particle-measured Vmax2 and the increase in the mean single-molecule dwell times is not feasible.
Figure 5.
Dwell time histograms of single FRET-labeled F1Fo-ATPase from E. coli in liposomes showing aurovertin inhibition of ATP hydrolysis. FRET levels were assigned manually and dwell times binned to 3 ms. (A) Dwell time histogram in the presence of 1 mM ATP; (B) dwell time histogram in the presence of 20 μM aurovertin and 1 mM ATP. Black lines are monoexponential decay fittings.
Details of the aurovertin inhibition mechanism were revealed by fitting to the dwell time data to a double-exponential, with one rise and one decay component to describe the population or depopulation kinetics, respectively, for the stopping position of the γ subunit (Figure 5) 42. Dwell time histograms were analyzed using FRET levels with 1 ms time binning. The time constants for the decay components were very similar, with τ = (26±2) ms (±standard deviation) in the absence and τ = (28±3) ms in the presence of aurovertin. However, the rise time constants differed significantly, from τ = (1.7±0.6) ms in the absence to τ = (7.8±1.2) ms in the presence of aurovertin. The apparent short rise time constant in the case of ATP hydrolysis (< 4 ms) was due to the limitations of time resolution because dwell times shorter than about 3 ms could not be examined by manual FRET level assignment and were omitted from the analysis. In contrast, the increase in rise time ≫ 4 ms in the presence of aurovertin was significant. We also searched for differences of the catalytic rates depending on the γ subunit orientation by relating the dwell times to the three FRET levels. Slightly asymmetric rates have been reported previously 39,40,46. In the presence of ATP, we found dwell time distributions with similar rise times (less than 4 ms) and decay times between 16 ms (H level) and 20 ms (M level). However, in the presence of aurovertin, the rise time components are calculated between 11 and 14 ms with the associated decay times between 11 and 35 ms (depending on the pre-binning of the dwells). As the histograms for each FRET level contain only 107 to 280 dwells, these small dependencies on FRET levels are interpreted as supporting an uniform “slow down” effect on the catalytic rates rather than a specific blockade of one of the three γ subunit orientations with respect to the peripheral b2 subunits.
To verify the differences in the mean dwell times found by the manual FRET data analysis, a software-based FRET level search algorithm was developed based on a three-state Hidden Markov Model, HMM 35 (see Supplementary Material, Figure S1). Given the pre-defined three FRET levels corresponding to three stopping positions of γ, the HMM was applied to assign these FRET levels in the same set of manually-selected photon burst that exhibited at least three FRET levels. Thereby, the HMM was restricted to appoint these FRET levels only, and not to optimize the most likely FRET levels and the corresponding dwell times. Following FRET level assignment, the proximity factor distributions and the dwell time histograms (see Supplementary Material, Figure S2) were constructed. During ATP hydrolysis as well as in the presence of aurovertin, the proximity factor distributions were found to be similar to the manually determined distributions, indicating the reliability of the manual FRET analysis (Figure S2 ??). Importantly, the dwell time distributions in the absence and presence of aurovertin are in good agreement with the results shown in Figure 5A and B. In the presence of ATP, the data yield a time constant for the decay component of τ = (27±4) ms with an additional apparent fast rise time component τ = (4±1) ms. Aurovertin inhibition was characterized by a slower rise time of τ = (16±8) ms plus the decay component of τ = (28±11) ms (see Supplementary Material).
DISCUSSION
While most reports have characterized aurovertin as an uncompetitive inhibitor of ATP hydrolysis 2,11,24,25, the data presented here demonstrate that aurovertin exhibits a special type of mixed inhibition, with aurovertin binding to both the enzyme species that build up under Vmax/Km and Vmax, with Ki values of 960 nM and 120 nM, respectively, and with residual catalytic activity remaining at saturating substrate and inhibitor, denoted in our proposed model by Vmax2 (see Figure 2A). For bovine F1Fo-ATPase, the maximal rate of catalysis at saturating inhibitor is approximately one-third the value of Vmax in the absence of inhibitor (see Table I).
The basis for the residual activity at saturating inhibitor has been debated. The proposed hypotheses to explain the catalytic activity in the presence of saturating concentrations of aurovertin have ranged from: (1) some ES particles lack bound aurovertin even at saturating concentrations of inhibitor 1; (2) one or two of the three β subunits in each F1 without aurovertin bound are still able to hydrolyze ATP 16; and (3) the presence of aurovertin in the β subunit(s) slows the critical binding change step or inhibits cooperativity between the three catalytic sites in each F1, but turnover still occurs 18,47. Our single molecule data are most consistent with this third hypothesis, the Walker model, as rotational catalysis still occurs, but at a slower rate, in F1Fo-ATPase complexes containing aurovertin. In either the presence or absence of aurovertin, the angular stopping positions for the γ subunit were broadened but similar, and the relative number of rotating enzymes was comparable. Dwell time analyses revealed aurovertin-bound ATPase has slower population kinetics for the catalytic state orientation of the γ subunit. As the rise time in the dwell time distribution histogram corresponds to the cooperative processes of ATP hydrolysis and product release in adjacent nucleotide binding sites, the data suggest a potential hindrance for ADP or Pi release. In a recent analysis of tentoxin inhibition of the F1 domain of cyanobacteria, it was shown that the ADP release step was prolonged in the presence of the drug 48. In principle, single-molecule FRET determination of the angular γ subunit position in F1Fo-ATPase should be sufficient to discriminate between the ATP cleavage step and the ADP release if shifted by a 40° rotation of γ. However, developments of enhanced observations times, brighter fluorophores and additional experimental controls like confirmation of the presence of the FRET acceptor fluorophore in each single enzyme by optimized alternating laser excitation schemes 49 are required.
As to the stoichiometry of aurovertin binding to F1, global fits of the kinetic data suggest that under low substrate concentrations, at least two aurovertin molecules can bind, while at high substrate concentrations, the cooperativity decreases to one, suggesting only one aurovertin molecule is bound. This stoichiometry is the same for both ATP hydrolysis and synthesis. While several reports have disagreed as to whether each F1 possesses one 12–14 or two 15–17 aurovertin binding sites, this work indicates that the result is influenced strongly by the assay conditions under which the stoichiometry is assessed.
Our data reveal that aurovertin is a mixed inhibitor of ATP synthesis, and, in contrast to ATP hydrolysis, the enzyme is inactive at saturating substrate and inhibitor concentrations. The aurovertin inhibition constants for the F1Fo-ATPase are also lower during ATP synthesis, with Ki(E) values decreasing 60-fold to 16 nM and Ki(ES) decreasing 5-fold to 25 nM suggesting that the inhibitor affinity is increased under these conditions. While previous studies have shown that aurovertin is a more potent inhibitor of ATP synthesis 2,19–22, the basis for this difference is not fully understood. In their work on the crystal structure of aurovertin in complex with bovine F1, Walker and co-workers proposed that the differential potency of aurovertin for ATP synthesis versus hydrolysis originated from the differential affinities of aurovertin for the βE site versus the βTP site, and the order of appearance of these conformational states in ATP hydrolysis versus synthesis 18.
However, the data presented here shows that the apparent of affinity of aurovertin for both sites is much higher during ATP synthesis than hydrolysis (i.e., Ki(E) and Ki(ES) are both lower in synthesis than hydrolysis, compare Tables I and II); thus, the differential affinity of aurovertin for the βE versus the βTP site may not account for the observed difference. Additionally, we find that during ATP synthesis or hydrolysis, inhibition is not cooperative, suggesting that there is only one molecule of aurovertin bound to each F1, and consequently, the binding affinity of aurovertin to this one site is likely the important determinant of the differential potencies (Ki(ES) = 120 nM vs. 25 nM for hydrolysis vs. synthesis; see Tables I and II). It is well known that ATP synthesis is not just a simple reversal of the catalytic process for ATP hydrolysis, and the conformation of the F1Fo-ATPase is significantly influenced by the presence of the proton gradient in ATP synthesis conditions 50–52. While the exact structural changes have yet to be precisely defined, such differences may account for the differential affinities of aurovertin for the β subunits in the two reaction states.
Taken together, this analysis suggests that the residual rate of ATP hydrolysis seen in the presence of saturating concentrations of aurovertin results from the fact that the compound, in its more loosely-bound state, can only slow the binding change mechanism by hindering catalytic site interactions. In contrast, the absence of this residual rate in the synthetic direction implies that, in its more tightly bound state during ATP synthesis, aurovertin halts the binding change by more completely hindering catalytic site crosstalk.
Supplementary Material
Acknowledgments
We thank B. Zimmermann, M. Diez and P. Graber (University of Freiburg) for FRET-labeled F1Fo-ATP synthase in liposomes and J. Wrachtrup (University of Stuttgart) for providing the single-molecule microscopy setup. Supported by Grants from the NIH (AI47450 to G.D.G. and GM40602 to C.A.F.) and the Deutsche Forschungsgemeinschaft (BO 1891/10-1 to M.B.).
Supported by Grants from the NIH (AI47450 to G.D.G. and GM40602 to C.A.F.) and the Deutsche Forschungsgemeinschaft (BO 1891/10-1 to M.B.)
ABBREVIATIONS
- SMP
Submitochondrial particles
- FRET
fluorescence resonance energy transfer
- HMM
Hidden Markov Model
References
- 1.Linnett PE, Beechey RB. Methods Enzymol. 1979;55:472–518. doi: 10.1016/0076-6879(79)55061-7. [DOI] [PubMed] [Google Scholar]
- 2.Lardy HA, Connelly JL, Johnson D. Biochemistry. 1964;3:1961–1968. doi: 10.1021/bi00900a030. [DOI] [PubMed] [Google Scholar]
- 3.Satre M, Klein G, Vignais PV. J Bacteriol. 1978;134:17–23. doi: 10.1128/jb.134.1.17-23.1978. [DOI] [PMC free article] [PubMed] [Google Scholar]
- 4.Verschoor GJ, van der Sluis PR, Slater EC. Biochim Biophys Acta. 1977;462:438–449. doi: 10.1016/0005-2728(77)90141-4. [DOI] [PubMed] [Google Scholar]
- 5.Douglas MG, Koh Y, Dockter ME, Schatz G. J Biol Chem. 1977;252:8333–8335. [PubMed] [Google Scholar]
- 6.Dunn SD, Futai M. J Biol Chem. 1980;255:113–118. [PubMed] [Google Scholar]
- 7.Satre M, Bof M, Vignais PV. J Bacteriol. 1980;142:768–776. doi: 10.1128/jb.142.3.768-776.1980. [DOI] [PMC free article] [PubMed] [Google Scholar]
- 8.Abrahams JP, Leslie AG, Lutter R, Walker JE. Nature. 1994;370:621–628. doi: 10.1038/370621a0. [DOI] [PubMed] [Google Scholar]
- 9.Issartel JP, Klein G, Satre M, Vignais PV. Biochemistry. 1983;22:3492–3497. doi: 10.1021/bi00283a028. [DOI] [PubMed] [Google Scholar]
- 10.Issartel JP, Klein G, Satre M, Vignais PV. Biochemistry. 1983;22:3485–3492. doi: 10.1021/bi00283a028. [DOI] [PubMed] [Google Scholar]
- 11.Chang T, Penefsky HS. J Biol Chem. 1973;248:2746–2754. [PubMed] [Google Scholar]
- 12.Berden JA, Voorn-Brouwer MM. Biochim Biophys Acta. 1978;501:424–439. doi: 10.1016/0005-2728(78)90110-x. [DOI] [PubMed] [Google Scholar]
- 13.van de Stadt RJ, van Dam K, Slater EC. Biochim Biophys Acta. 1974;347:224–239. doi: 10.1016/0005-2728(74)90047-4. [DOI] [PubMed] [Google Scholar]
- 14.Vadineanu A, Berden JA, Slater EC. Biochim Biophys Acta. 1976;449:468–479. doi: 10.1016/0005-2728(76)90156-0. [DOI] [PubMed] [Google Scholar]
- 15.Muller JL, Rosing J, Slater EC. Biochim Biophys Acta. 1977;462:422–437. doi: 10.1016/0005-2728(77)90140-2. [DOI] [PubMed] [Google Scholar]
- 16.Weber J, Senior AE. J Biol Chem. 1998;273:33210–33215. doi: 10.1074/jbc.273.50.33210. [DOI] [PubMed] [Google Scholar]
- 17.Wise JG, Latchney LR, Senior AE. J Biol Chem. 1981;256:10383–10389. [PubMed] [Google Scholar]
- 18.van Raaij MJ, Abrahams JP, Leslie AG, Walker JE. Proc Natl Acad Sci U S A. 1996;93:6913–6917. doi: 10.1073/pnas.93.14.6913. [DOI] [PMC free article] [PubMed] [Google Scholar]
- 19.Lee C, Ernster L. Eur J Biochem. 1968;3:391–400. doi: 10.1111/j.1432-1033.1967.tb19542.x. [DOI] [PubMed] [Google Scholar]
- 20.Lenaz G. Biochem Biophys Res Commun. 1965;21:170–175. doi: 10.1016/0006-291x(65)90104-x. [DOI] [PubMed] [Google Scholar]
- 21.Bertina RM, Schrier PI, Slater EC. Biochim Biophys Acta. 1973;305:503–518. doi: 10.1016/0005-2728(73)90072-8. [DOI] [PubMed] [Google Scholar]
- 22.Roberton AM, Holloway CT, Knight IG, Beechey RB. Biochem J. 1968;108:445–456. doi: 10.1042/bj1080445. [DOI] [PMC free article] [PubMed] [Google Scholar]
- 23.Roberton AM, Beechey RB, Holloway CT, Knight IG. Biochem J. 1967;104:54C–55C. doi: 10.1042/bj1040054c. [DOI] [PMC free article] [PubMed] [Google Scholar]
- 24.Cataldi de Flombaum MA, Stoppani AO. Mol Biochem Parasitol. 1981;3:143–155. doi: 10.1016/0166-6851(81)90045-1. [DOI] [PubMed] [Google Scholar]
- 25.Gledhill JR, Walker JE. Biochem J. 2005;386:591–598. doi: 10.1042/BJ20041513. [DOI] [PMC free article] [PubMed] [Google Scholar]
- 26.Ebel RE, Lardy HA. J Biol Chem. 1975;250:4992–4995. [PubMed] [Google Scholar]
- 27.Mitchell P, Moyle J. FEBS Lett. 1970;6:309–311. doi: 10.1016/0014-5793(70)80085-0. [DOI] [PubMed] [Google Scholar]
- 28.Issartel JP, Vignais PV. Biochemistry. 1984;23:6591–6595. doi: 10.1021/bi00321a048. [DOI] [PubMed] [Google Scholar]
- 29.van de Stadt RJ, van Dam K. Biochim Biophys Acta. 1974;347:240–252. doi: 10.1016/0005-2728(74)90048-6. [DOI] [PubMed] [Google Scholar]
- 30.Johnson KM, Chen X, Boitano A, Swenson L, Opipari AW, Jr, Glick GD. Chem Biol. 2005;12:485–496. doi: 10.1016/j.chembiol.2005.02.012. [DOI] [PubMed] [Google Scholar]
- 31.Johnson KM, Cleary J, Fierke CA, Opipari AW, Jr, Glick GD. ACS Chem Biol. 2006;1:304–308. doi: 10.1021/cb600143j. [DOI] [PubMed] [Google Scholar]
- 32.Etzold C, Deckers-Hebestreit G, Altendorf K. Eur J Biochem. 1997;243:336–343. doi: 10.1111/j.1432-1033.1997.0336a.x. [DOI] [PubMed] [Google Scholar]
- 33.Ding K, Alemdaroglu FE, Borsch M, Berger R, Herrmann A. Angew Chem Int Ed Engl. 2007;46:1172–1175. doi: 10.1002/anie.200603064. [DOI] [PubMed] [Google Scholar]
- 34.Diez M, Zimmermann B, Borsch M, Konig M, Schweinberger E, Steigmiller S, Reuter R, Felekyan S, Kudryavtsev V, Seidel CA, Graber P. Nat Struct Mol Biol. 2004;11:135–141. doi: 10.1038/nsmb718. [DOI] [PubMed] [Google Scholar]
- 35.Zarrabi N, Duser MG, Reuter R, Dunn SD, Wrachtrup J, Borsch M. Proc SPIE. 2007;6444:64440E. [Google Scholar]
- 36.Gao YQ, Yang W, Karplus M. Cell. 2005;123:195–205. doi: 10.1016/j.cell.2005.10.001. [DOI] [PubMed] [Google Scholar]
- 37.Gorris HH, Rissin DM, Walt DR. Proc Natl Acad Sci U S A. 2007;104:17680–17685. doi: 10.1073/pnas.0705411104. [DOI] [PMC free article] [PubMed] [Google Scholar]
- 38.Borsch M, Diez M, Zimmermann B, Reuter R, Graber P. FEBS Lett. 2002;527:147–152. doi: 10.1016/s0014-5793(02)03198-8. [DOI] [PubMed] [Google Scholar]
- 39.Zimmermann B, Diez M, Zarrabi N, Graber P, Borsch M. Embo J. 2005;24:2053–2063. doi: 10.1038/sj.emboj.7600682. [DOI] [PMC free article] [PubMed] [Google Scholar]
- 40.Duser MG, Bi Y, Zarrabi N, Dunn SD, Borsch M. J Biol Chem. 2008;283:33602–33610. doi: 10.1074/jbc.M805170200. [DOI] [PMC free article] [PubMed] [Google Scholar]
- 41.Borsch M, Turina P, Eggeling C, Fries JR, Seidel CA, Labahn A, Graber P. FEBS Lett. 1998;437:251–254. doi: 10.1016/s0014-5793(98)01247-2. [DOI] [PubMed] [Google Scholar]
- 42.Yasuda R, Noji H, Yoshida M, Kinosita K, Jr, Itoh H. Nature. 2001;410:898–904. doi: 10.1038/35073513. [DOI] [PubMed] [Google Scholar]
- 43.Sielaff H, Rennekamp H, Wachter A, Xie H, Hilbers F, Feldbauer K, Dunn SD, Engelbrecht S, Junge W. Proc Natl Acad Sci U S A. 2008;105:17760–17765. doi: 10.1073/pnas.0807683105. [DOI] [PMC free article] [PubMed] [Google Scholar]
- 44.Zimmermann B, Diez M, Borsch M, Graber P. Biochim Biophys Acta. 2006;1757:311–319. doi: 10.1016/j.bbabio.2006.03.020. [DOI] [PubMed] [Google Scholar]
- 45.Fischer S, Graber P, Turina P. J Biol Chem. 2000;275:30157–30162. doi: 10.1074/jbc.275.39.30157. [DOI] [PubMed] [Google Scholar]
- 46.Zarrabi N. Proceedings of SPIE. 2005;5699:175–188. [Google Scholar]
- 47.Gledhill JR, Walker JE. Biochem Soc Trans. 2006;34:989–992. doi: 10.1042/BST0340989. [DOI] [PubMed] [Google Scholar]
- 48.Meiss E, Konno H, Groth G, Hisabori T. J Biol Chem. 2008;283:24594–24599. doi: 10.1074/jbc.M802574200. [DOI] [PMC free article] [PubMed] [Google Scholar]
- 49.Zarrabi N. Proceedings of SPIE. 2008;6862:68620M. [Google Scholar]
- 50.Weber J, Senior AE. Biochim Biophys Acta. 2000;1458:300–309. doi: 10.1016/s0005-2728(00)00082-7. [DOI] [PubMed] [Google Scholar]
- 51.Weber J, Senior AE. FEBS Lett. 2003;545:61–70. doi: 10.1016/s0014-5793(03)00394-6. [DOI] [PubMed] [Google Scholar]
- 52.Galkin MA, Vinogradov AD. FEBS Lett. 1999;448:123–126. doi: 10.1016/s0014-5793(99)00347-6. [DOI] [PubMed] [Google Scholar]
Associated Data
This section collects any data citations, data availability statements, or supplementary materials included in this article.


