Abstract
The SLC38 family of solute transporters mediates the coupled transport of amino acids and Na+ into or out of cells. The structural basis for this coupled transport process is not known. Here, a profile-based sequence analysis approach was used, predicting a distant relationship with the SLC5/6 transporter families. Homology models using the LeuTAa and Mhp1 transporters of known structure as templates were established, predicting the location of a conserved Na+ binding site in the center of membrane helices 1 and 8. This homology model was tested experimentally in the SLC38 member SNAT2 by analyzing the effect of a mutation to Thr-384, which is predicted to be part of this Na+ binding site. The results show that the T384A mutation not only inhibits the anion leak current, which requires Na+ binding to SNAT2, but also dramatically lowers the Na+ affinity of the transporter. This result is consistent with a previous analysis of the N82A mutant transporter, which has a similar effect on anion leak current and Na+ binding and which is also expected to form part of the Na+ binding site. In contrast, random mutations to other sites in the transporter had little or no effect on Na+ affinity. Our results are consistent with a cation binding site formed by transmembrane helices 1 and 8 that is conserved among the SLC38 transporters as well as among many other bacterial and plant transporter families of unknown structure, which are homologous to SLC38.
The sodium-coupled neutral amino acid transporter, SNAT2,2 belongs to the SLC38 gene family of solute carrier proteins (1). Together with SNAT1 and -4 (2), it is believed to mediate Na+-dependent amino acid transport activity that was classically assigned to System A transporters (3–8). In addition to SNAT1 and -2, the SLC38 family has four other known members, two of which predominantly mediate glutamine transport (SNAT3 and -5, System N (9–11)). SNAT2 is widely expressed in mammalian tissue (1, 7), but it may play a particularly critical role in the brain (12), where it may help shuttle glutamine from astrocytes to neurons via the glutamate-glutamine cycle (1). This process is essential for recycling the neurotransmitter glutamate (13). However, the exact contribution of SNAT2 to the glutamate-glutamine cycle is still controversially discussed (14).
Despite this physiological importance, surprisingly little is known about the functional properties and the structural basis of amino acid transport by the SLC38 proteins. Although hydropathy analysis predicts 11 transmembrane helices (TMs), with an intracellular N terminus and an extracellular C terminus (1), it is not clear whether the transporters belong to a large superfamily of transporters, of which members have been characterized structurally through x-ray crystallography. At present, sequence homology has only been established with transporters of the mammalian SLC32 and SLC36 families as well as with the more distantly related plant auxin carriers and the bacterial amino acid-polyamine-organocation (APC) family (15, 16). High resolution crystal structures are not available for any of the transporters from these families, although low resolution projection structures were recently reported for the APC family members AdiC (17) and SteT (18). However, these structures do not allow the assignment of transmembrane helices. Thus, it remains unknown whether the SLC38 fold is similar to established transport protein folds, although homology to the major facilitator superfamily seems unlikely.
We have recently identified a conserved amino acid residue in SNAT2, Asn-82, which is involved in controlling the Na+ affinity of the transporter (19). Interestingly, Asn-82 is localized in the predicted TM1 of SNAT2. This first transmembrane helix was recently found to contribute ligands to a Na+ binding site in several bacterial transporters, which are related to the SLC5 (sodium glucose symporter) and SLC6 (sodium- and chloride-dependent neurotransmitter transporter) family members (20–22), which also comprises bacterial members (23, 24). Although sequence similarity with SLC5 and -6 is not detectable, SLC38 may be a member of a possibly very large superfamily with the same general fold, which also contains many amino acid transport proteins.
Here, we used a homology modeling approach based on profile-based sequence alignment (25, 26). A search against sequences deposited in the Protein Data Bank (PDB (27)) revealed that the transporters with the highest likelihood to share an analogous fold are a leucine transporter from Aquifex aeolicus, LeuTAa, and a homologous hydantoin transporter from Microbacterium liquefaciens, Mhp1. We established a homology model based on these structures, which predicts Asn-82 to be part of a Na+ binding site. Furthermore, another conserved hydrophilic amino acid residue in TM8, Thr-384, was predicted to be near this cation binding site. When Thr-384 was mutated to alanine, a dramatic loss of the affinity of SNAT2 for Na+ was observed, whereas mutations to other sites that were spatially removed from the predicted Na+ binding site had little or no effect on Na+ affinity. We hypothesize that the SLC38 family is a member of a large superfamily of cation/organic substrate transporters which includes the mammalian SLC5 and -6 proteins and which has a conserved cation binding site formed by TMs 1 and 8.
EXPERIMENTAL PROCEDURES
Sequence Analysis and Homology Modeling
Sequence-based multiple alignment procedures were ineffective due to the non-significant sequence homology between SLC38 transporters and LeuTAa and Mhp1. Therefore, we used a profile-based sequence alignment approach (HHSearch procedure (26, 28)). Searches were performed against the PDB or Scop70 (as a positive control, verifying that homology with proteins of unknown structure but known homology with SLC38 can be detected with the HHSearch algorithm). Outputs of the pairwise sequence alignments were used to create homology models with the Modeller software (29, 30). The resulting structure files were tested for quality with the ProQ program (31) and against the InterPro secondary structure prediction algorithm (32) to test for correct helical assignment of the transmembrane segments. For alignments of hydropathy profiles, gaps were either inserted into hydrophilic domains manually at the center between peaks, before alignment of the hydrophobic peaks or through the HHPred algorithm. Detection of internal repeats was performed by pairwise aligning the peptide sequence of each of the 11 TMs of SNAT2 against the remaining polypeptide sequence, with the respective TM removed. ClustalW was used for this purpose (Bioedit suite). We have also used REPRO for finding sequence duplications in SNAT3 (33).
Molecular Biology and Transient Expression
The SNAT2 expression construct consisted of the SNAT2 coding sequence in a modified pBK-CMV vector (Δ[1098–1300]) (Stratagene, La Jolla, CA) as described previously (34). cDNA encoding SNAT2 linked to the C terminus of yellow fluorescent protein (YFP) was obtained from GeneCopoeia. Site-directed mutagenesis was performed according to the QuikChange protocol (Stratagene) as described by the supplier. The primers for mutation experiments were obtained from Sigma. The complete coding sequences of mutated SNAT2 clones were sequenced. Transporter constructs were subsequently used for transient transfection of subconfluent human embryonic kidney cell (HEK293T/17, ATCC number CRL 11268) cultures using FuGENE 6 transfection reagent (Roche Applied Science) according to the instructions of the supplier. Electrophysiological recordings were performed between days 1 to 2 post-transfection.
Cell-surface Biotinylation
Biotinylation was performed essentially as described (35). In brief, transfected HEK293T cells were grown in 10-cm plates. After the washing steps, cells were incubated in 2 ml of biotinylation reagent (2 mg/ml, EZ-Link Sulfo-NHS-Biotin; Pierce) at 4 °C for 30 min while gently shaking. After washing, 100 mm glycine was added at 4 °C and incubated for 45 min to quench any unreacted biotin reagent. The cells were lysed by adding 1 ml of radioimmune precipitation assay buffer/lysis buffer (100 mm Tris, pH 7.4, 150 mm NaCl, 1 mm EDTA, 1% Triton X-100, 1% sodium deoxycholate, 0.1% SDS, plus protease inhibitors) to the cell and by subsequent vortexing for 1 h at 4 °C (although the intense vortexing resulted in generation of foam, this foam disappeared after subsequent centrifugation steps). After centrifugation at 20,000 × g for 10 min at 4 °C, the supernatant was transferred to a new tube. After adding 300 μl of 50% slurry avidin beads (Pierce) in phosphate-buffered saline to 300 μl of sample and keeping the sample at room temperature for 1 h, the beads were sedimented by centrifugation and washed with radioimmune precipitation assay buffer/lysis buffer six times, 1 ml each time. Protein was eluted from the beads by adding 150 μl of 2× Laemmli buffer (1× Laemmli buffer contains 62.5 mm Tris, pH 6.8, 2% SDS, 20% glycerol, and 5% 2-mercaptoethanol). Each fraction was adjusted to comparable volumes with Laemmli buffer and analyzed by Western blotting using green fluorescent protein antibody obtained from Clontech.
Amino Acid Uptake Assay
HEK293T cells were plated on collagen-coated 12-well plates (1 × 10⁵ cells/well) in Dulbecco's modified Eagle's medium containing 10% fetal bovine serum, penicillin (100 units/ml), streptomycin (100 μg/ml), and glutamine (4 mm). 48 h after transfection with vector, wild-type SNAT2, or SNAT2T384A cDNA, the cells were washed with uptake buffer 2 times. The uptake buffer contained 140 mm sodium methanesulfonate (NaMes), 2 mm magnesium methanesulfonate, 2 mm calcium gluconate, 30 mm Tris-Mes, pH 8.0, 5 mm glucose. The cells were then preincubated in the same buffer for 5 min at 37 °C before the buffer was removed and replaced with fresh buffer containing unlabeled α-methylamino-isobutyric acid (MeAIB) and 0.4 μCi of [14C]MeAIB (PerkinElmer Life Sciences; total concentration 40 μm). MeAIB was used as a transportable substrate instead of alanine, because unspecific uptake of [14C]alanine was too high in HEK293 cells (most likely caused by endogenous amino acid transporters other than SNAT2). After 1 min of incubation at room temperature, uptake was terminated by washing twice with 1 ml of uptake buffer on ice (after 1 min, uptake was in the linear range, as determined by quantifying the time dependence of uptake for times up to 5 min). The cells were then solubilized in 0.5 ml of 1% SDS, and radioactivity was measured by scintillation counting in 3 ml of scintillation fluid. The MeAIB uptake measurements were performed in duplicate.
Electrophysiology
Transport and anion currents were recorded using an Adams & List EPC7 amplifier under voltage-clamped conditions in the whole-cell current-recording mode. The typical resistance of the recording electrode was 2–3 megaohms. The series resistance (Rs) was 4–7 megaohms. RS was not compensated, because the whole-cell currents were small (typically <200 pA). Thus, series resistance (RS) compensation had a negligible effect on the magnitude of the currents (<4% error). The extracellular bath buffer solution contained 140 mm NaMes, 2 mm magnesium gluconate, 2 mm calcium gluconate, 30 mm Tris, pH 8.0. All experiments were conducted at an extracellular pH of 8.0 (maximal transport rate at this pH). For testing the Na+ dependence of the currents, Na+ in the extracellular solution was replaced with NMG+ (N-methylglucamine). For recording anion currents, the pipette solution contained 140 mm KSCN, 2 mm magnesium gluconate, 10 mm EGTA, 10 mm HEPES, pH 7.3. For transport current recording, the pipette contained 140 mm KMes, 2 mm magnesium gluconate, 10 mm EGTA, 10 mm HEPES, pH 7.3. The recorded currents were low-pass-filtered online at 1–10 kHz (Krohn-Hite 3200) and digitized with a digitizer board (Axon, Digidata 1200) at a sampling rate of 10–50 kHz, which was controlled by software (Axon PClamp). All experiments were performed at room temperature.
Solution Exchange
Solution exchange was performed essentially as described previously (36). Briefly, substrates were applied to a voltage-clamped HEK293T cell suspended at the tip of the current recording electrode with a quartz tube (opening diameter, 350 μm) positioned at a distance of ∼0.5 mm to the cell. The linear flow rate of the solutions emerging from the opening of the tube was ∼5–10 cm/s, resulting in minimal rise times of the whole-cell current of 30–50 ms (10–90%).
Data Analysis
Nonlinear regression fits of experimental data were performed with Origin (Microcal software, Northampton, MA) or Clampfit (pClamp8 software, Axon Instruments, Foster City, CA). Dose-response relationships of currents were fitted with a Michaelis-Menten-like equation, yielding Km and Imax. Endogenous electrogenic alanine transport activity in HEK293T cells, as measured by current recording from non-transfected cells, is minimal. Each experiment was performed in triplicate with at least two different cells. The error bars represent the mean ± S.D. unless stated otherwise.
RESULTS
The hypothesis to be tested in this work is that a cation binding site is conserved between the SLC5/6 and SLC38 solute carrier families, although they show no significant sequence identity or similarity. For example, a ClustalW sequence alignment between SNAT2 and LeuTAa shows an insignificant identity of 12%. Therefore, we used alternative methods to identify a potential relationship between SNAT2 and LeuTAa.
Evidence for Tandem Duplication of TMs 1–5 and 6–10
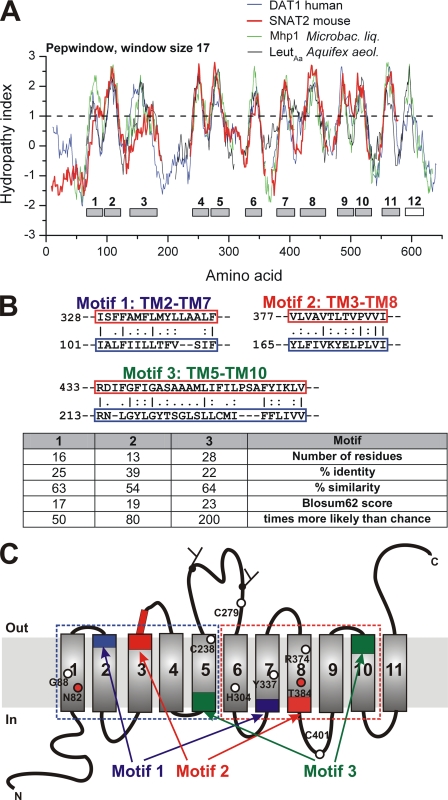
First, we applied hydropathy profile alignment (manual insertion of gaps, Fig. 1A, Kyte-Doolittle scale, (37), alignment through HHPred, supplemental Fig. 1) of SNAT2 with the dopamine transporter (DAT1) SLC6A3 and the bacterial transporters of known structure, LeuTAa and Mhp1 (21, 22). It has been previously suggested that hydropathy alignment is a useful tool for identifying distant relationships between membrane proteins (38, 39). Fig. 1A shows that the putative TMs 1–2, 4–5, and 9–10 occur in pairs for all of these transporters, being separated only by short hydrophilic segments. Second, TM3 in particular and also TM8 are long (predicted 25–30 amino acid residues). This suggests a tilted configuration of these SNAT2 TMs within the membrane bilayer, as found experimentally in LeuTAa and Mhp1 (21, 22). Third, TMs 1 and 6 contain many hydrophilic side chains with a peak hydropathy index of about 1.7 in all but one (Mhp1) transporter tested. Fourth, amino acid residues in TM11 are poorly conserved among members of the SLC38 family, indicating that this TM is not important for substrate transport, as suggested by the structure of LeuTAa (22).
FIGURE 1.
SLC38 transporters are predicted to be distantly related to the SLC5 and -6 transporter families. A, Kyte-Doolittle hydropathy index alignment of SNAT2 (red) with DAT1 (dopamine transporter), LeuTAa, and Mhp1. B, sequence alignments of three sequence repeats (motifs 1, 2, and 3) of SNAT2: identical residues (|), conservative substitutions (:), and similar residues (.) are indicated. The statistic evaluation of the alignments is shown in the table. C, predicted topology of SNAT2 with the sequence repeats shown in blue (motif 1), red (motif 2), and green (motif 3). The C-terminal half is shown as the blue dotted box and the N-terminal half as the red dotted box. The amino acid residues mutated are shown as circles (red circles indicate residues that affect Na+ affinity upon mutation).
LeuTAa and Mhp1 demonstrate sequence duplication of the TM 1–5 and 6–10 domains, which are inserted into the membrane in an inverted topology (21, 22). Therefore, we asked the question of whether such repeats can be detected in the SLC38 proteins. Evidence for internal repeats was obtained through sequence alignment of a respective transporter segment (a predicted TM domain) against the remaining protein (Fig. 1B). The most notable repeat was a 28-residue TM5-TM10 repeat (motif 3 in Fig. 1B). Two other, although shorter, repeats were found between TM2-TM7 and TM3-TM8 (Fig. 1B, motifs 1 and 2). These repeats, which are highlighted in Fig. 1C, map to the predicted SNAT2 topology as if TMs 1–5 and 5–10 were generated by sequence duplication, as proposed for LeuTAa and Mhp1 (21, 22). Statistical analysis shows that these repeats are 50–200-fold more likely compared with what would be expected by alignment to a random sequence (Fig. 1B, table). Moreover, alignment of the sequences of the C-terminal and the N-terminal halves of SNAT3 shows 16% sequence identity and 35% sequence similarity, consistent with tandem duplication. A hydropathy plot of an alignment of the N-terminal and C-terminal segments of SNAT2 is illustrated in supplemental Fig. 2, showing reasonable alignment for all predicted TM helices, except TMs 3 and 8. For all the above reasons, the general folding pattern of SNAT2 demonstrates evidence for tandem duplication and appears to mimic that of the known structure of the bacterial transporters that are related to the SLC5 and SLC6 families.
Homology Modeling Suggests a Relationship with SLC5/6 Transporters
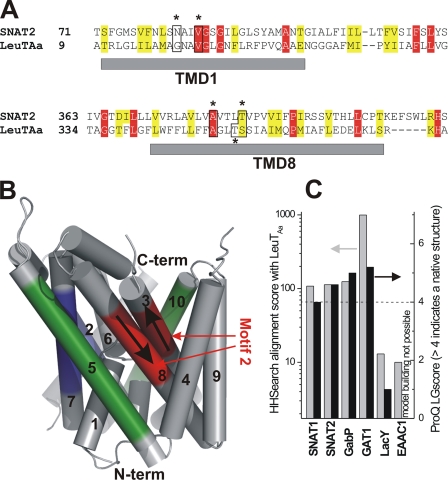
To further test the predicted distant relationship of SNAT2 and LeuTAa, we performed profile-based alignment using the HHSearch method, which has been shown to be efficient in finding distant relationships between protein families (26). The algorithm was run against the sequences deposited in the PDB, which contains LeuTAa and Mhp1. This search resulted in PDB structures 2A65 (LeuTAa) and 2JLN (Mhp1) as the most likely hits (21, 22), with a HHSearch score of 108 for SNAT2 alignment with LeuTAa. The alignment with LeuTAa resulted in sequence identity of 15% and similarity of 33%. The sodium galactose transporter, vSGLT (20), which is related to LeuTAa and Mhp1, was also found as a hit (supplemental Fig. 3B) as well as BetP (40). The helical domains predicted by this homology model fit well with helical segments from secondary structure prediction (supplemental Fig. 4). As a positive control for the algorithm, we used the human GABA (γ-aminobutyric acid) transporter sequence GAT1 (GABA transporter 1; SLC6), which is more closely related to LeuTAa and yielded a score of 995 (Fig. 2C). As a negative control, the Lac permease from Escherichia coli and GltPh from Pyrococcus horikoshii, which are not related to LeuTAa, yielded a score of 13 and less. The HHSearch score and those of GabP (γ-aminobutyric acid permease (41), APC family member related to SNAT2) and SNAT1 alignments are summarized in Fig. 2C. This profile-based alignment was then used to generate a homology model of SNAT2 using LeuTAa as the template (Fig. 2B, sequence of predicted TMs 1 and 8 shown in Fig. 2A). The model was validated with ProQ, resulting in an LGscore of 4.5 (Fig. 2C, energy minimized using Swissmod, LGScores >4 indicate native-like structures). LGscores of positive and negative controls are also shown in Fig. 2C, underscoring the validity of this homology modeling approach. Similar results were obtained for repeating this approach with Mhp1 as a template (supplemental Fig. 3A), although the LGscore was <4, indicating a non-native structure. Together with the results obtained for vSGLT and BetP (supplemental Fig. 3B), LeuTAa appears to be the best template for SNAT2 homology modeling. To summarize, the sequence analysis and homology modeling data predict that the SLC38 family is distantly related to the SLC5/6 families.
FIGURE 2.
A homology model of SNAT2 based on the structure of the template LeuTAa (PDB code 2A65). A, sequence alignment of TMs 1 and 8 (gray bars) of SNAT2 and LeuTAa (red, conserved residues; yellow, similar residues; black box and stars, residues proposed to contribute to cation binding. B, structural model obtained from homology modeling using LeuTAa as a template. The predicted repeats are indicated in color code as in Fig. 1, B and C. The arrows show the direction of the polypeptide chains for motif 2. C, scores from the HHSearch profile alignment with LeuTAa (gray bars, left axis) and LGscores from ProQ check of the resulting homology models (black bars, right axis). GabP, γ-aminobutyric acid (GABA) permease; GAT1, GABA transporter 1; EAAC1, excitatory amino acid carrier 1; LacY, lactose permease.
A Mutation to a Conserved Amino Acid Residue in Proximity to the Predicted Cation Binding Site Eliminates the Na+-induced Anion Leak Current
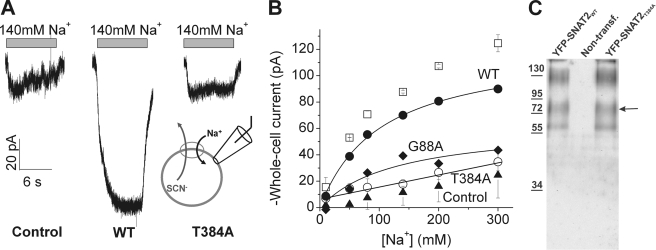
The homology model predicts that Asn-82, which has been shown previously to control Na+ interaction with SNAT2 (19), is in close proximity to one of the two Na+ binding sites of the template. In LeuTAa, two OH-containing amino acid side chains in TM8 (Thr-354, Ser-355) also contribute ligands to this Na+ binding site. Ser-355 aligns with a conserved threonine, Thr-384, of SNAT2 (Fig. 2A). Therefore, we tested whether mutation of Thr-384 to alanine affects Na+ interaction with SNAT2. It was previously shown that Na+ binding activates an uncoupled anion current in SNAT2, which is inhibited by subsequent amino acid binding (34). Consistently, Fig. 3A shows inward anion currents (SCN− outflow) generated by the application of 140 mm Na+ to the wild-type transporter (−110 ± 20 pA, n = 5). However, little anion current was observed for SNAT2T384A (−11 ± 2 pA, n = 6, Fig. 3A). In contrast to SNAT2WT, which has a dissociation constant for Na+ (KNa(app)) of 105 ± 8 mm (n = 5, Fig. 3B), increasing Na+ did not result in saturation of the anion current of the T384A-mutant transporter (Fig. 3B), suggesting that it cannot support anion current or that its interaction with Na+ is inhibited. This phenotype is similar to that found previously for SNAT2N82A (19).
FIGURE 3.
The T384A mutation inhibits the Na+-dependent anion leak current. A, comparison of typical leak anion currents induced by the application of 140 mm extracellular Na+ between non-transfected cells (control) and cells expressing mutant and wild-type SNAT2 (140 mm Na+ application indicated by the gray bars). B, leak anion currents as a function of extracellular Na+ for SNAT2T384A (○), SNAT2G88A (♦), and SNATWT (●) (solid symbols, after subtracting the nonspecific currents (▴); open symbols, original data before subtraction). The recording pipette contained 140 mm SCN−, and the membrane potential was 0 mV. C, Western blot of the cell-surface fraction of mutant (right lane) and wild-type (left lane) YFP-SNAT2 obtained through cell-surface protein biotinylation followed by isolation with avidin beads (Mr from markers are indicated on the left). The arrow indicates the expected Mr of the monomeric YFP-SNAT2 fusion. No bands were observed in the preparation from non-transfected cells (middle lane). The higher and lower molecular weight bands are most likely caused by aggregates and breakdown products, as common for fusion proteins.
A further possibility is that SNAT2T384A is not expressed in the plasma membrane. However, this possibility is unlikely because (i) cell surface expression of a yellow-fluorescent protein-tagged SNAT2T384A (YFP-SNAT2T384A) is not significantly changed compared with SNAT2WT (Fig. 3C), as determined by cell-surface biotinylation followed by Western blotting (YFP-SNAT2 is fully functional, not shown), (ii) expression patterns in the cell are unchanged compared with the wild-type transporter, as determined by immuno-cytochemistry (supplemental Fig. 5), and (iii) the mutant transporter supports transport current, as described later. Another mutation of a conserved residue in TM1, G88A, also decreased the maximum anion current but did not abolish it (KNa(app)) of 130 ± 15 mm, n = 5, Fig. 3B).
In SNAT2WT, application of alanine in the presence of extracellular Na+ leads to the inhibition of the anion leak current (34). However, no inhibition of anion leak current was seen in SNAT2T384A (supplemental Fig. 6), although alanine binds to the transporter at 10 mm concentration (see below). Together, these results suggest that the T384A mutation prevents anions form permeating the transporter, like previously found for SNAT2N82A.
The T384A Mutation Interferes with Substrate Transport
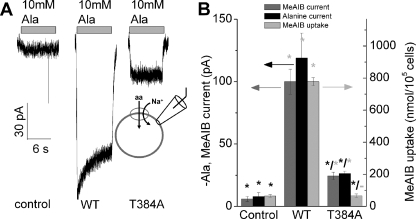
To further test the mechanism of the T384A mutational effect, we determined SNAT2 transport currents induced by 10 mm alanine. Although a significant transport current was observed in SNAT2T384A-expressing cells (340% over control), this current was significantly reduced versus SNAT2WT current (22% of WT, Fig. 4, A and B). These currents are caused by substrate transport and not by leak conductances, as demonstrated in supplemental Fig. 7. The alanine transport current data were supported by current recording and uptake experiments using the specific System A transportable substrate MeAIB, which showed no significant uptake activity (Fig. 4B). MeAIB is transported by SNAT2WT at a rate of 85% that of alanine, as indicated by current recordings (Fig. 4B). These results suggest that the T384A mutation interferes with the ability of SNAT2 to transport amino acid, as previously found for the N82A mutation (19). However, MeAIB uptake may be also impaired in SNAT2T384A because it binds with very low affinity (KAA(app) = 95 mm, supplemental Fig. 8).
FIGURE 4.
Mutations to position 384 inhibit alanine transport currents and amino acid uptake. A, typical transport currents induced by application of 10 mm alanine to non-transfected (control) and SNAT2WT-, and SNAT2T384A-expressing cells. The bath solution contained 140 mm NaMes, and the pipette solution contained 140 mm KMes at 0-mV transmembrane potential. B, average 10 mm alanine- and MeAIB-induced transport currents (black and gray bars, left axis) and MeAIB uptake (light gray bars, right axis) in HEK293T cells transiently transfected with vector (pBK-CMV (Δ[1098–1300]), SNAT2 wild-type, and SNAT2T384A cDNA. Transport of [14C]MeAIB (40 μm) was measured at 1 min in NaMes-containing buffer. Leak currents were subtracted. The comparatively large error bar of the currents in the SNAT2WT-expressing cells is caused by the up to 3-fold differences in expression levels between different cells. The black stars (*) indicate statistical significance compared with SNAT2WT at the p < 0.05 level, as determined by one-way analysis of variance followed by Tukey's post-hoc analysis. Statistical significance versus control currents/uptake is illustrated by the gray star (*). −, no error analysis performed.
Effect of the T384A Mutation on Substrate Affinity
The amino acid and the co-transported Na+ ion were proposed to bind to their extracellular binding sites in an ordered sequence, with Na+ binding first and amino acid binding second (4, 19, 34), as shown in the following scheme 1.
 |
SCHEME 1 |
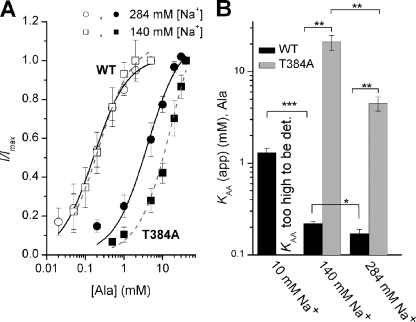
Although alternative, random order substrate binding schemes cannot be fully ruled out, it is, however, clear that Na+ does not require bound amino acid to interact with SNAT2 (19, 34). According to this Na+-first binding scheme, defective Na+ binding to a mutant transporter with a high KNa as well as defective amino acid interaction should result in a high apparent KAA(app) for alanine binding, according to,
 |
where KAA is the intrinsic dissociation constant of SNAT2 for amino acid. KAA(app)WT was reduced by a factor of 1.3 ± 0.1 when doubling Na+ from 140 to 284 mm (Fig. 5A and B), consistent with an intrinsic KNa of 115 mm (measured KNa(app) = 105 mm). In contrast, doubling Na+ resulted in a more than 2-fold reduction of the KAA(app) of SNAT2T384A for alanine (Fig. 5, A and B), suggesting an intrinsic KNa of >5 m from Equation 1. Thus, these data suggest that impaired Na+ binding indirectly results in an increased apparent KAA(app) of the transporter. For SNAT2WT, a third data point for KAA(app) = 1.3 ± 0.15 mm was collected at 10 mm extracellular Na+ (Fig. 5B). This data fit well with the intrinsic KNa value listed above (expected KAA(app) = 1.6 mm). For SNAT2T384A, the KAA(app) was too high to be reliably determined, as expected KAA(app) = 160 mm at 10 mm Na+.
FIGURE 5.
Increasing extracellular Na+ causes differential effects on the apparent affinity of SNAT2WT and SNAT2T384A for alanine. A, KAA(app) of SNAT2T384A and SNAT2WT for alanine was determined by recording substrate-induced transport current as a function of alanine concentration in the presence of 140 and 284 mm extracellular NaMes at 0 mV. SNAT2WT, □ at 140 mm Na+ and ○ at 284 mm Na+; SNAT2T384A, ■ at 140 mm Na+ and ● at 284 mm Na+. B, comparison of KAA(app) for l-alanine of SNAT2T384A and SNAT2WT in the presence of 10, 140, and 284 mm extracellular Na+. Two-way analysis of variance indicates a significant difference between the KAA(app) for SNAT2WT and T384A as well as a significant difference between the KAA(app) values at 140 and 284 mm Na+ (at the p < 0.05 level, indicated by the stars.
Effect of the T384A Mutation on Voltage Dependence of Transport
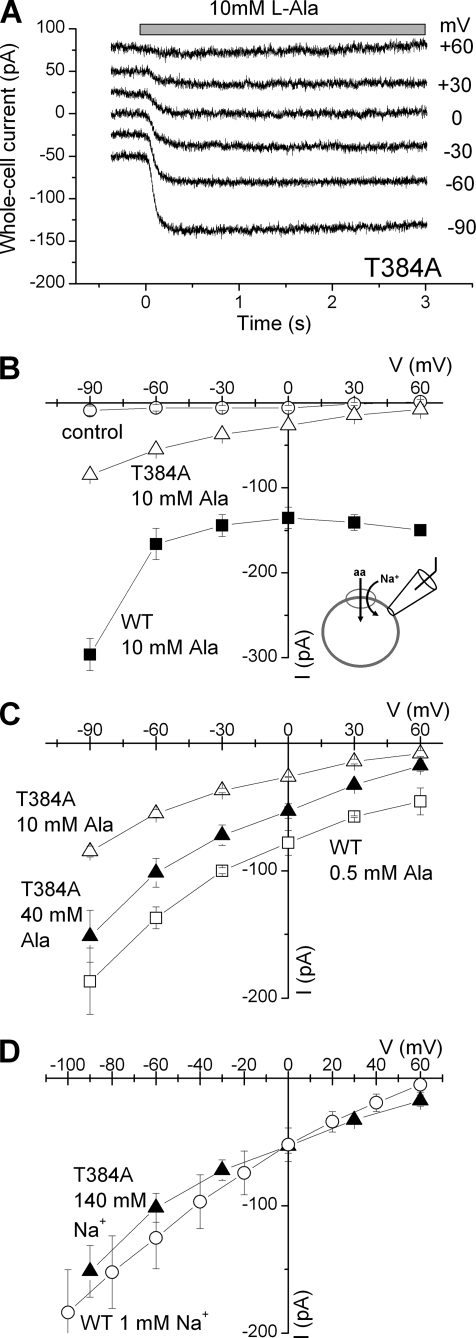
Although SNAT2T384A alanine transport currents (10 mm alanine, 140 mm Na+) were small at 0 mV, they increased exponentially at increasingly negative transmembrane potential (Fig. 6, A and B). In contrast, the IV relationship of SNAT2WT is more complex, showing little voltage dependence at voltages of −30 mV and above and steeper voltage dependence at more negative voltages. This may indicate a change in the rate-limiting step. This IV relationship was altered when the extracellular alanine concentration was reduced from 10 mm (saturating concentration) to 0.5 mm (70% saturation, Fig. 6, B and C). A reduction of Na+ to 1 mm (20 mm alanine) had a similar effect (Fig. 6D). The IV relationship of SNAT2T384A transport currents at 140 mm Na+ and 40 mm alanine (70% saturation) was very similar in slope to those of the WT transporter at the same saturation level. Thus, the T384A mutation does not change the intrinsic voltage dependence of SNAT2 transport, consistent with being a non-charge-altering mutation. However, the apparent voltage dependence is increased because the Na+ and/or the alanine binding sites are not saturated.
FIGURE 6.
Transport current-voltage relationships (induced by l-alanine application) of SNAT2T384A and SNAT2WT. A, voltage dependence of typical alanine-induced transport currents for SNAT2T384A. B, average current-volt age relationships of 10 mm alanine-induced transport currents in non-transfected cells (control, open circles) as well as SNAT2T384A (open triangles)- and SNAT2WT-expressing cells (solid squares). C, average current-voltage relationships of 10 mm alanine-induced (open triangles) and 40 mm alanine-induced transport currents (solid triangles) in SNAT2T384A and 0.5 mm alanine-induced transport currents (open squares) in SNAT2WT in the presence of 140 mm extracellular Na+. D, average current-voltage relationships in the presence of 40 mm alanine concentration and 140 mm Na+ in SNAT2T384A (solid triangles) and in the presence of 20 mm alanine concentration and 1 mm Na+ in SNAT2WT (open circles).
The T384A Mutation Strongly Interferes with Na+ Interaction with SNAT2
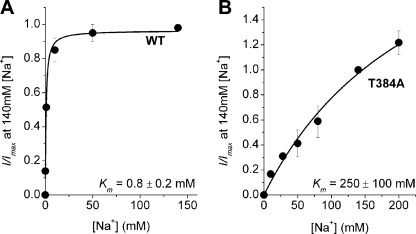
To measure the KNa of wild-type and mutant SNAT2 directly, we determined the alanine-induced transport current as a function of extracellular Na+ at an alanine concentration of 20 mm (Fig. 7A). The apparent KNa(app) of SNAT2WT was 800 ± 200 μm (alanine-bound transporter, n = 5), consistent with an intrinsic KAA of 140 μm and a KNa of 115 mm (determined in, Table 1) according to the equation,
 |
FIGURE 7.
The T384A mutation results in a dramatic reduction of the apparent affinity of SNAT2 for Na+. The apparent affinities of SNAT2WT (A) and SNAT2T384A (B) for extracellular Na+ were measured by recording 20 mm l-alanine-induced transport current as a function of extracellular Na+ at a membrane potential of 0 mV (140 mm Mes−, extracellular solution, 140 mm KMes intracellular solution).
TABLE 1.
Intrinsic dissociation constants of SNAT2 transporters for alanine and Na+
The ranges of KAA and KNa given for SNAT2T384A all resulted in similar deviations of the theoretical data from the experimental data set, as determined by a least squares minimization approach using Equations 1 and 2.
| SNAT2WT | SNAT2T384A | |
|---|---|---|
| KAA (μm), alanine | 140 | 80–120 |
| KNa (mm) | 115 | 15,000–20,000 |
In contrast, the apparent KNa(app) of SNAT2T384A was increased ∼800-fold to 250 ± 100 mm (n = 6, Fig. 7B). The intrinsic dissociation constants that are in best agreement with the WT and mutant data shown in (using a least squares minimization approach with both Equations 1 and 2 at two Na+ concentrations of 140 and 284 mm) are listed in Table 1, indicating that the T384A mutation has a dramatic effect on the intrinsic KNa (at least 130-fold increase compared with SNAT2WT) but only little effect on KAA.
Mutations to Sites Other Than Asn-82 and Thr-384 Have Little Effect on Na+ Binding
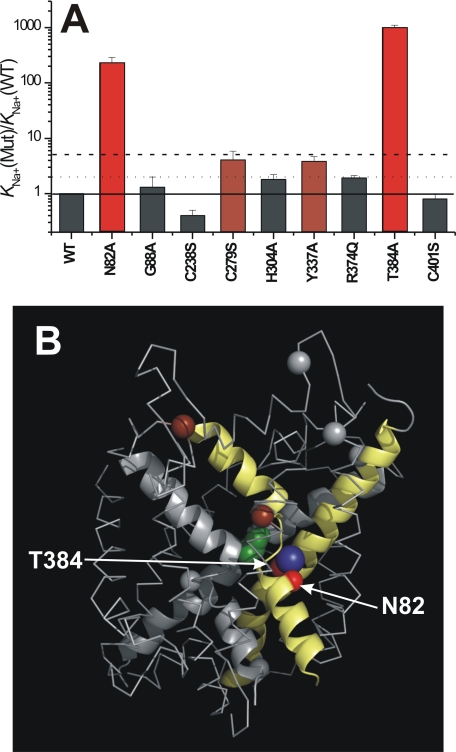
The results described so far implicate amino acids in positions 82 and 384 to be involved in controlling Na+ affinity, consistent with being part of a predicted Na+ binding site. To test whether this effect on affinity is specific to this binding site or whether it is caused unspecifically also by other mutations, we determined the Na+ dissociation constants of a number of other, randomly chosen mutated transporters (Fig. 8A). Although two of the mutated transporters, SNAT2Y337A (19) and SNAT2C279S, changed KNa moderately, between 2- and 5-fold, the other 5 tested mutations had little (less than 2-fold) effect on KNa. These results suggest that the dramatic increase of KNa is specific for the mutations to the predicted Na+ binding site.
FIGURE 8.
Validating the location of the Na+ binding site in SNAT2, which is predicted by the homology model, with mutagenesis mapping. A, KNa values for Na+ binding for wild-type SNAT2 and mutant transporters (mutations are indicated at the bottom, V = 0 mV). Color codes: the KNa(Mut) was increased <2-fold versus KNa(WT) (gray bars), 2–5-fold (brown bars), and >5 fold (red bars) by the specific mutation. B, mapping of the effect of mutations according to the color code shown in A onto a structural model obtained by homology modeling of SNAT2 using LeuTAa as the template. The alanine substrate (only Cα shown) in its hypothetical binding position is shown in green, Na+ in its hypothetical binding site (Na2 of LeuTAa) is shown in blue. Only the backbone carbon atoms are shown for each mutation. TMs 1 and 8 (yellow) and 3 and 6 (gray) are emphasized in schematic representation.
DISCUSSION
Here, we propose a distant relationship between the transporters belonging to the mammalian SLC38 family and those of the SLC5 and -6 families, of which the general structural folding pattern is known, harboring a conserved cation binding site within the transmembrane domain. Like the SLC5/6 counterparts, the SLC38 transporters appear to have evolved trough tandem duplication of an ancestral protein with 5 transmembrane helices, resulting in topological inversion of the C-terminal 5 TMs (Fig. 1C). However, in contrast to the SLC6 family and LeuTAa and Mhp1 (21, 22), TM12 is missing in the SLC38 family, resulting in an extracellular C terminus. Because the LeuTAa and Mhp1 structures predict TMs 11 and 12 to be spatially removed from the translocation pathway, these helices are not likely to be essential for transporter function. Consistently, amino acids in TM11 are the least conserved among the SLC38 family members. It should be also noted that many bacterial SLC6 sequences predict 11 TM helices.
Based on the proposed distant relationship, we generated a homology model of SNAT2 using LeuTAa and Mhp1 as the templates to test for the general folding pattern of SNAT2. This homology model is intended to provide information on the backbone fold of the SNAT2 poly peptide chain to indicate amino acid residues as targets for mutagenesis studies. The model is not expected to provide the detailed location of amino acid side chains. Because LeuTAa and Mhp1 both have a conserved Na+ binding site (21, 22), we checked for conserved amino acid residues in the SNAT2 homology model that may contribute ligands to this binding site. We identified Asn-82 in TM1 and Thr-384 in TM8 (Fig. 2, A and B), both of which are conserved throughout the SLC38 family (supplemental Fig. 9). Although in LeuTAa and Mhp1 TM1 contributes only backbone carbonyls as ligands to the Na+ binding site (21, 22), TM8 contributes two side chain ligands, one of which is conserved in the profile-based sequence alignment between SNAT2 and LeuTAa (SNAT2 Thr-384, Fig. 2A).
We have also used sequence alignment of transporters from the APC family, which is known to be related to SLC38 (16), with LeuTAa and Mhp1 (Fig. 2C and supplemental Fig. 3). The APC transporters are also predicted to have a similar general fold as the SLC6 transporters, as hypothesized recently by Lolkema and Slotboom (42). However, they appear to be more closely related to Mhp1, because the proposed cation binding motifs in TMs 1 and 8 are fully conserved in some of the APC transporters. This binding motif consists of the AXXI motif in TM1 and the S(T)S(T) motif in TM8.
The LeuTAa and Mhp1-based homology models were verified experimentally, as shown in Fig. 8B. We used a mutagenesis mapping approach, illustrating the effect of mutations on Na+ binding to SNAT2. The mutations generating the largest effect on KNa (>5-fold) are indicated in red. Clearly, these mutations map to the predicted cation binding site on the homology model, although mutations to other sites have little or no effect on KNa. We reported previously that mutations to Asn-82, which is part of the predicted cation binding site, strongly reduce the affinity of SNAT2 for Na+. These results are consistent with mutagenesis data from SNAT3, in which the analogous and conserved residue N76 abolishes substrate transport (43). Here, we have extended these studies to Thr-384, which is critical for Na+ interaction, but which differs from the Asn-82 mutations in that substrate transport is still possible. In fact, increasing the Na+ concentration to increase saturation of the Na+ binding site significantly increases transport current, whereas this was not the case in SNAT2N82A (19). This result points to a more subtle effect of the T384A mutation.
Although the detailed geometry of the SNAT2 Na+ binding site cannot be directly determined through our mutagenesis and homology modeling studies, we propose a hypothetical structural model, shown in supplemental Fig. 10. In this model Asn-82 coordinates the cation with its main-chain carbonyl oxygen as well as with its side-chain oxygen. Interestingly, the critical part of TM8 has only one side-chain hydroxyl as a ligand, in contrast to two OH ligands in LeuTAa. The most likely explanation for this difference is that the SNAT2 Asn-82 side-chain amide oxygen substitutes for the missing serine (threonine) side chain ligand in position 385 (supplemental Fig. 10). Thus, the hypothesized SNAT2 cation binding site has a coordination number of 5, in analogy with LeuTAa and Mhp1 (21, 22). We calculated the valence of this hypothetical Na+ binding site using an empirical approach (Ref. 44, supplemental information to Fig. 10), yielding a value of 1.07 for Na+ as a ligand. This is in excellent agreement with expected valences for Na+ binding sites (44). The proposed Na+ binding site does not involve cation coordination contributed by the amino acid substrate. Therefore, it may be possible that the amino acid can bind in the absence of cation, although most likely with low affinity.
Further evidence for a relationship between SLC38 and SLC5/6 family members comes from studying functional properties and the transport mechanisms of the transporters. In many members of the SLC5/6 families, it was found that electrogenic Na+ binding and/or a conformational change induced by this Na+ binding are a major contributor to the voltage dependence of the overall transport process (45–47). Furthermore, sequential binding of at least one Na+ ion followed by binding of the organic substrate is a common feature of proposed transport mechanisms (46, 47). System A transporters share those mechanistic features (4, 19, 34, 48), suggesting that mechanism is conserved in these distantly related transporters, whereas the polypeptide sequence has diverged greatly. Therefore, detecting distant transporter family relationships by studying mechanism may be more useful than relying only on genetic sequence comparison approaches.
SNAT2 was shown to be associated with an anion conductance, which is activated by Na+ binding to the transporter and which is inhibited by the binding of the amino acid substrate (34). This is an uncoupled conductance, with anion flux being only determined by the electrochemical driving force for the anion but not the transported cation/substrate. Mutations to amino acids Asn-82 and Thr-384, which are part of the predicted cation binding site, abolish this anion conductance (Fig. 3 and supplemental Fig. 6). Therefore, it is likely that these sites not only control Na+ affinity and coupled cation/substrate movement but also uncoupled current components.
While this work was under review two x-ray structures of a bacterial arginine:agmatine antiporter from the APC family were published (49, 50). These structures confirm our proposal of a similar structural fold of the SLC5–6 and the APC/SLC38 transporters.
To summarize, the present study provides theoretical and experimental support for a distant relationship between members of the SLC38 and SLC5/6 families of transporters. Our results predict the existence of a conserved cation binding site, formed by amino acid residues contributed by transmembrane helices 1 and 8. A homology model was generated that allows the prediction of amino acid residues involved in binding of the amino acid substrate, facilitating future structure-function studies on SLC38 transporters and the generation of molecular models that allow the design of drugs acting on the SLC38 proteins.
Supplementary Material
Acknowledgment
We thank Dr. Diez-Sampedro for help with the MeAIB uptake.
This work was supported, in whole or in part, by National Institutes of Health Grant 7R01NS049335-05 (to C. G.).

The on-line version of this article (available at http://www.jbc.org) contains supplemental Figs. 1–10.
- SNAT
- sodium-coupled amino acid transporter
- SLC
- solute carrier
- TM
- transmembrane domain
- CMV
- cytomegalovirus
- Mes
- methanesulfonate
- MeAIB
- α-methylamino-isobutyric acid
- HEK
- human embryonic kidney
- APC
- amino acid/polyamine/organocation
- LeuTAa
- leucine transporter
- Mhp1
- hydantoin permease
- vSGLT
- sodium galactose transporter
- YFP
- yellow fluorescent protein
- NaMes
- sodium methanesulfonate
- WT
- wild type.
REFERENCES
- 1.Mackenzie B., Erickson J. D. (2004) Pflugers Arch. 447, 784–795 [DOI] [PubMed] [Google Scholar]
- 2.Sugawara M., Nakanishi T., Fei Y. J., Martindale R. G., Ganapathy M. E., Leibach F. H., Ganapathy V. (2000) Biochim. Biophys. Acta 1509, 7–13 [DOI] [PubMed] [Google Scholar]
- 3.Varoqui H., Zhu H., Yao D., Ming H., Erickson J. D. (2000) J. Biol. Chem. 275, 4049–4054 [DOI] [PubMed] [Google Scholar]
- 4.Mackenzie B., Schäfer M. K., Erickson J. D., Hediger M. A., Weihe E., Varoqui H. (2003) J. Biol. Chem. 278, 23720–23730 [DOI] [PubMed] [Google Scholar]
- 5.Sugawara M., Nakanishi T., Fei Y. J., Huang W., Ganapathy M. E., Leibach F. H., Ganapathy V. (2000) J. Biol. Chem. 275, 16473–16477 [DOI] [PubMed] [Google Scholar]
- 6.Reimer R. J., Chaudhry F. A., Gray A. T., Edwards R. H. (2000) Proc. Natl. Acad. Sci. U.S.A. 97, 7715–7720 [DOI] [PMC free article] [PubMed] [Google Scholar]
- 7.Yao D., Mackenzie B., Ming H., Varoqui H., Zhu H., Hediger M. A., Erickson J. D. (2000) J. Biol. Chem. 275, 22790–22797 [DOI] [PubMed] [Google Scholar]
- 8.Chaudhry F. A., Schmitz D., Reimer R. J., Larsson P., Gray A. T., Nicoll R., Kavanaugh M., Edwards R. H. (2002) J. Neurosci. 22, 62–72 [DOI] [PMC free article] [PubMed] [Google Scholar]
- 9.Chaudhry F. A., Reimer R. J., Krizaj D., Barber D., Storm-Mathisen J., Copenhagen D. R., Edwards R. H. (1999) Cell 99, 769–780 [DOI] [PubMed] [Google Scholar]
- 10.Fei Y. J., Sugawara M., Nakanishi T., Huang W., Wang H., Prasad P. D., Leibach F. H., Ganapathy V. (2000) J. Biol. Chem. 275, 23707–23717 [DOI] [PubMed] [Google Scholar]
- 11.Nakanishi T., Sugawara M., Huang W., Martindale R. G., Leibach F. H., Ganapathy M. E., Prasad P. D., Ganapathy V. (2001) Biochem. Biophys. Res. Commun. 281, 1343–1348 [DOI] [PubMed] [Google Scholar]
- 12.Hertz L. (1979) Prog. Neurobiol. 13, 277–323 [DOI] [PubMed] [Google Scholar]
- 13.Daikhin Y., Yudkoff M. (2000) J. Nutr. 130, 1026S–1031S [DOI] [PubMed] [Google Scholar]
- 14.Grewal S., Defamie N., Zhang X., De Gois S., Shawki A., Mackenzie B., Chen C., Varoqui H., Erickson J. D. (2009) J. Biol. Chem. 284, 11224–11236 [DOI] [PMC free article] [PubMed] [Google Scholar]
- 15.Jack D. L., Paulsen I. T., Saier M. H. (2000) Microbiology 146, 1797–1814 [DOI] [PubMed] [Google Scholar]
- 16.Young G. B., Jack D. L., Smith D. W., Saier M. H., Jr. (1999) Biochim. Biophys. Acta 1415, 306–322 [DOI] [PubMed] [Google Scholar]
- 17.Casagrande F., Ratera M., Schenk A. D., Chami M., Valencia E., Lopez J. M., Torrents D., Engel A., Palacin M., Fotiadis D. (2008) J. Biol. Chem. 283, 33240–33248 [DOI] [PMC free article] [PubMed] [Google Scholar]
- 18.Reig N., del Rio C., Casagrande F., Ratera M., Gelpí J. L., Torrents D., Henderson P. J., Xie H., Baldwin S. A., Zorzano A., Fotiadis D., Palacín M. (2007) J. Biol. Chem. 282, 13270–13281 [DOI] [PubMed] [Google Scholar]
- 19.Zhang Z., Gameiro A., Grewer C. (2008) J. Biol. Chem. 283, 12284–12292 [DOI] [PMC free article] [PubMed] [Google Scholar]
- 20.Faham S., Watanabe A., Besserer G. M., Cascio D., Specht A., Hirayama B. A., Wright E. M., Abramson J. (2008) Science 321, 810–814 [DOI] [PMC free article] [PubMed] [Google Scholar]
- 21.Weyand S., Shimamura T., Yajima S., Suzuki S., Mirza O., Krusong K., Carpenter E. P., Rutherford N. G., Hadden J. M., O'Reilly J., Ma P., Saidijam M., Patching S. G., Hope R. J., Norbertczak H. T., Roach P. C., Iwata S., Henderson P. J., Cameron A. D. (2008) Science 322, 709–713 [DOI] [PMC free article] [PubMed] [Google Scholar]
- 22.Yamashita A., Singh S. K., Kawate T., Jin Y., Gouaux E. (2005) Nature 437, 215–223 [DOI] [PubMed] [Google Scholar]
- 23.Androutsellis-Theotokis A., Goldberg N. R., Ueda K., Beppu T., Beckman M. L., Das S., Javitch J. A., Rudnick G. (2003) J. Biol. Chem. 278, 12703–12709 [DOI] [PubMed] [Google Scholar]
- 24.Quick M., Yano H., Goldberg N. R., Duan L., Beuming T., Shi L., Weinstein H., Javitch J. A. (2006) J. Biol. Chem. 281, 26444–26454 [DOI] [PubMed] [Google Scholar]
- 25.Jung I., Lee J., Lee S. Y., Kim D. (2008) BMC Bioinformatics 9, 298. [DOI] [PMC free article] [PubMed] [Google Scholar]
- 26.Söding J. (2005) Bioinformatics 21, 951–960 [DOI] [PubMed] [Google Scholar]
- 27.Berman H. M., Westbrook J., Feng Z., Gilliland G., Bhat T. N., Weissig H., Shindyalov I. N., Bourne P. E. (2000) Nucleic Acids Res. 28, 235–242 [DOI] [PMC free article] [PubMed] [Google Scholar]
- 28.Jones D. T. (1999) J. Mol. Biol. 292, 195–202 [DOI] [PubMed] [Google Scholar]
- 29.Eswar N., John B., Mirkovic N., Fiser A., Ilyin V. A., Pieper U., Stuart A. C., Marti-Renom M. A., Madhusudhan M. S., Yerkovich B., Sali A. (2003) Nucleic Acids Res. 31, 3375–3380 [DOI] [PMC free article] [PubMed] [Google Scholar]
- 30.Pieper U., Eswar N., Webb B. M., Eramian D., Kelly L., Barkan D. T., Carter H., Mankoo P., Karchin R., Marti-Renom M. A., Davis F. P., Sali A. (2009) Nucleic Acids Res. 37, D347–354 [DOI] [PMC free article] [PubMed] [Google Scholar]
- 31.Wallner B., Elofsson A. (2003) Protein Sci. 12, 1073–1086 [DOI] [PMC free article] [PubMed] [Google Scholar]
- 32.Zdobnov E. M., Apweiler R. (2001) Bioinformatics 17, 847–848 [DOI] [PubMed] [Google Scholar]
- 33.George R. A., Heringa J. (2000) Trends Biochem. Sci. 25, 515–517 [DOI] [PubMed] [Google Scholar]
- 34.Zhang Z., Grewer C. (2007) Biophys. J. 92, 2621–2632 [DOI] [PMC free article] [PubMed] [Google Scholar]
- 35.Tao Z., Grewer C. (2007) J. Gen. Physiol. 129, 331–344 [DOI] [PMC free article] [PubMed] [Google Scholar]
- 36.Grewer C., Watzke N., Wiessner M., Rauen T. (2000) Proc. Natl. Acad. Sci. U.S.A. 97, 9706–9711 [DOI] [PMC free article] [PubMed] [Google Scholar]
- 37.Kyte J., Doolittle R. F. (1982) J. Mol. Biol. 157, 105–132 [DOI] [PubMed] [Google Scholar]
- 38.Clements J. D., Martin R. E. (2002) Eur. J. Biochem. 269, 2101–2107 [DOI] [PubMed] [Google Scholar]
- 39.Lolkema J. S., Slotboom D. J. (1998) FEMS Microbiol. Rev. 22, 305–322 [DOI] [PubMed] [Google Scholar]
- 40.Ressl S., Terwisscha van Scheltinga A. C., Vonrhein C., Ott V., Ziegler C. (2009) Nature 458, 47–52 [DOI] [PubMed] [Google Scholar]
- 41.Hu L. A., King S. C. (1998) Biochem. J. 336, 69–76 [DOI] [PMC free article] [PubMed] [Google Scholar]
- 42.Lolkema J. S., Slotboom D. J. (2008) Mol. Membr. Biol. 25, 567–570 [DOI] [PubMed] [Google Scholar]
- 43.Schneider H. P., Bröer S., Bröer A., Deitmer J. W. (2007) J. Biol. Chem. 282, 3788–3798 [DOI] [PubMed] [Google Scholar]
- 44.Nayal M., Di Cera E. (1996) J. Mol. Biol. 256, 228–234 [DOI] [PubMed] [Google Scholar]
- 45.Li M., Farley R. A., Lester H. A. (2002) FEBS Lett. 513, 247–252 [DOI] [PubMed] [Google Scholar]
- 46.Loo D. D., Hazama A., Supplisson S., Turk E., Wright E. M. (1993) Proc. Natl. Acad. Sci. U.S.A. 90, 5767–5771 [DOI] [PMC free article] [PubMed] [Google Scholar]
- 47.Lu C. C., Hilgemann D. W. (1999) J. Gen. Physiol. 114, 445–457 [DOI] [PMC free article] [PubMed] [Google Scholar]
- 48.Chaudhry F. A., Krizaj D., Larsson P., Reimer R. J., Wreden C., Storm-Mathisen J., Copenhagen D., Kavanaugh M., Edwards R. H. (2001) EMBO J. 20, 7041–7051 [DOI] [PMC free article] [PubMed] [Google Scholar]
- 49.Fang Y., Jayaram H., Shane T., Kolmakova-Partensky L., Wu F., Williams C., Xiong Y., Miller C. (2009) Nature, in press [DOI] [PMC free article] [PubMed] [Google Scholar]
- 50.Gao X., Lu F., Zhou L., Dang S., Sun L., Li X., Wang J., Shi Y. (2009) Science 324, 1565–1568 [DOI] [PubMed] [Google Scholar]
Associated Data
This section collects any data citations, data availability statements, or supplementary materials included in this article.


