

Abstract
Background and Aims
Mutations in HFE are the most common cause of the iron-overload disorder hereditary hemochromatosis (HH). Levels of the main iron regulatory hormone, hepcidin, are inappropriately low in HH mouse models and patients with HFE mutations, indicating that HFE regulates hepcidin. The bone morphogenetic protein 6 (BMP6)-SMAD signaling pathway is an important endogenous regulator of hepcidin expression. We investigated whether HFE is involved in BMP6-SMAD regulation of hepcidin expression.
Methods
The BMP6-SMAD pathway was examined in Hfe knockout (KO) mice and in wild-type (WT) mice as controls. Mice were placed on diets of varying iron content. Hepcidin induction by BMP6 was examined in primary hepatocytes from Hfe KO mice; data were compared with those of WT mice.
Results
Liver levels of Bmp6 mRNA were higher in Hfe KO mice; these were appropriate for the increased hepatic levels of iron in these mice, compared with WT mice. However, levels of hepatic phosphorylated Smad 1/5/8 protein (an intracellular mediator of Bmp6 signaling) and Id1 mRNA (a target gene of Bmp6) were inappropriately low for the body iron burden and Bmp6 mRNA levels in Hfe KO, compared with WT mice. BMP6 induction of hepcidin expression was reduced in Hfe KO hepatocytes compared with WT hepatocytes.
Conclusions
HFE is not involved in regulation of BMP6 by iron, but does regulate the downstream signals of BMP6 that are triggered by iron.
Introduction
Hereditary hemochromatosis (HH) is a genetically heterogeneous hereditary disorder of iron metabolism caused by a failure to prevent unneeded iron from entering the circulatory pool and characterized by progressive iron overload with potential for multi-organ damage and disease1. A common polymorphism in HFE is associated with the most frequent and first characterized form of HH, affecting approximately five per one thousand individuals of northern European descent2. Mouse models with disruptions of the Hfe gene have a similar iron overload phenotype3,4,5.
Although the discovery of the HFE gene6 dates back more than 10 years, the pathophysiology of HFE-HH is still not fully understood. HFE encodes an atypical class I major histocompatibility complex molecule that requires β2 microglobulin for appropriate localization to the cell surface6-8. HFE binds to transferrin receptor 1 (TfR1) 9-11 at a site that overlaps with the transferrin binding site12-15. HFE also binds to the liver-specific homologue transferrin receptor 2 (TfR2)16,17. Selective disruption of the Hfe gene in the liver recapitulates the phenotype of Hfe KO mice, suggesting that the liver is the predominant organ for HFE action in the regulation of iron metabolism18. Notably, both mouse models and human patients with HFE mutations have inappropriately low expression of the key iron regulatory hormone hepcidin19-23, which is produced in the liver24-26. Hepcidin downregulates the iron exporter ferroportin on the surface of duodenal enterocytes, macrophages, and hepatocytes, thereby inhibiting iron release into the bloodstream27. It is now widely accepted that impaired regulation of hepcidin expression by HFE plays a central role in the pathogenesis of HFE-HH. It has recently been postulated that TfR1 in the liver serves to sequester HFE, and that HFE is displaced from TfR1 by holotransferrin28. This displaced HFE is then able to generate a signal to upregulate hepcidin via an interaction with TfR2 and transferrin16,28,29. However the precise molecular mechanism by which HFE affects hepcidin expression is still unknown.
A severe juvenile form of HH is caused by mutations in the gene encoding hemojuvelin (HFE2) 30. We have recently discovered that hemojuvelin is a co-receptor for the bone morphogenetic protein (BMP) signaling pathway31 and that the BMP signaling function of hemojuvelin is important for its role in iron metabolism31,32. Members of Tranforming Growth Factor-β (TGF-β) family, BMPs exert their effects by binding to type I and type II serine threonine kinase receptors, which phosphorylate specific intracellular SMAD proteins (SMAD1/5/8). Phosphorylated SMAD1/5/8 (P-SMAD1/5/8) binds to common mediator SMAD4, and the SMAD complex translocates to the nucleus to affect transcription of target genes such as ID133-35. We and others have shown that HAMP (encoding hepcidin) is also a target gene that is upregulated by BMP signals at the transcriptional level in vitro31-32, 36-39. In mice, BMP ligands increase hepatic Hamp1 mRNA expression and reduce serum iron, while BMP inhibitors reduce hepatic Hamp1 mRNA expression, mobilize reticuloendothelial cell iron stores, and increase serum iron32,40-41. Impaired hepatic BMP signaling, through mutations in genes encoding the BMP co-receptor hemojuvelin42-43, the common BMP/TGF-β intracellular mediator Smad436 or the ligand Bmp641,44, leads to low hepcidin levels and iron overload in mouse models. Recent evidence also suggests that BMP signaling in the liver is modulated by iron40,45. Parenteral iron increases hepatic Smad1/5/8 phosphorylation within 1 hour40, and longterm changes in dietary iron modulate hepatic Bmp6 mRNA expression in mice concordantly with Id1 and Hamp1 mRNA45. Collectively these data indicate that the BMP-SMAD signaling is a main regulatory pathway acting in iron metabolism.
Here, we dissect the BMP-SMAD signaling pathway in an Hfe KO mouse model to determine whether HFE regulation of hepcidin expression involves the BMP-SMAD signaling pathway. Our data show that hepatic Bmp6 mRNA expression is appropriately regulated by dietary iron content and tissue iron burden in Hfe KO mice. However, HFE appears to be involved in the downstream signals of BMP6 that are triggered by iron.
Materials and methods
Animals
WT 129S6/SvEvTac mice and Hfe KO mice bred on a 129S6/SvEvTac background4, kindly provided by Dr. Nancy C. Andrews, (Duke University Medical Center, received humane care under approved experimental protocols according to University Hospital of Modena guidelines. Six Hfe KO (3 males, 3 females) and six WT (2 males, 4 females) mice were maintained on a standard rodent diet containing 330 ppm iron (2018, Harlan, Teklad) until 12 weeks of age (Control diet, CTR). Dietary iron loading was achieved by feeding six 8 week-old Hfe KO and six WT mice (3 males, 3 females each) the same standard diet supplemented with 2% carbonyl iron for 4 weeks (Iron-enriched diet, IR). Six 7 week-old Hfe KO and six WT mice (4 males, 2 females each) were fed with a diet with negligible iron content (customized diet, Harlan, Teklad) for 5 weeks (Iron-deficient diet, ID). All mice were sacrificed at 12 weeks of age and blood and livers were harvested for analysis.
Hematological and iron parameters
Blood was obtained by retroorbital puncture. Serum iron and total iron binding capacity (TIBC) were determined using a kit (Pointe Scientific Inc.) according to the manufacturer's instructions. Transferrin saturation (Tf Sat) was calculated as (serum iron ÷ TIBC) × 100%. Red blood cells, hemoglobin and hematocrit were determined using an automated cell counter at the clinical-chemical laboratory of the University Hospital of Modena.
Tissue Iron Content
Tissue specimens were analysed for non-heme iron content by the method of Torrance and Bothwell46. Liver iron concentration (LIC) for each animal was the mean of measurements performed on two different tissue specimens from each liver.
Quantitative real-time RT-PCR
Total RNA was isolated from mouse liver tissue using the RNeasy Mini Kit (QIAgen), with DNAse digestion with the RNase-Free DNase Set (QIAgen) or TRIzol reagent (Invitrogen) according to the manufacturers' instructions as previously described41,47. Real time quantification of Bmp6, Bmp4, Bmp2, Id1, Hamp1, Rpl19, and Gapdh mRNA transcripts was performed using two-step quantitative real-time RT-PCR as previously described41,47. Samples were analyzed in duplicate or triplicate and expression levels were normalized to the housekeeping genes Rpl19 or Gapdh.
Western blot
Livers were disrupted with a manual homogenizer in lysis buffer (1× TBS, 0.1% SDS, 10 μl/ml Triton x-100, 1g/100 ml Na Deoxycholate, 2 μl/ml EDTA) containing protease inhibitors (Complete Mini, Roche Diagnostic) and phosphatase inhibitors (Halt Phosphatase Inhibitor Cocktail, Thermo Scientific). Western blot of liver lysates for P-Smad1/5/8 relative to total Smad1 protein and chemiluminescence quantitation was performed as previously described32.
Primary hepatocyte cultures and BMP6 treatment
Primary hepatocytes from 8-12 week-old male 129S6/SvEvTac WT and Hfe KO mice maintained on a standard rodent diet (300 ppm iron, Harlan Teklad) were isolated as previously described47 with the following modifications. Hepatocytes were plated on plastic multiwell plates at a density of 300,000-400,000 cells/ml in DMEM (GIBCO_BRL Life Technologies) supplemented with 100 IU/ml penicillin, 30 mg/ml streptomycin, and 10% fetal calf serum (FCS). Twenty-four hours after isolation, hepatocytes were serum starved for 6 hours in DMEM with 1% FCS, followed by stimulation with 0.1 to 2.0 ng/ml of BMP6 (R&D systems) in DMEM with 1% FCS for 16 hours.
Statistics
All data were controlled for normal distribution (Kolgomorov-Smirnov's and Shapiro-Wilk's tests). In cases of skewed distribution, log-transformed data were used. Two-tailed independent Student's t-test was used to compare normalized mean values of considered variables between strains under the same diet regimen. Two-way ANOVA (with Holm-Sidak post-hoc test for pair wise multiple comparisons) was used to compare, between and within considered groups, the mean levels of the considered variables as a function of diet, strain and the interaction between these two factors. One-way ANOVA (with LSD post-hoc test for pair wise multiple comparisons) was used to compare mean values for the BMP6 dose-response curves in primary hepatocyte cultures. The Pearson's r coefficient was used to assess the correlation between continuous variables, and z-statistic to compare r coefficients. For small sample sizes, Spearman's r coefficient was also calculated to confirm the results. In all statistical analyses, P <.05 was considered significant. All analyses were conducted using SPSS® v.17.0 (SPSS inc., Chicago,Illinois) and SigmaStat® v.3.5 (Systat Software Inc., Richmond, California) statistical software.
Results
Hepatic Bmp6 mRNA is increased, while P-Smad1/5/8 protein and Id1 mRNA are not increased, in Hfe KO mice compared with WT mice on a standard diet
To examine the role of HFE in the BMP-SMAD signaling pathway, we analyzed 12 week-old Hfe KO mice on a 129/SvEvTac background compared with matched WT mice maintained on a standard diet for blood and tissue iron parameters, hepatic Bmp6 mRNA, P-Smad1/5/8 protein, Id1 mRNA, and hepcidin (Hamp1) mRNA expression (Fig.1). Hfe KO animals manifested a well-known iron overload phenotype3,4,5 with increased liver iron concentration (LIC), serum iron, and transferrin saturation (Tf Sat) compared with WT controls (Fig.1, bottom). Hepatic Bmp6 relative to Rpl19 mRNA levels were significantly higher in Hfe KO compared to WT mice (black bars). This is consistent with a recent paper showing that hepatic Bmp6 mRNA expression correlates with dietary iron content and tissue iron burden in mice with C57BL/6 and DBA/2 backgrounds45. Similar to the previous study45, we did not find changes in hepatic Bmp2 and Bmp4 mRNA levels in Hfe KO mice despite significant iron overload (data not shown). In contrast to the findings for Bmp6 mRNA, hepatic P-Smad1/5/8 (the intracellular mediator of BMP6 signaling) and Id1 mRNA (a target gene upregulated by BMP6) were not increased in Hfe KO compared with WT mice (Fig.1, gray and white bars). Consistent with previous studies 19-22, Hamp1 mRNA levels were lower in Hfe KO compared with WT mice, and inappropriately low for LIC (Fig.1, striped bars).
Figure 1. Liver iron concentration and Bmp6 mRNA levels are increased, phosphorylated Smad1/5/8 protein and Id1 mRNA are unchanged, and Hamp1 mRNA expression is decreased in Hfe KO versus WT mice on a standard diet.
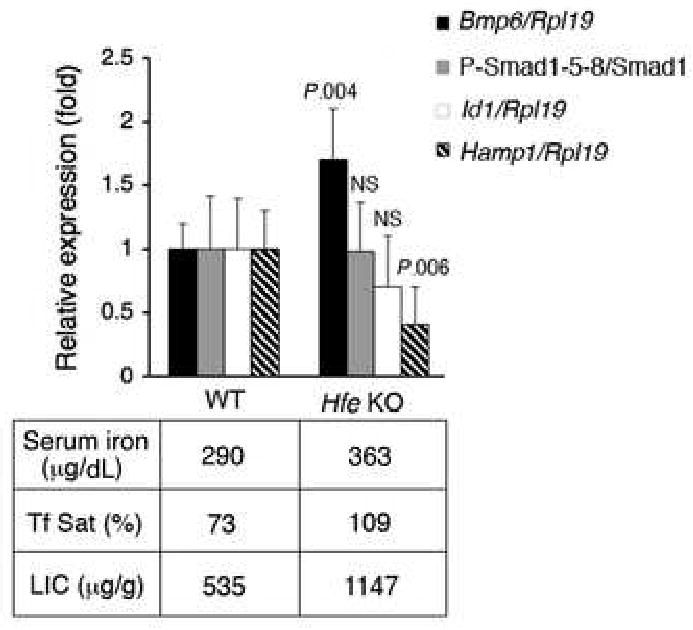
Twelve-week-old Hfe KO mice (N = 6) and WT control mice (N = 6) were analyzed for hepatic Bmp6, Id1 and Hamp1 relative to Rpl19 mRNA expression by quantitative real-time RT-PCR, and for P-Smad1/5/8 relative to total Smad1 protein expression by Western blot quantified using IPLab Spectrum software. Results are reported as the mean ± s.d for the fold change from WT mice. Exact P values determined by 2-tailed independent Student's t-test are shown for the comparisons between Hfe KO mice and WT mice. Serum iron, serum Tf Sat, and LIC were also determined. Results from pooled samples are shown for serum iron and Tf Sat. Mean values are shown for LIC.
Hfe KO mice have equivalent hepatic Bmp6 mRNA expression, but lower P-Smad1/5/8 protein and Id1 mRNA expression, compared with WT mice with equivalent iron burden
To further examine the modulation of the BMP6-SMAD pathway by iron and to compare animals with similar body iron burden, we fed Hfe KO mice and matched WT mice an iron-deficient (ID) diet, a control diet, (CTR) or an iron-enriched diet (IR) for 4 or 5 weeks (N = 6 per group). WT mice on an ID diet had lower mean cellular volume (54.6 +/- 0.63 versus 59.8 +/- 1.78, P = .0004) and a trend toward lower hematocrit (47.75 +/- 4.3 versus 52.43 +/- 2.4, P = .05) compared to WT mice on a CTR diet, but no other significant differences in erythroid parameters were found among animals receiving different diets (data not shown). Dietary iron caused a dose-dependent increase in serum iron in WT mice, but was less effective at modulating serum iron parameters in Hfe KO mice, where iron burden was already high (Fig.2, bottom). Dietary iron also significantly modulated LIC in both WT and Hfe KO mice (Fig. 2) Notably, WT and Hfe KO mice on an IR diet had equivalent LIC and serum iron parameters (Fig. 2, black bars). We therefore examined the BMP6-SMAD signaling pathway in WT and Hfe KO mice on an IR diet to compare mice with a similar body iron burden.
Fig.2. Dietary iron modulates the iron burden of WT and Hfe KO mice.
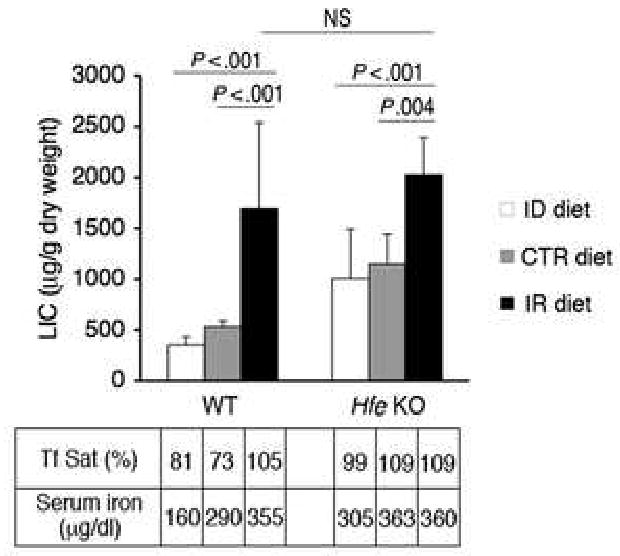
Seven to eight week-old Hfe KO mice and WT control mice were maintained on an ID, CTR, or IR diet for 4 to 5 weeks (N = 6 per group). Mice were analyzed for LIC, serum Tf Sat, and serum iron. Results for serum Tf Sat and serum iron are from pooled samples. LIC is expressed as the mean ± s.d. Exact P values determined by 2-way ANOVA (or NS if not significant) are shown.
Hepatic Bmp6 mRNA showed a trend toward higher levels in Hfe KO compared with WT mice maintained on IR diet (Fig.3, black bars). This is consistent with the non-significant trend toward increased LIC in the Hfe KO mice. In contrast, hepatic P-Smad1/5/8 protein and Id1 mRNA levels (Fig.3, gray and white bars) were significantly lower in Hfe KO compared with WT mice on an IR diet. As expected, Hamp1 mRNA expression was significantly lower in Hfe KO compared with WT mice on an IR diet (Fig.3, striped bars).
Fig.3. Hfe KO mice have adequate hepatic Bmp6 mRNA expression, but lower P-Smad1/5/8 protein, Id1 mRNA, and Hamp1 mRNA expression compared to WT mice with equivalent iron burden.
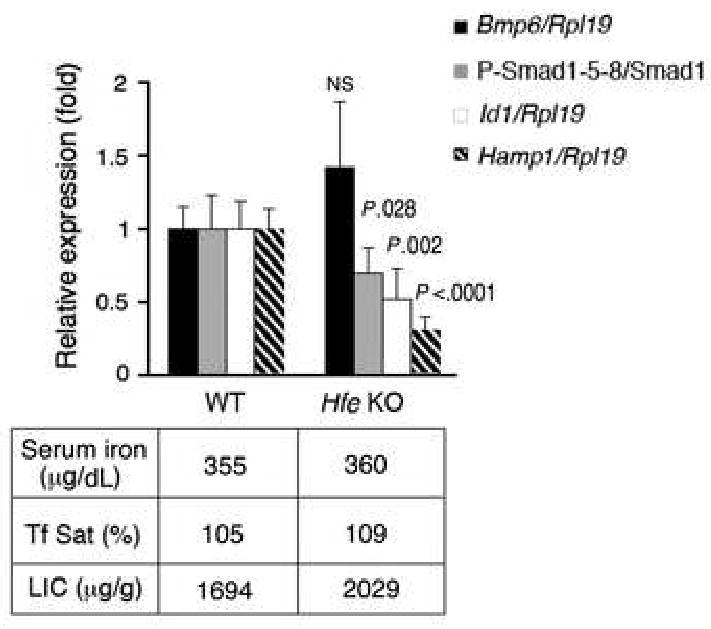
Eight week-old Hfe KO mice and WT control mice were maintained on an IR diet for four weeks (N = 6 mice per group). Mice were analyzed for Bmp6, Id1 and Hamp1 relative to Rpl19 mRNA expression, and for P-Smad1/5/8 relative to total Smad1 protein expression as in Figure 1. Results are reported as the mean ± s.d for the fold change from WT mice. Exact P values determined by 2-tailed independent Student's t-test are shown for the comparisons between Hfe KO mice and WT mice.
Hepatic Bmp6 mRNA expression is appropriately upregulated by iron in Hfe KO mice
To further understand the regulation of the BMP6-SMAD pathway by iron in Hfe KO mice, we compared hepatic Bmp6 mRNA, P-Smad1/5/8 protein, Id1 mRNA, and Hamp1 mRNA expression in Hfe KO mice maintained on ID, CTR, and IR diets. The same parameters were examined in WT mice as a control. In Hfe KO mice, hepatic Bmp6 mRNA levels were significantly modulated by dietary iron, and were regulated concordantly with LIC in a manner similar to WT mice (compare Fig. 4A to Fig. 2). To examine whether the increase in Bmp6 mRNA levels in Hfe KO mice was appropriate for iron burden, we compared the ratio of Bmp6 mRNA levels to LIC. Bmp6 mRNA levels relative to LIC in Hfe KO mice were not significantly different from those in WT mice across all diets (Fig.4B). The Pearson's chi-square test showed a significant correlation between Bmp6 mRNA levels and LIC in the overall animal population (r = 0.726, P =.0001). This correlation was maintained after separate analysis in WT (r = 0.726, P =.001) and Hfe KO mice (r = 0.730, P =.001), and was not significantly different between the two genotypes (z=-0.0233, P =.9814). Due to the small sample size, nonparametric statistics were also used, with similar results. These data suggest that hepatic Bmp6 mRNA correlates with LIC and is appropriately increased relative to body iron burden in Hfe KO mice.
Fig.4. Dietary iron appropriately upregulates hepatic Bmp6 mRNA expression in Hfe KO mice.
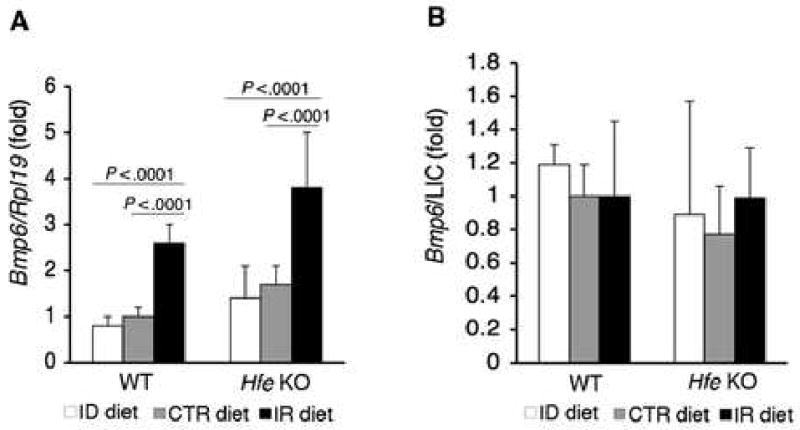
A) WT and Hfe KO mice on an ID, CTR, or IR diet from Figure 2 (N = 6 per group) were analyzed for Bmp6 relative to Rpl19 mRNA expression as in Figure 1. B) Ratio of Bmp6 mRNA from panel A relative to LIC. Results are expressed as the mean ± s.d for the fold change from WT mice on a CTR diet. Exact P values determined by 2-way ANOVA are shown. For panel B, P values were not significant for comparisons among all groups.
Intracellular mediators and targets of BMP6 signaling in the liver are not appropriately increased relative to iron burden and Bmp6 mRNA expression in Hfe KO mice
Dietary iron also significantly modulated hepatic P-Smad 1/5/8 protein (Fig. 5A-B), Id1 mRNA (Fig. 6A), and Hamp1 mRNA expression (Fig. 7A) in Hfe KO mice. The latter results are consistent with a prior study showing that hepcidin levels can be modulated by dietary iron in Hfe KO mice48. However, the levels of P-Smad 1/5/8 protein relative to body iron burden (LIC) were significantly reduced by ∼30-40% in Hfe KO compared with WT mice across all diets (Fig. 5C), and there was a similar trend towards reduced P-Smad1/5/8 protein relative to Bmp6 mRNA in Hfe KO versus WT mice that reached significance for the IR diet group (Fig. 5D). Id1 mRNA expression relative to LIC or to Bmp6 mRNA expression were even more significantly reduced in Hfe KO compared with WT mice by ∼65% across all diets (Fig.6B and C). Hamp1 mRNA expression relative to LIC and Bmp6 mRNA levels reinforced the well-known inappropriately low hepcidin levels in Hfe KO mice (Fig.7B and C). These results suggest that although hepatic P-Smad1/5/8 protein, Id1 mRNA, and Hamp1 mRNA can be regulated by dietary iron, they are all inappropriately low relative to iron burden and hepatic Bmp6 mRNA levels in Hfe KO mice.
Fig.5. In Hfe KO mice, dietary iron modulates hepatic P-Smad1/5/8 protein expression, but P-Smad1/5/8 is not appropriately increased relative to iron burden compared with WT mice.
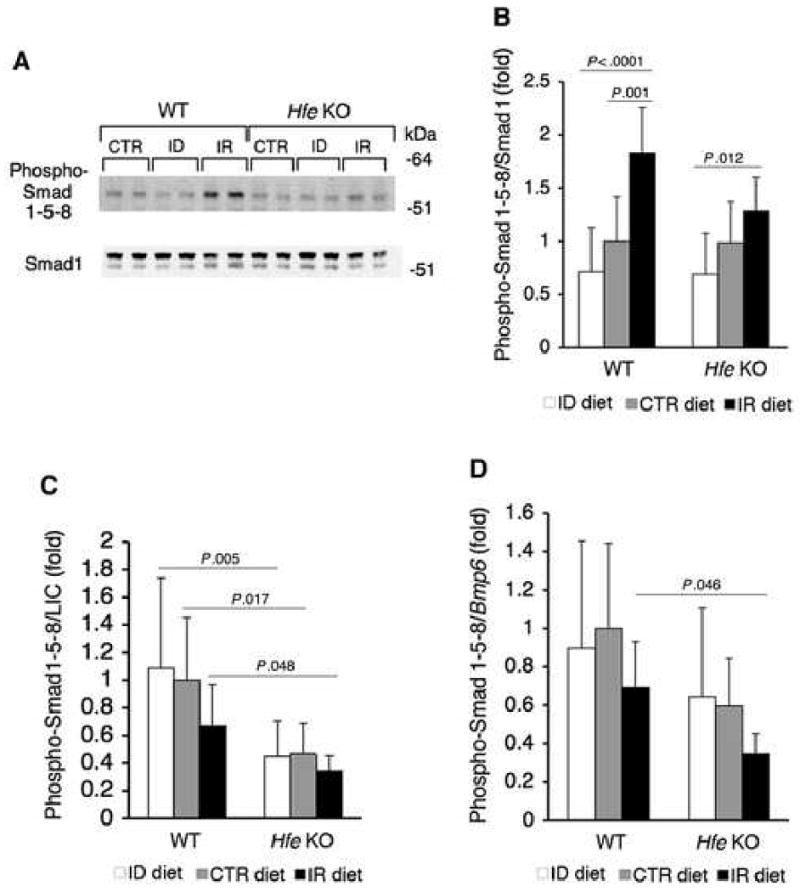
A-B) WT and Hfe KO mice on an ID, CTR, or IR diet from Figure 2 (N = 6 per group) were analyzed for hepatic P-Smad1/5/8 relative to total Smad1 expression by Western blot (A, representative blot) quantitated by IPLab Spectrum software (B). C-D) Ratio of P-Smad1/5/8 from panel B relative to LIC (C) or hepatic Bmp6 mRNA (D). Results are expressed as the mean ± s.d for the fold change from WT mice on a CTR diet. Exact P values determined by 2-way ANOVA are shown.
Fig.6. In Hfe KO mice, dietary iron modulates hepatic Id1 mRNA expression, but Id1 mRNA is not appropriately increased relative to iron burden and Bmp6 mRNA expression compared with WT mice.
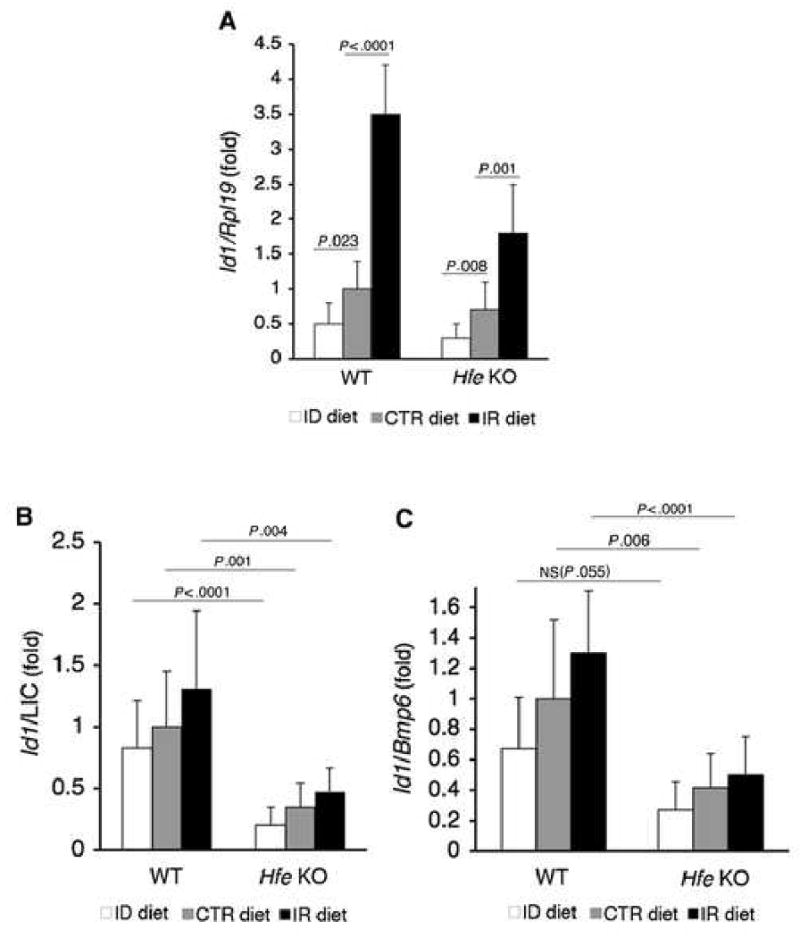
A) WT and Hfe KO mice on an ID, CTR, or IR diet from Figure 2 (N = 6 per group) were analyzed for Id1 relative to Rpl19 mRNA as in Figure 1. B-C) Ratio of Id1 mRNA from panel A relative to LIC (B) or hepatic Bmp6 mRNA (C). Results are expressed as the mean ± s.d for the fold change from WT mice on a CTR diet. Exact P values determined by 2-way ANOVA are shown.
Fig.7. In Hfe KO mice, dietary iron modulates hepatic Hamp1 mRNA expression, but Hamp1 mRNA is not appropriately increased relative to iron burden and Bmp6 mRNA expression compared with WT mice.
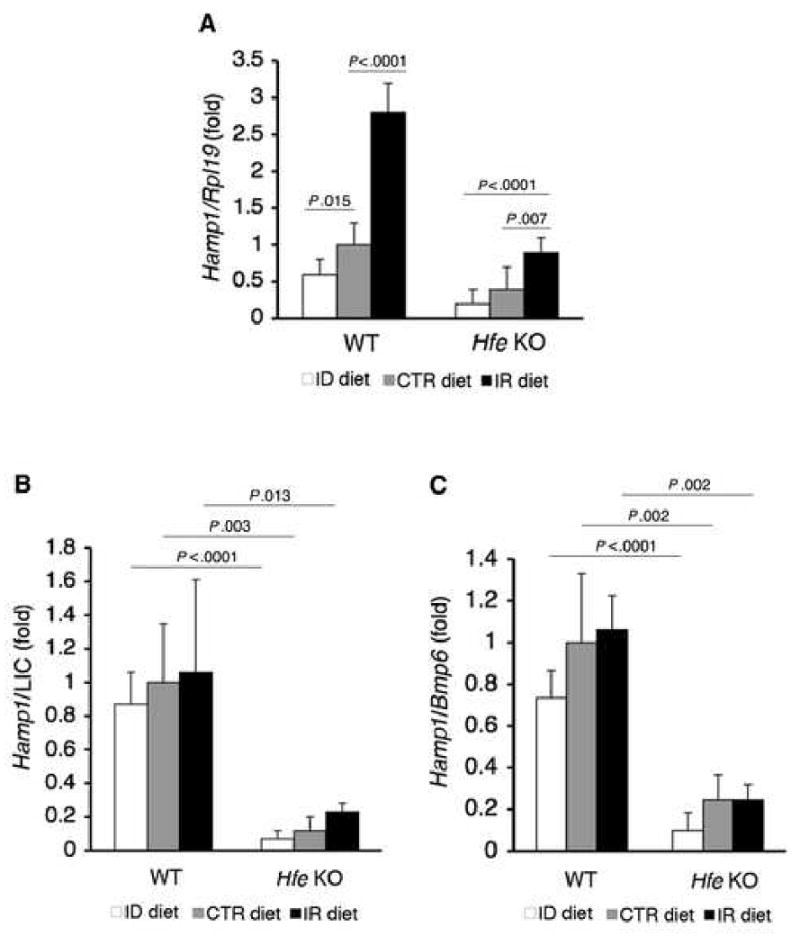
A) WT and Hfe KO mice on an ID, CTR, or IR diet from Figure 2 (N = 6 per group) were analyzed for Hamp1 relative to Rpl19 mRNA as in Figure 1. B-C) Ratio of Hamp1 mRNA from panel A relative to LIC (B) or hepatic Bmp6 mRNA (C). Results are expressed as the mean ± s.d. for the fold change from WT mice on a CTR diet. Exact P values determined by 2-way ANOVA are shown.
BMP6 induction of hepcidin expression is impaired in Hfe KO mouse hepatocytes
To further confirm whether HFE plays a role in hepcidin induction by BMP6, we tested the ability of BMP6 to induce hepcidin expression in primary hepatocyte cultures from Hfe KO versus WT mice. Basal Hamp1 mRNA expression was ∼40% lower in Hfe KO compared with WT hepatocytes, consistent with prior studies37. Low doses of BMP6 ranging from 0.5 to 2 ng/mL significantly increased Hamp1 mRNA expression up to 2-fold in WT primary hepatocyte cultures (Fig.8, closed rhombus). However, Hamp1 mRNA induction by BMP6 was significantly lower in Hfe KO hepatocytes (Fig.8, open squares) compared with WT hepatocytes treated with identical BMP6 concentrations.
Figure 8. Hepcidin induction by BMP6 is impaired in Hfe KO hepatocytes.
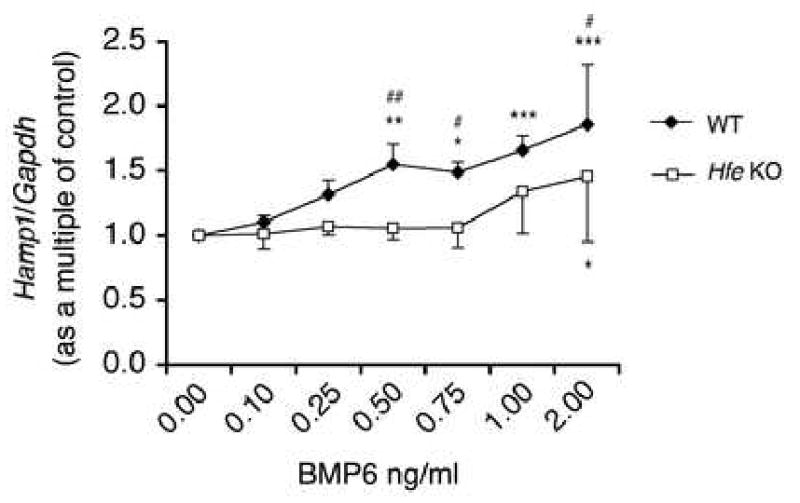
Primary hepatocyte cultures from Hfe KO versus WT control mice were treated with low doses of exogenous BMP6 ligand ranging from 0.1 to 2.0 ng/ml. Hamp1 relative to Gapdh mRNA was analyzed by quantitative real-time RT-PCR. Results are expressed as the mean ± s.d. for the fold increase over untreated cells from five independent experiments each conducted in triplicate. * P < .05, ** P < .01, *** P < .001 compared with untreated cells for a given genotype; # P < .05, ## P < .01 for Hfe KO compared with WT cells treated with identical concentrations of BMP6 as determined by one-way ANOVA.
Discussion
Mutations in the gene encoding HFE are the most common cause of HH2. Recent data suggest that one mechanism by which HFE mutations cause HH is by causing inappropriately low expression of the key iron regulatory hormone hepcidin18-23. However, the mechanisms by which HFE affects hepcidin expression are still unknown. We and others have recently shown that BMP-SMAD signaling is a main regulatory pathway acting in hepcidin regulation and iron metabolism31-32, 36-41, 44-45. We therefore investigated whether HFE was involved in the BMP-SMAD signaling pathway.
In the present work we show that Hfe KO mice have higher hepatic Bmp6 mRNA expression than WT mice. Furthermore, we show that dietary iron modulates hepatic Bmp6 mRNA levels in both WT and Hfe KO mice in an equivalent manner. Similar modulation of hepatic Bmp6 mRNA by dietary iron content, and a similar correlation between hepatic Bmp6 mRNA levels and liver iron content was seen previously in two other mouse strains45. These data suggest that the increased hepatic Bmp6 mRNA in Hfe KO mice is appropriate for the increased iron burden, and that HFE is not necessary for regulation of Bmp6 mRNA levels in response to iron.
We did not find any changes in hepatic Bmp2 and Bmp4 mRNA levels in Hfe KO compared with WT mice, despite significant iron overload. We also did not find any changes in hepatic Bmp2 and Bmp4 mRNA levels in Hfe KO or WT mice maintained on an iron enriched diet compared with their own control diet groups. These data are in agreement with a prior study showing that hepatic Bmp2 mRNA was increased only under extreme iron overload conditions and Bmp4 mRNA was not altered by dietary iron in two other mouse strains45. Together with the recent finding that BMP6 is a ligand for the BMP co-receptor hemojuvelin, and that Bmp6 null mice have an iron overload phenotype that resembles juvenile hemochromatosis due to hemojuvelin mutations41,44, these data reinforce the idea of the preeminent role of endogenous BMP6 in iron metabolism in vivo.
In contrast to the findings for Bmp6 mRNA expression, hepatic P-Smad 1/5/8 protein and Id1 mRNA levels are the same in Hfe KO animals and WT animals on a standard iron diet, and therefore inappropriately low relative to the higher body iron and Bmp6 mRNA levels in the Hfe KO mice. Indeed, when we examined WT versus Hfe KO mice with comparable Bmp6 mRNA expression, serum iron, transferrin saturation and LIC, that is WT mice on an IR diet versus Hfe KO on an IR diet, we found that Hfe KO mice had significantly lower hepatic P-Smad1/5/8 protein and Id1 mRNA levels compared with WT mice. Furthermore, we found that across all dietary iron groups, Hfe KO mice had significantly lower hepatic P-Smad1/5/8 protein and Id1 mRNA levels relative to LIC, significantly lower Id1 relative to Bmp6 mRNA, and a trend toward lower P-Smad1/5/8 protein relative to Bmp6 mRNA that reached statistical significance for the IR diet, compared with WT mice. These data suggest that the downstream signals of BMP6 triggered by iron are impaired in Hfe KO mice. The impairment in Hfe KO mice was more pronounced for Id1 mRNA compared with P-Smad1/5/8 expression, and even more pronounced for Hamp1 mRNA expression. These findings can be explained in several ways. First, the kinetics of SMAD phosphorylation in response to BMP ligand is much faster and more transient compared with the regulation of downstream mRNAs. It may therefore be more difficult to capture the transient SMAD phosphorylation state when using a model looking at the effects of chronic changes in dietary iron levels and iron burden. Second, there may be a “cascade effect” through the BMP-SMAD signaling pathway that is able to amplify the impairment step-by-step. In support of one or both of these hypotheses, the modulation of P-Smad1/5/8 by iron in WT mice was less pronounced than the modulation of Id1 mRNA and Hamp1 mRNA. Another possibility is that HFE may affect the BMP signaling pathway downstream of SMAD phosphorylation. Finally, it is possible that HFE also affects hepcidin expression through an additional non-BMP-SMAD pathway.
The involvement of HFE in BMP6-mediated induction of hepcidin expression is further supported by the relative resistance of Hfe KO primary hepatocyte cultures to Hamp1 mRNA induction by BMP6 ligand. It is unlikely that the iron loaded state of these Hfe KO hepatocytes per se impairs BMP-SMAD signaling because WT mice with higher LIC due to dietary iron loading had increased hepatic P-Smad1/5/8 protein and Id1 mRNA levels appropriate for their increased Bmp6 mRNA levels. Interestingly, a prior study showed that Hfe KO primary mouse hepatocytes exhibited equivalent increases in Hamp mRNA expression in response to BMP2, BMP4, and BMP9 ligands compared with WT hepatocytes37. One explanation for these findings is that we used relatively low doses of BMP6 ligand, while Truska et al.37 used relatively high doses of BMP ligands. We hypothesize that low doses of endogenous BMP6 ligand are expressed under normal physiologic conditions, and that HFE is important for the downstream signals to BMP6 under these physiologic conditions. Under nonphysiologic conditions of high levels of exogenous BMP ligand, the large excess of BMP ligand can bypass the role of HFE in optimizing the BMP6 response via BMP type I and type II receptors and the co-receptor hemojuvelin. Additionally, the role of HFE in regulating downstream BMP signals might specific to BMP6 ligand. Further experiments will be needed to determine the ligand specificity of HFE involvement in the BMP pathway.
In summary, we propose the following model for the role of HFE in iron metabolism. Our data, in conjunction with others'28,45, suggest that iron sensing occurs at multiple levels. First, chronic iron loading increases hepatic Bmp6 mRNA. The mechanism for this upregulation remains to be determined, however, it does not appear to require HFE. Second, recent work suggests that HFE may participate in the sensing of increased serum iron levels by becoming displaced from TfR1 by holotransferrin and by interacting with a TfR2/transferrin complex, which then acts to increase hepcidin expression28-29. We have previously shown that BMP6-mediated signaling by the co-receptor hemojuvelin in complex with BMP type I and type II receptors causes phosphorylation of SMAD proteins, which in turn increases transcription of hepcidin mRNA31-32,39, 49. Based on our data here, we propose that HFE increases hepcidin expression through an interaction with the BMP6/hemojuvelin/SMAD signaling pathway. Future studies will be needed to determine the precise molecular mechanisms by which HFE affects downstream BMP6 signals in hepatocytes and whether TfR2 plays a role in this process.
Acknowledgments
Grant support and acknowledgements: AP and EC were supported in part by EU (EUROIRON Ct.2006-037296) and the Italian Ministry of University and Research (MIUR-2006) grants. HYL was supported in part by NIH grants RO1 DK-069533 and RO1 DK-071837. JLB was supported in part by NIH grant K08 DK-075846 and by a Claflin Distinguished Scholar Award from the Massachusetts General Hospital.
Abbreviations
- HH
hereditary hemochromatosis
- BMP
bone morphogenetic protein
- KO
knockout
- WT
wild-type
- TfR1
Transferrin receptor 1
- TfR2
Transferrin receptor 2
- P-Smad1/5/8
phosphorylated Smad1/5/8
- CTR
control
- IR
iron-enriched
- ID
iron-deficient
- TIBC
total iron binding capacity
- Tf Sat
transferrin saturation
- LIC
liver iron concentration
Footnotes
Disclosures: None
Author Contributions: E.C., C.G., G.M., A.P., and J.L.B. designed the experiments. E.C., C.G., G.M., and B.A.J. performed the experiments. E.C., C.G., G.M., H.Y.L., A.P., and J.L.B. analyzed and interpreted the data, and P.V. performed the statistical analysis. E.C. and J.L.B. wrote the manuscript. C.G., G.M., P.V., H.Y.L., and A.P. edited the manuscript. A.P. and J.L.B. conceived and oversaw the entire project.
Publisher's Disclaimer: This is a PDF file of an unedited manuscript that has been accepted for publication. As a service to our customers we are providing this early version of the manuscript. The manuscript will undergo copyediting, typesetting, and review of the resulting proof before it is published in its final citable form. Please note that during the production process errors may be discovered which could affect the content, and all legal disclaimers that apply to the journal pertain.
References
- 1.Pietrangelo A. Hereditary hemochromatosis--a new look at an old disease. N Engl J Med. 2004;350:2383–2397. doi: 10.1056/NEJMra031573. [DOI] [PubMed] [Google Scholar]
- 2.Merryweather-Clarke AT, Pointon JJ, Shearman JD, et al. Global prevalence of putative haemochromatosis mutations. J Med Genet. 1997;34:275–278. doi: 10.1136/jmg.34.4.275. [DOI] [PMC free article] [PubMed] [Google Scholar]
- 3.Zhou XY, Tomatsu S, Fleming RE, et al. HFE gene knockout produces mouse model of hereditary hemochromatosis. Proc Natl Acad Sci U S A. 1998;95:2492–2497. doi: 10.1073/pnas.95.5.2492. [DOI] [PMC free article] [PubMed] [Google Scholar]
- 4.Levy JE, Montross LK, Cohen DE, et al. The C282Y mutation causing hereditary hemochromatosis does not produce a null allele. Blood. 1999;94:9–11. [PubMed] [Google Scholar]
- 5.Bahram S, Gilfillan S, Kühn LC, et al. Experimental hemochromatosis due to MHC class I HFE deficiency: immune status and iron metabolism. Proc Natl Acad Sci U S A. 1999;96:13312–7. doi: 10.1073/pnas.96.23.13312. [DOI] [PMC free article] [PubMed] [Google Scholar]
- 6.Feder JN, Gnirke A, Thomas W, et al. A novel MHC class I-like gene is mutated in patients with hereditary haemochromatosis. Nat Genet. 1996;13(4):399–408. doi: 10.1038/ng0896-399. [DOI] [PubMed] [Google Scholar]
- 7.Feder JN, Tsuchihashi Z, Irrinki A, et al. The hemochromatosis founder mutation in HLA-H disrupts beta2-microglobulin interaction and cell surface expression. J Biol Chem. 1997;272:14025–14028. doi: 10.1074/jbc.272.22.14025. [DOI] [PubMed] [Google Scholar]
- 8.Waheed A, Parkkila S, Zhou XY, et al. Hereditary hemochromatosis: effects of C282Y and H63D mutations on association with beta2-microglobulin, intracellular processing, and cell surface expression of the HFE protein in COS-7 cells. Proc Natl Acad Sci U S A. 1997;94:12384–12389. doi: 10.1073/pnas.94.23.12384. [DOI] [PMC free article] [PubMed] [Google Scholar]
- 9.Parkkila S, Waheed A, Britton RS, et al. Association of the transferrin receptor in human placenta with HFE, the protein defective in hereditary hemochromatosis. Proc Natl Acad Sci U S A. 1997;94:13198–13202. doi: 10.1073/pnas.94.24.13198. [DOI] [PMC free article] [PubMed] [Google Scholar]
- 10.Feder JN, Penny DM, Irrinki A, et al. The hemochromatosis gene product complexes with the transferrin receptor and lowers its affinity for ligand binding. Proc Natl Acad Sci USA. 1998;95:1472–1477. doi: 10.1073/pnas.95.4.1472. [DOI] [PMC free article] [PubMed] [Google Scholar]
- 11.Waheed A, Parkkila S, Saarnio J, et al. Association of HFE protein with transferrin receptor in crypt enterocytes of human duodenum. Proc Natl Acad Sci USA. 1999;96:1579–1584. doi: 10.1073/pnas.96.4.1579. [DOI] [PMC free article] [PubMed] [Google Scholar]
- 12.Lebrón JA, West AP, Jr, Bjorkman PJ. The hemochromatosis protein HFE competes with transferrin for binding to the transferrin receptor. J Mol Biol. 1999;294:239–245. doi: 10.1006/jmbi.1999.3252. [DOI] [PubMed] [Google Scholar]
- 13.Bennett MJ, Lebrón JA, Bjorkman PJ. Crystal structure of the hereditary haemochromatosis protein HFE complexed with transferrin receptor. Nature. 2000;403:46–53. doi: 10.1038/47417. [DOI] [PubMed] [Google Scholar]
- 14.West AP, Jr, Giannetti AM, Herr AB, et al. Mutational analysis of the transferrin receptor reveals overlapping HFE and transferrin binding sites. J Mol Biol. 2001;313:385–397. doi: 10.1006/jmbi.2001.5048. [DOI] [PubMed] [Google Scholar]
- 15.Giannetti AM, Björkman PJ. HFE and transferrin directly compete for transferrin receptor in solution and at the cell surface. J Biol Chem. 2004;279:25866–25875. doi: 10.1074/jbc.M401467200. [DOI] [PubMed] [Google Scholar]
- 16.Goswami T, Andrews NC. Hereditary hemochromatosis protein, HFE, interaction with transferrin receptor 2 suggests a molecular mechanism for mammalian iron sensing. J Biol Chem. 2006;281:28494–28498. doi: 10.1074/jbc.C600197200. [DOI] [PubMed] [Google Scholar]
- 17.Chen J, Chloupkova M, Gao J, et al. HFE modulates transferrin receptor 2 levels in hepatoma cells via interactions that differ from transferrin receptor 1-HFE interactions. J Biol Chem. 2007;282:36862–36870. doi: 10.1074/jbc.M706720200. [DOI] [PubMed] [Google Scholar]
- 18.Vujic Spasic M, Kiss J, Herrmann T, et al. Hfe acts in hepatocytes to prevent hemochromatosis. Cell Metab. 2008;7:173–178. doi: 10.1016/j.cmet.2007.11.014. [DOI] [PubMed] [Google Scholar]
- 19.Ahmad KA, Ahmann JR, Migas MC, et al. Decreased liver hepcidin expression in the Hfe knockout mouse. Blood Cells Mol Dis. 2002;29:361–366. doi: 10.1006/bcmd.2002.0575. [DOI] [PubMed] [Google Scholar]
- 20.Nicolas G, Viatte L, Lou DQ, et al. Constitutive hepcidin expression prevents iron overload in a mouse model of hemochromatosis. Nat Genet. 2003;34:97–101. doi: 10.1038/ng1150. [DOI] [PubMed] [Google Scholar]
- 21.Muckenthaler M, Roy CN, Custodio AO, et al. Regulatory defects in liver and intestine implicate abnormal hepcidin and Cybrd1 expression in mouse hemochromatosis. Nat Genet. 2003;34:102–107. doi: 10.1038/ng1152. [DOI] [PubMed] [Google Scholar]
- 22.Bridle KR, Frazer DM, Wilkins SJ, et al. Disrupted hepcidin regulation in HFE-associated haemochromatosis and the liver as a regulator of body iron homoeostasis. Lancet. 2003;361:669–673. doi: 10.1016/S0140-6736(03)12602-5. [DOI] [PubMed] [Google Scholar]
- 23.Piperno A, Girelli D, Nemeth E, et al. Blunted hepcidin response to oral iron challenge in HFE-related hemochromatosis. Blood. 2007;110:4096–4100. doi: 10.1182/blood-2007-06-096503. [DOI] [PubMed] [Google Scholar]
- 24.Pigeon C, Ilyin G, Courselaud B, et al. A new mouse liver-specific gene, encoding a protein homologous to human antimicrobial peptide hepcidin, is overexpressed during iron overload. J Biol Chem. 2001;276:7811–7819. doi: 10.1074/jbc.M008923200. [DOI] [PubMed] [Google Scholar]
- 25.Krause A, Neitz S, Magert HJ, et al. LEAP-1, a novel highly disulfide-bonded human peptide, exhibits antimicrobial activity. FEBS Lett. 2001;480:147–150. doi: 10.1016/s0014-5793(00)01920-7. [DOI] [PubMed] [Google Scholar]
- 26.Park CH, Valore EV, Waring AJ, et al. Hepcidin, a urinary antimicrobial peptide synthesized in the liver. J Biol Chem. 2001;276:7806–7810. doi: 10.1074/jbc.M008922200. [DOI] [PubMed] [Google Scholar]
- 27.Nemeth E, Tuttle MS, Powelson J, et al. Hepcidin regulates cellular iron efflux by binding to ferroportin and inducing its internalization. Science. 2004;306(5704):2090–3. doi: 10.1126/science.1104742. [DOI] [PubMed] [Google Scholar]
- 28.Schmidt PJ, Toran PT, Giannetti AM, et al. The transferrin receptor modulates Hfe-dependent regulation of hepcidin expression. Cell Metab. 2008;7(3):205–14. doi: 10.1016/j.cmet.2007.11.016. [DOI] [PMC free article] [PubMed] [Google Scholar]
- 29.Gao J, Chen J, Kramer M, et al. Interaction of the hereditary hemochromatosis protein HFE with transferrin receptor 2 is required for transferrin-induced hepcidin expression. Cell Metab. 2009;9:217–227. doi: 10.1016/j.cmet.2009.01.010. [DOI] [PMC free article] [PubMed] [Google Scholar]
- 30.Papanikolaou G, Samuels ME, Ludwig EH, et al. Mutations in HFE2 cause iron overload in chromosome 1q-linked juvenile hemochromatosis. Nat Genet. 2004;36:77–82. doi: 10.1038/ng1274. [DOI] [PubMed] [Google Scholar]
- 31.Babitt JL, Huang FW, Wrighting DM, et al. Bone morphogenetic protein signaling by hemojuvelin regulates hepcidin expression. Nat Genet. 2006;38:531–539. doi: 10.1038/ng1777. [DOI] [PubMed] [Google Scholar]
- 32.Babitt JL, Huang FW, Xia Y, et al. Modulation of bone morphogenetic protein signaling in vivo regulates systemic iron balance. J Clin Invest. 2007;117:1933–1939. doi: 10.1172/JCI31342. [DOI] [PMC free article] [PubMed] [Google Scholar]
- 33.Shi Y, Massague J. Mechanisms of TGF-beta signaling from cell membrane to the nucleus. Cell. 2003;113:685–700. doi: 10.1016/s0092-8674(03)00432-x. [DOI] [PubMed] [Google Scholar]
- 34.Miyazono K, Miyazawa K. Id: a target of BMP signaling. Sci STKE. 2002;2002(151):PE40. doi: 10.1126/stke.2002.151.pe40. [DOI] [PubMed] [Google Scholar]
- 35.Korchynskyi O, Ten Dijke P. Identification and functional characterization of distinct critically important bone morphogenetic protein-specific response elements in the Id1 promoter. J Biol Chem. 2002;277:4883–4891. doi: 10.1074/jbc.M111023200. [DOI] [PubMed] [Google Scholar]
- 36.Wang RH, Li C, Xu X, et al. A role of SMAD4 in iron metabolism through the positive regulation of hepcidin expression. Cell Metab. 2005;2:399–409. doi: 10.1016/j.cmet.2005.10.010. [DOI] [PubMed] [Google Scholar]
- 37.Truksa J, Peng H, Lee P, Beutler E. Bone morphogenetic proteins 2, 4, and 9 stimulate murine hepcidin 1 expression independently of Hfe, transferrin receptor 2 (Tfr2), and IL-6. Proc Natl Acad Sci U S A. 2006;103:10289–10293. doi: 10.1073/pnas.0603124103. [DOI] [PMC free article] [PubMed] [Google Scholar]
- 38.Truksa J, Peng H, Lee P, Beutler E. Different regulatory elements are required for response of hepcidin to interleukin-6 and bone morphogenetic proteins 4 and 9. Br J Haematol. 2007;139:138–47. doi: 10.1111/j.1365-2141.2007.06728.x. [DOI] [PubMed] [Google Scholar]
- 39.Verga Falzacappa MV, Casanovas G, Hentze MW, et al. A bone morphogenetic protein (BMP)-responsive element in the hepcidin promoter controls HFE2-mediated hepatic hepcidin expression and its response to IL-6 in cultured cells. J Mol Med. 2008;86:531–540. doi: 10.1007/s00109-008-0313-7. [DOI] [PubMed] [Google Scholar]
- 40.Yu PB, Hong CC, Sachidanandan C, et al. Dorsomorphin inhibits BMP signals required for embryogenesis and iron metabolism. Nat Chem Biol. 2008;4:33–41. doi: 10.1038/nchembio.2007.54. [DOI] [PMC free article] [PubMed] [Google Scholar]
- 41.Andriopoulos B, Jr, Corradini E, Xia Y, et al. BMP6 is a key endogenous regulator of hepcidin expression and iron metabolism. Nat Genet. 2009;41:482–7. doi: 10.1038/ng.335. [DOI] [PMC free article] [PubMed] [Google Scholar]
- 42.Huang FW, Pinkus JL, Pinkus GS, et al. A mouse model of juvenile hemochromatosis. J Clin Invest. 2005;115:2187–2191. doi: 10.1172/JCI25049. [DOI] [PMC free article] [PubMed] [Google Scholar]
- 43.Niederkofler V, Salie R, Arber S. Hemojuvelin is essential for dietary iron sensing, and its mutation leads to severe iron overload. J Clin Invest. 2005;115:2180–2186. doi: 10.1172/JCI25683. [DOI] [PMC free article] [PubMed] [Google Scholar]
- 44.Meynard D, Kautz L, Darnaud V, et al. Lack of the bone morphogenetic protein BMP6 induces massive iron overload. Nat Genet. 2009;41:478–81. doi: 10.1038/ng.320. [DOI] [PubMed] [Google Scholar]
- 45.Kautz L, Meynard D, Monnier A, et al. Iron regulates phosphorylation of Smad1/5/8 and gene expression of Bmp6, Smad7, Id1, and Atoh8 in the mouse liver. Blood. 2008;112:1503–1509. doi: 10.1182/blood-2008-03-143354. [DOI] [PubMed] [Google Scholar]
- 46.Torrance JD, Bothwell TH. Tissue iron stores. In: Cook JD, editor. Methods in Hematology. Vol. 1. New York: Churchill Livingstone; 1980. pp. 90–115. [Google Scholar]
- 47.Montosi G, Corradini E, Garuti C, et al. Kupffer cells and macrophages are not required for hepatic hepcidin activation during iron overload. Hepatology. 2005;41:545–52. doi: 10.1002/hep.20620. [DOI] [PubMed] [Google Scholar]
- 48.Gehrke SG, Herrmann T, Kulaksiz H, et al. Iron stores modulate hepatic hepcidin expression by an HFE-independent pathway. Digestion. 2005;72:25–32. doi: 10.1159/000087400. [DOI] [PubMed] [Google Scholar]
- 49.Xia Y, Babitt JL, Sidis Y, et al. Hemojuvelin regulates hepcidin expression via a selective subset of BMP ligands and receptors independently of neogenin. Blood. 2008;111:5195–5204. doi: 10.1182/blood-2007-09-111567. [DOI] [PMC free article] [PubMed] [Google Scholar]