Abstract
Two new bismacrocyclic Gd3+ chelates containing a specific Ca2+ binding site were synthesized as potential MRI contrast agents for the detection of Ca2+ concentration changes at the millimolar level in the extracellular space. In the ligands, the Ca2+-sensitive BAPTA-bisamide central part is separated from the DO3A macrocycles either by an ethylene (L1) or by a propylene (L2) unit [H4BAPTA is 1,2-bis(o-aminophenoxy)ethane-N,N,N′,N′-tetraacetic acid; H3DO3A is 1,4,7,10-tetraazacyclododecane-1,4,7-triacetic acid]. The sensitivity of the Gd3+ complexes towards Ca2+ and Mg2+ was studied by 1H relaxometric titrations. A maximum relaxivity increase of 15 and 10% was observed upon Ca2+ binding to Gd2L1 and Gd2L2, respectively, with a distinct selectivity of Gd2L1 towards Ca2+ compared with Mg2+. For Ca2+ binding, association constants of log K = 1.9 (Gd2L1) and log K = 2.7 (Gd2L2) were determined by relaxometry. Luminescence lifetime measurements and UV–vis spectrophotometry on the corresponding Eu3+ analogues proved that the complexes exist in the form of monohydrated and nonhydrated species; Ca2+ binding in the central part of the ligand induces the formation of the monohydrated state. The increasing hydration number accounts for the relaxivity increase observed on Ca2+ addition. A 1H nuclear magnetic relaxation dispersion and 17O NMR study on Gd2L1 in the absence and in the presence of Ca2+ was performed to assess the microscopic parameters influencing relaxivity. On Ca2+ binding, the water exchange is slightly accelerated, which is likely related to the increased steric demand of the central part leading to a destabilization of the Ln–water binding interaction.
Electronic supplementary material
The online version of this article (doi:10.1007/s00775-007-0296-9) contains supplementary material, which is available to authorized users.
Keywords: Relaxivity, MRI contrast agents, Calcium sensitive, Lanthanide complexes, Luminescence
Introduction
Magnetic resonance imaging (MRI) is one of the most versatile techniques in clinical and experimental in vivo imaging. It provides excellent three-dimensional spatial resolution down to the 10-μm range, whole body coverage and the opportunity to noninvasively measure additional physiological parameters [1]. Its sensitivity is, however, 2–6 orders of magnitude lower than that of optical imaging. This can be overcome by using appropriate MRI contrast agents. Nowadays, more than 30% of MRI examinations benefit from the use of paramagnetic contrast agents [2]. By accelerating the longitudinal or transverse relaxation of water protons, they increase the signal-to-noise ratio, which, in turn, positively influences the image contrast. The currently used clinical contrast agents are mainly Gd3+ chelates, making use of the high magnetic moment (seven unpaired electrons) and slow electronic relaxation of this paramagnetic lanthanide ion [3, 4]. These contrast agents are, however, mostly nonspecific and provide only anatomical information. Nowadays, there is an active search for new classes of contrast agents capable of reflecting a change in biological activity in their local environment. A new field, molecular imaging, is being developed, with the aim of in vivo visualization of molecular events. Any molecular imaging procedure requires an imaging probe that is specific for a given molecular event. Examples of such “smart” potential contrast agents, sensing variables like pH [5–7], partial oxygen pressure [8, 9], ion and metabolite concentration [10–14], or enzyme activity [15, 16] have been described in the literature. They function on the basis of the modulation of one or more microscopic parameters of the Gd3+ chelate determining relaxivity, induced by a change in the local environment of the agent. Among the variables that influence the relaxivity of a contrast agent, the most important are the applied magnetic field (B0), the number of water molecules directly bound to the paramagnetic center (q), their exchange rate (kex), the water proton–Gd3+ distance (rGdH), the electron spin relaxation times (T1e, T2e), the rotational correlation time (τR), and the presence and the number of water molecules in the so-called second coordination sphere (q2nd) [2, 4, 17, 18].
Calcium (Ca2+) is one of the most important metal ions for life as it controls muscular contraction, neural cell communication, hormonal secretion, etc. [19]. In the brain, Ca2+ acts as an important second messenger [20]. Synaptic transmission depends on the entry of calcium ions at the presynaptic terminal to cause fusion and release of vesicles. Significant changes in Ca2+ concentration take place during neuronal activity [21]. Tracking the dynamics of Ca2+ concentration changes could thus contribute to the understanding of basic aspects of neuronal regulation or to highlight the abnormalities in the diseased state [22]. Optical imaging based on fluorescent dyes possessing a calcium-dependent response has been widely used at the cellular or cell population level [23]. However, the intrinsic depth limitations associated with optical imaging restrict these applications to superficial regions. In contrast to optical imaging, MRI has no depth penetration limits and could be more adapted for tracking Ca2+ changes. Li et al. [11, 24] have proposed a potential MRI contrast agent, GdDOPTA, whose relaxivity was reported to be sensitive to Ca2+ concentration in the 0.1–10-μM range. The two macrocyclic subunits of the dimeric ligand DOPTA serve as lanthanide(III) ion chelators, while the BAPTA4− subunit bridging the macrocycles is known for its high selectivity towards Ca2+ [H4BAPTA is 1,2-bis(o-aminophenoxy)ethane-N,N,N′,N′-tetraacetic acid]. The mechanism proposed for the Ca2+-dependent relaxivity change of GdDOPTA accounts for changes in the number of water molecules directly bound to the paramagnetic metal ion (q) upon Ca2+ binding to the BAPTA4− moiety. BAPTA4− was proposed a long time ago as a selective fluorescent indicator for Ca2+ [25]. It presents several advantages for biological Ca2+ detection by optical methods: integrated aromatic chromophore moiety and pH insensitivity of Ca2+ complexation thanks to the low values of the protonation constants (6.36 and 5.47, both below physiological pH). More recently, another calcium-sensitive MRI probe was proposed by Atanasijevic et al. [20]. It is based on superparamagnetic iron oxide nanoparticles and calmodulin. In this approach, calcium-dependent protein–protein interactions lead to particle clustering and consequent changes in transverse relaxivity. Similarly to GdDOPTA, this agent had calcium-response in the micromolar Ca2+ concentration range. It was therefore proposed to detect elevated intracellular Ca2+ levels, provided it is combined to a cellular delivery system.
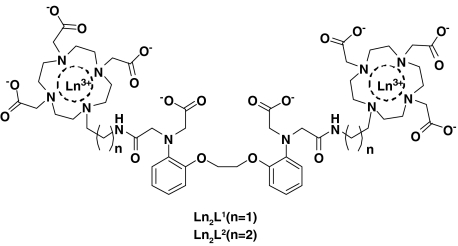
With the objective of detecting extracellular Ca2+ concentration changes by MRI methods, we synthesized two novel potential bismacrocyclic MRI contrast agents (Structure 1). Two Gd3+-loaded 1,4,7,10-tetraazacyclododecane-1,4,7-triacetic acid (DO3A) derived units were connected by a BAPTA-derived linker capable of Ca2+ binding. However, in comparison with BAPTA4−, the Ca2+ binding moiety in the central part of the ligand was designed to have a reduced affinity towards Ca2+ in order to shift to higher Ca2+ concentrations the range where the probe is expected to have a relaxivity response. The conditional stability constant of GdDOPTA–Ca at physiological pH was reported to be 1.0 × 10⁶ M−1 [11]. Similarly, the fluorescent Ca2+ indicators used in biological applications and based on BAPTA4− are adapted to assess the cytosolic free Ca2+ concentration in the micromolar range. In contrast, the extracellular concentration of Ca2+ is in the millimolar range. The relaxivity response of a probe with affinity of K ∼ 106 M for Ca2+ would have already leveled off at the millimolar level. The BAPTA4− ligand was therefore modified by replacing two carboxylates by the less strong donor amide functions. As for the macrocyclic Gd3+ binding site, it was designed to respond to the presence of Ca2+ by modulation of the hydration number with consequent change in the relaxivity.
Structure 1.
The proton relaxivities of the two new complexes were studied by relaxometric titrations at different Ca2+ concentrations and the relaxivity modulation by the Ca2+ concentration changes was confirmed. We specifically aimed to identify the microscopic factors responsible for the Ca2+-dependent relaxivity response. To this end, a detailed mechanistic study was carried out. We used UV–vis absorption and luminescence lifetime measurements on the corresponding Eu3+ complexes to assess the number of inner-sphere water molecules and their variation on Ca2+ addition. The Gd2L1 complex was characterized by variable-temperature 17O NMR spectroscopy and variable-field relaxivity measurements (nuclear magnetic relaxation dispersion, NMRD). The experimental data were evaluated on the basis of the Solomon–Bloembergen–Morgan theory, extended with a second-sphere contribution.
Experimental
Materials and methods
All chemicals were purchased at the purest grade commercially available and were used without further purification. Cyclen was purchased from Strem, France. Bromoethylamine hydrogen bromide, bromopropylamine hydrobromide, tert-butyl bromoacetate, N-methylpyrollidinone (dry), pyridine, H4BAPTA, acetic anhydride and N,N-dimethylformamide (extra dry) were purchased from Sigma-Aldrich, Germany. Toluene, acetonitrile, dichloromethane and methanol were purchased as analytical grade solvents from Acros Organics, Germany. Lanthanide(III) chlorides were prepared by dissolving metal(III) oxides (Aldrich) in a slight excess of HCl (Carlo Erba, 37%) followed by evaporation of solvents and dissolution in H2O.
High-performance liquid chromatography (HPLC) was performed at room temperature using a Varian (Australia) PrepStar instrument equipped with a PrepStar 335 photodiode array detector at 254 nm. Reversed-phase analytical HPLC was performed in a stainless steel ChromSep (length 250 cm, internal diameter 4.6 mm, outside diameter 3/8 in. and particle size 8 μm) C18 column (Varian). The ligands were purified using the following gradient:
Method A: 40% solvent A (methanol) and 60% solvent B (water) to 100% solvent B in 5 min running isocratically at 100% solvent B for 10 min and then to 60% solvent B in the next 2 min.
Method B: 95% solvent A (acetonitrile, 0.1% HCOOH) and 5% solvent B (water, 0.1% HCOOH) to 70% solvent B in 10 min and then 100% in the next 8 min running isocratically for 12 min after that and then to 5% in next 2 min.
The flow rate used for analytical HPLC was 1 mL min−1 and for preparative 65 mL min−1. All solvents used were HPLC grade filtered through a 0.45-μm nylon-66 Millipore filter prior to use.
1H and 13C NMR spectra were recorded using a Bruker 400 MHz spectrometer (1H—internal reference CDCl3 at 7.27 ppm or D2O at 4.75 ppm; 13C—internal reference CDCl3 at 77.0 ppm or tetramethylsilane at 0 ppm). All the experiments were performed at 298 K. Electrospray ionization (ESI) low-resolution mass spectrometry (LRMS) spectra were obtained using an SL 1100 system (Agilent, Germany) with ion-trap detection in positive and negative ion mode. IR spectra were recorded with a Nicolet Impact 400 D spectrometer using neat compounds as disks with KBr and only the major bands were noted. UV–vis spectra of 5D0 ← 7F0 transitions of Eu2L1 were obtained with a PerkinElmer Lambda 19 spectrometer in the region 577–581 nm with data steps of 0.05 nm [26]. The concentrations of the samples were approximately 0.02 M and the temperature dependence was measured in the interval 288–323 K in the absence and presence of Ca2+. To maintain a constant temperature, thermostatizable cells with a 10-cm optical length were used. The luminescence measurements were performed with a Varian Eclipse spectrofluorimeter, equipped with a 450-W xenon arc lamp, a microsecond flash lamp and a red-sensitive photomultiplier (300–850 nm). The luminescence spectra were obtained after excitation of the 5L6 ← 7F0 band (394 nm). An aqueous solution (0.02 M) of Eu2L1 was measured at 298 K in the absence and presence of Ca2+.
The 1H NMRD profiles were recorded at the Laboratory of Inorganic and Bioinorganic Chemistry, Ecole Polytechnique Fédérale de Lausanne, Switzerland, using a Stelar Spinmaster FFC fast-field-cycling relaxometer covering magnetic fields from 2.35 × 10⁻⁴ to 0.47 T (proton Larmor frequency range 0.01–20 MHz). The temperature was controlled by a VTC90 temperature control unit and fixed by a gas flow. At higher fields, the relaxivity was recorded using Bruker Minispecs mq30 (30 MHz), mq40 (40 MHz) and mq60 (60 MHz), on a Bruker 4.7 T (200 MHz) cryomagnet connected to a Bruker Avance 200 console and with a Bruker Avance 500 spectrometer (500 MHz). The temperature was measured by a substitution technique [27] or via a preliminary calibration using methanol and ethylene glycol standards [28]. The longitudinal (1/T1) and transverse (1/T2) 17O NMR relaxation rates were measured in the temperature range 277–344 K. The data were recorded using a Bruker Avance 500 (11.75 T, 67.8 MHz) spectrometer. The temperature was calculated according to a previous calibration with ethylene glycol and methanol [28]. The samples were measured in 5-mm NMR tubes and were enriched with tert-butanol to allow for the bulk magnetic susceptibility correction [29]. The 1/T1 data were obtained by the inversion recovery method, while the 1/T2 data were measured by the Carr–Purcell–Meiboom–Gill spin-echo technique. Acidified water (HClO4, pH 3.8) was used as an external reference. Analyses of the 17O NMR and 1H NMRD experimental data were performed with the Visualiseur/Optimiseur programs running on a MATLAB platform version 6.5 [30, 31].
Synthesis
Compound 4a was synthesized according to a previously reported procedure [32]. With use of an analogous method, compound 4b was synthesized via 3b from the substrate 1b [33].
Compound 3b. 1H NMR (CDCl3, 400 MHz), δ (ppm): 6.97–6.84 (m, 5H), 4.65 (s, 2H), 2.98–2.89 (m, 2H), 2.86–2.70 (m, 5H), 2.70–2.60 (m, 3H), 2.58–2.17 (m, 7H), 2.16–1.75 (m, 9H), 1.32 (br s, 2H), 1.06–1.03 (m, 27H). 13C NMR 172.2, 171.2, 155.2, 152.9, 135.6, 127.1, 126.4, 81.3, 81.0, 65.7, 64.7, 55.4, 50.3, 48.9, 38.5, 37.8, 28.2, 26.7, 26.5, 25.2. ESI–MS m/z: [M + H]+ calcd for C37H63N5O8, 705.5; found, 706.5.
Compound 4b. 1H NMR (CDCl3, 400 MHz), δ (ppm): 8.19 (br s, 2H), 3.42–2.99 (m, 8H), 2.85–2.20 (m, 16H), 1.61 (br s, 2H), 1.41 (s, 27H). 13C NMR (CDCl3, 100 MHz), δ (ppm): 172.0, 169.8, 81.8, 81.1, 57.2, 55.9, 50.1, 49.4, 48.9, 38.5, 27.2, 27.1, 22.9. ESI–MS m/z: [M + H]+ calcd for C29H57N5O6, 571.4; found, 572.4 .
General method for the synthesis of compounds 6a and 6b
Compound 4a or 4b (2 mmol) was dissolved in 5 mL of dry N-methylpyrollidinone with 50 μL of dry Et3N and heated at 333 K for 15 min. Anhydride 5 [34] was then added to this reaction mixture (295 mg, 0.67 mmol) in small lots under N2. After complete addition of 5, the solution was kept under continuous stirring at 333 K overnight. It was then evaporated, dissolved in dichloromethane and extracted with water. The organic layer was collected and evaporated to get a yellow oil. The crude product was then purified by reversed-phase HPLC using method A to get a light yellow fluffy solid.
1,2-Bis{[2-{[({1-[1,4,7-tris(tert-butoxycarbonylmethyl)-1,4,7,10-tetraazacyclododecane-10-yl]eth-2-yl}amino)carbonyl]methyl}-(carboxymethyl)amino]phenoxy}ethane, 6a. Yield: 573 mg (55%) 1H NMR (CDCl3, 400 MHz), δ (ppm): 7.01–6.98 (m, 2H), 6.92–6.89 (m, 2H), 6.77–6.74 (m, 4H), 4.56 (d, J = 6.4 Hz, 2H, CHHO), 4.34 (d, J = 15.5 Hz, 2H, CHHCONH), 4.01 (d, J = 17.8 Hz, 2H, CHHCOOH), 3.91 (d, J = 6.4 Hz, 2H, CHHO), 3.48 (d, J = 17.8 Hz, 2H, CHHCOOH), 3.36–3.21 (m, 22H), 3.08–2.80 (m, 12H), 2.78–2.69 (m, 6H), 2.76–2.56 (m, 18H), 1.47 (s, 36H), 1.43 (s, 18H). 13C NMR (CDCl3, 100 MHz), δ (ppm): 175.2 (CONH), 175.0 (CONH), 170.2, 170.1, 149.4, 139.2, 120.6, 119.5, 115.4, 112.1, 81.8, 81.5, 66.4 (CH2O), 60.7 (NCH2CONH), 58.5 (CH2COOH), 56.5, 54.8, 53.5, 51.3, 50.3, 49.7, 47.8, 32.1 (CH2CH2CONH), 29.6, 28.1. ESI–MS m/z: [M + H]+ calcd for C78H130N12O20, 1,554.9; found, 1,555.9.
1,2-Bis{[3-{[({1-[1,4,7-tris(tert-butoxycarbonylmethyl)-1,4,7,10-tetraazacyclododecane-10-yl]prop-3-yl}amino)carbonyl]methyl}-(carboxymethyl)amino]phenoxy}ethane, 6b. Yield: 424 mg (40%). 1H NMR (CDCl3, 400 MHz), δ (ppm): 7.08–7.06 (m, 2H), 6.91–6.89 (m, 2H), 6.85–6.82 (m, 4H), 4.49 (br s, 2H), 4.31 (br s, 4H), 4.08–3.73 (m, 8H), 3.57–3.09 (m, 20H), 3.04–2.47 (m, 32H), 2.40 (br s, 4H), 2.01 (br s, 2H), 1.53 (s, 18H), 1.48 (s, 36H). 13C NMR (CDCl3, 100 MHz), δ (ppm): 175.7, 173.4, 170.9, 170.2, 150.2, 139.8, 120.3, 120.2, 115.7, 112.2, 82.2, 82.0, 66.6, 61.0, 58.7, 56.5, 55.3, 49.6, 49.1, 47.6, 35.5, 28.6, 28.4, 22.2. ESI–MS m/z: [M + H]+ calcd for C80H134N12O20, 1,582.9; found, 1,584.0.
General method for the synthesis of L1 and L2
Neat trifluoroacetic acid (70 mL) was added to the previously obtained compound 6a or 6b (0.32 mmol) and the reaction was kept at room temperature for 24 h. Trifluoroacetic acid was then evaporated, and the residue was dried under vacuum and purified by reversed-phase HPLC using method B.
1,2-Bis{[2-{[({1-[1,4,7-tris(carboxymethyl)-1,4,7,10-tetraazacyclododecane-10-yl]eth-2-yl}amino)carbonyl]methyl}-(carboxymethyl)amino]phenoxy}ethane, L1. Yield: 220 mg (60%). 1H NMR (CDCl3, 400 MHz), δ (ppm): 7.06–6.99 (m, 4H), 6.94 (t, J = 7.0 Hz, 2H), 6.87–6.85 (m, 2H), 4.27 (s, 4H), 3.83 (s, 4H), 3.77 (s, 4H), 3.58 (br s, 8H), 3.45 (s, 4H), 3.28–3.12 (m, 24H), 3.02–2.97 (m, 4H), 2.82–2.75 (m, 12H). 13C NMR (D2O, 100 MHz), δ (ppm): 177.6, 174.7, 170.5, 169.9, 150.1, 138.9, 122.5, 121.4, 117.4, 113.0, 67.0, 57.9, 56.7, 56.1, 55.3, 51.0, 50.6, 50.5, 49.2, 47.6, 33.5. IR (cm−1): 3,426 (vs), 2,964 (m), 2,929 (m), 2,860 (m), 1,718 (s), 1,637 (vs), 1,384 (s), 1,355 (s), 1,328 (m), 1,240 (s), 1,203 (s), 762 (m), 694 (m). ESI–MS m/z: [M−H]− calcd for C54H82N12O20, 1,218.57; found, 1,217.7.
1,2-Bis{[3-{[({1-[1,4,7-tris(carboxymethyl)-1,4,7,10-tetraazacyclododecane-10-yl]prop-3-yl}amino)carbonyl]methyl}-(carboxymethyl)amino]phenoxy}ethane, L2. Yield: 126 mg from 400 mg of 6b (40%). 1H NMR (D2O, 400 MHz), δ (ppm): 6.98–6.91 (m, 4H), 6.88 (t, J = 7.4, 2H), 6.82–6.80 (m, 2H), 4.20 (s, 4H), 3.78 (s, 4H), 3.74 (s, 4H), 3.57 (s, 4H), 3.39–3.31 (m, 8H), 3.27–3.20 (m, 8H), 3.13–2.92 (m, 20H), 2.89–2.83 (m, 8H), 2.65 (br s, 4H), 1.61–1.53 (m, 4H). 13C NMR (D2O, 100 MHz), δ (ppm): 177.7, 174.4, 149.9, 138.5, 122.3, 121.5, 117.4, 113.2, 67.1, 57.6, 56.2, 56.1, 55.4, 50.9, 50.5, 49.6, 49.2, 36.4, 22.6. ESI–MS m/z: [M−H]− calcd for C56H86N12O20, 1,246.6; found, 1,245.6.
Preparation of solutions of lanthanide(III) complexes
The complexes used for 1H and 17O relaxometric and UV–vis measurements were prepared by mixing a slight excess (5%) of the ligand solution with the appropriate lanthanide(III) chloride solution. The pH was adjusted to 7 using KOH solution and the reaction mixture was stirred at 323 K overnight. The absence of free Ln3+ was checked by xylenol orange indicator in HCl/urotropine buffer (pH 5.8). For each Gd2L sample, the Gd3+ concentration was determined by measuring the bulk magnetic susceptibility shifts [35].
Gd2L1. ESI–LRMS m/z: [M−H + Na]− calcd for C78H124Gd2N12O20, 1,525.1; found, 1,547.6. IR: 3,448 (vs), 1,602 (vs), 1,560 (s), 1,400 (m), 1,323 (m), 1,242 (m), 1,203 (vs), 1,085 (m), 762 (m), 723(m).
Eu2L1. ESI–LRMS m/z: [M−H]− calcd for C54H76Eu2N12O20, 1,156.4; found 1,155.5.
Gd2L2. ESI–LRMS m/z: [M + H]+ calcd for C56H80Gd2N20O12, 1,553.1; found, 1,553.6.
Relaxometric Ca2+ titrations of Gd2L1 and Gd2L2
The titrations were performed at 11.75 T, 298 K and pH 7.3 [maintained by N-(2-hydroxyethyl)piperazine-N′-ethanesulfonic acid buffer]. A solution of CaCl2 of known concentration was added stepwise to the complex solution and the longitudinal proton relaxation time T1 was measured after each Ca2+ addition. The initial Gd3+ concentrations were 7.4 and 4.0 mM for Gd2L1 and Gd2L2, respectively. The relaxivity r1 was calculated from Eq. 1, using the actual Gd3+ concentration at each point of the titration:
 |
1 |
where T1,obs is the observed longitudinal relaxation time, T1,d is its diamagnetic contribution in the absence of the paramagnetic substance and [Gd] is the concentration of Gd3+.
Relaxometric Mg2+ titration of Gd2L1
The titration was done analogously to the Ca2+ titration (B = 11.75 T, 298 K; initial Gd3+ concentration of 2.6 mM). When the Mg2+-to-complex ratio was 23 (in the Ca2+ titration, the plateau was already reached at this Ca2+-to-Gd2L1 ratio), a Ca2+ solution was added stepwise and the relaxivity was measured.
Results and discussion
Synthesis of ligands
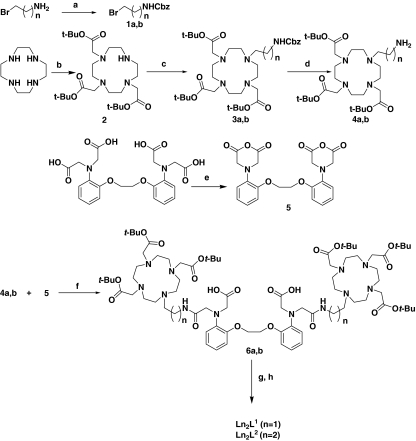
The ligands were prepared from the appropriate anhydride and amine precursors in a facile two-step procedure as shown in Scheme 1. Compounds 1a, 1b, 2 and 5 were synthesized according to reported procedures [32–34]. Protected amines 3a an 3b were synthesized by alkylating 2 with 1a or 1b in acetonitrile. Hydrogenation of the resulting products in methanol using 10% Pd on carbon as a catalyst yielded 4a and 4b. Bismacrocycles 6a and 6b were obtained by coupling of amines 4a or 4b to an anhydride 5 in N-methylpyrrolidinone and triethylamine. After the purification, they were hydrolyzed with neat trifluoroacetic acid and purified by reversed-phase HPLC giving the final ligands L1 and L2. It is interesting to note that an additional proof for the extremely high steric constraints in the bismacrocyclic systems studied was observed in 2D NMR (correlation spectroscopy, heteronuclear single quantum coherence) spectra of 6a (Figs. S13, S14). The splitting of the signals occurs on all methylene groups not belonging to the macrocyclic ring; this disappears upon the removal of tert-butyl protective groups in L1.
Scheme 1.
Synthesis of the ligands and their lanthanide(III) complexes. Reagents and conditions: a benzyl chloroformate, K2CO3, water/dioxane; b tert-butylbromoacetate, NaHCO3, MeCN, 70%; c 1a or 1b, K2CO3, MeCN, 60%; d H2, Pd/C, MeOH; e Ac2O, pyridine, 75%; fN-methylpyrollidinone, Et3N; g trifluoroacetic acid; h LnCl3·6H2O
Relaxometric Ca2+ titrations of Gd2L1 and Gd2L2
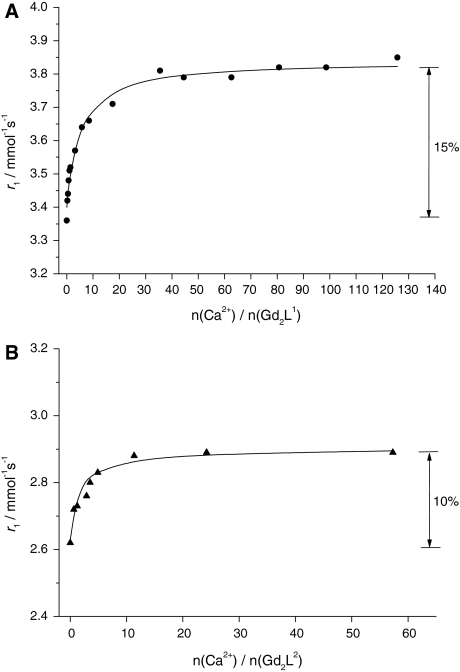
The titration curves are represented as the variation of the relaxivity of the Gd3+ complex solution versus the Ca2+ concentration (Fig. 1). The maximum relaxivity increase upon Ca2+ addition was 15% for Gd2L1 and 10% for Gd2L2. The saturation of both curves occurs at relatively high Ca2+ concentrations (approximately 20 equiv of Ca2+ for Gd2L1 and approximately 5 equiv of Ca2+ for Gd2L2). The titration curves were fitted to obtain the apparent association constants, which are log K = 1.9 ± 0.2 and log K = 2.7 ± 0.2 for Gd2L1 and Gd2L2, respectively. Similarly to the case for previously investigated BAPTA-type complexes [11, 25], 1:1 binding stoichiometry has been assumed. These association constants are to be compared with the conditional stability constant, log Kcond = 6.9 of CaBAPTA2− at pH 7.0, calculated by taking into account the protonation constants of BAPTA4− [25]. The constants obtained for our systems are 3–4 orders of magnitude lower. This difference can be rationalized by the fact that even on Ca2+ binding, the amide groups of the ligand remain coordinated to the lanthanide as indicated by proton relaxivity and luminescence data on the Gd3+ and Eu3+ complexes, respectively (see below). Therefore, in comparison with CaBAPTA2−, there are two carboxylate donors fewer coordinating to the Ca2+ ion, which is responsible for the considerably reduced stability. It is interesting to note that the stability of the Gd2L2–Ca complex is somewhat higher than that of Gd2L1–Ca. This is likely related to the higher flexibility of the Ca2+ binding site in Gd2L2–Ca, where the propylene linker between the macrocycle and the Ca2+ binding site induces fewer steric constraints, hence ensuring a better “overwrapping” of the cation by the chelator. We have to note that for GdDOPTA-Ca, possessing an integral BAPTA4− unit for Ca2+ binding, Li et al. [11] reported a much higher apparent association constant, K = 1.0 × 10⁶ M.
Fig. 1.
Relaxometric Ca2+ titration curves of Gd2L1 (a) and Gd2L2 (b) obtained at 298 K and 11.75 T. The lines correspond to the fit as explained in the text
Relaxometric Mg2+ titration of Gd2L1
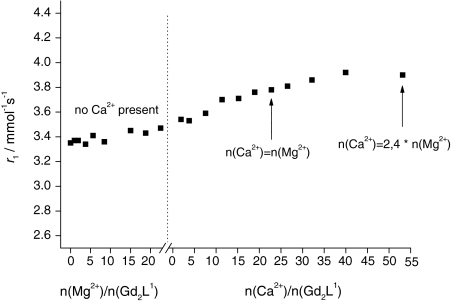
The relaxivity remains approximately constant upon addition of Mg2+, then it increases upon Ca2+ addition even in the presence of a large amount of Mg2+ (Fig. 2). The relaxivity increase after Ca2+ addition (16%) was similar to that observed in the Ca2+ titration without the presence of Mg2+. The insensitivity of Gd2L1 towards Mg2+ is due to the lower stability of BAPTA-derived complexes with Mg2+ compared with Ca2+. The titration curve shows that, though the affinity of our chelator for Ca2+ is diminished in comparison with BAPTA4−, the selectivity versus Mg2+ is conserved. The discrimination of BAPTA-type ligands towards Ca2+ compared with Mg2+ is supposed to stem from the right size of the binding cavity for the larger-sized Ca2+, which is already too big for Mg2+ and cannot constrict further to envelop snugly this smaller cation (the association constant of MgBAPTA2− is log K = 1.8) [25]. Spectrophotometric measurements on the Mg2+–BAPTA system proved that Mg2+ coordination affects only half of the ligand, in contrast to Ca2+ coordination, where the entire ligand is involved [25].
Fig. 2.
Relaxometric titration curve of Gd2L1 with Mg2+ followed by addition of Ca2+ (298 K, 11.75 T)
Luminescence and UV–vis absorption studies to assess the hydration state of Eu2L1
In order to determine the number of water molecules coordinated to the lanthanide ion before and after Ca2+ binding to the complex, we performed luminescence lifetime measurements on Eu2L1 in H2O and D2O solutions [36–38]. In the absence of Ca2+, the luminescence lifetimes are  and
and  . The hydration number, q = 0.4, was calculated according to the revised equation of Beeby et al. [38] which involves a correction for the contribution of second-sphere water molecules (Eq. 2):
 |
2 |
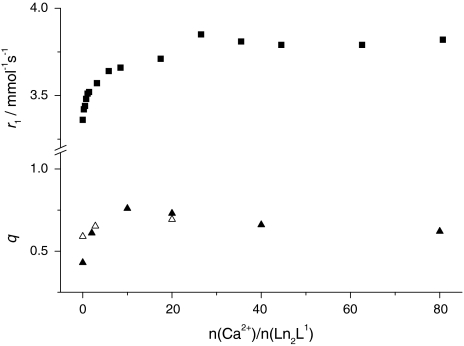
where A′ is 1.2 ms and the correction factor for the contribution of the second sphere is −0.25 m s−1. The longitudinal 17O and 1H relaxation rates (vide supra) indicate that we cannot neglect the effect of second-sphere water molecules. The noninteger hydration number suggests the presence of both q = 1 and q = 0 species. Upon the addition of Ca2+ to the Eu3+ complex, the hydration number determined by luminescence increases to q ≈ 0.7  (Fig. 3). Such an increase of q can be interpreted in terms of a shift towards the monohydrated species.
Fig. 3.
Dependence of the relaxivity r1 and of the hydration number q on the Ca2+-to-complex ratio for Ln2L1. Squares correspond to the relaxivity values obtained from the relaxometric titration of Gd2L1 (298 K, 11.75 T). Filled triangles represent the hydration number obtained from luminescence lifetime studies on Eu2L1 and open triangles correspond to the molar fraction of the monohydrated species determined for Eu2L1 by UV–vis spectroscopy (ratio of the integrals of the absorption bands corresponding to monohydrated and nonhydrated complex; see text)
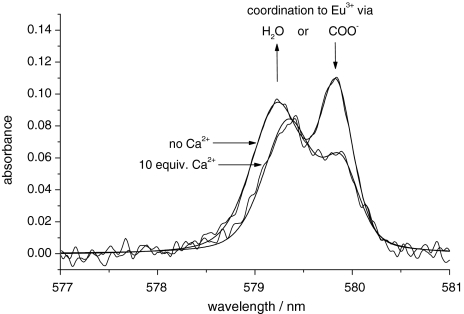
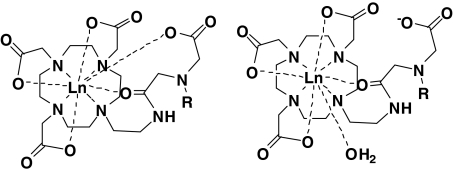
To investigate further the hydration state, variable-temperature UV–vis measurements were performed on Eu2L1. In general, the presence of a hydration equilibrium of europium(III) species leads to the appearance of two absorption bands for the 5D0 ← 7F0 transition with peak separations of more than 0.5 nm [39, 40]. High-resolution UV–vis absorption spectra of a Eu2L1 aqueous solution (pH 7) were recorded in the 577–581-nm region at various temperatures and Ca2+ concentrations. The measurements revealed two temperature-invariant absorption bands, which could be deconvoluted into two symmetrical peaks (Fig. 4). The separation of those peaks is about 0.5 nm and lies in the range typical of different coordination environments of Eu3+ [41, 42]. We assume that in the absence of Ca2+, there are two nine-coordinate species present; in both species the amines and carboxylates of the macrocycle as well as the amide oxygen are coordinated to the lanthanide, and either carboxylate from the central part or one water molecule completes the coordination sphere to a coordination number of nine, which is the usual coordination number for this type of Ln3+ complex (Fig. 5). The coordination of amide oxygens is supported by IR measurements performed on the ligand L1 and its Gd3+ complex: the comparison of the two IR spectra (Figs. S5, S6) shows that the amide absorption is affected by complexation to the lanthanide ion.
Fig. 4.
Experimental and fitted UV–vis spectra (323 K, pH 7) of Eu2L1 in the absence and presence of Ca2+. On addition of Ca2+, the relative intensity of the band at lower wavelength increases, while that of the band at higher wavelength decreases
Fig. 5.
Proposed structures present in aqueous solution of Ln2L1. R stands for the remaining part of the bismacrocyclic complex
Among analogous structures, lanthanide complexes of monomeric DO3A derivatives bearing –(CH2)n–NHCO–R (n = 2, 3) amide units have been reported in the literature [43]. With Eu3+ and Gd3+, the n = 2 ligand forms monohydrated complexes, while the n = 3 ligand forms nonhydrated complexes. In contrast to this, Eu2L1 contains a carboxylate in the central part as a potential donor which can partially replace the water molecule in the inner coordination sphere. This leads to the presence of the two structures as proposed in Fig. 5, and consequently to a reduced hydration number.
Upon Ca2+ addition to a Eu2L1 solution, the relative intensity of the two UV–vis absorption bands changes: the band at higher wavelengths decreases, while the other band increases (Fig. 4) [44]. In parallel, the luminescence measurements indicate an increase of the hydration number. Therefore, we conclude that the band which decreases in intensity (at 579.9 nm) on Ca2+ addition can be attributed to the q = 0 complex, while the band which increases in intensity (579.3 nm) can be attributed to the monohydrated complex. We assume that both in the presence and in the absence of Ca2+, the amide oxygen remains coordinated to the lanthanide ion to preserve the overall coordination number of nine. If the amide oxygen participated also in the Ca2+ coordination, the concomitant increase in the hydration number and in relaxivity would be more prominent than what is experimentally observed. The Ca2+ binding in the central part of the complex demands the coordination of the central carboxylates, which, by leaving the coordination environment of Ln3+, allow a water molecule to bind to the lanthanide ion. Therefore, the Ca2+ binding in the central part will favor the formation of the monohydrated complex (Fig. 5).
Relation between the Ca2+-dependent hydration number q and relaxivity
Upon stepwise addition of Ca2+, we observe a good correlation between the relaxivity increase of the Gd2L1 complex and the increase in q determined from the luminescence lifetime measurements on the Eu3+ analogue (Fig. 3). In addition, we also calculated the ratio of the integrals of the two UV–vis absorption bands (attributed to q = 0 and q = 1) of Eu2L1 at various Ca2+ concentrations. The q values obtained in this way overlap with those measured by luminescence. This supports our hypothesis that the complex Ln2L1 exists in the form of two differently hydrated species, each with an overall coordination number of nine. As was proved by the UV–vis studies, their ratio is temperature-independent but it shifts towards the monohydrated species with increasing Ca2+ concentration, resulting in a relaxivity increase.
The relaxivity of the Gd2L2 complex is lower than that of the L1 analogue, which suggests that q is also lower. In the case of the monomeric DO3A derivatives bearing –(CH2)n–NHCO–R amide units, with the propyl-linked (n = 3) amide q = 0 was determined for the Eu3+ and Gd3+ complexes [43]. The extra steric demand associated with the enlargement of the chelate ring incorporating the amide carbonyl group was found to be sufficient to suppress water coordination. For Gd2L2, the relaxivities suggest q > 0. Moreover, the relaxivity increases on Ca2+ addition, though to a smaller extent than for Gd2L1. Therefore, we assume that two differently hydrated species exist also for Ln2L2 complexes, with an increased proportion of the nonhydrated species compared with Ln2L1. The relaxivity change observed on Ca2+ addition indicates that the central carboxylate participates in the lanthanide coordination; on Ca2+ binding this carboxylate is removed from the lanthanide ion and replaced by a water molecule. The small relaxivity change shows that the participation of this carboxylate in the lanthanide coordination is limited with respect to Gd2L1.
For GdDOPTA, Li et al. [11, 24] reported a more important variation of q and a correspondingly greater relaxivity change on Ca2+ binding. This is likely related to the more flexible nature of the central BAPTA4− part of the DOPTA ligand in contrast to the BAPTA-bisamide moiety in our case, where the monoamide functionalities are integrated in the central skeleton of the ligand and have much less flexibility to change coordination from Gd3+ to Ca2+.
1H and 17O relaxation studies of Gd2L1: evaluation of the parameters influencing proton relaxivity
1H NMRD profiles were recorded for Gd2L1 with and without Ca2+. In the presence of Ca2+, an increase in the relaxivity was observed at all frequencies, related to an increase in the hydration number. The relaxivity at 20 MHz and 298 K in the absence and presence of Ca2+ is 5.74 and 6.13 mM−1 s−1, respectively, slightly higher than the relaxivites of currently used MRI contrast agents [2, 4, 19, 45].
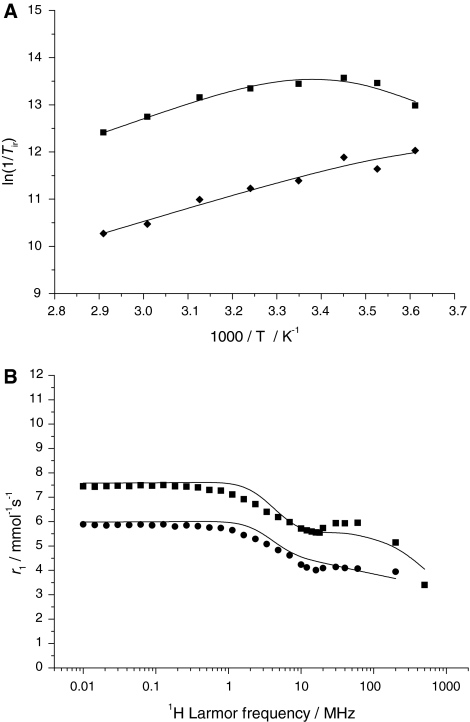
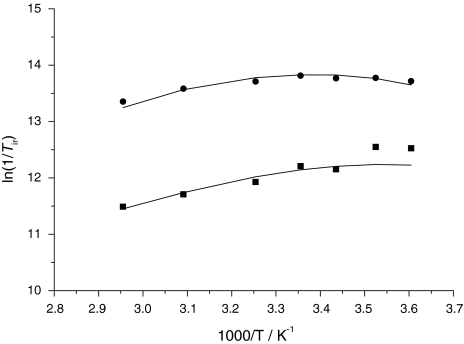
The transverse 17O relaxation rates indicate a relatively slow water exchange (Fig. 6), which is visible from the curve of ln(1/T2r) versus inverse temperature: at low temperatures, 1/T2r decreases with decreasing temperature. The reduced chemical shifts (Δωr) in the absence of Ca2+ are smaller than would be expected for a q = 0.4 complex. Such small chemical shifts have previously been observed in systems with a significant second-sphere contribution [46]. Therefore, the chemical shifts were not included in the final fitting. For the Ca2+-free system, the transverse and longitudinal 17O relaxation rates and the 1H NMRD data were analyzed simultaneously (Fig. 6) on the basis of the Solomon–Bloembergen–Morgan approach, extended by a second-sphere contribution [46, 47]. The presence of free carboxylates in the complex induces a second-sphere contribution that affects both 1H and 17O longitudinal relaxation. In fact, by fitting the 17O 1/T1 values without second-sphere contribution, we obtained inconceivably high rotational correlation times. The inner-sphere hydration number q was fixed to 0.4, the value found by luminescence measurements on Eu2L1. Since Eu3+ and Gd3+ have similar ionic radii, we expect a similar hydration mode for Gd2L1. To describe the second-sphere contribution, one water molecule per Gd3+ (q2nd = 1) was considered during the fitting. The distance between the Gd3+ ion and the second-sphere water proton and oxygen was fixed to r2ndGd–H = 3.5 Å and r2ndGd–O = 4.1 Å, respectively, the enthalpy of activation to ΔH#2nd = 35 kJ mol−1, and the second-sphere water residence time to τ2ndm = 50 ps [46, 47]. Other parameters were also fixed during the fitting in order to add some constraints. They are as follows: the hyperfine coupling constant, A/ħ = −3.8 MHz; the distance between Gd3+ and the oxygen and the proton of the first-sphere water molecule, rGdO = 2.5 Å and rGdH = 3.1 Å, respectively. The distance of the closest approach of outer-sphere water molecules to Gd3+, a, was fixed to 3.6 Å. The quadrupolar coupling constant [χ(1 + η2/3)1/2] was set to 7.58 MHz, the value of pure water. The activation energy Ev had to be fixed to 1 kJ mol−1, otherwise the fit converged to negative values. In the fitting procedure, we used a model which considers different rotational correlation times for Gd–O and Gd–H rotating vectors (τ298RO and τ298RH, respectively) [48]. For geometrical reasons, their ratio (τ298RH/τ298RO) has to lie between 0.65 and 1. The most important parameters obtained from the best simultaneous least-squares fit to the experimental data are listed in Table 1. For the complete fitting results, see Table S9.
Fig. 6.
Variable-temperature 17O NMR [a; ln(1/T1r) diamonds, ln(1/T2r) squares] and 1H nuclear magnetic relaxation dispersion (b; 298 K squares, 310 K circles) data of Gd2L1 in the absence of Ca2+. The curves correspond to the simultaneous fit as explained in the text
Table 1.
Kinetic and structural parameters obtained from the fit of 17O NMR and NMR dispersion (NMRD) data for the Gd2L1 complex in the absence and in the presence of Ca2+, compared with those of gadolinium 1,4,7,10-tetraazacyclododecane-1,4,7,10-tetraacetic acid (GdDOTA)
| Parameters | Gd2L1 17O NMR + NMRD |
Gd2L1 + Ca2+ 17O NMR |
GdDOTA 17O NMR + NMRDa |
|---|---|---|---|
| k298ex (106 s−1) | 2.4 ± 0.2 | 7.5 ± 1.6 | 4.1 |
| ΔH‡ (kJ mol−1) | 43.6 ± 3.3 | 43.6 | 49.8 |
| ΔS‡ (J mol−1 K−1) | +23.5 | +33.0 | – |
| τ298RO (ps) | 350 ± 50 | 1,150 ± 250 | 77 |
| Er (kJ mol−1) | 24 ± 1 | 21 ± 6 | 16.1 |
| τ298v (ps) | 20.6 ± 2.7 | 0.13 ± 0.02 | 11 |
| Δ2 (1020 s−2) | 0.46 ± 0.10 | 0.50 ± 0.05 | 0.16 |
| q | 0.4 | 0.7 | 1 |
| q2 ns | 1 | 1 | – |
| r2981 (mM−1 s−1) 20 MHz | 5.74 | 6.13 | 4.74 |
Parameters in italics were fixed during the fitting
aReference [49]
The water exchange of Gd2L1 is slightly slower than that found for gadolinium 1,4,7,10-tetraazacyclododecane-1,4,7,10-tetraacetate (GdDOTA) [49]. It is interesting to note that for the monohydrated Gd3+ complex of the DO3A ligand bearing an N-linked CH2CH2NHCO-pyridyl pendant arm, much faster water exchange has been reported (k298ex = 1.1 × 10⁸ s−1) [43]. This fast water exchange has been explained by the steric destabilization of the Ln–water binding interaction by the presence of the bulky substituent. Such a destabilization effect is expected to be less important in Gd2L1 since the amide carbonyl is linked to a flexible –CH2–N– moiety in contrast to the direct attachment to a pyridyl group in the previous case. This limited steric constraint around the water binding site will then be translated by a more sluggish water exchange as observed for Gd2L1. The more than 1 order of magnitude difference in the water exchange rate between Gd2L1 and the Gd3+ complex of the DO3A–CH2CH2NHCO–pyridyl ligand is a good example of the importance of the steric compression around the water binding site. Steric compression is indeed the main factor determining the rate of exchange in a dissociative water exchange mechanism, characteristic of nine-coordinate complexes [50]. The dissociative activation mode for Gd2L1 is indicated by the positive value of the activation entropy.
The higher τr value of Gd2L1 compared with that of GdDOTA is rationalized by the higher molecular weight and greater rigidity of the molecule. In spite of the slow rotational motion and the presence of a second hydration sphere in the bismacrocyclic system, the relaxivities are only slightly higher than those of GdDOTA, owing to the low hydration number of Gd2L1 (q = 0.4).
The simultaneous fit of the 1H and 17O relaxation rates also supplies parameters that describe the electron spin relaxation of the Gd3+ complexes, such as τv, the correlation time for the modulation of the zero field splitting, its activation energy, Ev, and the mean zero field splitting energy, Δ2. The values obtained for Gd2L1 are in the usual range for similar complexes [49].
The 1H NMRD and 17O NMR data of the Gd2L1 system containing Ca2+ could not be fitted simultaneously because the conditions for 17O NMR and 1H NMRD samples differed significantly in terms of the ionic strength and viscosity, and also in the Ca2+-to-Gd3+ ratio of the samples. Only the 17O ln(1/T1r) and ln(1/T2r) data were analyzed, and the relaxivities are given in the electronic supplementary material. The 17O relaxation rates were interpreted by using the same set of equations as for the system without Ca2+ (Fig. 7). Analogously, the same parameters were fixed in the fit (except for the hydration number, q = 0.7, obtained from luminescence studies). The best fitting was obtained with the parameters listed in Tables 1 and S10. On Ca2+ addition, the most flagrant change is observed for the rotational correlation time as obtained from the 17O longitudinal relaxation rates (τR = 350 compared with 1,150 ps without and with Ca2+, respectively). We attribute this significant increase mainly to the high ionic strength and viscosity of the 17O NMR sample containing 1 M CaCl2, though some rigidification of the molecule on Ca2+ is also expected. The water exchange rate triples on Ca2+ binding (k298ex = 2.4 × 10⁶ compared with 7.5 × 10⁶ s−1). The decreasing negative charge of the Ca2+-bound Gd2L1–Ca complex would be rather expected to diminish the exchange rate in a dissociatively activated process. Among other factors that can compensate this effect, the increased steric demand of the central part after Ca2+ binding can lead to a steric destabilization of the Ln–water binding interaction. Overall, the relaxivity increase upon Ca2+ addition is mainly related to an increase in the hydration number.
Fig. 7.
Variable-temperature, reduced longitudinal (squares) and transverse (circles) 17O relaxation rates for Gd2L1, in the presence of 1 M Ca2+. The curves correspond to the fit as explained in the text
Conclusion
With the objective of Ca2+ sensing by MRI in the extracellular space, we synthesized two novel bismacrocyclic ligands containing a Ca2+-sensitive BAPTA-bisamide moiety (Scheme 1). Their Gd3+ complexes exhibit relaxivities comparable to that of currently used monomeric MRI contrast agents, in accordance with their larger size but lower hydration numbers (q < 1). Upon Ca2+ addition, the relaxivities of Gd2L1 and Gd2L2 increase by 15 and 10%, respectively. These changes are likely insufficient for in vivo MRI detection. Gd2L1 is practically insensitive towards Mg2+. The apparent association constants for the Ca2+ interaction were obtained from the relaxometric titration curves. They are several orders of magnitude lower for our complexes than those determined for BAPTA4− itself or other tetracarboxylate BAPTA4− analogues. The hydration number of Eu2L1 was determined from luminescence lifetime measurements in the absence (q = 0.4) and presence (q = 0.7) of Ca2+. UV–vis measurements confirmed the presence of two coordination environments that we attribute to a monohydrated and a nonhydrated state (Fig. 5). Upon the coordination of Ca2+ in the central part of the ligand, the molecule undergoes a conformational change and an acetate arm, originally coordinated to the Ln3+ ion, binds to Ca2+ and leaves space for the coordination of a water molecule to the lanthanide, which shifts the hydration state towards the more hydrated species.
Electronic supplementary material
Below is the link to the electronic supplementary material.
Acknowledgements
We are grateful to Lothar Helm, Ecole Polytechnique Fédérale de Lausanne, Switzerland, for allowing us to use their relaxometric facilities. The authors would like to thank A.J. Meixner (University of Tübingen) for providing access to his fluorescence spectrometer and I. Mamedov (MPI for Biological Cybernetics, Tübingen) for his help with luminescence lifetime experiments. This work was carried out in the framework of the EC COST D38 Action and was supported by the Ministère de l’Education Nationale et de la Recherche (France), the Centre National pour la Recherche Scientifique, the Hertie foundation and the Max Planck Society.
Footnotes
Electronic supplementary material
The online version of this article (doi:10.1007/s00775-007-0296-9) contains supplementary material, which is available to authorized users.
Contributor Information
Nikos K. Logothetis, Email: nikos.logothetis@tuebingen.mpg.de
Éva Tóth, Phone: +33-2-38257625, FAX: +33-2-38631517, Email: eva.jakabtoth@cnrs-orleans.fr.
References
- 1.Persigehl T, Heindel W, Bremer C (2005) Abdom Imaging 30:342–354 [DOI] [PubMed]
- 2.Merbach AE, Tóth É (eds) (2001) The chemistry of contrast agents in medical MRI. Wiley, Chichester
- 3.Aime S, Botta M, Terreno E (2005) Adv Inorg Chem 57:173–237 [DOI]
- 4.Caravan P, Ellison JJ, McCurry TJ, Lauffer RB (1999) Chem Rev 99:2293–2352 [DOI] [PubMed]
- 5.Lowe MP, Parker D, Reany O, Aime S, Botta M, Castellano G et al (2001) J Am Chem Soc 123:7601–7609 [DOI] [PubMed]
- 6.Aime S, Barge A, Delli Castelli D, Fedeli F, Mortillaro A, Nielsen FU et al (2002) Magn Reson Med 47:639–648 [DOI] [PubMed]
- 7.Zhou J, Lal B, Wilson DA, Laterra J, van Zijl PC (2003) Magn Reson Med 50:1120–1126 [DOI] [PubMed]
- 8.Aime S, Botta M, Gianolio E, Terreno E (2000) Angew Chem Int Ed Engl 39:747–750 [DOI] [PubMed]
- 9.Sun PZ, Schoening ZB, Jasanoff A (2003) Magn Reson Med 49:609–614 [DOI] [PubMed]
- 10.Que EL, Chang CJ (2006) J Am Chem Soc 128:5942–5943 [DOI]
- 11.Li W, Fraser SE, Meade TJ (1999) J Am Chem Soc 121:1413–1414 [DOI]
- 12.Hanaoka K, Kikuchi K, Urano Y, Narazaki M, Yokawa T, Sakamoto S et al (2002) Chem Biol 9:1027–1032 [DOI] [PubMed]
- 13.Aime S, Delli Castelli D, Fedeli F, Terreno E (2002) J Am Chem Soc 124:9364–9365 [DOI] [PubMed]
- 14.Hanaoka K, Kikuchi K, Urano Y, Nagano T (2001) J Chem Soc Perkin Trans 2 1840–1843
- 15.Louie AY, Huber MM, Ahrens ET, Rothbacher U, Moats R, Jacobs RE et al (2000) Nat Biotechnol 18:321–325 [DOI] [PubMed]
- 16.Perez JM, Josephson L, O’Loughlin T, Hogemann D, Weissleder R (2002) Nat Biotechnol 20:816–820 [DOI] [PubMed]
- 17.Woods M, Zhang S, Ebron VH, Sherry AD (2003) Chem Eur J 9:4634–4640 [DOI] [PubMed]
- 18.Zech SG, Eldredge HB, Lowe MP, Caravan P (2007) Inorg Chem 46:3576–3584 [DOI] [PubMed]
- 19.Krause W (ed) (2002) Contrast agents I. Magnetic resonance imaging. Topics in current chemistry, vol 221. Springer, Heidelberg
- 20.Atanasijevic T, Shusteff M, Fam P, Jasanoff A (2006) Proc Natl Acad Sci USA 103:14707–14712 [DOI] [PMC free article] [PubMed]
- 21.Meldolesi J (1998) Nature 392:863–866 [DOI] [PubMed]
- 22.Burgoyne RD (2007) Nat Rev Neurosci 8:182–193 [DOI] [PMC free article] [PubMed]
- 23.Tsien RY, Waggoner A (1995) In: Pawley JB (ed) Handbook of biological confocal microscopy, 2nd edn. Plenum, New York, pp 267–280
- 24.Li W, Parigi G, Fragai M, Luchinat C, Meade TJ (2002) Inorg Chem 41:4018–4024 [DOI] [PubMed]
- 25.Tsien RY (1980) Biochemistry 19:2396–2404 [DOI] [PubMed]
- 26.Graeppi N, Powell DH, Laurenzcy G, Zékány L, Merbach AE (1995) Inorg Chim Acta 235:311–326 [DOI]
- 27.Amman C, Meyer P, Merbach AE (1982) J Magn Reson 46:319–321
- 28.Raiford DS, Fisk CL, Becker ED (1979) Anal Chem 51:2050–2051 [DOI]
- 29.Zitha-Bovens E, Vander Elst L, Muller RN, van Bekkum H, Peters JA (2001) Eur J Inorg Chem 12:3101–3105 [DOI]
- 30.Yerly F (1999) Visualiseur 2.3.4. Institut de Chimie Moléculaire et Biologique, EPFL-BCH, Lausanne
- 31.Yerly F (1999) Optimiseur 2.3.4. Institut de Chimie Moléculaire et Biologique, EPFL-BCH, Lausanne
- 32.Wong W, Li C (2005) Int Patent Appl WO 2005003105 A1 20050113
- 33.Wei W, Tomohiro T, Kodaka M, Okuno H (2000) J Org Chem 65:8979–8987 [DOI] [PubMed]
- 34.Adam SR, Kao JPY, Grynkiewicz G, Minta A, Tsien RY (1988) J Am Chem Soc 110:3212 [DOI]
- 35.Corsi DM, Platas C, Van Bekkum H, Peters JA (2001) Magn Res Chem 39:723 [DOI]
- 36.Horrocks WD Jr, Sudnick DR (1979) J Am Chem Soc 101:334–340 [DOI]
- 37.Supkowski RM, Horrocks WD Jr (2002) Inorg Chim Acta 340:44–48 [DOI]
- 38.Beeby A, Clarkson IM, Dickins RS, Faulkner S, Parker D, Royle L, de Sousa AS, Williams JAG, Woods M (1999) J Chem Soc Perkin Trans 2 493–503
- 39.Albin M, Farber GK, Horrocks WD Jr (1984) Inorg Chem 23:1648–1651 [DOI]
- 40.Geier G, Jorgensen CK (1971) Chem Phys Lett 9:263–264 [DOI]
- 41.Tóth É, Ni Dhubghaill OM, Besson G, Helm L, Merbach AE (1999) Magn Res Chem 37:701–708 [DOI]
- 42.Yerly F, Dunand FA, Tóth É, Figueirinha A, Kovács Z, Sherry AD, Geraldes CFGC, Merbach AE (2000) Eur J Inorg Chem 1001–1006
- 43.Congreve A, Parker D, Gianolio E, Botta M (2004) Dalton Trans 1441–1445 [DOI] [PubMed]
- 44.Frey ST, Horrocks WD Jr (1995) Inorg Chim Acta 229:383–390 [DOI]
- 45.Caravan P (2006) Chem Soc Rev 35:512–523 [DOI] [PubMed]
- 46.Lebdušková P, Hermann P, Helm L, Tóth É, Kotek J, Binnemans K, Rudovský J, Lukeš I, Merbach AE (2007) Dalton Trans 493–501 [DOI] [PubMed]
- 47.Lebdušková P, Sour A, Helm L, Tóth É, Kotek J, Lukeš I, Merbach AE (2006) Dalton Trans 3399–3406 [DOI] [PubMed]
- 48.Dunand FA, Borel A, Merbach AE (2002) J Am Chem Soc 124:710–716 [DOI] [PubMed]
- 49.Powell DH, Dhubhghaill OMN, Pubanz D, Helm L, Lebedev YS, Schlaepfer W, Merbach AE (1996) J Am Chem Soc 118:9333–9346 [DOI]
- 50.Laus S, Ruloff R, Tóth É, Merbach AE (2003) Chem Eur J 9:3555 [DOI] [PubMed]
Associated Data
This section collects any data citations, data availability statements, or supplementary materials included in this article.
Supplementary Materials
Below is the link to the electronic supplementary material.


