Abstract
Recent work has shown that expression of the p16INK4a tumor suppressor increases with chronological age. Expression is accelerated by gerontogenic behaviors such as tobacco use and physical inactivity, and is also influenced by allelic genotype of a polymorphic single nucleotide polymorphism (SNP) rs10757278 that is physically linked with the p16INK4a ORF. To understand the relationship between p16INK4a expression, chronologic age, subject characteristics and host genetics, we sought to develop a mathematical model that links p16INK4a expression with aging. Using an annotated dataset of 170 healthy adults for whom p16INK4a expression and subject genotypes were known, we developed two alternative stochastic models that relate p16INK4a expression to age, smoking, exercise and rs10757278 genotype. Levels of p16INK4a increased exponentially and then saturated at later chronologic ages. The model, which best fit the data, suggests saturation occurs because of p16INK4a-dependent attrition of subjects at older chronologic ages, presumably due to death or chronic illness. An important feature of our model is that factors that contribute to death in a non p16INK4a-dependent manner do not affect our analysis. Interestingly, tobacco-related increases in p16INK4a expression are predicted to arise from a decrease in the rate of p16INK4a-dependent death. This analysis is most consistent with the model that p16INK4a expression monotonically increases with age, and higher expression is associated with increased subject attrition.
Keywords: aging, gene expression, smoking, stochastic model, senescence
Aspects of mammalian aging seem to result from a progressive decline in tissue replicative capacity, which has been linked to activation of antiproliferative tumor suppressor mechanisms such as telomere shortening and p16INK4a up-regulation (1–3). In particular, expression of p16INK4a has been shown to sharply increase with aging in most tissues of diverse mammalian species (4–9); and caloric restriction, which retards aging in rodents, attenuates this age-induced increase in p16INK4a (4, 5). Increasing p16INK4a expression in mice seems to play a casual role in the age-associated decline of the proliferative capacity of hematopoietic stem cells (10), pancreatic beta-cells (11) and neural stem cells (12), and germ-line p16INK4a inactivation ameliorates several aspects of aging in a progeroid mouse model (13). Therefore, p16INK4a seems to be a biomarker and effector of mammalian aging.
An emerging view of p16INK4a regulation with aging is that loss of Polycomb group silencing leads to a heritable epigenetic derepression with aging. The PcG proteins BMI-1 (14–18) and EZH2 (19–21) have been shown to act as epigenetic repressors of p16INK4a expression. Loss of EZH2 and BMI-1 binding to the INK4a/ARF locus, which encodes p16INK4a, has been reported with prolonged fibroblast culture with attendant increased expression of the locus in senescent cells (20). Loss of EZH2 expression has also been reported in pancreatic β-cells in vivo with aging in humans and mice (21), and inactivation of Bmi-1 or Ezh2 in this tissue causes Ink4a/Arf overexpression, a relative failure of insulin secretion and hyperglycemia; phenotypes which are attenuated by p16INK4a deficiency (17, 21). Accordingly, little if any increase in p16INK4a expression with aging is seen in true hematopoietic stem cells (HSC) (22), which are highly dependent on PcG activity for in vivo persistence (16, 18), whereas dramatic and functionally significant increases of p16INK4a expression are noted in the immediate progeny (e.g., lymphoid progenitors) of HSC (23). These results suggest that a stochastic, heritable loss of PcG repression in individual cells with aging contributes to the observed increase in expression of p16INK4a noted in specific cell types of most mammalian tissues.
In accord with these observations, we have recently shown that expression of p16INK4a in peripheral blood T lymphocytes (PBTL) has the properties of a faithful biomarker of chronological age in two independent, unselected, and prospectively collected cohorts of healthy human subjects (24). Importantly, expression of p16INK4a increases exponentially early in life, well before other overt stigmata of aging are evident. Expression of p16INK4a also correlated with plasma IL-6 level, a marker of aging and frailty. Likewise, p16INK4a expression positively correlated with cigarette smoking and inversely correlated with exercise, both in a dosage-dependent manner. These data suggest a model whereby age-promoting stimuli induce p16INK4a expression starting in young adulthood or earlier, and that frailty, tobacco use and physical inactivity are additionally associated with increased p16INK4a expression.
Of interest, we also noted that expression of all 4 INK4a/ARF-associated transcripts (p16INK4a as well as p15INK4b, ARF, and ANRIL; reviewed in ref. 3) is strongly associated with a subject's genotype of a SNP (rs10757278) 120 kb centromeric to the INK4/ARF tumor suppressor locus (25). This SNP is highly polymorphic in individuals of Asian and European ancestry, with minor allele frequencies approaching 50% in these populations. Interest in this SNP came from its strong association with human atherosclerotic diseases [coronary artery disease (26–30), ischemic stroke (31, 32) and abdominal aortic aneurysm (31)] in large, unbiased genome-wide association studies. Although individuals with SNP genotypes associated with increased risk of atherosclerotic disease also exhibit decreased expression of INK4/ARF-associated transcripts, the mechanism whereby altered expression of the INK4/ARF locus might contribute to vascular disease is unknown.
Against this background, we sought to develop a predictive mathematical model of p16INK4a expression with aging in heterogeneous human populations. Using straightforward assumptions based on the initial dataset and the known biology of human aging, we developed two types of stochastic models relating p16INK4a expression to subject age and other clinical features. Both models assume that the rate of increase in p16INK4a expression with age is influenced by expression of p16INK4a itself, in accord with the observed exponential growth of p16INK4a with chronologic age. Additionally, to capture the observed saturation of p16INK4a expression with age, we investigated two mechanisms that would attenuate the rate of p16INK4a expression increase with aging. In model I (the “down-regulation” model), we assume p16INK4a expression can stochastically decrease at a rate that depends on p16INK4a expression levels. In model II (the “attrition” model), we assume that cells or subjects are stochastically removed from the study sample at a rate that has p16INK4a-dependent and independent components. The attrition model would encompass the possibility of selective loss from the cohort of either cells (e.g., by apoptosis or immune clearance) or individual donors (e.g., to death or comorbid illness). In general, it is possible that mechanisms reflected by both models could contribute to the saturation of p16INK4a expression with age. However, splitting down-regulation and attrition into distinct classes of models allows us to determine which mechanism is necessary to capture the observed behavior and minimizes the number of free model parameters that need to be estimated from the data.
Our work shows that the attrition model (model II) is more consistent with the observed data. Surprisingly, model II also suggests that whereas cigarette use is associated with increased p16INK4a expression, this behavior produces a more marked effect on the rate of p16INK4a-dependent attrition rather than on the rate of p16INK4a increase with aging. This modeling of the observed expression of p16INK4a with chronologic age in a heterogeneous human population supports the view that PBTL p16INK4a expression monotonically increases with chronologic age and is positively associated with the rate of age-related cellular or donor attrition due to cell clearance and/or donor death or illness.
Methods
Subjects.
The study design and subject characteristics are described elsewhere (24, 25). All participants in this study were recruited from a central site on the campus of the University of North Carolina Hospitals. For inclusion, participants had to state they were in good health, had to be able to perform routine physical activities, and had to be able to provide informed written consent. Participants answered questionnaires regarding overall health, tobacco use and exercise; and were compensated for participation. Peripheral blood T-lymphocytes (PBTL) were harvested and processed as described (24). Potential acute and chronic conditions and their possible effect on p16INK4a expression were controlled by excluding subjects demonstrating peripheral T cell activation as described (24). All human studies were approved by the University of North Carolina Institutional Review Board.
Mathematical Models.
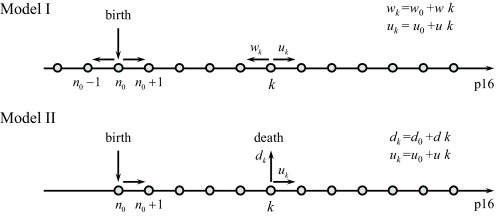
The collected data (24, 25) demonstrate that p16INK4a expression increases with age and saturates at older ages. These data also show a considerable amount of variability in expression levels of different individuals at the same age. Therefore, we chose to model the dynamics of p16INK4a expression as a stochastic process (Fig. 1). Let the random variable N(t) denote the transcript level of an individual at time t. We assume that N(t) changes by a unit amount randomly in time, and let pk(t) = Prob[N(t) = k], where k is nonnegative integer. At birth (t = 0) each individual has an initial p16INK4a level N(0) ≡ n0, where n0 also is a random number with mean μ0 and a standard deviation σ0.
Fig. 1.
Schematic diagram for the models of stochastic p16INK4a expression. The gray dots represent p16INK4a expression levels. In both models, the p16INK4a level increases at a rate uk. Model I includes transitions that decrease the p16INK4a level. These backward transitions occur at a rate wk. In contrast, model II includes transitions that terminate the stochastic process. These transitions occur at a rate dk.
We investigated two models for how p16INK4a levels could change with age. In both scenarios, increases in p16INK4a expression occur at a rate uk = uk + u0. That is, p16INK4a positively affects its rate of expression. If u is zero, the average expression level grows linearly in time. Positive values of u lead to exponential growth of p16INK4a. In model I, we include transitions that decrease the p16INK4a level by one unit. These transitions occur at a rate wk = wk + w0. The average transcript level for model I is given by (see SI Appendix)
The linear dependence of uk and wk on k is not a necessary condition but represents the simplest example of a more general class of down-regulation models in which saturation emerges due to the balance of production and degradation at a given level of p16INK4a. We show in SI Appendix that the main conclusions from model I remain valid for models in which the rates uk and wk depend nonlinearly on k. It also should be noted that model parameters, such as the rate constants for p16INK4a production and degradation, should be interpreted as effective rates that capture the relative time scales for these complex processes and are not meant to represent a single biochemical step.
In model II, expression levels of p16INK4a saturate because individuals or cells expressing high levels of the gene have a higher probability of being removed from the sample pool (e.g., by cell clearance, illness or death). The recruiting criteria excluded individuals with acute illness or chronic comorbidity and subjects exhibiting peripheral T cell activation were excluded. This, in addition to natural factors, such as death, may account for the saturation of p16INK4a expression observed at older ages. Alternatively attrition might occur at the cellular level through immune clearance or apoptosis. Mathematically, both mechanisms are equivalent and removal from the sample population means that at any time there is finite probability of the stochastic process terminating. To model this situation we define the “death rate” as dk = dk + d0(t), where the term dk accounts for the dependency of the death rate on p16INK4a, whereas the second term, d0(t), is an arbitrary function of age and includes all other factors that contribute to an individual or cell being removed from the sample pool (e.g., chronic illness or death from p16INK4a-independent causes).
Within model II the mean level of gene expression as a function of time is given by
and the standard deviation is
 |
where
The details of the derivations of these expressions and full analyses of the models are given in SI Appendix and Figs. S1–S12.
Results
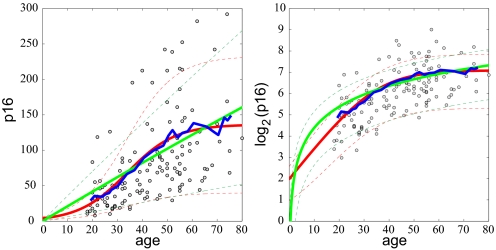
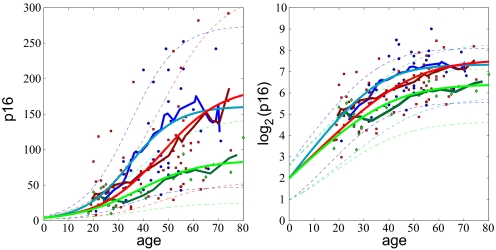
As an initial test of both models, we first fit all of the data simultaneously (Fig. 2). To better establish trends in the data we computed a moving average (blue lines, Fig. 2). The moving average clearly demonstrates the tendency of p16INK4a levels to saturate with age. The green lines in Fig. 2 are the best results for model I and the red lines are for model II. Thick lines represent the mean behavior and thin dashed lines represent standard deviation from the mean. From Eq. 1, we see that saturation of p16INK4a expression levels occurs in model I only if u < w and u0 > w0. When these conditions are satisfied, Eq. 1 cannot capture the sigmoidal behavior seen in the data presented in Fig. 2. Moreover, the large variability observed in the data only can be reproduced if the values of u and w are very close in value (see SI Appendix). In this regime, the model predicts a linear increase of the mean in time over the lifetime of an individual, and therefore does not capture the saturation in p16INK4a expression seen at later years (green line, Fig. 2). In SI Appendix, we demonstrate that the inability of down-regulation models to capture simultaneously the large variability in the data and rapid approach to saturation does not result from our choice of linear dependencies of the rates uk and wk on k, but is a general property of this class of models (see Figs. S2–S7).
Fig. 2.
Comparison of the models with population data for p16INK4a expression levels. The blue lines represent a moving average of the data (3-year increments averaged of a 20-year interval). The green lines are the results for model I and the red lines are the results for model II. The thick lines represent the mean values and the thin dashed lines are the standard deviations. (Left) The results plotted on a linear scale. (Right) The same results plotted on a log2 scale.
In contrast to model I, model II accurately captures both the mean behavior and variability seen in the data (red lines, Fig. 2). Eq. 2 predicts that the mean p16INK4a level grows exponentially at early times (t ≪ (u + d)−1) as
For older ages (t ≪ (u + d)−1), the mean expression saturates and asymptotically approaches a value of μ0u/d. Importantly, only the p16INK4a-dependent part of the death rate contributes to the expectation values, whereas the arbitrary function d0(t), which represents all aging factors that are independent of p16INK4a expression, does not affect these measurements.
Because only model II accurately captures all of the data, we focus on this model. The best fit was obtained for parameter values μ0 ≈ 4, u = 0.1/year, d = 0.003/year, and u0 = 0. With these values model II accurately reproduces both the mean behavior and variability observed in the data. In SI Appendix, we present a histogram of the data generated using moving two-dimensional bins in an analogous method to the one used to compute the moving average shown in Fig. 2. Using this method, we observe a surprisingly good agreement between the histogram of the data and the distribution predicted by model II (Figs. S8–S12). In both cases the distributions are highly skewed to positive values on a linear scale and are relatively symmetric on log2 scale.
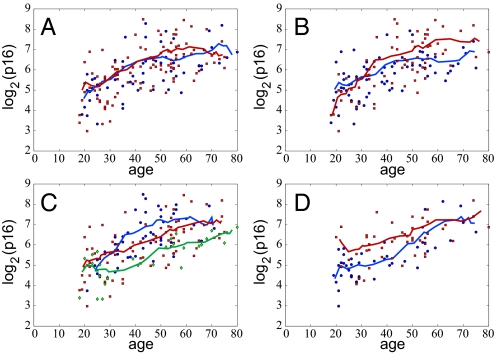
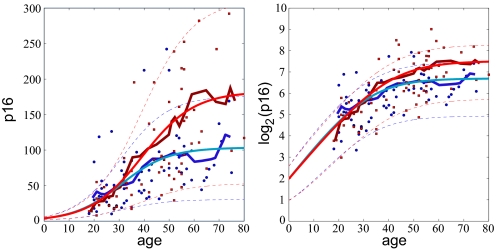
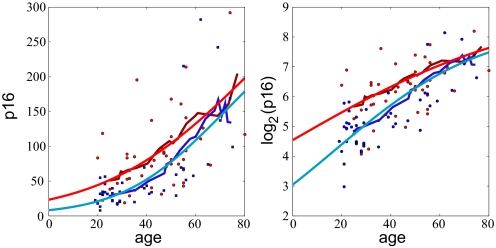
To explore which individual characteristics affect p16INK4a expression levels, we fit the model to the data grouped by sex, genotype, smoking habits and physical activity (Figs. 3 A–D). No significant difference in p16INK4a expression with age was seen between males and females (Fig. 3A). Smokers reached higher p16INK4a levels than non-smokers (Fig. 3B). According to model II, the saturating level of p16INK4a expression is given by μ0u/d. The parameter μ0 represents the mean p16INK4a expression level at birth, and we do not expect that this parameter would vary among different subsets of the population based on their smoking habits, which are determined at later ages. Therefore, we fix the value of μ0 to be 4, which produced the best fit when all of the data were taken together, for our analysis of both smoker and non-smokers. Thus, the higher p16INK4a expression level observed in smokers may be attributed to a higher expression rate, u, or lower p16INK4a-dependent “death” rate, d. Fig. 4 shows the results of fitting model II to the data grouped by smoking habit. Surprisingly, we find that nonsmokers and smokers have very similar values of the expression rate u ≈ 0.1/year, whereas the p16INK4a-dependent death rate for non-smokers is about twice as much as for smokers: d ≈ 0.004 and d ≈ 0.002 per year. This result does not contradict the fact that smokers have a higher mortality rate. Instead, the model suggests that the effects of smoking that potently reduce health and life expectancy, such as the carcinogenic and atherogenic properties of tobacco smoke, do not correlate with p16INK4a expression but rather are taken into account by the p16INK4a-independent function d0(t) in the death rate. In effect, the excess “death” from tobacco that is p16INK4a-independent seems to overpower the more modest effects of smoking on p16INK4a-dependent attrition.
Fig. 3.
The data split into groups according to gender (A), tobacco use (B), genotype (C), and physical activity (D). Solid lines represent moving averages computed in the same way as Fig. 2.
Fig. 4.
Model II results for smokers (red) vs. non-smokers (blue). The initial expression level is fixed at μ0 = 4 and the two free parameters u (growth rate) and d (death rate) are fit to the mean expression level. (Left) The data plotted on a linear scale. (Right) The same data on a log2 scale. The standard deviation is plotted according to Eq. 3 with σ0 = √μ0 = 2.
Next, we analyzed the data grouped according to genotype (Fig. 5). For this case, the best fit to the data are obtained when the initial p16INK4a level μ0 was taken to be a free parameter for each genotype (see Fig. S1). The estimated values of μ0 were 1 for A/A, 20 for A/G, and 13 for G/G. Although the precise values of the other model parameters depend on the initial transcript level, the qualitative relationship between genotype is always similar. The genotypes A/G and G/G have identical expression rates, whereas the death rate is twice as large for G/G as compared with A/G. In contrast, individuals with the A/A genotype have higher p16INK4a-dependent expression rates. Overall, these findings suggest that, unlike smoking, genotype affects the level of p16INK4a expression both through differences in the expression rates and death rates.
Fig. 5.
Model II results for different genotypes (A/A, blue; A/G, red; G/G, green). In this figure, the initial mean expression level is fixed at μ0 = 4 and the free parameters u (growth rate) and d (death rate) are fit to the mean expression level. The parameters are u = 0.10/year and d = 0.0026/year for A/A, u = 0.08/year and d = 0.0017/year for A/G, and u = 0.08/year and d = 0.0037/year for G/G (see also parameters for Fig. S1). (Left) The data plotted on a linear scale. (Right) The same data plotted on log2 scale. The standard deviations are plotted according to Eq. 3 with σ0 = √μ0 = 2.
Finally, we considered the data grouped according to physical activity. Two groups were formed: people who reported exercising for at least 240 min (median value) per month and those who exercised less than this amount. With this grouping, the running averages clearly show that people who exercise have lower expression levels of p16INK4a (Fig. 6). This difference is more pronounced for younger individuals and almost completely disappears by the age of 65. This behavior is not captured by the model, unless it is assumed that initial p16INK4a levels are significantly different for the two groups (Fig. 6), an assumption that is hard to justify on any biological grounds. A possible explanation for the observed behavior is that the effects of exercising are not uniform over an individual's life span, so that p16INK4a levels in younger people are more sensitive to physical activity than in later years. Mathematically, to capture this effect would require introducing a time dependence of the p16INK4a -dependent rates u and d in our model. Additionally, unlike smoking, exercise habits might change significantly over the life span of an individual making it difficult to discern long term effects of exercise on p16INK4a levels. Thus, grouping people based on their current exercise regime may not be a reliable representation of how sustained physical activity affects p16INK4a levels. Further complications also arise from possible correlations between exercise and other characteristics, such as smoking habits or gender. Indeed, males and females might respond very differently to the same average amount of exercise. Similarly, the intensity, not just the duration, of the physical activity may be important in determining p16INK4a levels.
Fig. 6.
Model II results for people who reported exercising >240 min per month (blue dots and curves) and <240 min per month (red dots and curves). The mean initial expression level μ0 is taken to be a free parameter for each group. The estimate values of the parameters are u = 0.021, d = 0.012, μ0 = 8 and u = 0.010, d = 0.010, μ0 = 23, respectively. (Left) The data plotted on a linear scale. (Right) The same data plotted on log2 scale.
Conclusions
The expression of p16INK4a in humans monotonically increases with age such that early in life there is exponential growth in the expression level that eventually saturates with age. We considered two stochastic models that capture this saturation effect. In model I saturation results from a balance between synthesis and degradation of the p16INK4a mRNA, whereas in model II saturation results from a p16INK4a–dependent attrition or “death” rate. Our analysis revealed that only model II accurately reproduces both changes in time-dependent mean expression level and variations about the mean.
The main parameters of model II are the p16INK4a-dependent production rate (uk = u0 + uk) and death rate (dk = d0(t) + dk). An interesting feature of this model is that the p16INK4a-independent part of the death rate, d0(t), which can vary arbitrarily in time, does not contribute to the mean expression level of p16INK4a or fluctuations about the mean. Therefore, the saturation of the p16INK4a expression level is attributed only to the p16INK4a-dependent part of the death rate. Note that a higher value of the parameter d in a certain subgroup of people (e.g., smokers) does not necessarily mean that these individuals have a higher probability of death, because the contribution d0(t) can be significantly different between subgroups.
It is important to note that the attrition model is robust to loss of entire individuals from the cohort and/or only cells within a given individual. As described, p16INK4a expression and genotype have been linked to frailty, frailty markers and specific diseases (e.g., diabetes) through human and murine genetic approaches. Therefore, we favor the model that increased p16INK4a expression leads to an increase in the attrition of individuals to death and comorbid illness which are strongly associated with frailty and diabetes. It is also possible, however, that there is selective attrition of cells rather than individuals with the highest levels of p16INK4a. The model of cellular attrition is at odds with the findings that hypoproliferative p16INK4a-expressing cells are highly stable in vitro and in vivo. For example, cultures of senescent fibroblasts that highly express p16INK4a have been maintained in vitro for years without loss, and senescent lesions such as cutaneous nevi (moles), which highly express p16INK4a (33, 34), may persist for years or decades in humans. Nonetheless, the long-term fate of old, damaged lymphocytes that highly express p16INK4a is not known, and our model is not inconsistent with the possibility of enhanced clearance of PBTL which highly express p16INK4a. In particular, attrition of cells highly expressing p16INK4a could explain the observed paradoxical reduction in p16INK4a-dependent death rate associated with tobacco use as tobacco mutagens could induce aberrant proliferation without p16INK4a expression, as in neoplasia, or otherwise reduce the clearance of p16INK4a-expressing cells.
Estimating the model parameters u and d from experimental data provides a method for quantifying differences among sample populations grouped by gender, genotype, smoking habit or physical activity. Using moving averages to establish trends in the data, we observed that gender does not affect p16INK4a expression levels, whereas smoking, rs10757278 genotype or physical activity produced clear differences. Our analysis revealed that the higher level of p16INK4a expression observed for smokers relative to non-smokers results from a roughly two-fold smaller value of the p16INK4a dependent death rate d with no detectable change in the production rate u. These two parameters represent rates per unit transcript level. Thus, the mean p16INK4a-dependent parts of the production and death rates are 〈u〉 ≡ u〈N̄(t)〉 and 〈d〉 ≡ d〈N̄(t)〉, respectively. For older ages, we find that 〈u〉s ≈ 2〈u〉n and 〈d〉s ≈ 〈d〉n, where subscripts s and n represent smokers and non-smokers, respectively. A possible interpretation of this observation is that the elevated expression of p16INK4a in smokers plays some beneficial role in terms of p16INK4a-dependent attrition. That is, increased p16INK4a expression in response to the negative effects of tobacco seems to be associated with a reduced rate of attrition (e.g., by reducing patient loss to cancer, atherosclerosis, etc) for any given level of p16INK4a expression. In accord with this view, p16INK4a has a well-documented anti-cancer role in smoking-associated malignancies, and we have recently provided evidence that p16INK4a may play an important role in limiting human atherosclerosis (25). Again, however, it is important to stress that p16INK4a-independent increases in the death rate due to smoking are expected to greatly exceed any “positive” effect of smoking on the p16INK4a -dependent death rate.
Analyzing the data grouped by genotype, we conclude that A/G and G/G genotypes have qualitatively similar p16INK4a age dependence with identical production rates u but different death rates d. The A/A genotype is significantly different from both A/G and G/G due mainly to a differences in the production rate u. The association of the rs10757278 genotype with INK4a/ARF transcript expression is most parsimoniously explained by the existence of a transcriptional cis-regulatory element in linkage disequilibrium with this SNP. One would predict that the effects of such an enhancer or repressor of transcription would primarily control the p16INK4a production rate, u. Alternatively, however, because SNP genotype is also associated with the expression of two other potent cell cycle regulators, p15INK4b and ARF, it is possible that these effects could influence the p16INK4a-dependent death rate d. For example, Serrano and colleagues have suggested that ARF expression exerts a general anti-aging effect in mammals (35). Because expression of ARF and p16INK4a strongly cocorrelate in human PBTL (24), our results would be consistent with such an anti-aging effect of ARF leading to an apparent decrease in the p16INK4a-dependent death rate.
We were not able to obtain satisfactory fits to the data when the sample population was grouped according to exercise routine. Many factors may contribute to the failure of the model for this case. For example, the population was divided into two groups: individuals who exercise >240 min per month and those that exercised less. No consideration was given to how long the exercise regime had been followed, the type of exercise or the intensity of the training or whether exercise behavior may change with chronologic aging. Interpretation of these data also may be confounded by correlations with other factors, such as gender or race. We believe a more complex model that allows for an effect of exercise on p16INK4a production that decreases with advancing chronologic age would capture the observed data, and would be biologically rational.
In model II the saturation of p16INK4a levels occurs because of a p16INK4a-dependent attrition rate. However, the model does not definitively establish a mechanism for this effect. A clearer interpretation of the attrition rate and more quantitative analysis of its dependence on p16INK4a levels will be the subject of future work using an expanded dataset we are presently generating. Despite its relative simplicity, our current model quantitatively captures the mean behavior and variability of data for p16INK4a expression as a function age. Because the model contains a minimal number of parameters, differences among subgroups of the sample population are readily interpreted and the effects of genetic and environmental factors easily quantified. We believe the work presented here clearly illustrates the power of using mathematical modeling to investigate the role of p16INK4a expression in aging and points to clear avenues for future research.
Supplementary Material
Acknowledgments.
This work was supported by National Institutes of Health (NIH) Grants R01GM079271 (to T.C.E. and D.T.), P01ES014635 (to T.C.E.), RR023248 (to H.K.S.),and AG024379 (to N.E.S.); the Ellison Medical Foundation (to N.E.S.); the Burroughs Wellcome Fund (to N.E.S.); and NIH Training Grant CA009156-34 (to Y.L.).
Footnotes
The authors declare no conflict of interest.
This article is a PNAS Direct Submission.
This article contains supporting information online at www.pnas.org/cgi/content/full/0904405106/DCSupplemental.
References
- 1.Campisi J. Cancer and ageing: Rival demons? Nat Rev Cancer. 2003;3:339–349. doi: 10.1038/nrc1073. [DOI] [PubMed] [Google Scholar]
- 2.Finkel T, Serrano M, Blasco MA. The common biology of cancer and ageing. Nature. 2007;448:767–774. doi: 10.1038/nature05985. [DOI] [PubMed] [Google Scholar]
- 3.Kim WY, Sharpless NE. The regulation of INK4/ARF in cancer and aging. Cell. 2006;127:265–275. doi: 10.1016/j.cell.2006.10.003. [DOI] [PubMed] [Google Scholar]
- 4.Edwards MG, et al. Gene expression profiling of aging reveals activation of a p53-mediated transcriptional program. BMC Genomics. 2007;8:80. doi: 10.1186/1471-2164-8-80. [DOI] [PMC free article] [PubMed] [Google Scholar]
- 5.Krishnamurthy J, et al. Ink4a/Arf expression is a biomarker of aging. J Clin Invest. 2004;114:1299–1307. doi: 10.1172/JCI22475. [DOI] [PMC free article] [PubMed] [Google Scholar]
- 6.Zindy F, Quelle DE, Roussel MF, Sherr CJ. Expression of the p16INK4a tumor suppressor versus other INK4 family members during mouse development and aging. Oncogene. 1997;15:203–211. doi: 10.1038/sj.onc.1201178. [DOI] [PubMed] [Google Scholar]
- 7.Nielsen GP, et al. Immunohistochemical survey of p16INK4A expression in normal human adult and infant tissues. Lab Invest. 1999;79:1137–1143. [PubMed] [Google Scholar]
- 8.Herbig U, Ferreira M, Condel L, Carey D, Sedivy JM. Cellular senescence in aging primates. Science. 2006;311:1257. doi: 10.1126/science.1122446. [DOI] [PubMed] [Google Scholar]
- 9.Melk A, et al. Expression of p16INK4a and other cell cycle regulator and senescence associated genes in aging human kidney. Kidney Int. 2004;65:510–520. doi: 10.1111/j.1523-1755.2004.00438.x. [DOI] [PubMed] [Google Scholar]
- 10.Janzen V, et al. Stem-cell ageing modified by the cyclin-dependent kinase inhibitor p16INK4a. Nature. 2006;443:421–426. doi: 10.1038/nature05159. [DOI] [PubMed] [Google Scholar]
- 11.Krishnamurthy J, et al. p16INK4a induces an age-dependent decline in islet regenerative potential. Nature. 2006;443:453–457. doi: 10.1038/nature05092. [DOI] [PubMed] [Google Scholar]
- 12.Molofsky AV, et al. Increasing p16INK4a expression decreases forebrain progenitors and neurogenesis during ageing. Nature. 2006;443:448–452. doi: 10.1038/nature05091. [DOI] [PMC free article] [PubMed] [Google Scholar]
- 13.Baker DJ, et al. Opposing roles for p16Ink4a and p19Arf in senescence and ageing caused by BubR1 insufficiency. Nature cell biology. 2008;10:825–836. doi: 10.1038/ncb1744. [DOI] [PMC free article] [PubMed] [Google Scholar]
- 14.Jacobs JJ, Kieboom K, Marino S, DePinho RA, van Lohuizen M. The oncogene and Polycomb-group gene bmi-1 regulates cell proliferation and senescence through the ink4a locus. Nature. 1999;397:164–168. doi: 10.1038/16476. [DOI] [PubMed] [Google Scholar]
- 15.Molofsky AV, et al. Bmi-1 dependence distinguishes neural stem cell self-renewal from progenitor proliferation. Nature. 2003;425:962–967. doi: 10.1038/nature02060. [DOI] [PMC free article] [PubMed] [Google Scholar]
- 16.Park IK, et al. Bmi-1 is required for maintenance of adult self-renewing haematopoietic stem cells. Nature. 2003;423:302–305. doi: 10.1038/nature01587. [DOI] [PubMed] [Google Scholar]
- 17.Dhawan S, Tschen SI, Bhushan A. Bmi-1 regulates the Ink4a/Arf locus to control pancreatic beta-cell proliferation. Genes Dev. 2009;23:906–911. doi: 10.1101/gad.1742609. [DOI] [PMC free article] [PubMed] [Google Scholar]
- 18.Lessard J, Sauvageau G. Bmi-1 determines the proliferative capacity of normal and leukaemic stem cells. Nature. 2003;423:255–260. doi: 10.1038/nature01572. [DOI] [PubMed] [Google Scholar]
- 19.Kotake Y, et al. pRB family proteins are required for H3K27 trimethylation and Polycomb repression complexes binding to and silencing p16INK4alpha tumor suppressor gene. Genes Dev. 2007;21:49–54. doi: 10.1101/gad.1499407. [DOI] [PMC free article] [PubMed] [Google Scholar]
- 20.Bracken AP, et al. The Polycomb group proteins bind throughout the INK4A-ARF locus and are disassociated in senescent cells. Genes Dev. 2007;21:525–530. doi: 10.1101/gad.415507. [DOI] [PMC free article] [PubMed] [Google Scholar]
- 21.Chen H, et al. Polycomb protein Ezh2 regulates pancreatic beta-cell Ink4a/Arf expression and regeneration in diabetes mellitus. Genes Dev. 2009;23:975–985. doi: 10.1101/gad.1742509. [DOI] [PMC free article] [PubMed] [Google Scholar]
- 22.Attema JL, Pronk CJ, Norddahl GL, Nygren JM, Bryder D. Hematopoietic stem cell ageing is uncoupled from p16 INK4A-mediated senescence. Oncogene. 2009;28:2238–2243. doi: 10.1038/onc.2009.94. [DOI] [PubMed] [Google Scholar]
- 23.Signer RA, Montecino-Rodriguez E, Witte ON, Dorshkind K. Aging and cancer resistance in lymphoid progenitors are linked processes conferred by p16Ink4a and Arf. Genes Dev. 2008;22:3115–3120. doi: 10.1101/gad.1715808. [DOI] [PMC free article] [PubMed] [Google Scholar]
- 24.Liu Y, et al. Expression of p16INK4a in peripheral blood T-cells is a biomarker of human aging. Aging Cell. 2009;8:439–448. doi: 10.1111/j.1474-9726.2009.00489.x. [DOI] [PMC free article] [PubMed] [Google Scholar]
- 25.Liu Y, et al. INK4/ARF transcript expression is associated with chromosome 9p21 variants linked to atherosclerosis. PloS ONE. 2009;4:e5027. doi: 10.1371/journal.pone.0005027. [DOI] [PMC free article] [PubMed] [Google Scholar]
- 26.Helgadottir A, et al. A common variant on chromosome 9p21 affects the risk of myocardial infarction. Science. 2007;316:1491–1493. doi: 10.1126/science.1142842. [DOI] [PubMed] [Google Scholar]
- 27.McPherson R, et al. A common allele on chromosome 9 associated with coronary heart disease. Science. 2007;316:1488–1491. doi: 10.1126/science.1142447. [DOI] [PMC free article] [PubMed] [Google Scholar]
- 28.The Wellcome Trust Case Control Consortium. Genome-wide association study of 14,000 cases of seven common diseases and 3,000 shared controls. Nature. 2007;447:661–678. doi: 10.1038/nature05911. [DOI] [PMC free article] [PubMed] [Google Scholar]
- 29.Samani NJ, et al. Genomewide association analysis of coronary artery disease. N Engl J Med. 2007;357:443–453. doi: 10.1056/NEJMoa072366. [DOI] [PMC free article] [PubMed] [Google Scholar]
- 30.Broadbent HM, et al. Susceptibility to coronary artery disease and diabetes is encoded by distinct, tightly linked SNPs in the ANRIL locus on chromosome 9p. Hum Mol Genet. 2008;17:806–814. doi: 10.1093/hmg/ddm352. [DOI] [PubMed] [Google Scholar]
- 31.Helgadottir A, et al. The same sequence variant on 9p21 associates with myocardial infarction, abdominal aortic aneurysm and intracranial aneurysm. Nat Genet. 2008;40:217–224. doi: 10.1038/ng.72. [DOI] [PubMed] [Google Scholar]
- 32.Matarin M, Brown WM, Singleton A, Hardy JA, Meschia JF. Whole genome analyses suggest ischemic stroke and heart disease share an association with polymorphisms on chromosome 9p21. Stroke. 2008;39:1586–1589. doi: 10.1161/STROKEAHA.107.502963. [DOI] [PMC free article] [PubMed] [Google Scholar]
- 33.Michaloglou C, et al. BRAFE600-associated senescence-like cell cycle arrest of human naevi. Nature. 2005;436:720–724. doi: 10.1038/nature03890. [DOI] [PubMed] [Google Scholar]
- 34.Gray-Schopfer VC, et al. Cellular senescence in naevi and immortalisation in melanoma: A role for p16? Br J Cancer. 2006;95:496–505. doi: 10.1038/sj.bjc.6603283. [DOI] [PMC free article] [PubMed] [Google Scholar]
- 35.Matheu A, et al. Delayed ageing through damage protection by the Arf/p53 pathway. Nature. 2007;448:375–379. doi: 10.1038/nature05949. [DOI] [PubMed] [Google Scholar]
Associated Data
This section collects any data citations, data availability statements, or supplementary materials included in this article.


