

Abstract
Chronic wounds represent a major public health problem affecting 6.5 million people in the United States. Ischemia, primarily caused by peripheral artery diseases, represents a major complicating factor in cutaneous wound healing. In this work, we sought to develop a mathematical model of ischemic dermal wounds. The model consists of a coupled system of partial differential equations in the partially healed region, with the wound boundary as a free boundary. The extracellular matrix (ECM) is assumed to be viscoelastic, and the free boundary moves with the velocity of the ECM at the boundary. The model equations involve the concentration of oxygen, PDGF and VEGF, the densities of macrophages, fibroblasts, capillary tips and sprouts, and the density and velocity of the ECM. Simulations of the model demonstrate how ischemic conditions may limit macrophage recruitment to the wound-site and impair wound closure. The results are in general agreement with experimental findings.
Keywords: wound healing, ischemia, free boundary, viscoelasticity
The public health impact of chronic wounds is staggering. An estimated 1.3–3 million U.S. individuals are believed to have pressure ulcers and as many as 10 –15% of the 20 million individuals with diabetes are at risk of developing chronic ulcers. Many more have venous ulcers or wounds that result from arterial disease. Treating these wounds costs an estimated $5–$10 billion each year (1). The ability to repair the injured skin tissue is an evolutionarily conserved physiological defense response aimed at reestablishing the barrier function of the skin. Wound healing represents the outcome of a large number of interrelated biological events that are orchestrated over a temporal sequence in response to injury and its microenvironment. The process involves interactions among different soluble chemical mediators, different types of cells and the extracellular matrix (ECM). Wound healing, under normal conditions, is typically represented by four overlapping stages: haemostasis, inflammation, proliferation, and remodeling (2, 3). During haemostasis, which occurs immediately after injury, clotting factors are delivered by platelets to the injured site to stop bleeding. At the wound site, platelets also release chemokines such as PDGF, which also recruits blood-borne cells to the wound. During the inflammatory phase, mast cells release granules that contain enzymes promoting vascular leakiness. This release enables neutrophils to migrate from the blood vessels into the wound site. Macrophages, differentiated from monocytes, also migrate into the wound and, together with neutrophils, degrade and remove necrotic tissue and kill infectious pathogens. Macrophages also enhance the production of growth factors secreted by platelets to attract fibroblasts and endothelial cells. The proliferative phase is characterized by the production of ECM by fibroblasts, and by the directed growth and movement of new blood vessels (angiogenesis) into the wound. The newly deposited ECM on the one hand serves as the bed for tissue repair and on the other hand contributes to scar formation. During the remodeling phase, which may last several years, fibroblasts and other cells interact to increase the tensile strength of the ECM.
Among the various factors that affect the healing of a wound, the wound-tissue oxygen status is recognized to be a key determinant (4, 5). Hypoxia is generally recognized as a physiological cue to induce angiogenesis (6–9). However, severe hypoxia, as is often noted in infected open wounds, cannot sustain the growth of functional blood vessels (10–14). Although different groups have reported mathematical models for wounds, the ischemic wound which represents the most clinically challenging type of wounds remains to be modeled. In this work, we sought to compare the healing of an ischemic wound with the healing of a nonischemic wound to specifically address the significance of ischemia in wound healing.
There are several mathematical models of wound healing which incorporate the effect of angiogenesis (15–18). Mathematical models of angiogenic networks, such as through the induction of vascular networks by VEGFs (19, 20), were developed by McDougall and coworkers (21, 22), based in part on the work of Anderson and Chaplain (23) in connection with chemotherapeutic strategies. The role of oxygen was explicitly addressed by refs. (17) and (18). In particular, Schugart et al. (18) recognized the therapeutic significance of tissue oxygenation in wound care.
Vascular complications commonly associated with problematic wounds are primarily responsible for wound ischemia. Ischemia limits the supply of blood-borne products, including nutrients, oxygen, and circulating cells, to the wound site, thereby severely impairing the healing response. Development of mechanism-based understanding of the ischemic wounds in humans is limited by a number of complicating factors (24). Thus, although the study of ischemic wounds in a clinical setting is highly valuable, the need for a preclinical model of ischemic wound is compelling. Given the unique advantages of the porcine model to study wound healing as a preclinical approach, recently Roy et al. (24) has developed the first preclinical model for ischemic cutaneous wounds. In those experiments, a full-thickness bipedicle dermal flap was developed first, such that blood supply was isolated from underneath the flap and from the two long edges, as shown in Fig. 1. One circular wound was then developed in the center of the flap (ischemic wound) and another on the normal skin (nonischemic wound) of the same animal as a pair-matched control. In the present work, we develop a mathematical model, which builds on previous work (18) and addresses the influence of tissue oxygenation on cutaneous wound healing. The model proposed herein consists of a system of partial differential equations, but in contrast to previously published models (16, 18) it describes the ECM as a viscoelastic material. Furthermore, the wound boundary in our model is considered as a moving boundary, so that the healing process can be quantified in terms of wound closure.
Fig. 1.
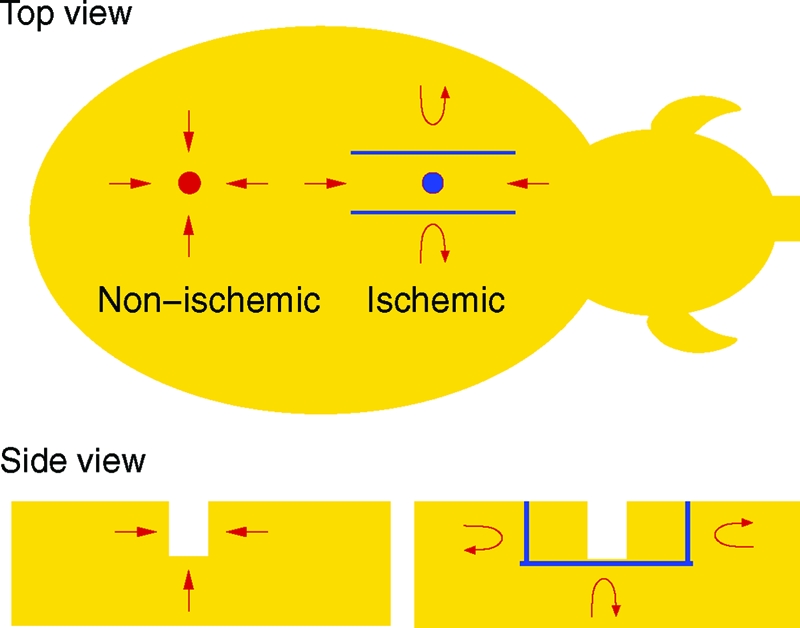
Schematic view of the wound environment developed by Roy et al. (24). The blue objects represent circulation barriers created by using a bipedicle flap approach, and the red arrows illustrate the blood circulation near the wounds.
The geometry of wounds developed in the experimental study (24) is illustrated in Fig. 1 in a spatially three-dimensional orientation. For computational purposes, however, the model we develop is one dimensional (1D). Nevertheless, we demonstrate that our numerical results are in agreement with the experimental results reported (24). Hence the proposed 1D model could serve as a surrogate to develop new hypotheses aimed at elucidating the biology of ischemic wounds.
Results
The wound region is assumed to be a cylinder with an axis normal to the skin and, for simplicity, we consider only the two-dimensional circular cross-section (e.g., the base of the cylinder). Fig. 2 depicts the circular wound, surrounded by a partially healed annulus, embedded in a healthy tissue at r = L, and r = R(t) as the boundary of the open wound.
Fig. 2.
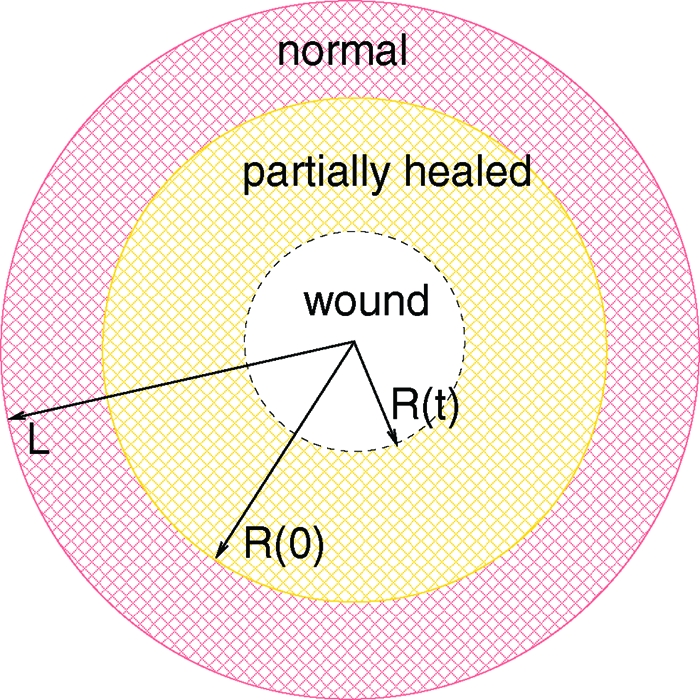
The open wound is the circular region {0 ≤ r ≤ R(t)} (white), the partially healed region is the annulus {R(t) ≤ r ≤ R(0)} (yellow), and the normal healthy tissue is {R(0) ≤ r ≤ L} (red).
The proposed model will focus on the first stages of wound healing after haemostasis, that is, inflammation and wound closure, but not on the remodeling of the scar, which may extend from months to years after wound closure. The proposed model is based on the following variables: w, concentration of oxygen; e, concentration of VEGF; p, concentration of PDGF; m, density of macrophages; f, density of fibroblasts; n, density of capillary tips; b, density of capillary sprouts; ρ, density of ECM; and v, velocity of ECM.
ECM.
The ECM is a viscoelastic material with complex mechanical properties. A multiphase model has been developed to describe the response of collagen matrix to cell traction (25), which was reduced to a single-phase model of upper convected Maxwell fluid with no pressure terms. In this work, we model the matrix as a growing viscoelastic material; more specifically, we model it as a single-phase upper convected Maxwell fluid with pressure depending on its density, which behaves like an elastic material on a short time scale and as a viscous material on a long time scale. We describe the matrix by its density ρ and velocity v.
The continuity equation for the matrix density ρ is
where Gρ(f,w,ρ) is the growth and decay term due to collagen secretion by fibroblasts and degradation by matrix metalloproteinases (MMPs). In this model, we incorporate the consideration that collagen production by fibroblasts and its maturation require the availability of oxygen (4, 5, 26, 27) and model the growth term by
where ρm is the maximum matrix volume fraction permitted in the partially healed region.
The momentum equation is
where σ is the total stress tensor that can be decomposed into the isotropic pressure P and the deviatoric stress τ, i.e.,
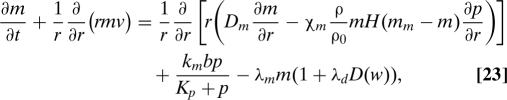
Because the motion is very slow in the wound healing process, we assume quasisteady state and neglect inertia. Therefore, the momentum equation becomes
For a compressible material, the pressure is given by the equation of state, P = P(ρ). To model the growing matrix, we assume that
 |
For an upper convected Maxwell fluid, the stress–strain relationship is given by (28),
where η is the shear viscosity, G is the shear modulus and is the relaxation time of the Maxwell element. As shown in Section A of the SI Appendix, in the wound-healing space and time scales (see Eq. 5) can be well approximated by
In summary, the equations for the ECM are Eqs. 1 and 3, together with the relations in Eqs. 2, 4, and 6. Assuming radial symmetry, these equations can be reduced to (see Section B of the SI Appendix)
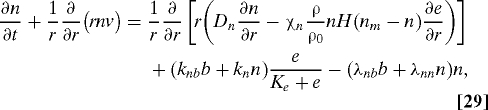
in R(t) ≤ r ≤ L, with the boundary conditions
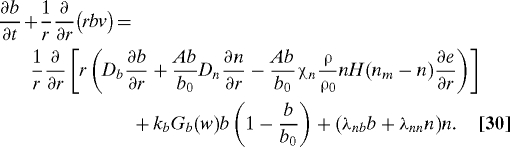
Free Boundary.
The equation for the free boundary is given by
Chemicals and Cells.
The chemicals and cells move inside the ECM. We write their constitutive equations in the form
where u can be replaced by any cell density or chemical concentration, and Gu is a combination of generation and degradation term. The flux Ju is comprised of two parts,
where Juc = vu is due to convection of the matrix, and Jua consists all the other fluxes for that agent. For chemicals, Jua is the diffusive flux, and for cells Jua is the summation of diffusive flux and taxis flux. Under the radial symmetry assumption, the constitutive equation is represented by (see Section B of the SI Appendix)
At the free boundary, r = R(t), there is no loss or gain of cells or chemicals, so no-flux (or Neumann) boundary conditions are imposed. Under the radial symmetry assumption, this condition becomes (see Section B of the SI Appendix)
In the following, we use homogenization techniques to formally derive the boundary condition at the fixed boundary r = L. The nonischemic case is considered to be one in which the densities/concentrations of all cells and chemicals at the fixed boundary r = L are the same as in normal healthy tissue, so that u = us at r = L, where us is the density/concentration in the healthy tissue. In total ischemia, the entire boundary r = L is cut off from the healthy tissue, so that we have no-flux boundary conditions Jua = Jua·ν = 0 at r = L, where ν is the outward normal vector at the boundary. Ischemia is considered to be partial, whereby contact with the healthy tissue is disrupted only at a finite number of arcs of length δ, and the distance between each two adjacent cutoffs is a fixed number ɛ. Denote the union of the cutoff δ – arcs by Dδ and the union of the ɛ – arcs by Eɛ. Consider the system
 |
where fɛ → f, gɛ → g, hɛ → h in some “weak” sense. If δ, ɛ → 0 in such a way that ɛ ∼ exp(−c/δ) for some constant c > 0, then, by homogenization, one has uɛ → u where
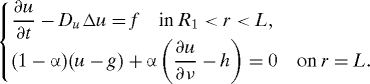 |
Indeed, when the parabolic operator is replaced by its corresponding elliptic operator −DuΔu, the result follows rigorously (29), with α, which is determined by c. The extension to the parabolic case follows by general semigroup arguments that are used in homogenization analysis (30). Assume that, as δ and ɛ → 0 as above, all the functions w, p, e, m, f, b, and n converge to a limit in some “weak” sense. Then we can derive the homogenized boundary conditions in the following order: first for w, p, and e, next (because p and e will then be continuously differentiable) for m, f, and n, and finally for b. Therefore, all the boundary conditions at the fixed boundary will have the form
The parameter α is a measure of the level of ischemia; as α increases from 0 to 1, the ischemic level increases from nonischemic to total ischemic (no-flux) conditions. It should be noted that there is no direct relation between α (or c) and the geometry in the experiment described in Fig. 1; α needs to be adjusted for each geometric setup. In that sense, the boundary condition in Eq. 13 serves as a (surrogate) model of the ischemic condition.
We proceed to formulate the equations and boundary conditions for the chemicals and cells of our model. All the differential equations hold in the annulus R(t) < r < L.
Oxygen.
Besides diffusion, tissue oxygen is transported from blood and consumed by cells, including fibroblasts and macrophages, with the consumption rate enhanced by growth factors such as PDGF (5). Therefore, the equation for the tissue oxygen is
 |
Here, wb is the oxygen concentration in the blood, which is assumed to be a constant, and m0 is the local/inactivated macrophage density. The boundary conditions are
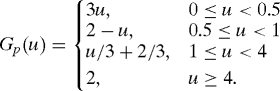
PDGF.
In the proposed model, PDGF assumes the combined role of all attractants for fibroblasts and macrophages, e.g., PDGF, TGF-β, and other related factors. Besides diffusion, PDGF is secreted by activated macrophages with a rate depending on the oxygen concentration (modeled by Gp(w/w0)), and degraded by fibroblast and other nonspecific factors. The degradation by fibroblast can be modeled by the Michalis–Menten form for the reactions f + p ⇆ → f + degraded chemical. At the wound boundary, PDGF is also secreted by platelets and hyperproliferative epithelial cells, and we model this by a boundary flux kpbR(t)/R0 > 0 at the free boundary. Therefore, the equation and boundary conditions for PDGF are
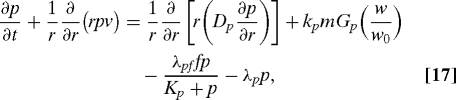 |
with
 |
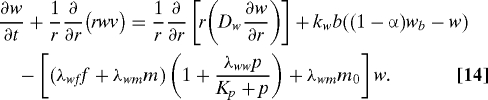
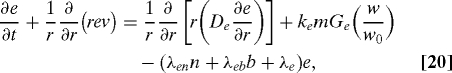
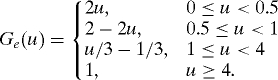
VEGF.
VEGF represents the primary mediator of angiogenesis, and is mainly secreted by activated macrophages when the tissue is under hypoxia or hyperoxia, and we model the secretion rate by kemGe(w/w0) where Ge(1) = 0. VEGF is also absorbed by endothelial cells and is functionally degraded by nonspecific factors. Therefore, the equation for VEGF is
 |
with boundary conditions
and
 |
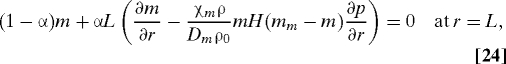
Macrophages.
Macrophages assist in wound healing in two major ways. First, they penetrate the injury site and clean out the debris, and second they release various growth factors, including PDGF and VEGF that attract fibroblasts and promote growth of new blood vessels. In the equation below, we incorporate macrophage chemotaxis, differentiation from monocytes under the availability of PDGF, normal apoptosis, and enhanced cell death under hypoxia and hyperoxia situations. The equation is
 |
where H is the Heaviside function and D(w) = 1 − H(5w − w0)H(w0 − w/3). The boundary conditions are
 |
Fibroblasts.
The major role of fibroblasts is ECM synthesis and remodeling, and the population of fibroblast in the wound site is maintained by transport from nearby tissue, local growth, and apoptosis. In the equation below, we model fibroblast growth and death with oxygen dependent rates:
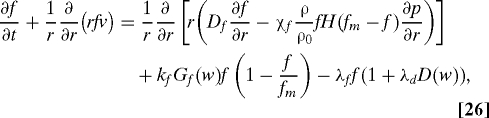 |
where Gf(w) = w(Kwf + w0)/(w0(Kwf + w)). The boundary conditions are
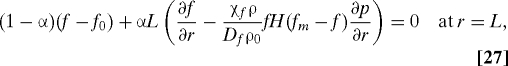 |
Capillary Tips and Sprouts.
We follow (16, 18) and model endothelial cells by two subpopulations, i.e., tips and sprouts. The capillary tips are chemotactic to VEGF and are produced by both tips and sprouts. The capillary sprouts are dragged along the flux of the tips and are produced by a logistic growth depending on oxygen by a factor Gb(w) = w(Kwρ + w0)/(w(Kwρ + w)). In addition, tip cells transform to sprout cells by tip–tip and sprout–tip anastomoses.
 |
 |
The boundary conditions at the fixed boundary r = L are
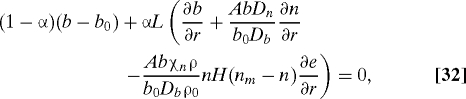 |
The second condition can be simplified by subtracting AbDn/(b0Db) times Eq. 31:
The boundary conditions at the free boundary are
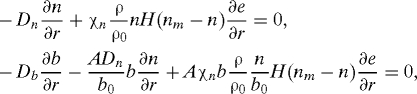 |
and by using Eq. 21, these can be simplified to
We note that although the derivation of the above homogenized boundary conditions is formal, the limit system is well defined.
Initial Conditions.
When a wound is developed in experiments, it causes certain damage to the vasculature around the wound edge. We assume that the damage is within a band of width ɛ0L and choose the following initial values to approximate the conditions immediately after wound development:
 |
for R0 ≤ r ≤ L, where g(z) = 0 if z ≤ 0, if 0 < z ≤ , if ≤ z < , if ≤ z ≤ 1 and 1 if z > 1. The initial conditions are consistent with the boundary conditions.
Normal and Ischemic Wound Healing.
We present two sets of simulation results with different parameter α. In the first simulation, we take α = 0, which corresponds to wound healing under normal conditions. Fig. 3 illustrates the time evolution of the chemokine concentrations and the cell densities, where the horizontal coordinate is time t, postwounding, in days, and the vertical coordinate is the distance r from the wound center in millimeters. The color encodes the nondimensionalized values of the plotted quantities with blue for low and red for high. The chemokine concentrations and the cell densities are also plotted at a few time slices of Fig. 3 in Section E of the SI Appendix. These figures show that (i) the normal wound with an initial 4-mm radius closes in about 13 days; (ii) the wound has higher concentrations of PDGF and VEGF and higher densities of macrophages and fibroblasts close to the edge; (iii) the wound edge is under hypoxia during the inflammatory and early proliferative phase; (iv) the number of macrophages at the wound edge first increases with a peak at day 3 and then decreases as the wound heals.
Fig. 3.

Normal wound healing (α = 0): time evolution of cell densities and chemokine concentrations. Horizontal axis, time post wounding in days; vertical axis, distance from the wound center in mm. Color encodes the nondimensional values of the plotted quantities. Parameters used are described in Table S1 (see Section D of the SI Appendix).
The second simulation is of wound healing under ischemic conditions with α = 0.92. All the other parameters used are the same as in the first simulation. Fig. 4 shows that, in contrast to the case of normal healing (i) the ischemic wound heals much slower, and after 20 days the wound is only healed about 25%; (ii) during the period of 20 days, the wound is under extreme hypoxia; (iii) the number of macrophages at the wound edge first increases and then decreases, but the peak time is delayed and persists longer than in the nonischemic case representing prolonged inflammatory phase.
Fig. 4.

Ischemic wound healing (α = 0.92). Time evolution of cell densities and chemokine concentrations. Time postwounding is shown on the x axis; distance the wound center (in mm) is shown on the y axis. Color encodes the nondimensional values of the plotted quantities. Parameters used are as described in Table S1 (see Section D of the SI Appendix).
Discussion
This work reports development of a mathematical model to study the significance of ischemia in cutaneous wound healing. The model was built upon earlier work (16, 18), and it consists of a system of partial differential equations for the densities of macrophages, fibroblasts, capillary tips and sprouts, concentrations of PDGF and VEGF, and density and velocity of ECM. In contrast to (16, 18), we incorporated mechanical properties of the ECM and modeled it as a viscoelastic material with growth. There have been viscoelastic models of ECM in the literature (25, 31–33). In this study, we employed an upper convected Maxwell fluid model, as proposed previously (25). However we added pressure of ECM as a function of its density due to growth. Our modeling approach could be applied to model wounds under mechanical pressure, which is of clinical significance for pressure ulcers (34). In addition, an important feature of the model is the incorporation of the boundary of the wound as a moving boundary that closely resembles open wounds, and this modeling approach provides experimentally quantifiable outputs, such as the radius of a wound as a function of time. We note that because healthy tissue is normally under mechanical tension, when a wound is developed in experiments, the wound dilates marginally in the first 2–3 days, as shown in Fig. 5A. Our model did not simulate this initial response; therefore, the model predictions and experimental results on the radius should be compared only after the first 2–3 days. A comparison of the simulation to the experimental results in Fig. 5 shows tight agreement.
Fig. 5.

Comparison of experimental data (A,C) and simulation (B,D). Radii of normal and ischemic wounds over time are derived from ref. (24) (A) and from the model (B); macrophage abundance at the wound edge is derived from ref. (24) (C) and from the model (D). (A and B) (▪) ischemic wound; (•) nonischemic wound. [Frames A and C reprinted with permission from ref. (24) (Copyright 2009, American Physical Society).]
Roy et al. (24) recently introduced a preclinical model for ischemic wounds, whereby ischemic cutaneous wounds were developed on ischemic skin flaps as shown in Fig. 1. Of note, the geometry of the wound and the ischemic environment is three dimensional. Although our model can be solved with such a geometry, the computation of the model would be extremely complicated and time consuming. We have therefore introduced a simpler geometry, whereby the wound occupies a circular domain {r < R(t)} and the healing region is a surrounding annulus with its outer boundary {r = L} in the normal healthy tissue, as shown in Fig. 2. In order to create radially symmetric ischemic conditions, we have isolated small arcs of length δ all around {r = L} and denote by ɛ the distance between two adjacent arcs. Then, as ɛ ∼ e−c/δ, δ → 0 where c is a positive constant, the boundary conditions
 |
become (by a procedure of homogenization)
here u is any diffusing variable (i.e., a solution of the diffusion equation in {R(t) < r < L}). The parameter α (which depends on c) represents the level of ischemia: Extreme ischemia corresponds to α close to 1, and normal wound environment corresponds to α = 0. This homogenization approach allows us to take all the cell densities and chemical concentrations as radially symmetric functions with respect to the center of the wound and thus to reduce the geometry to one space dimension, which is more amenable for numerical simulations.
As mentioned above, our model simulations (shown in Fig. 5 for the radius R(t) and macrophage density) are in very good agreement with experimental results (24). The proposed model may therefore serve as a starting point to study wound healing under ischemic and nonischemic conditions for more complex situations. These situations include, for example, the effect of inflammation in chronic wounds arising from bacterial invasion, where additional cytokines such as TNF-α play important roles, and chronic wounds under pressure, when blood circulation is restricted.
Methods
The model equations were first nondimensionalized and transformed to a fixed domain (see Section C of the SI Appendix). The parameters of the model were derived in both dimensional and nondimensional form (see Section D of the SI Appendix). Then the transformed equations were first discretized in space, and the resulting ODE system was solved by backward differentiation formulas designed for stiff problems. For the spatial discretization, a central difference scheme was used for the diffusion terms and an up-wind scheme was used for the convection terms. The boundary grid points were similarly treated by introducing auxiliary variables according to the boundary conditions. The resulting ODE system was solved using the Livermore solver. The numerical solutions were mapped back to the domain with a free boundary and are presented in Figs. 3 and 4.
Supplementary Material
Acknowledgments.
This work was supported by the National Science Foundation Award 0635561, the National Institute of Health Grants RO1 HL 073087, GM077185 and GM069589, and by the National Institute of Health (Office of the Director) Award UL1RR025755.
Footnotes
The authors declare no conflict of interest.
This article contains supporting information online at www.pnas.org/cgi/content/full/0909115106/DCSupplemental.
References
- 1.Kuehn BM. Chronic wound care guidelines issued. J Am Med Assoc. 2007;297:938–939. doi: 10.1001/jama.297.9.938. [DOI] [PubMed] [Google Scholar]
- 2.Diegelmann RF, Evans MC. Wound healing: An overview of acute, fibrotic and delayed healing. Front Biosci. 2004;9:283–289. doi: 10.2741/1184. [DOI] [PubMed] [Google Scholar]
- 3.Menke NB, Ward KR, Witten TM, Bonchev DG, Diegelmann RF. Impaired wound healing. Clin Dermatol. 2007;25:19–25. doi: 10.1016/j.clindermatol.2006.12.005. [DOI] [PubMed] [Google Scholar]
- 4.Gordillo GM, Sen CK. Revisiting the essential role of oxygen in wound healing. Am J Surg. 2003;186:259–263. doi: 10.1016/s0002-9610(03)00211-3. [DOI] [PubMed] [Google Scholar]
- 5.Sen CK. Wound healing essentials: Let there be oxygen. Wound Repair Regen. 2009;17:1–18. doi: 10.1111/j.1524-475X.2008.00436.x. [DOI] [PMC free article] [PubMed] [Google Scholar]
- 6.Colgan S, Mukherjee S, Major P. Hypoxia-induced lactate dehydrogenase expression and tumor angiogenesis. Clinical Colorectal Cancer. 2007;6:442–446. doi: 10.3816/CCC.2007.n.014. [DOI] [PubMed] [Google Scholar]
- 7.Semenza GL. HIF-1: Using two hands to flip the angiogenic switch. Cancer Metastasis Rev. 2000;19:59–65. doi: 10.1023/a:1026544214667. [DOI] [PubMed] [Google Scholar]
- 8.Pugh CW, Ratcliffe PJ. Regulation of angiogenesis by hypoxia: Role of the HIF system. Nat Med. 2003;9:677–684. doi: 10.1038/nm0603-677. [DOI] [PubMed] [Google Scholar]
- 9.Liao D, Johnson RS. Hypoxia: A key regulator of angiogenesis in cancer. Cancer Metastasis Rev. 2007;26:281–290. doi: 10.1007/s10555-007-9066-y. [DOI] [PubMed] [Google Scholar]
- 10.Hopf H, et al. Hyperoxia and angiogenesis. Wound Repair Regen. 2005;13:558–564. doi: 10.1111/j.1524-475X.2005.00078.x. [DOI] [PubMed] [Google Scholar]
- 11.Allen DB, et al. Wound hypoxia and acidosis limit neutrophil bacterial killing mechanisms. Arch Surg. 1997;132:991–996. doi: 10.1001/archsurg.1997.01430330057009. [DOI] [PubMed] [Google Scholar]
- 12.Gibson JJ, Angeles A, Hunt T. Increased oxygen tension potentiates angiogenesis. Surg Forum. 1997;87:696–699. [Google Scholar]
- 13.Oberringer M, Jennevein M, Matsch SE, Pohlemann T, Seekamp A. Different cell cycle responses of wound healing protagonists to transient in vitrohypoxia. Histochem Cell Biol. 2005;123:595–603. doi: 10.1007/s00418-005-0782-5. [DOI] [PubMed] [Google Scholar]
- 14.Safran M, Kaelin WGJ. HIF hydroxylation and the mammalian oxygen-sensing pathway. J Clin Invest. 2003;111:779–783. doi: 10.1172/JCI18181. [DOI] [PMC free article] [PubMed] [Google Scholar]
- 15.Pettet GJ, Byrne HM, Mcelwain DLS, Norbury J. A model of wound-healing angiogenesis in soft tissue. Math Biosci. 1996;136:35–63. doi: 10.1016/0025-5564(96)00044-2. [DOI] [PubMed] [Google Scholar]
- 16.Pettet G, Chaplain MAJ, Mcelwain DLS, Byrne HM. On the role of angiogenesis in wound healing. Proc R Soc London Ser B. 1996;263:1487–1493. doi: 10.1098/rspb.1996.0217. [DOI] [PubMed] [Google Scholar]
- 17.Byrne HM, Chaplain MAJ, Evans DL, Hopkinson I. Mathematical modelling of angiogenesis in wound healing: Comparison of theory and experiment. J Theor Med. 2000;2:175–197. [Google Scholar]
- 18.Schugart RC, Friedman A, Zhao R, Sen CK. Wound angiogenesis as a function of tissue oxygen tension: A mathematical model. Proc Natl Acad Sci USA. 2008;105:2628–2633. doi: 10.1073/pnas.0711642105. [DOI] [PMC free article] [PubMed] [Google Scholar]
- 19.Dor Y, Djonov V, Keshet E. Induction of vascular networks in adult organs: Implications to proangiogenic therapy. Ann NY Acad Sci. 2003;995:208–216. doi: 10.1111/j.1749-6632.2003.tb03224.x. [DOI] [PubMed] [Google Scholar]
- 20.Dor Y, Djonov V, Keshet E. Making vascular networks in the adult: Branching morphogenesis without a roadmap. Trends Cell Biol. 2003;13:131–136. doi: 10.1016/s0962-8924(03)00022-9. [DOI] [PubMed] [Google Scholar]
- 21.McDougall SR, Anderson ARA, Chaplain MAJ, Sherratt JA. Mathematical modelling of flow through vascular networks: Implications for tumour-induced angiogenesis and chemotherapy strategies. Bull Math Biol. 2002;64:673–702. doi: 10.1006/bulm.2002.0293. [DOI] [PubMed] [Google Scholar]
- 22.Stephanou A, McDougall S, Anderson A, Chaplain M. Mathematical modelling of flow in 2d and 3d vascular networks: Applications to anti-angiogenic and chemotherapeutic drug strategies. Math Comput Model. 2005;41:1137–1156. [Google Scholar]
- 23.Anderson ARA, Chaplain MAJ. Continuous and discrete mathematical models of tumor-induced angiogenesis. Bull Math Biol. 1998;60:857–899. doi: 10.1006/bulm.1998.0042. [DOI] [PubMed] [Google Scholar]
- 24.Roy S, et al. Characterization of a pre-clinical model of chronic ischemic wound. Physiol Genomics. 2009 doi: 10.1152/physiolgenomics.90362.2008. [DOI] [PMC free article] [PubMed] [Google Scholar]
- 25.Barocas VH, Tranquillo R. An anisotropic biphasic theory of tissue-equivalent mechanics: The interplay among cell traction, fibrillar network, deformation, fibril alignment, and cell contact guidance. J Biomech Eng. 1997;119:137–145. doi: 10.1115/1.2796072. [DOI] [PubMed] [Google Scholar]
- 26.Hutton J, Tappel A, Udenfriend S. Cofactor and substrate requirements of collagen proline hydroxylase. Arch Biochem Biophys. 1967;118:231–40. [Google Scholar]
- 27.Myllyla R, Tuderman L, Kivirikko KI. Mechanism of the prolyl hydroxylase reaction. Eur J Biochem. 1977;80:349–357. doi: 10.1111/j.1432-1033.1977.tb11889.x. [DOI] [PubMed] [Google Scholar]
- 28.Joseph DD. Fluid Dynamics of Viscoelastic Liquids. Berlin: Springer-Verlag; 1990. p. 13. [Google Scholar]
- 29.Friedman A, Huang C, Yong J. Effective permeability of the boundary of a domain. Commun Partial Differential Equations. 1995;20:59–102. [Google Scholar]
- 30.Jikov VV, Kozlov SM, Oleinik PA. Homogenization of Differential Operators and Integral Functionals. Berlin: Springer-Verlag; 1991. [Google Scholar]
- 31.Murray JK. Mathematical Biology, II Spatial Models and Biomedical Applications. Berlin: Springer; 2003. [Google Scholar]
- 32.Murray JD, Maini PK, Tranquillo RT. Mechanochemical Models for Generating Biological Pattern and Form in Development. 1988;171:59–84. [Google Scholar]
- 33.Olsen L, Sherratt JA, Maini PK. A mechanochemical model for adult dermal wound contraction and the permanence of the contracted tissue displacement profile. J Theor Biol. 1995;177:113–128. doi: 10.1006/jtbi.1995.0230. [DOI] [PubMed] [Google Scholar]
- 34.Bryan S, Dukes S. Case study: Negative pressure wound therapy in an abdominal wound. Br J Nurs. 2009;18:15–21. doi: 10.12968/bjon.2009.18.Sup2.40777. [DOI] [PubMed] [Google Scholar]
Associated Data
This section collects any data citations, data availability statements, or supplementary materials included in this article.