Abstract
Molecular events involved in successful embryo implantation are not well understood. In this study, we used MALDI imaging mass spectrometry (IMS) technologies to characterize the spatial and temporal distribution of phospholipid species associated with mouse embryo implantation. Molecular images showing phospholipid distribution within implantation sites changed markedly between distinct cellular areas during days 4–8 of pregnancy. For example, by day 8, linoleate- and docosahexaenoate-containing phospholipids localized to regions destined to undergo cell death, whereas oleate-containing phospholipids localized to angiogenic regions. Arachidonate-containing phospholipids showed different segregation patterns depending on the lipid class, revealing a strong correlation of phosphatidylethanolamines and phosphatidylinositols with cytosolic phospholipase A2α and cyclooxygenase-2 during embryo implantation. LC-ESI-MS/MS was used to validate MALDI IMS phospholipid distribution patterns. Overall, molecular images revealed the dynamic complexity of lipid distributions in early pregnancy, signifying the importance of complex interplay of lipid molecules in uterine biology and implantation.
Keywords: imaging mass spectrometry, phosphatidylcholine, sphingomyelins, phosphatidylinositol, phosphatidylserine, phosphatidylglycerol, phosphatidylethanolamine
Early pregnancy failure often arises due to defects that occur before, during, or immediately after implantation. Even with in vitro fertilization and embryo-transfer techniques, implantation rates remain low in humans, most often as a result of embryos being transferred into nonreceptive uteri (1). Studying the molecular interactions that regulate implantation will provide a better understanding of these signaling pathways, eventually leading to new approaches to prevent implantation failure.
There is evidence that phospholipid metabolism and signaling influences early pregnancy events (2). Phospholipids are vital structural and regulatory components of biological membranes and serve as precursors for many active biomolecules, such as eicosanoids and lysophospholipids (3, 4). Prostaglandins, one major group of eicosanoid lipid molecules, are produced from arachidonic acid (AA) that is released from membrane phospholipids by phospholipase A2. The released AA is acted upon by cyclooxygenases (COXs) to form prostaglandin H2, which is then converted to various prostaglandins by specific prostaglandin synthases (5). Spatiotemporal expression profiles of cytosolic phospholipase A2α (cPLA2α), COX-1, and COX-2 in the uterus at different stages of pregnancy suggest their differential functions (6–9). In mice, prostaglandin I2 and prostaglandin E2 generated by COX-2 are essential for ovulation, fertilization, implantation, and decidualization (7, 8, 10–13). Prostaglandin’s role is further illustrated by poor fertility, resulting from deferred implantation, in mice lacking cPLA2α (6). Another example for critical roles of lipid signaling in reproduction is the influence of lysophosphatidic acid (LPA), a small lipid molecule of the lysophospholipid family. LPA influences a variety of processes via its cell surface G-protein-coupled receptors, LPA1-4 (14). In mice, LPA3 is expressed in the uterine luminal epithelium with peak expression occurring during the periimplantation period, and its expression overlaps with cPLA2α and COX-2 at the site of implantation (15). More importantly, mice missing LPA3 show remarkably similar defects as cPLA2α-deficient mice, such as deferred on-time implantation, retarded fetal development, embryo crowding, and sharing of one placenta by several embryos (6, 15). Restoration of on-time implantation in LPA3-deficient females by prostaglandin supplementation suggests an intimate interaction between the LPA-LPA3 and cPLA2α-COX-2- prostaglandin signaling pathways (15). These findings established a new concept that a short delay in the attachment of blastocysts to the uterine lining during early pregnancy creates adverse ripple effects during the subsequent course of pregnancy, ultimately compromising pregnancy outcome (2, 16, 17). There is also evidence that disturbances in sphingolipid metabolism by disruption of sphingosine kinase genes causes sphingoid base accumulation and a reduction of phosphatidylethanolamines, thereby inducing early pregnancy loss by compromising decidualization and the uterine vascular bed stability (18).
The goal of this study was to use mass spectrometry technologies to assess globally the differential distribution of glycerophospholipids and sphingomyelins during the cellular events that define implantation. We speculate that spatial distribution of those phospholipids plays important roles in the implantation process. MALDI imaging mass spectrometry (IMS) generates ion density maps from tissue sections that allow protein and phospholipid localization to be visualized without prior knowledge of the specific molecules being analyzed (19–27). This technology has been previously used to analyze proteins involved in proliferation, differentiation, and apoptosis during early mouse pregnancy, providing unique and distinctive proteomic profiles of implantation sites (28). In this study, phospholipid distribution was visualized using the molecular imaging mode of both MALDI-TOF/TOF (time-of-flight) and MALDI Fourier transform ion cyclotron resonance (FTICR) mass spectrometers. The fatty acid chain identities for each phospholipid were determined by MALDI-MS/MS fragmentation. Isobaric phospholipid species with identical masses were visually distinguished using the MS/MS imaging mode of a MALDI linear ion trap mass spectrometer. Finally, absolute quantitation and identification of phospholipids on day 8 of pregnancy was determined using LC-ESI-MS/MS with odd carbon internal standard to further validate phospholipid distribution patterns obtained from the MALDI MS images.
MATERIALS AND METHODS
Mice
Adult CD-1 mice were purchased from Charles River Laboratory (Raleigh, NC). Females were mated with fertile males of the same strain to induce pregnancy. Mice were euthanized between 0900 and 1000 h on the specified day of pregnancy (0 h on day 1 = vaginal plug). Implantation sites on days 5 and 6 of pregnancy were visualized by an intravenous injection of Chicago Blue dye solution, as previously described (29). With the blue dye method, implantation and interimplantation sites can be separately excised, and sections with the implanting embryo can be analyzed (Fig. 1). On day 8 of pregnancy, blue dye injection is not necessary, since implantation sites are visually distinguishable. All mice in the present investigation were treated in accordance with the National Institutes of Health and institutional guidelines on the care and use of laboratory animals.
Fig. 1.
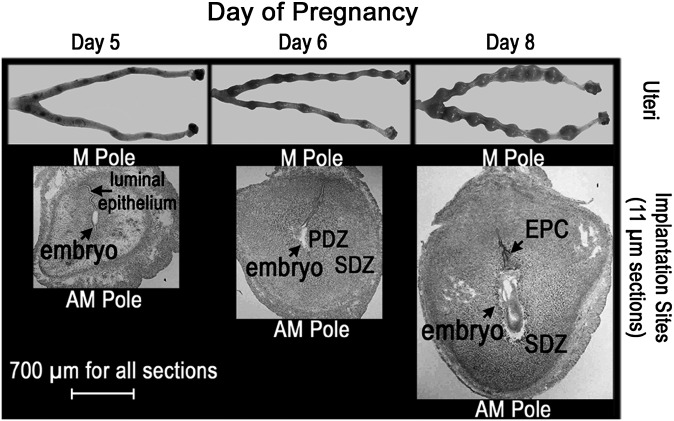
Morphological changes in the mouse uterus from days 5–8 of pregnancy. The three panels contain optical photographs of uteri (top) and uterine implantation site sections (bottom) collected on days 5, 6, and 8 of pregnancy.
MALDI-MS data
Implantation and interimplantation sites were dissected from the uterus, snap-frozen, sectioned (11 μm) in a cryostat, and thaw-mounted onto MALDI MS-compatible glass slides. Tissues analyzed include preimplantation uterine sections (day 4 of pregnancy) and implantation site sections (days 5–8) (Fig. 1).
MALDI-TOF Images were acquired on an UltraFlex II MALDI TOF-TOF instrument equipped with a 355 nm solid-state Nd:YAG laser accumulating 100 shots/spectrum at 100 Hz laser frequency (Bruker Daltonics, Billerica, MA) in reflector mode (30). MALDI-FTICR Images were acquired on a 9.4 T Apex-Qe instrument (Bruker Daltonics, Billerica, MA) equipped with a 337 nm N2 laser accumulating 20 shots/spectrum at 10 Hz laser frequency. MALDI-TOF and MALDI-FTICR images were acquired in positive and negative ion mode.
The lateral resolution of images depicted in Figs. 2 and 3 was 100 μm (positive ion mode images) and 150 μm (negative ion mode images) for the MALDI-TOF data, and 250 μm (positive mode images) and 150 μm (negative mode images) for the MALDI-FTICR data. Multiple lateral resolutions were tested for day 8 implantation site FTICR images; supplementary contains positive ion mode images at 150, 250, and 350 µm lateral resolutions, and supplementary contains negative ion mode images at lateral resolutions at 150 and 250 µm. For positive mode figures, the most intense [M+K]+ form of each phospholipid species is depicted, although each type of adduct ([M+H]+, [M+Na]+ , and [M+K]+) showed the same localization pattern.
Fig. 2.
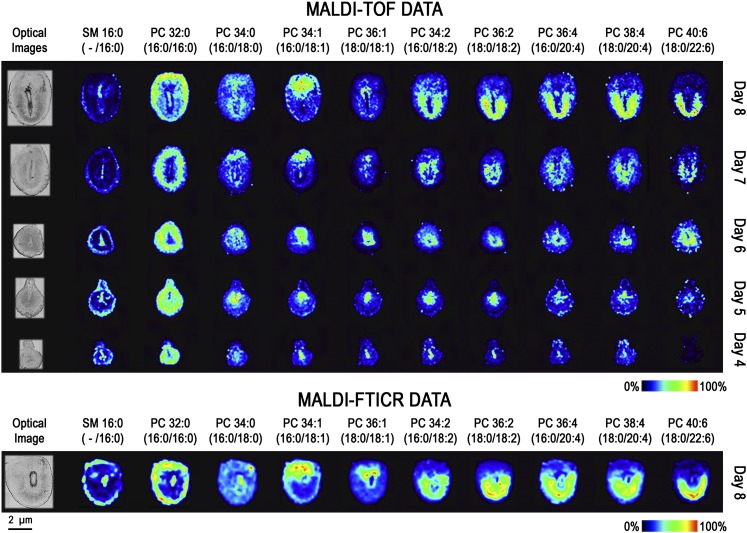
Molecular images of SM and PC phospholipids on days 4–8 of implantation. MALDI-TOF images (top) and MALDI-FTICR images (bottom) of implantation sites are located to the right of their respective optical images. Each column represents a unique potassiated phospholipid [M+K]+, and each row represents a different day of pregnancy. Each image is orientated so the M pole is at the top and the AM pole is at the bottom.
Fig. 3.
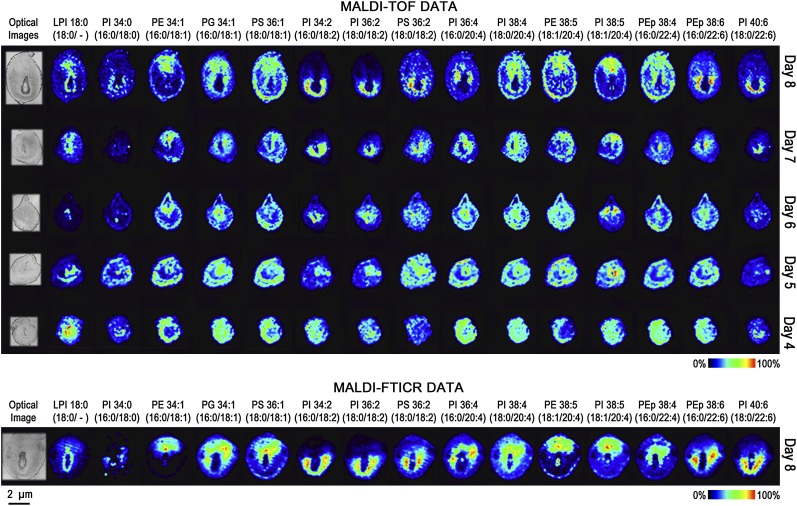
Molecular images of PE, PEp, PI, lysophosphatidylinositol (LPI), PS, and PG on days 4–8 of implantation. MALDI-TOF images (top) and MALDI-FTICR images (bottom) of implantation sites are located to the right of their respective optical images. Each column represents a unique phospholipid [M-H]−, and each row represents a different day of pregnancy. Each image is orientated so the M pole is at the top and the AM pole is at the bottom.
Matrix application in positive and negative mode utilized dry-coating methods (30) to deposit 2,5-dihydroxybenzoic acid (DHB) and ultrafine nebulization to deposit 2,5-dihydroxyacetophenone (DHA) (9 mg DHA, 6 μl aniline, 700 μl ethanol, 300 μl deionized water) on tissue sections, respectively. Briefly, in the dry-coating approach, finely ground crystals of DHB were filtered through a 20 μm stainless steel sieve purchased from Hogentogler and Co. (Columbia, MD) directly onto tissue sections. In negative ion mode, DHA generates a high abundance of phospholipids when compared with DHB, yet it is known to sublimate under high vacuum (e.g., 1 × 10⁻⁶ Torr or lower) within 30 min (31). To combat DHA sublimation in the high vacuum source of our MALDI-TOF instrument, nebulization was used to deposit a thick coat of DHA over the tissue; likewise, the lateral resolution was increased to 150 µm (vs. 100 μm for positive mode) to ensure the total time under vacuum was <30 min. DHA sublimation was not an issue in the intermediate pressure source of our MALDI-FTICR instrument. As an example of the time needed for image acquisition, in Fig. 3 the day 8 MALDI-TOF image (661 pixels) took ∼22 min and MALDI-FTICR image (662 pixels) took ∼199 min.
MALDI-MS/MS data
The day 8 images, located in the bottom of Figs. 2 and 3, were acquired on our 9.4 Tesla FTICR mass spectrometer with a mass accuracy of ±0.005 Da at m/z of 1,000 (5 ppm). The LIPID metabolites and pathways strategy (LIPID MAPS) online resource was used to search for possible lipid structures that could match our experimental mass (±0.005 Da). Although only one theoretical mass matched in each case, multiple fatty acid isobars with the same exact mass are possible. Thus, MALDI-MS/MS fragmentation of phospholipids was implemented to confidently determine the fatty acid chains. Fragmentation of phosphatidylinositols (PIs), phosphatidylserines (PSs), and phosphatidylethanolamines (PEs) in negative ion mode generates fatty acid peaks and corresponding lysospecies (32). Characteristic fragmentations of phosphatidylcholines (PCs) in positive ion mode contain only one fragment corresponding to the head group (m/z 184 Da). To obtain fragment peaks indicative of the fatty acid chains in PCs, the matrix was doped with lithium chloride (27, 33). MALDI-MS/MS fragmentation peaks for each lipid in positive ion mode and negative ion mode are listed in supplementary Tables I and II, respectively.
All MALDI-MS/MS experiments were performed on a MALDI-linear ion trap quadrupole mass spectrometer (MALDI-LTQ; Thermo Electron, San Jose, CA) equipped with a 337 nm N2 laser. For fragmentation of phospholipids, matrix solution was hand spotted; DHA matrix solution (9 mg DHA, 6 μl aniline, 700 μl ethanol, 300 μl deionized water) was used for negative mode analysis and DHA matrix solution doped with 100 mM LiCl was used for positive mode fragmentation. In MS/MS imaging experiments (instrument parameters included a laser energy of 55 µJ, 3 microscans/step, and seven shots/microscan), tissue sections were spotted with DHA matrix solution (9 mg DHA, 6 μl aniline, 700 μl ethanol, and 300 μl deionized water) at a lateral resolution of 230 µm (one drop/cycle, 15 cycles) (Portrait 630 reagent Multi-Spotter; Labcyte, Sunnyvale, CA).
LC-MS/MS data
All LC-MS/MS experiments were performed on a hybrid triple quadrupole/linear ion trap mass spectrometer (4000 QTrap; Applied Biosystems, Foster City, CA). Each experiment required approximately 15 mg of tissue. LC-MS quantitation of phospholipids followed previously published protocols (34). Identification of individual phospholipids was achieved by LC-MS/MS fragmentation analysis. Supplementary Table III contains the results for all the statistically significant phospholipids analyzed in the three replicate LC-MS/MS experiments.
Immunohistochemistry
The COX-2 antibody was purchased from Cayman (Ann Arbor, MI) (9). Localization of protein in formalin-fixed paraffin-embedded uterine sections (5 µm) was achieved as previously described (35). In brief, after deparaffinization and hydration, sections were subjected to antigen retrieval using a pressure cooker in 10 mmol/l sodium citrate solution (pH 6.0) for 20 min. A Histostain-Plus kit (Zymed, San Francisco, CA) was used to visualize the antigen; brown deposits indicate sites of positive immunostaining.
RESULTS
Biological processes underlying embryo implantation
Figure 1 shows implantation sites along the uterine horns on days 5, 6, and 8 of pregnancy in mice and corresponding tissue sections through these sites. The initial attachment of the blastocyst trophectoderm with the luminal epithelium occurs around 2200–2400 h on day 4 of pregnancy (0 h on day 1 = vaginal plug). Following this attachment, uterine stromal cells at the site of blastocysts undergo extensive proliferation and differentiation giving rise to decidual cells, a process termed decidualization (29, 36). At the same time, luminal epithelial apoptosis occurs at the site of blastocyst attachment (37), resulting in subsequent adherence and penetration of trophoblast cells through the stroma in a regulated manner (36). On the afternoon of day 5 of pregnancy, the proliferating stromal cells bordering the implanting embryo begin to differentiate into decidual cells, forming the avascular primary decidual zone (PDZ). By day 6, the PDZ completes differentiation, and a secondary decidual zone (SDZ) forms around the PDZ. Although proliferation is terminated in the PDZ, it continues in the SDZ. The PDZ then progressively degenerates through day 8 of pregnancy. On day 8 of pregnancy, cells in the SDZ at the antimesometrial (AM) pole are still proliferating but are destined to undergo cell death with the progression of pregnancy to create space for the growing embryo, whereas decidual cells at the mesometrial (M) pole undergo heightened angiogenesis forming a vascularized zone that brings maternal and fetal blood vessels in close proximity, a prerequisite for the formation of a functional placenta (36).
Spatial remodeling of phospholipids during early pregnancy
The molecular images obtained in this study show that phospholipid distributions correlate with the heterogeneous cell types (shown in Fig. 1) that arise during the course of implantation. Zwitterionic PCs and sphingomyelins (SMs) are readily detected in the positive mode (Fig. 2) by MALDI MS, whereas the anionic PIs, PSs, and phosphatidylglycerols (PGs) are best detected in the negative mode (Fig. 3). PEs and phosphatidylethanolamine plasmalogens (PEps) can be detected as positive or negative ions but are usually best measured in negative mode directly from tissue sections.
Images of specific phospholipids taken during days 4–8 of pregnancy are shown in columns in Figs. 2 and 3. At the top of each column, phospholipids are labeled using accepted lipid nomenclature where the first number represents the total number of carbon atoms in the two fatty acid chains, and the second number represents the total number of double bonds in the two fatty acid chains. The identity of each individual fatty acid side chain is located in parenthesis (sn1/sn2). Fatty acid chains were identified from a combination of the exact mass of the phospholipid molecular species and the MS/MS fragmentation pattern (described below).
From these data, phospholipid expression patterns can be categorized according to the degree of unsaturation of the sn2 fatty acid chain. Consequently, the images displayed in Figs. 2 and 3 are aligned in increasing order of unsaturation: 16:0, 18:0, 18:1, 18:2, 20:4, 22:4, and 22:6. Although there remains some uncertainty regarding the sn1 and sn2 positional assignment of fatty acids from mass spectral data, it is generally accepted that more unsaturated fatty acids occupy the sn2 position (supplementary Tables I and II list MALDI-MS/MS fragment peaks from highest intensity to lowest intensity) (27, 38).
The molecular images shown in Figs. 2 and 3 depict alterations in phospholipid distributions as uterine cells undergo decidual changes from day 4 to day 8 of pregnancy. Before embryo attachment, luminal epithelial cells show substantial increases for SM 16:0 and PCs with 18:1, 18:2, and 20:4 as their unsaturated fatty acid chain (Fig. 2). Conversely, PC (16:0/16:0) shows relatively higher expression in all cell types except for the luminal epithelial cells. Overall, this saturated phospholipid shows an inverse localization pattern when compared with the other phospholipids on days 4–8 of pregnancy. On day 5 of pregnancy, glycerophospholipid images show an intense increase in uterine stroma cells at the site of embryo attachment, whereas on day 6, glycerophospholipid expression is most intense in the PDZ. Also, certain phospholipids show higher levels in the M pole (above the embryo in these images) and AM pole (around the bottom of the embryo). Higher expression in the M pole is seen for all PC (16:0/18:1), PE (16:0/18:1), and PI (18:1/20:4), whereas higher expression at the AM pole can be seen for PC (18:0/18:2) and PI (16:0/18:2). On day 8 of pregnancy, many of the phospholipids show higher intensity either in the M pole or AM pole. Overall, the phospholipids that show higher levels at the M pole are PCs, PE, PG, and PS containing 18:1; PIs and PE with 20:4 as their polyunsaturated fatty acid; and PEp (16:0/22:4). The phospholipids showing higher intensities at the AM pole are PCs, PIs, and PS having 18:2 as a substituent; PCs with 20:4 as their polyunsaturated fatty acid; and PC, PEp, and PI with 22:6 as their polyunsaturated fatty acid. The reproducibility of these results (MALDI-TOF and -FTICR) is represented in supplementary , and the quality of the primary MALDI spectra is represented in Fig. 4A and B and supplementary Figs. IV and V. With these results in hand, subsequent experiments were focused on day 8 implantation sites since dramatic spatial changes in phospholipid expression with extensive cellular remodeling were observed on this day.
Fig. 4.
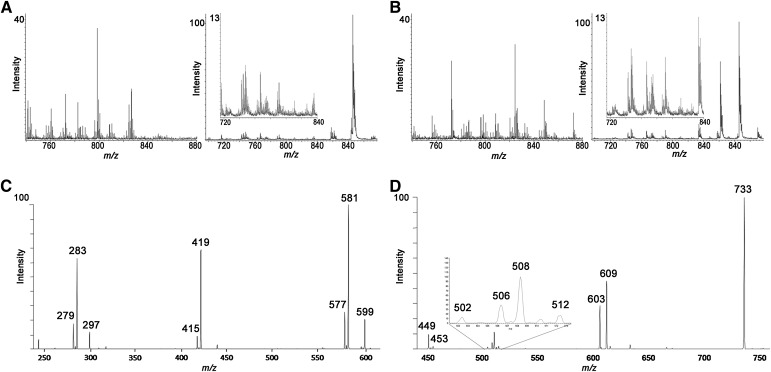
MALDI spectra. Positive and negative ion mode spectra extracted from the M pole (A) and AM pole (B) of day 8 MALDI-TOF images. C: Fragmentation spectra of PI 36:2 in negative ion mode. D: Fragmentation spectra of PC 36:2 in positive ion mode (matrix was doped with 100 mM lithium chloride).
Determining the presence of isobaric ions (same nominal mass but different exact masses) in day 8 implantation sites by FTICR IMS
The molecular weights of phospholipids investigated in this study are between 600 and 1000 Da. Within this mass range, the peak density of MALDI spectra is typically complicated by a large number of other endogenous metabolites as well as matrix ions. Together with the naturally occurring carbon isotopes of these species, the resolving power of TOF instruments may not be capable of determining if multiple isobaric ions are contributing to a specific ion image. Positive ion spectra, in particular, can be quite complex with the possibility of detecting ions adducted with H+, Na+, or K+. To determine isobaric interference, MALDI images of day 8 embryos were also acquired on a FTICR at a resolving power of 100,000 (full width half maximum). Peak widths were 10–20 mDa, compared with 100–200 mDa for the TOF spectra and are sufficient to resolve most phospholipid species that are typically observed in MALDI spectra. Ion images from both instruments are shown in Figs. 2 and 3. From these data, it is clear that only one molecular species contributes to the TOF images. An example where multiple isobaric ions were detected is shown (supplementary Fig. VI).
In situ identification of phospholipids by MS/MS
Identification of fatty acid chains of phospholipids was accomplished using both the accurate mass of the parent phospholipid ion with FTICR IMS [mass accuracy of ±0.005 Da at m/z 1,000 (5 ppm)] and MALDI-MS/MS fragmentation spectra (32). Supplementary Tables I and II contain the accurate mass and fragmentation peaks for each lipid in positive and negative ion mode, respectively. The fragmentation spectra of PI (18:0/18:2) and PC (18:0/18:2) are shown ( and the structures and labeled fragmentation spectra of PI (18:0/18:2) and PC (18:0/18:2) are shown (supplementary Fig. VII).
Distinguishing spatial distribution of isobaric phospholipids (identical masses) in day 8 implantation sites by tandem IMS
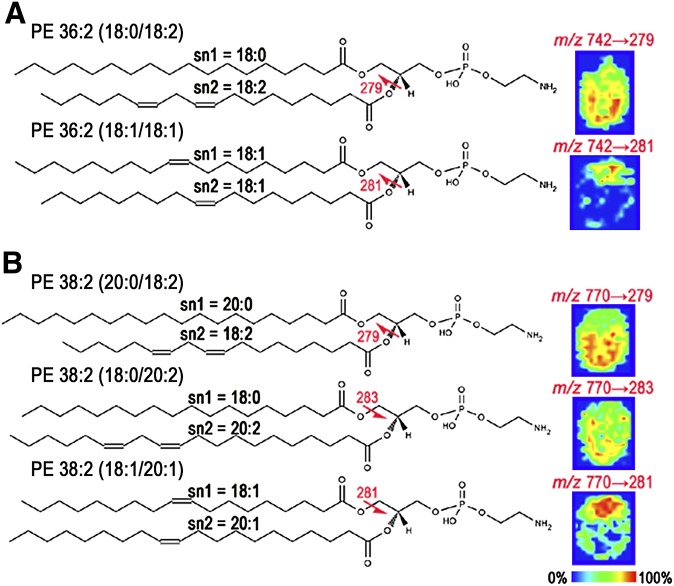
The MS images for phospholipids PE 36:2 and PE 38:2 showed no distinct spatial location. However, MS/MS fragmentation found each of these phospholipid ions to consist of multiple isobaric species (structure of each isobar, Fig. 5, left). PE 18:0/18:2 and PE 18:1/18:1 are isobars of the class PE 36:2 (m/z = 742.54) (Fig. 5A). PE 20:0/18:2, PE 18:0/20:2, and PE 18:1/20:1 are isobars of PE 38:2 (m/z = 770.57) (Fig. 5B). MS/MS imaging determined the spatial location of each isobar in day 8 implantation sites (Fig. 5, right). The MS/MS images of PE 36:2 and PE 38:2 confirmed that more than one combination of sn1 and sn2 fatty acids were present. Although MS/MS images were obtained for each fragment ion, Fig. 5 displays only the most intense fragment ion from each isobar (represented by a red arrow on each phospholipid structure). The MS/MS images of PE 36:2 contain 18:2 (signified by the fatty acid 18:2 or the 279 m/z fragment ion) that localized to the bottom (AM pole) and 18:1 (281 m/z fragment ion) that localized to the top (M pole) of the day 8 implantation site. The MS image of PE 38:2 includes PE (20:0/18:2), PE (18:0/20:2), and PE (18:1/20:1). The MS/MS images of PE 38:2 contain either the diunsaturated 18:2 fatty acid (279 m/z fragment ion) or 18:0 fatty acid (283 m/z fragment ion) that both localize to the AM pole or the monounsaturated fatty acid 18:1 (281 m/z fragment ion) that localizes to the M pole of the day 8 implantation site.
Fig. 5.
MS/MS imaging characterizes the spatial distribution of isobaric phospholipids with identical masses. Isobars for phospholipids PE 36:2 (A) and PE 38:2 (B). Structure of each isobar (left) and MS/MS images of the most intense fragment ion (right).
Validation of MALDI IMS phospholipid expression patterns by LC-ESI-MS/MS quantitation
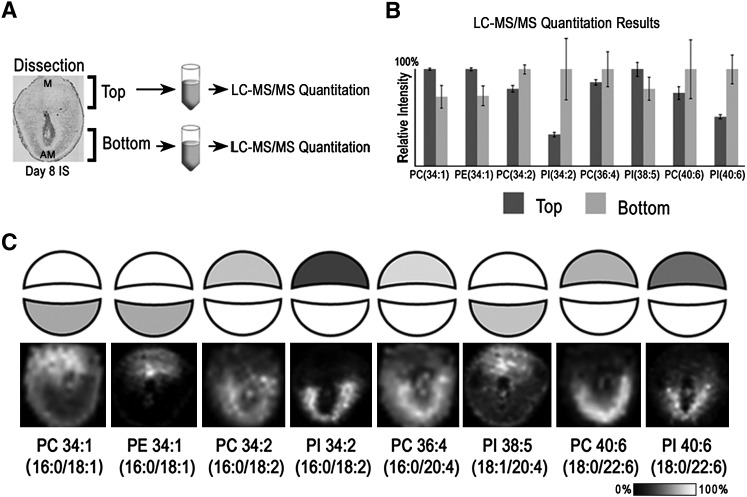
LC-MS/MS was used to quantify and identify phospholipids in the M and AM poles on day 8 of pregnancy (Fig. 6A–C). Day 8 implantation sites (15 mg of tissue per sample) were microdissected (Fig. 6A) to isolate the top and bottom hemispheres for subsequent organic phase lipid extraction. The bottom row of Fig. 6C contains selected FTICR phospholipid images that exhibit the greatest change in relative abundance between the M and AM poles in day 8 implantation sites. LC-MS/MS quantitation of these same phospholipids is illustrated as block structures, set to the same linear black and white scale as the MALDI images, in the top row of Fig. 6C or as bar graphs in Fig. 6B. In summary, a high degree of correlation between LC-MS/MS quantitation and MALDI IMS was observed, with PC 34:1 (16:0/18:1), PE 34:1 (16:0/18:1), and PI 38:5 (18:1/20:4) localizing to the M pole and PC 34:2 (16:0/18:2), PI 34:2 (16:0/18:2), PC 36:4 (16:0/20:4), PC 40:6 (18:0/22:6), and PI 40:6 (18:0/22:6) localizing to the AM pole. Supplementary Table III contains all of the LC-MS/MS results.
Fig. 6.
Quantation of phospholipids: LC-MS/MS data from implantation sites on day 8 of pregnancy correlates with IMS images. A: Workflow for microdissection of top (M pole) and bottom (AM pole) of uteri for subsequent LC-MS/MS analyses. B: LC-MS/MS quantitative results for selected phospholipids between the top and bottom of day 8 implantation sites. C: Block figures representing LC-MS/MS data (data from B) with corresponding FTICR MS images below.
Colocalization of arachidonate-containing phospholipids with COX-2
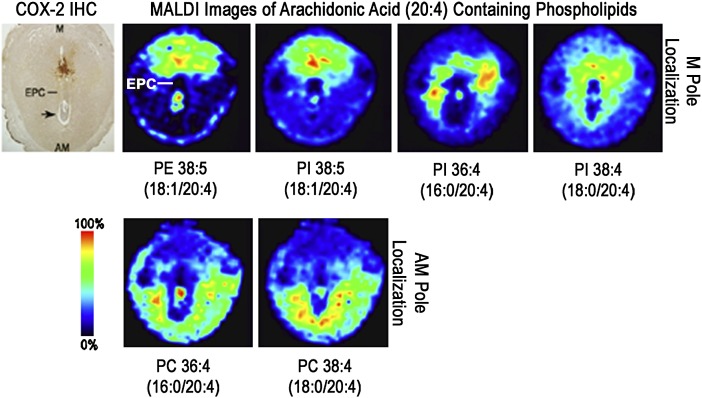
Signaling of prostaglandin signaling, resulting from cPLA2α-COX-2 processing of arachidonate (20:4), participates in embryo attachment and uterine decidualization during embryo implantation (6, 8). Thus, it was of interest to determine which arachidonate-containing phospholipids colocalize with COX-2. Figure 7 shows an immunohistochemistry stain for COX-2 and the MALDI images of AA-containing phospholipids. COX-2 expression localizes to the M pole above the ectoplacental cone (EPC); correspondingly, PIs and PEs show M pole expression with PE 38:5 (18:1/20:4) and PI 38:5 (18:1/20:4) exhibiting highest levels of expression above the EPC. In contrast, PC 36:4 (16:0/20:4) and PC 38:4 (18:0/20:4) expression patterns are confined to the AM pole.
Fig. 7.
Colocalization of arachidonate-containing phospholipids with COX-2. Immunohistochemistry (IHC) stain of COX-2 on day 8 of pregnancy (left). MALDI images of AA-containing phospholipids on day 8 of pregnancy (right). Black arrow, embryo.
DISCUSSION
Lipids are important components of cellular membranes and also serve as signaling molecules that help coordinate events during embryo implantation and postimplantation growth (8, 15). In this study, we have mapped phospholipid distributions during embryo implantation employing the molecular specificity of mass spectrometry. The results demonstrate that distribution of phospholipids is markedly altered during implantation with changes specific to the M (top) and AM (bottom) poles of the uterus, suggesting roles for those phospholipids in the implantation process.
The distribution of phospholipids showed significant changes in day 5 implantation sites after embryo attachment, and most phospholipids showed substantial increases in the stroma immediately surrounding the implanting embryo. The spatial redistribution continued on days 6–8 of pregnancy with differential localization in the M and AM poles of the implantation sites. With respect to proteins, previous reports on day 8 of pregnancy revealed an increased level of proteins involved in angiogenesis at the M pole and those involved in cell death at the AM pole. Specifically, proangiogenic proteins angiopoietin 2 and angiopoietin 3 and their endothelial-specific receptor tyrosine kinase Tie2 show an increased expression at the M pole, which also expresses COX-2, a known enhancer of angiogenesis (36). Although the mechanism(s) governing decidual cell death at the AM pole are not clearly understood, there is evidence that a balance between proapoptotic Bax and antiapoptotic Bcl are involved (39). Regardless, these differential behaviors of the M and AM poles have biological significance with respect to increasing angiogenesis at the M pole, the site of angiogenesis, and initiating apoptosis or cell death at the AM pole to make room for the rapidly growing embryo. This molecular orchestration of lipids and proteins in both space and time underscores the complex biological processes involved in sustaining embryo growth and survival during early pregnancy.
For lipids, these data show a segregation of phospholipids that contain linoleate (18:2) and docosahexaenoate (22:6) at the AM pole, and oleate (18:1) at the M pole, across all lipid classes. Arachidonate (20:4) containing phospholipids showed differential segregation patterns depending on the lipid class. This is interesting in the context of the reported finding that liberation of arachidonate by cPLA2α from membrane phospholipids has been found to be class dependent. This previous study suggests that PCs appear to be the major ultimate source of 20:4 used for eicosanoid biosynthesis during zymosan phagocytosis in murine primary resident peritoneal macrophages, although specific 20:4 contain PIs, PGs play minor roles, and other species like PEps can serve as transient sources that are rapidly replenished (40, 41). This may explain why different classes of AA-containing membrane phospholipids show differential expression patterns in our molecular images. There is now evidence that COX-2 expressed on day 8 of pregnancy at the M pole above the EPC plays a role in angiogenesis (8) (Fig. 7). Phospholipids that act as substrates in the cPLA2α-COX-2 pathway should colocalize with the rate-limiting enzyme COX-2. In fact, while arachidonate-containing PEs and PIs are localized to the M pole, arachidonate-containing PCs are found to be localized to the AM pole. Oleic acids containing phospholipids also colocalized to the M pole with COX-2, but to date there is not a mechanistic connection between 18:1 and COX-2.
This study reveals the importance of obtaining detailed molecular information on both a spatial and temporal basis to uncover the complexity of biological events. We believe this article will initiate further studies that will help us to better understand the intricacies of implantation and how specific lipid species may mediate, balance, and control cellular events.
Supplementary Material
Footnotes
Abbreviations:
- AA
- arachidonic acid
- AM
- antimesometrial
- COX
- cyclooxygenase
- cPLA2α
- cytosolic PLA2α
- DHA
- 2,5-dihydroxyacetophenone
- DHB
- 2,5-dihydroxybenzoic acid
- EPC
- ectoplacental cone
- FTICR
- Fourier transform ion cyclotron resonance
- IMS
- imaging mass spectrometry
- LPA
- lysophosphatidic acid
- M
- mesometrial
- PC
- phosphatidylcholine
- PDZ
- primary decidual zone
- PE
- phosphatidylethanolamine
- PEp
- phosphatidylethanolamine plasmalogen
- PG
- phosphatidylglycerol
- PI
- phosphatidylinositol
- PS
- phosphatidylserine
- SDZ
- secondary decidual zone
- SM
- sphingomyelin
- TOF
- time-of-flight
This work was supported in part by the National Institutes of Health/National Institute of General Medical Sciences (NIGMS) Grants GM58008-09 and DOD W81XWH-05-1-0179 (R.M.C.), National Institute of Child Health and Human Development (NICHD)/National Institutes of Health Grant HD12304 (S.K.D.), and National Institutes of Health/National Institute of General Medical Sciences (NIGMS) Grant U54 GM69338 (H.A.B.). K.E.B. acknowledges National Institute of Child Health and Human Development (NICHD) Grant 2T HD007043-31A2. Its contents are solely the responsibility of the authors and do not necessarily represent the official views of the National Institutes of Health, the National Institute of General Medical Sciences, or the National Institute of Child Health and Human Development.
The online version of this article (available at http://www.jlr.org) contains supplementary data in the form of two figures and five tables.
REFERENCES
- 1.Wang H., Dey S. K. 2006. Roadmap to embryo implantation: clues from mouse models. Nat. Rev. Genet. 7: 185–199. [DOI] [PubMed] [Google Scholar]
- 2.Shah B. H., Catt K. J. 2005. Roles of LPA3 and COX-2 in implantation. Trends Endocrinol. Metab. 16: 397–399. [DOI] [PubMed] [Google Scholar]
- 3.Mills G. B., Moolenaar W. H. 2003. The emerging role of lysophosphatidic acid in cancer. Nat. Rev. Cancer. 3: 582–591. [DOI] [PubMed] [Google Scholar]
- 4.Khan W. A., Blobe G. C., Hannun Y. A. 1995. Arachidonic acid and free fatty acids as second messengers and the role of protein kinase C. Cell. Signal. 7: 171–184. [DOI] [PubMed] [Google Scholar]
- 5.Smith W. L., DeWitt D. L., Garavito R. M. 2000. Cyclooxygenases: structural, cellular, and molecular biology. Annu. Rev. Biochem. 69: 145–182. [DOI] [PubMed] [Google Scholar]
- 6.Song H., Lim H., Paria B. C., Matsumoto H., Swift L. L., Morrow J., Bonventre J. V., Dey S. K. 2002. Cytosolic phospholipase A2alpha is crucial [correction of A2alpha deficiency is crucial] for ‘on-time’ embryo implantation that directs subsequent development. Development. 129: 2879–2889. [DOI] [PubMed] [Google Scholar]
- 7.Lim H., Paria B. C., Das S. K., Dinchuk J. E., Langenbach R., Trzaskos J. M., Dey S. K. 1997. Multiple female reproductive failures in cyclooxygenase 2-deficient mice. Cell. 91: 197–208. [DOI] [PubMed] [Google Scholar]
- 8.Wang H., Ma W-g., Tejada L., Zhang H., Morrow J. D., Das S. K., Dey S. K. 2004. Rescue of female infertility from the loss of Cyclooxygenase-2 by compensatory up-regulation of Cyclooxygenase-1 is a function of genetic makeup. J. Biol. Chem. 279: 10649–10658. [DOI] [PubMed] [Google Scholar]
- 9.Chakraborty I., Das S. K., Wang J., Dey S. K. 1996. Developmental expression of the cyclo-oxygenase-1 and cyclo-oxygenase-2 genes in the peri-implantation mouse uterus and their differential regulation by the blastocyst and ovarian steroids. J. Mol. Endocrinol. 16: 107–122. [DOI] [PubMed] [Google Scholar]
- 10.Matsumoto H., Ma W., Smalley W., Trzaskos J., Breyer R. M., Dey S. K. 2001. Diversification of cyclooxygenase-2-derived prostaglandins in ovulation and implantation. Biol. Reprod. 64: 1557–1565. [DOI] [PubMed] [Google Scholar]
- 11.Lim H., Gupta R. A., Ma W. G., Paria B. C., Moller D. E., Morrow J. D., DuBois R. N., Trzaskos J. M., Dey S. K. 1999. Cyclo-oxygenase-2-derived prostacyclin mediates embryo implantation in the mouse via PPARdelta. Genes Dev. 13: 1561–1574. [DOI] [PMC free article] [PubMed] [Google Scholar]
- 12.Davis B. J., Lennard D. E., Lee C. A., Tiano H. F., Morham S. G., Wetsel W. C., Langenbach R. 1999. Anovulation in cyclooxygenase-2-deficient mice is restored by prostaglandin E2 and interleukin-1beta. Endocrinology. 140: 2685–2695. [DOI] [PubMed] [Google Scholar]
- 13.Segi E., Haraguchi K., Sugimoto Y., Tsuji M., Tsunekawa H., Tamba S., Tsuboi K., Tanaka S., Ichikawa A. 2003. Expression of messenger RNA for prostaglandin E receptor subtypes EP4/EP2 and cyclooxygenase isozymes in mouse periovulatory follicles and oviducts during superovulation. Biol. Reprod. 68: 804–811. [DOI] [PubMed] [Google Scholar]
- 14.Ishii I., Fukushima N., Ye X., Chun J. 2004. Lysophospholipid receptors: signaling and biology. Annu. Rev. Biochem. 73: 321–354. [DOI] [PubMed] [Google Scholar]
- 15.Ye X., Hama K., Contos J. J., Anliker B., Inoue A., Skinner M. K., Suzuki H., Amano T., Kennedy G., Arai H., et al. 2005. LPA3-mediated lysophosphatidic acid signalling in embryo implantation and spacing. Nature. 435: 104–108. [DOI] [PMC free article] [PubMed] [Google Scholar]
- 16.Dey S. K. 2005. Reproductive biology: fatty link to fertility. Nature. 435: 34–35. [DOI] [PubMed] [Google Scholar]
- 17.Wilcox A. J., Baird D. D., Weinberg C. R. 1999. Time of implantation of the conceptus and loss of pregnancy. N. Engl. J. Med. 340: 1796–1799. [DOI] [PubMed] [Google Scholar]
- 18.Mizugishi K., Li C., Olivera A., Bielawski J., Bielawska A., Deng C., Proia R. 2007. Maternal disturbance in activated sphingolipid metabolism causes pregnancy loss in mice. J. Clin. Invest. 117: 2993–3006. [DOI] [PMC free article] [PubMed] [Google Scholar]
- 19.Wiseman J. M., Ifa R. D., Song Q., Cooks R. G. 2006. Tissue imaging at atmospheric pressure using desorption electrospray ionization (DESI) mass spectrometry. Angew. Chem. Int. Ed. Engl. 45: 7188–7192. [DOI] [PubMed] [Google Scholar]
- 20.Sjovall P., Lausmaa J., Johansson B. 2004. Mass spectrometric imaging of lipids in brain tissue. Anal. Chem. 76: 4271–4278. [DOI] [PubMed] [Google Scholar]
- 21.Touboul D., Roy S., Germain D. P., Chaminade P., Brunelle A., Laprévote O. 2007. MALDI-TOF and cluster-TOF-SIMS imaging of Fabry disease biomarkers. Int. J. Mass Spectrom. 260: 158–165. [Google Scholar]
- 22.Börner K., Malmberg P., Månsson J-E., Nygren H. 2007. Molecular imaging of lipids in cells and tissues. Int. J. Mass Spectrom. 260: 128–136. [Google Scholar]
- 23.Rujoi M., Estrada R., Yappert M. C. 2004. In situ MALDI-TOF MS regional analysis of neutral phospholipids in lens tissue. Anal. Chem. 76: 1657–1663. [DOI] [PubMed] [Google Scholar]
- 24.Garrett T. J., Prieto-Conaway M. C., Kovtoun V., Bui H., Izgarian N., Stafford G., Yost R. A. 2007. Imaging of small molecules in tissue sections with a new intermediate-pressure MALDI linear ion trap mass spectrometer. Int. J. Mass Spectrom. 260: 166–176. [Google Scholar]
- 25.Caprioli R. M., Farmer T. B., Gile J. 1997. Molecular imaging of biological samples: localization of peptides and proteins using MALDI-TOF MS. Anal. Chem. 69: 4751–4760. [DOI] [PubMed] [Google Scholar]
- 26.Cornett D. S., Reyzer M. L., Chaurand P., Caprioli R. M. 2007. MALDI imaging mass spectrometry: molecular snapshots of biochemical systems. Nat. Methods. 4: 828–833. [DOI] [PubMed] [Google Scholar]
- 27.Jackson S. N., Wang H-Y. J., Woods A. S. 2005. In situ structural characterization of phosphatidylcholines in brain tissue using MALDI-MS/MS. J. Am. Soc. Mass Spectrom. 16: 2052–2056. [DOI] [PubMed] [Google Scholar]
- 28.Burnum K. E., Tranguch S., Mi D., Daikoku T., Dey S. K., Caprioli R. M. 2008. Imaging mass spectrometry reveals unique protein profiles during embryo implantation. Endocrinology. 149: 3274–3278. [DOI] [PMC free article] [PubMed] [Google Scholar]
- 29.Paria B. C., Huet-Hudson Y. M., Dey S. K. 1993. Blastocyst’s state of activity determines the “window” of implantation in the receptive mouse uterus. Proc. Natl. Acad. Sci. USA. 90: 10159–10162. [DOI] [PMC free article] [PubMed] [Google Scholar]
- 30.Puolitaival S. M., Burnum K. E., Cornett D. S., Caprioli R. M. 2008. Solvent-free matrix dry-coating for MALDI imaging of phospholipids. J. Am. Soc. Mass Spectrom. 19: 882–886. [DOI] [PMC free article] [PubMed] [Google Scholar]
- 31.Wang H. Y., Jackson S. N., Woods A. S. 2007. Direct MALDI-MS analysis of cardiolipin from rat organs sections. J. Am. Soc. Mass Spectrom. 18: 567–577. [DOI] [PMC free article] [PubMed] [Google Scholar]
- 32.Murphy R. C., Harrison K. A. 1994. Fast atom bombardment mass spectrometry of phospholipids. Mass Spectrom. Rev. 13: 57–75. [Google Scholar]
- 33.Hsu F. F., Bohrer A., Turk J. 1998. Formation of lithiated adducts of glycerophosphocholine lipids facilitates their identification by electrospray ionization tandem mass spectrometry. J. Am. Soc. Mass Spectrom. 9: 516–526. [DOI] [PubMed] [Google Scholar]
- 34.Ivanova P. T., Milne S. B., Byrne M. O., Xiang Y., Brown H. A., Brown H. A. 2007. Glycerophospholipid identification and quantitation by electrospray ionization mass spectrometry. Methods Enzymol. 432: 21–57. [DOI] [PubMed] [Google Scholar]
- 35.Tan J., Paria B. C., Dey S. K., Das S. K. 1999. Differential uterine expression of estrogen and progesterone receptors correlates with uterine preparation for implantation and decidualization in the mouse. Endocrinology. 140: 5310–5321. [DOI] [PMC free article] [PubMed] [Google Scholar]
- 36.Dey S. K., Lim H., Das S. K., Reese J., Paria B. C., Daikoku T., Wang H. 2004. Molecular cues to implantation. Endocr. Rev. 25: 341–373. [DOI] [PubMed] [Google Scholar]
- 37.Parr E. L., Tung H. N., Parr M. B. 1987. Apoptosis as the mode of uterine epithelial cell death during embryo implantation in mice and rats. Biol. Reprod. 36: 211–225. [DOI] [PubMed] [Google Scholar]
- 38.Voet D., Voet J. G. 2004. Biochemistry. 3rd edition. John Wiley & Sons, Hoboken, NJ. [Google Scholar]
- 39.Akcali K. C., Khan S. A., Moulton B. C. 1996. Effect of decidualization on the expression of bax and bcl-2 in the rat uterine endometrium. Endocrinology. 137: 3123–3131. [DOI] [PubMed] [Google Scholar]
- 40.Rouzer C. A., Ivanova P. T., Byrne M. O., Milne S. B., Marnett L. J., Brown H. A. 2006. Lipid profiling reveals arachidonate deficiency in RAW264.7 cells: structural and functional implications. Biochemistry. 45: 14795–14808. [DOI] [PMC free article] [PubMed] [Google Scholar]
- 41.Rouzer C. A., Ivanova P. T., Byrne M. O., Brown H. A., Marnett L. J. 2007. Lipid profiling reveals glycerophospholipid remodeling in zymosan-stimulated macrophages. Biochemistry. 46: 6026–6042. [DOI] [PubMed] [Google Scholar]
Associated Data
This section collects any data citations, data availability statements, or supplementary materials included in this article.


