


Abstract
Discovering which regulatory proteins, especially transcription factors (TFs), are active under certain experimental conditions and identifying the corresponding binding motifs is essential for understanding the regulatory circuits that control cellular programs. The experimental methods used for this purpose are laborious. Computational methods have been proven extremely effective in identifying TF-binding motifs (TFBMs). In this article, we propose a novel computational method called MotifExpress for discovering active TFBMs. Unlike existing methods, which either use only DNA sequence information or integrate sequence information with a single-sample measurement of gene expression, MotifExpress integrates DNA sequence information with gene expression measured in multiple samples. By selecting TFBMs that are significantly associated with gene expression, we can identify active TFBMs under specific experimental conditions and thus provide clues for the construction of regulatory networks. Compared with existing methods, MotifExpress substantially reduces the number of spurious results. Statistically, MotifExpress uses a penalized multivariate regression approach with a composite absolute penalty, which is highly stable and can effectively find the globally optimal set of active motifs. We demonstrate the excellent performance of MotifExpress by applying it to synthetic data and real examples of Saccharomyces cerevisiae. MotifExpress is available at http://www.stat.illinois.edu/~pingma/MotifExpress.htm.
INTRODUCTION
Transcription factors (TFs) regulate the expression of target genes by binding in a DNA sequence-specific manner to their recognition sites in the promoter regions of these genes. The common pattern of the binding sites for a particular TF is called a TF-binding motif (TFBM), usually modeled by a position-specific weight matrix (PWM). Discovery of TF-binding sites (TFBSs) and TFBMs in TF–DNA interaction is essential for understanding the regulatory circuits that control cellular programs. In recent years, considerable progress has been made in developing both experimental and computational methods for elucidating TFBSs, and the mapping of their locations in a number of model organisms. Experimental techniques such as ChIP-chip (1) on promoter microarrays and whole genome tiling arrays and ChIP-seq (2) have been used to discover genome-wide TF–DNA-binding sites for organisms ranging from Saccharomyces cerevisiae (3) to Homo sapiens (4). Nonetheless, these experimental techniques are laborious and expensive, and require specialized antibodies which may be difficult to obtain (5). As a given binding site is not necessarily occupied under all conditions (6), a single set of ChIP-chip/ChIP-seq experiments conducted under one experimental condition is insufficient to fully detect all sites to which a TF may bind to in another experimental condition. Because of these limitations, computational methods provide appealing alternatives for pinning down TFBSs. De novo motif discovery algorithms based on probability models using PWMs, such as AlignACE (7), MDscan (8), MEME (9) and Weeder (10) have been accepted as important components of the computational biologist's toolkit. Moreover, rapid progress has been made to detect cis-regulatory modules which consist of highly coordinated TFBMs (11,12).
A recent trend to improve the aforementioned computational methods is to integrate information from relatively inexpensive and easily obtained gene expression data. The key idea to facilitate motif discovery using gene expression is that a gene's mRNA copy number is associated with active TFBMs’ matching scores (or more intuitively, number of TFBM copies) in the promoter region of this gene. A number of attempts have been made along this line of thinking. For example, REDUCE (13) uses an exhaustive oligo-enumeration strategy to identify a potential set of candidate motifs, then ‘reduces’ this candidate set to a set of active motifs whose binding was best correlated with gene expression. As an improvement over REDUCE, Motif Regressor (14), incorporates gene expression in the initial identification of candidate motifs; the top-ranking genes in a single sample microarray experiment are used to identify an initial set of candidate motifs by MDscan (8). This candidate list is then winnowed using stepwise regression with genome-wide gene expression serving as the response in a multiple regression model, resulting in a subset of motifs that are best correlated with gene expression across the genome.
These two approaches have stimulated many further studies in the past several years (15), and have generated a number of interesting results (16). However, several issues remain that hinder their effective application in real practice. Since they rely on a single sample microarray measurement to carry out ranking and regression, they are sensitive to experimental and biological noise, especially in regards to low copy-number genes. Consequently, they may select different sets of motifs depending which single sample of microarray experiment is used in regression, requiring time-consuming manual merging and validation of the selected sets of motifs. Additionally, the stepwise motif selection in Motif Regressor relies on adding/deleting one motif at a time, a technique which is highly unstable and can only explore a small portion of all the possible models as the number of candidate motifs is usually hundreds (17).
To overcome these obstacles, we propose MotifExpress, a novel method that selects a set of motifs that best correlate with multiple samples of gene expression measured by microarrays simultaneously. We utilize multivariate regression to link gene expression (as responses) and candidate motifs (as predictors) together. In the multivariate regression framework, the selection of active motifs is very challenging as the number of parameters is much larger than the number of motifs. Thus we have a huge space to search for the globally optimal model which gives rise to the set of active motifs. To surmount this challenge, we fit a model using a composite absolute penalty (CAP). Unlike the stepwise regression procedure, the CAP procedure selects motifs via a convex optimization and can effectively find the globally optimal set of active motifs. We use the Bayesian information criterion (BIC) to select the regularization parameter. We demonstrate the excellent performance of MotifExpress by applying it to synthetic data as well as GCN2 constitutive activation and heat shock experiments in Saccharomyces cerevisiae. It is evident from these results that incorporating multiple samples of gene expression substantially reduced the number of spurious results.
MATERIALS AND METHODS
Microarray and sequence data
Microarray data was retrieved from Gene Expression Omnibus (GEO) database and log2 base transformed. Missing values were estimated using k-nearest-neighbor imputation (18), implemented in the R (19) impute package. The upstream 800-bp sequence for each gene was used, with repetitive sequences masked using RepeatMasker (20).
MotifExpress—framework
First, significance analysis of microarrays (SAM) (21), a microarray analysis algorithm, is used to identify genes that are differentially expressed between the treatment and control conditions. The upstream promoter sequences of significantly differentially expressed genes are then used as input in a de novo motif discovery algorithm (MDscan) to search for candidate motifs. The upstream promoter sequences of all genes for which expression was measured are then scored for matches to each candidate motif; our MotifExpress algorithm then uses multivariate regression to link gene expression in all samples with the motif matching scores of all candidate motifs. The active motifs that are significantly associated with gene expression are identified using a composite absolute penalty approach with the regularization parameter selected through minimizing BIC (22) (Figure 1).
Figure 1.

MotifExpress system diagram.
MotifExpress—motif discovery
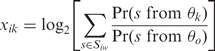
SAM (21) analysis is run on the gene expression profiles to determine which genes are differentially expressed between treatment and control conditions at a pre-specified false discovery rate. MDscan (8) is then run on the upstream promoter sequences of the significantly differentially expressed genes to discover motifs ranging from 7 to 15 bp in width. The 30 most significant motifs for each motif width are combined to form a set of candidate motifs. We then calculate the motif matching score xik which indicates how likely motif k binds upstream of gene i in terms of both goodness of matching and number of sites as defined in Conlon et al. (14).
 |
1 |
where k = 1, … , p, and p is the total number of candidate motifs, θk is the probability matrix of motif k of width w, θ0 is the third-order Markov model learned from intergenic sequences, and Siw is the set of all w-mers in the upstream of gene i.
MotifExpress—integration of gene expression with motif selection
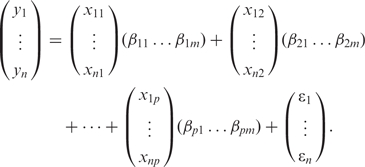
The gene expression profile of gene i is denoted as yi = (yi1 , yi2, …, yim) where yij is the expression ratio in sample j for gene i, and m is the number of samples. Motif discovery further associates expression of gene i with all candidate motifs’ matching scores xik, k = 1, … , p. We assume a multivariate regression model between expression y and motif matching scores x
| 2 |
where random errors ɛij are independently and identically distributed with mean zero and standard deviation σε, and βkj is the unknown coefficient which relates the expression of gene i to the motifs that putatively regulate it. We may write Equation (2) as
 |
3 |
Note that for any motif k, if βk1 = … =βkm = 0, then motif k is not associated with gene expression. We thus infer that motif k is not active in the biological conditions under which gene expression was measured. Otherwise, motif k is inferred to be active. Identifying active motifs thus becomes a variable selection problem in Equation (3).
MotifExpress—motif selection using penalized multivariate regression with CAP
By combining regression with variable selection, it is possible to select a set of active motifs which is significantly associated with gene expression. Classically, stepwise regression is used for variable selection; however, it is sensitive to perturbation of the data and can only explore a small portion of all the possible models as the number of candidate motifs is usually hundreds.
Lasso (23) has recently received significant attention as an efficient variable selection method.
Lasso estimates the coefficients of predictors through minimizes the following expression
| 4 |
where the residual sum of squares (RSS) and the sum of Absolute values of coefficients are two conflicting measures: the model with a smaller residual sum of squares tends to have more nonzero coefficients, which in turn results in a higher sum of absolute values of coefficients. λ is a regularization parameter controlling the trade-off between these two goals. Compared to a solution that minimizes only the residual sum of squares, i.e. the least squares estimate, the estimated coefficients in Lasso are closer to zero, which is referred to as ‘shrinking’. It has been shown that the Lasso can select predictors consistently, i.e. selecting correct predictors with probability one asymptotically, by shrinking the coefficients of the insignificant predictors to zero. However, Lasso was developed for regression with a single response rather than that with multivariate responses as in Equation (2). Moreover, we are interested in eliminating any inactive motif in Equation (2), which requires simultaneously shrinking all m coefficients corresponding to that motif to zero, rather than shrinking an individual coefficient. Recently, the simultaneous variable selection (23) and group Lasso (24,25) methods have been developed for selecting groups of variables. These methods have been nicely summarized in a unified shrinkage method, the composite absolute penalty (CAP) approach (25). We apply the idea of a composite absolute penalty to a multivariate regression model in Equation (2).
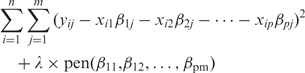
Our estimate is defined as the minimizer of:
 |
5 |
where λ is a regularization parameter. The composite absolute penalty uses a combination of various metrics to achieve the objective of group predictor selection. One possible choice of penalty to achieve this goal is  , which reduces to the group Lasso penalty. However, the computation of group Lasso relies on a shooting algorithm, and the cost of computation is very high (24). We instead elected to use the following CAP:
| 6 |
which is the penalty used in (23). For each motif, the corresponding m coefficients are grouped through their maximum absolute values. As λ is increased, the group of motif coefficients β shrink simultaneously; a motif whose group of coefficients have shrunk to zero falls out of the model.
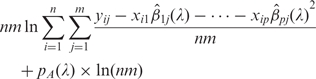
Since minimizing Equation (5) is a convex optimization problem, a solution satisfying the Karush-Kuhn–Tucker conditions is a global minimum (26,27). A beneficial feature of the proposed method Equation (5) with penalty Equation (6) is that the solution has a piecewise linear solution path for all values of λ. We adopt the homotopy algorithm (28,29), also known as the LARS/Lasso algorithm (30) to find the solutions for all values of λ. Even though the solution path for all values of λ can be effectively computed, it is still highly desirable that one solution is given for a fine-tuned value of λ. To choose a value of λ with a good balance of goodness-of-fit of the model and model parsimony, we minimize the BIC (22),
 |
7 |
where 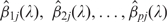 are CAP estimates of β1j, β2j, … , βpj, pA(λ) is the number of estimated active motifs, i.e. nonzero coefficients, and they all depend on λ. Since the solution path is piecewise linear, the smallest BIC can be found by comparing Equation (7) for a number of λ values.
To test the significance of the selected motif, we calculate a pooled P-value for each selected motif by combining all P-values of corresponding m coefficients using Stouffer's method (31,32).
Functional annotation of discovered motifs
To verify identifications and further elucidate biological relationships, manual analysis and functional annotation was carried out on discovered motifs. Results were validated where possible by comparison to known TF-binding sites by ChIPCodis (33). Discovered motifs were further putatively identified by Tomtom (34) against the MacIsaac et al. yeast TFBM dataset (3) as well as additional STAMP (35) comparison to the common ribosome-associated RRPE and PAC motifs (36).
RESULTS
Simulation results
Extensive simulations were carried out to examine the effectiveness of MotifExpress in identifying active motifs. We set number of genes, n = 5000, and number of the motif candidates as 100, among which 10 motifs were active. We generated motif scores xik from N(0, 1) and random error from N(0, σε). We gradually increased the standard deviation of random error from σε = 1 to 5. Gene expression was generated as the summation of linear combinations of the active motif scores and random error as in Equation (2). We let m = 3, 4, 5. We generated 100 datasets for each setting, i.e. each combination of σε and m. The Matthews correlation coefficient (MCC) (37), was calculated for each dataset, where a value of 1 indicates perfect selection of active motifs and rejection of spurious motifs, while a value of 0 is average random selection.
The summary statistics of the resulting MCCs are given in Table 1. It can be seen that our proposed method consistently performs very well across all settings. Since AIC with second order correction (AICc) was also suggested as an alternative criterion to choose the regularization parameter, we tested the performance of our proposed method using AICc. MotifExpress with BIC-minimization consistently outperformed that with AICc-minimization; average MCCs were significantly higher across all simulation regimes. MotifExpress with AICc was observed to identify more motifs spuriously; its performance was robust as σε increased, but had a lower MCC throughout the settings (Figure 2). In comparison, the performance of MotifExpress with BIC did degrade as σε increased, but still had much higher MCC as we see in Figure 2. We also ran Motif Regressor one-response-at-a-time and combined the identified motifs.
Table 1.
Mean (Ave.) and standard deviation (SD) of MCC for MotifExpress with regularization parameters selected through AICc-minimization and BIC-minimization as the random error's standard deviation σε and the number of samples m are varied in the simulation study
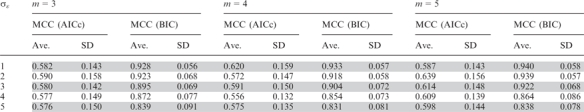 |
Figure 2.

Summary plot of MCC for Motif Regressor (MR) and MotifExpress with regularization parameters selected through AICc-minimization and BIC-minimization as the random error's standard deviation σε and the number of samples m are varied in the simulation study. Motif Regressor performance in the same simulation was computed by pooling results from independent runs.
The mean MCCs of Motif Regressor are consistently higher than those of MotifExpress with AICc-minimization, but lower than those of MotifExpress with BIC-minimization. Moreover, as number of response m increase, we notice that the MCC of Motif Regressor drops since the number of false discovery goes up (Figure 2).
GCN2 constitutive activation analysis
The protein kinase GCN2 has drawn attention in recent years due to its extensive regulatory impact. The Gcn2p homodimer associates with the large ribosome subunit in the cytosol, and when activated, phosphorylates Ser-52 of eIF2α (38). In yeast, this has two immediate effects; firstly, the repression of general translation by sequestration of eIF2β, and secondly the derepression of GCN4 translation. Gcn4p then acts as a TF that modulates the expression of numerous stress- and starvation-related genes (39). Gcn2p may be activated by numerous signals via multiple pathways, including the drug rapamycin (40).
We elected to use constitutively active Gcn2 as a means of validating our method. As active Gcn2p results in Gcn4p activation, consequentially leading to an activation of downstream genes, it follows that the presence of the GCN4 motif should be strongly correlated with gene expression under the condition of constitutively active Gcn2p. A four-sample dataset of cDNA microarrays, which hybridized four biological replicates of GCN2c constitutively active mutant samples to a common reference wild-type sample, was retrieved from GEO (GSE8111) (41). The data is the log transformed gene expression ratios between mutant and wild-type, and was used by MotifExpress as the response to fit multivariate regression model. Three motifs were selected by MotifExpress, identified by STAMP as GCN4, PAC and RAP1.
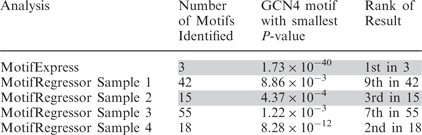
The results obtained by MotifExpress were compared with those obtained by running Motif Regressor (14) separately on each sample. In contrast to three motifs discovered by MotifExpress, Motif Regressor discovered 130 motifs. For Motif Regressor running on each sample, the smallest P-value of the motifs identified by STAMP (35) as GCN4 and the highest rank of the GCN4 motifs sorted by P-values in the result is reported in Table 2. MotifExpress analysis resulted in a parsimonious set of results, where the GCN4 motif had the lowest P-value and ranked first, while analyzing individual samples in the dataset by Motif Regressor yielded highly heterogeneous results. The P-value was much lower in the MotifExpress results than in any of the Motif Regressor results.
Table 2.
GCN4 motif discovery on constitutively activated Gcn2 mutant dataset by MotifExpress on all samples simultaneously and by Motif Regressor, on each sample individually
 |
The presence of the PAC and RAP1 motifs is likewise unsurprising; the RP regulon (strongly associated with the RAP1 motif) and the RRB regulon (strongly associated with the PAC motif) (42) are both known to be repressed by treatment with rapamycin, which is also known to induce Gcn4p synthesis (40). The GSE8111 dataset shows a transcription profile quite similar to rapamycin treatment, with the RRB and RP genes downregulated, and amino-acid biogenesis genes upregulated. Analysis of genes used for motif discovery via ChIPCODIS revealed a significant overrepresentation of genes to which Gcn4p binds under rapamycin treatment, with a pooled P-value of 1.56 × 10⁻¹⁸.
Heat shock analysis
The heat shock response is a conserved and concerted cellular program in eukaryotes. Temperature changes above the physiological optimum induce the synthesis of heat shock proteins, a diverse class of proteins that have effects on protein folding, metabolism and antioxidant response. Expression of the genes coding for these proteins is regulated by a set of stress-related TFs, most importantly Hsf1p and Msn2/4p.
A three-sample dataset of cDNA microarrays, comparing wild-type cells in midlog-phase grown at 30°C to wild-type cells heat-shocked at 39°C for 15 min, was downloaded from GEO (GSE7665) (43). The data was the log-transformed gene expression ratios between heat shock and control conditions, and was used by MotifExpress as the response to fit a multivariate regression model. A set of 15 active motifs was selected by MotifExpress, among them HSF1, RPH1, MSN2/4, SFP1, FHL1 and PAC; of these, the HSF1 motif was the most significant, with a pooled P-value of 7.8 × 10−37. In contrast, Motif Regressor discovered 113 motifs, many of which were redundant.
It is known that many of the genes regulated by Hsf1p encode chaperones, proteins responsible for inducing and maintaining protein conformation and preventing unwanted protein aggregation, such as HSP82 (44). It would be expected that cells undergoing heat shock would experience an up-regulation of genes regulated by Hsf1p and Msn2/4p; analysis by MotifExpress analysis demonstrates the detection of this response. The PAC motif, as mentioned in the previous example, is a signature of the RRB regulon, which is down-regulated under heat shock conditions (45). The genes in the dataset were confirmed to be significantly overrepresented for Hsf1p, Msn2/4p, Fhlp, and Sfp1p binding under stress conditions by ChIPCODIS (P-values ranging from 8.82 × 10−62 to 3.63 × 10⁻¹⁸).
It is interesting to note that the HSF1 motif is known to consist of repeats of a 5-bp consensus sequence 5′-NGAAN-3′ and its reverse complement 5′-NTTCN-3′ (46). In Figure 3, we plotted the motif logos of the most significant HSF1 motifs discovered by MotifExpress, by Motif Regressor via analyzing each sample independently, and that discovered using ChIP-chip and phylogentic methods in MacIsaac et al. (3). The HSF1 motif discovered by MotifExpress is the closest to the consensus sequence reported in (46) among the five motifs (Figure 3).
Figure 3.

HSF1-binding motif discovered by MotifExpress analyzing all samples in in GSE7665 simultaneously compared to MotifRegressor analyzing each sample individually and current literature. The head-to-head inverted NGAAN motif is prominent in the MotifExpress results.
DISCUSSION
In this article, we developed a novel method, MotifExpress, for identifying TFBMs strongly associated with multiple samples of gene expression. Existing methods for identifying TFBMs correlate sequence information to a single sample of gene expression, one sample at a time, which results in a redundant set of active motifs with many spurious results (47). Additionally, existing methods rely on classical variable selection techniques such as stepwise regression, which is highly unstable and can only explore a small portion of all the possible models as the number of candidate motifs is usually in the hundreds. Our method is designed to integrate multiple samples of gene expression via multivariate regression. Using the CAP approach and selecting the regularization parameter using BIC, we can effectively identify a parsimonious set of active motifs. We examined the performance of MotifExpress using synthetic data under an array of settings with different numbers of samples and various variance magnitudes of random error. MotifExpress performed consistently well throughout all settings. We then analyzed two real experiments using MotifExpress, identifying active motifs correlated with expression. The set of discovered motifs agreed well with current literature.
The MotifExpress framework is easily extensible to support other TF–DNA-binding discovery methods, especially cis-regulatory module discovery methods. Statistically, penalized multivariate regression with CAP is ready to incorporate additional structural information about motifs. Likewise, as high-throughput transcriptomic studies transition from hybridization-based microarrays to rapid whole-transcriptome sequencing, this new data is easily integrated in MotifExpress.
Aside from motif selection, another challenge is to identify the regulatory targets of a TF. In principle, given the motifs (including promoter sequence) and estimated coefficients, we can predict gene expression. Then the genes with significant high or low expressions could be considered as potential regulatory targets. However, such prediction in practice typically has too large prediction uncertainty to be used for identifying regulatory targets. A possible alternative is to build a prediction model with gene cluster membership as the response, e.g. Beer and Tavazoie (48). The variable selection method that we employed in this article can be adapted to that model.
FUNDING
National Science Foundation [DMS-0800631]. Funding for open access charge: National Science Foundation DMS-0800631.
Conflict of interest statement. None declared.
ACKNOWLEDGEMENTS
The authors are grateful to X. Shirley Liu and Berwin A. Turlach for access to their source code. Majority of the work was done while PM was visiting department of statistics at UC Berkeley. PM is very grateful to Peter Bickel for hosting the visit and having many stimulating discussions.
REFERENCES
- 1.Buck MJ, Lieb JD. ChIP-chip: considerations for the design, analysis, and application of genome-wide chromatin immunoprecipitation experiments. Genomics. 2004;83:349–360. doi: 10.1016/j.ygeno.2003.11.004. [DOI] [PubMed] [Google Scholar]
- 2.Johnson DS, Mortazavi A, Myers RM, Wold B. Genome-wide mapping of in vivo protein-DNA interactions. Science. 2007;316:1497–1502. doi: 10.1126/science.1141319. [DOI] [PubMed] [Google Scholar]
- 3.MacIsaac KD, Wang T, Gordon DB, Gifford DK, Stormo GD, Fraenkel E. An improved map of conserved regulatory sites for Saccharomyces cerevisiae. BMC Bioinformatics. 2006;7:113. doi: 10.1186/1471-2105-7-113. [DOI] [PMC free article] [PubMed] [Google Scholar]
- 4.Wei C-L, Wu Q, Vega VB, Chiu KP, Ng P, Zhang T, Shahab A, Yong HC, Fu Y, Weng Z, et al. A global map of p53 transcription-factor binding sites in the human genome. Cell. 2006;124:207–219. doi: 10.1016/j.cell.2005.10.043. [DOI] [PubMed] [Google Scholar]
- 5.Wu J, Smith LT, Plass C, Huang TH. ChIP-chip comes of age for genome-wide functional analysis. Cancer Res. 2006;66:6899–6902. doi: 10.1158/0008-5472.CAN-06-0276. [DOI] [PubMed] [Google Scholar]
- 6.Harbison CT, Gordon DB, Lee TI, Rinaldi NJ, Macisaac KD, Danford TW, Hannett NM, Tagne J-B, Pokholok DK, Kellis M, et al. Transcriptional regulatory code of a eukaryotic genome. Nature. 2004;431:99–104. doi: 10.1038/nature02800. [DOI] [PMC free article] [PubMed] [Google Scholar]
- 7.Hughes JD, Estep PW, Tavazoie S, Church GM. Computational identification of Cis-regulatory elements associated with groups of functionally related genes in Saccharomyces cerevisiae. J. Mol. Biol. 2000;296:1205–1214. doi: 10.1006/jmbi.2000.3519. [DOI] [PubMed] [Google Scholar]
- 8.Liu XS, Brutlag DL, Liu JS. An algorithm for finding protein-DNA binding sites with applications to chromatin-immunoprecipitation microarray experiments. Nature Biotechnol. 2002;20:835–839. doi: 10.1038/nbt717. [DOI] [PubMed] [Google Scholar]
- 9.Bailey T, Elkan C. Fitting a mixture model by expectation maximization to discover motifs in biopolymers. Proc. Sec. Int. Conf. Intell. Sys. Mol. Biol. 1994:28–36. [PubMed] [Google Scholar]
- 10.Pavesi G, Mereghetti P, Mauri G, Pesole G. Weeder Web: discovery of transcription factor binding sites in a set of sequences from co-regulated genes. Nucleic Acids Res. 2004;32:W199–W203. doi: 10.1093/nar/gkh465. [DOI] [PMC free article] [PubMed] [Google Scholar]
- 11.Zhou Q, Wong WH. CisModule: de novo discovery of cis-regulatory modules by hierarchical mixture modeling. Proc. Natl Acad. Sci. USA. 2004;101:12114–12119. doi: 10.1073/pnas.0402858101. [DOI] [PMC free article] [PubMed] [Google Scholar]
- 12.Gupta M, Liu JS. De novo cis-regulatory module elicitation for eukaryotic genomes. Proc. Natl Acad. Sci. USA. 2005;102:7079–7084. doi: 10.1073/pnas.0408743102. [DOI] [PMC free article] [PubMed] [Google Scholar]
- 13.Roven C, Bussemaker HJ. REDUCE: An online tool for inferring cis-regulatory elements and transcriptional module activities from microarray data. Nucleic Acids Res. 2003;31:3487–3490. doi: 10.1093/nar/gkg630. [DOI] [PMC free article] [PubMed] [Google Scholar]
- 14.Conlon EM, Liu XS, Lieb JD, Liu JS. Integrating regulatory motif discovery and genome-wide expression analysis. Proc. Natl Acad. Sci. USA. 2003;100:3339–3344. doi: 10.1073/pnas.0630591100. [DOI] [PMC free article] [PubMed] [Google Scholar]
- 15.Das D, Pellegrini M, Gray JW. A primer on regression methods for decoding cis-regulatory logic. PLoS Comput. Biol. 2009;5 doi: 10.1371/journal.pcbi.1000269. e1000269. [DOI] [PMC free article] [PubMed] [Google Scholar]
- 16.Ben-Yehuda S, Fujita M, Liu XS, Gorbatyuk B, Skoko D, Yan J, Marko JF, Liu JS, Eichenberger P, Rudner DZ, et al. Defining a centromere-like element in Bacillus subtilis by Identifying the binding sites for the chromosome-anchoring protein RacA. Mol. Cell. 2005;17:773–782. doi: 10.1016/j.molcel.2005.02.023. [DOI] [PubMed] [Google Scholar]
- 17.Breiman L. Heuristics of instability and stabilization in model selection. Ann. Stat. 1996;24:2350–2383. [Google Scholar]
- 18.Troyanskaya O, Cantor M, Sherlock G, Brown P, Hastie T, Tibshirani R, Botstein D, Altman RB. Missing value estimation methods for DNA microarrays. Bioinformatics. 2001;17:520–525. doi: 10.1093/bioinformatics/17.6.520. [DOI] [PubMed] [Google Scholar]
- 19.R Development Core Team. R Foundation for Statistical Computing. Vienna, Austria: 2008. [Google Scholar]
- 20.Smit AFA, Hubley R, Green P. RepeatMaster Open-3.0. 1996–2004. [Google Scholar]
- 21.Tusher VG, Tibshirani R, Chu G. Significance analysis of microarrays applied to the ionizing radiation response. Proc. Natl Acad. Sci. USA. 2001;98:5116–5121. doi: 10.1073/pnas.091062498. [DOI] [PMC free article] [PubMed] [Google Scholar]
- 22.Schwarz G. Estimating the dimension of a model. Ann. Stat. 1978;6:461–464. [Google Scholar]
- 23.Tibshirani R. Regression shrinkage and selection via the Lasso. J. R. Stat. Soc. Ser. B (Method) 1996;58:267–288. [Google Scholar]
- 24.Yuan M, Lin Y. Model selection and estimation in regression with grouped variables. J. R. Stat. Soc. Ser. B (Method) 2006;68:49–67. [Google Scholar]
- 25.Zhao P, da Rocha GV, Yu B. The composite absolute penalties family for grouped and hierarchical variable selection. Ann. Stat. In Press [Google Scholar]
- 26.Karush W. Master's Thesis. Chicago, Illinois: University of Chicago; 1939. Minima of functions of several variables with inequalities as side constraints. [Google Scholar]
- 27.Kuhn HW, Tucker AW. Proceedings of the 2nd Berkeley Symposium on Mathematical Statistics and Probability. Berkeley, California: University of California Press; 1951. Nonlinear programming; pp. 481–492. [Google Scholar]
- 28.Turlach BA, Venables WN, Wright SJ. Simultaneous Variable Selection. Technometrics. 2005;47:349–363. [Google Scholar]
- 29.Osborne MR, Presnell B, Turlach BA. A new approach to variable selection in least squares problems. IMA J. Numerical Anal. 2000;20:389–403. [Google Scholar]
- 30.Efron B, Hastie T, Johnstone I, Tibshirani R. Least angle regression. Ann. Stat. 2004;32:407–451. [Google Scholar]
- 31.Burns P. In: Optimization, Econometric and Financial Analysis. Kontoghiorghes EJ, Gatu C, editors. Berlin: Springer; 2007. pp. 239–240. [Google Scholar]
- 32.Whitlock MC. Combining probability from independent tests: the weighted Z-method is superior to Fisher's approach. J. Evol. Biol. 2005;18:1368–1373. doi: 10.1111/j.1420-9101.2005.00917.x. [DOI] [PubMed] [Google Scholar]
- 33.Abascal F, Carmona-Saez P, Carazo JM, Pascual-Montano A. ChIPCodis: mining complex regulatory systems in yeast by concurrent enrichment analysis of chip-on-chip data. Bioinformatics. 2008;24:1208–1209. doi: 10.1093/bioinformatics/btn094. [DOI] [PubMed] [Google Scholar]
- 34.Gupta S, Stamatoyannopoulos JA, Bailey TL, Noble WS. Quantifying similarity between motifs. Genome Biol. 2007;8:R24. doi: 10.1186/gb-2007-8-2-r24. [DOI] [PMC free article] [PubMed] [Google Scholar]
- 35.Mahony S, Benos PV. STAMP: a web tool for exploring DNA-binding motif similarities. Nucleic Acids Res. 2007;35:W253–W258. doi: 10.1093/nar/gkm272. [DOI] [PMC free article] [PubMed] [Google Scholar]
- 36.Hughes JD, Estep PW, Tavazoie S, Church GM. Computational identification of cis-regulatory elements associated with groups of functionally related genes in Saccharomyces cerevisiae. J. Mol. Biol. 2000;296:1205–1214. doi: 10.1006/jmbi.2000.3519. [DOI] [PubMed] [Google Scholar]
- 37.Matthews BW. Comparison of the predicted and observed secondary structure of T4 phage lysozyme. Biochim. Biophys. Acta. 1975;405:442–451. doi: 10.1016/0005-2795(75)90109-9. [DOI] [PubMed] [Google Scholar]
- 38.Padyana AK, Qiu H, Roll-Mecak A, Hinnebusch AG, Burley SK. Structural basis for autoinhibition and mutational activation of eukaryotic initiation factor 2alpha protein kinase GCN2. J. Biol. Chem. 2005;280:29289–29299. doi: 10.1074/jbc.M504096200. [DOI] [PubMed] [Google Scholar]
- 39.Hinnebusch AG, Natarajan K. Gcn4p, a master regulator of gene expression, is controlled at multiple levels by diverse signals of starvation and stress. Eukaryot. Cell. 2002;1:22–32. doi: 10.1128/EC.01.1.22-32.2002. [DOI] [PMC free article] [PubMed] [Google Scholar]
- 40.Kubota H, Obata T, Ota K, Sasaki T, Ito T. Rapamycin-induced translational derepression of GCN4 mRNA involves a novel mechanism for activation of the eIF2 alpha kinase GCN2. J. Biol. Chem. 2003;278:20457–20460. doi: 10.1074/jbc.C300133200. [DOI] [PubMed] [Google Scholar]
- 41.Menacho-Marquez M, Perez-Valle J, Arino J, Gadea J, Murguia JR. Gcn2p regulates a G1/S cell cycle checkpoint in response to DNA damage. Cell Cycle. 2007;6:2302–2305. doi: 10.4161/cc.6.18.4668. [DOI] [PubMed] [Google Scholar]
- 42.Wade CH, Umbarger MA, McAlear MA. The budding yeast rRNA and ribosome biosynthesis (RRB) regulon contains over 200 genes. Yeast. 2006;23:293–306. doi: 10.1002/yea.1353. [DOI] [PubMed] [Google Scholar]
- 43.Shivaswamy S, Iyer VR. Stress-dependent dynamics of global chromatin remodeling in yeast: dual role for SWI/SNF in the heat shock stress response. Mol. Cell Biol. 2008;28:2221–2234. doi: 10.1128/MCB.01659-07. [DOI] [PMC free article] [PubMed] [Google Scholar]
- 44.Lindquist S, Craig EA. The heat-shock proteins. Annu. Rev. Genet. 1988;22:631–677. doi: 10.1146/annurev.ge.22.120188.003215. [DOI] [PubMed] [Google Scholar]
- 45.Warner JR. The economics of ribosome biosynthesis in yeast. Trends Biochem. Sci. 1999;24:437–440. doi: 10.1016/s0968-0004(99)01460-7. [DOI] [PubMed] [Google Scholar]
- 46.Bonner JJ, Ballou C, Fackenthal DL. Interactions between DNA-bound trimers of the yeast heat shock factor. Mol. Cell Biol. 1994;14:501–508. doi: 10.1128/mcb.14.1.501. [DOI] [PMC free article] [PubMed] [Google Scholar]
- 47.Foat BC, Houshmandi SS, Olivas WM, Bussemaker HJ. Profiling condition-specific, genome-wide regulation of mRNA stability in yeast. Proc. Natl Acad. Sci. USA. 2005;102:17675–17680. doi: 10.1073/pnas.0503803102. [DOI] [PMC free article] [PubMed] [Google Scholar]
- 48.Beer MA, Tavazoie S. Predicting gene expression from sequence. Cell. 2004;117:185–198. doi: 10.1016/s0092-8674(04)00304-6. [DOI] [PubMed] [Google Scholar]