Abstract
Manual state scoring of physiological recordings in sleep studies is time-consuming, resulting in a data backlog, research delays and increased personnel costs. We developed MATLAB-based software to automate scoring of sleep/waking states in rats, potentially extendable to other animals, from a variety of recording systems. The software contains two programs, Sleep Scorer and Auto-Scorer, for manual and automated scoring. Auto-Scorer is a logic-based program that displays power spectral densities of an electromyographic signal and σ, δ, and θ frequency bands of an electroencephalographic signal, along with the δ/θ ratio and σ ×θ, for every epoch. The user defines thresholds from the training file state definitions which the Auto-Scorer uses with logic to discriminate the state of every epoch in the file. Auto-Scorer was evaluated by comparing its output to manually scored files from 6 rats under 2 experimental conditions by 3 users. Each user generated a training file, set thresholds, and autoscored the 12 files into 4 states (waking, non-REM, transition-to-REM, and REM sleep) in ¼ the time required to manually score the file. Overall performance comparisons between Auto-Scorer and manual scoring resulted in a mean agreement of 80.24 +/− 7.87%, comparable to the average agreement among 3 manual scorers (83.03 +/− 4.00%). There was no significant difference between user-user and user-Auto-Scorer agreement ratios. These results support the use of our open-source Auto-Scorer, coupled with user review, to rapidly and accurately score sleep/waking states from rat recordings.
1. Introduction
In behavioral neuroscience research involving sleep, there is a need for automated state scoring to correctly identify how the experimental manipulations impact the state of the animal, including humans. Continuous recordings of physiological signals such as electroencephalography (EEG) and electromyography (EMG) over many hours result in large quantities of data to be analyzed. Sleep/waking states can be categorized on multiple levels starting with the discrimination that the animal is awake or asleep. These states can then be further divided based on user-defined features, e.g., sleep can be separated into REM (rapid eye movement) and non-REM sleep. While a standard exists for scoring sleep in humans (Rechtschaffen and Kales, 1968), the execution of that standard widely varies from person to person and from laboratory to laboratory. For example, researchers score the different sleep and waking states in epochs ranging from 1 s to 30 s (Gottesmann et al., 1977; Mistlberger et al., 1987). The case becomes even more heterogeneous for sleep state assessments in animal models (e.g., rat, mouse, or cat); the number of states as well as their characterization varies depending upon the aims of the research. In addition, the types of signals gathered to score those states, such as EEG and EMG, vary widely depending on the hypotheses and methods chosen, each for their own good reasons. Furthermore, manual state analysis is time-consuming and can result in a backlog of data causing delays in the research process.
Since the 1960s (Lubin et al., 1969), researchers have been developing automated scoring programs using logic-based algorithms with time or frequency domain parameters (Neuhaus and Borbely, 1978; van Luijtelaar and Coenen, 1984), pattern recognition algorithms (Martin et al., 1972), support vector machines (Crisler et al., 2007), or artificial neural networks (Grözinger et al., 2001; Mamelak et al., 1991; Robert et al., 2002; Robert et al., 1999, 1998; Robert et al., 1996; Roberts and Tarassenko, 1992; Schaltenbrand et al., 1996; Sinha, 2008). The literature suggests that artificial intelligence would be the best approach for accurately scoring sleep/waking states by being able to adapt to the varying scoring requirements of different researchers. However, a customizable logic-based autoscoring program is well-suited for a researcher who would like more control over the decision-making process for scoring states rather than exclusive reliance on the program. A researcher who has some experience programming can also gain control of, for example, the logic decision tree and data format.
Here, we describe software that can facilitate the scoring of behavioral states by automating the scoring process of EEG and EMG data. The program is MATLAB-based, open-sourced and accessible to those with minimal programming experience. It is also capable of accepting recorded data in a variety of formats, e.g., delimited text files, Excel files (Microsoft), proprietary files such as Neuralynx’s Cheetah files, binary files and ASCII format files.
2. Materials and methods
In this section, we present the software components with instructions on their use. Additionally, the logic used in the automatic scoring component is described and data analysis procedures defined. The Results section presents performance comparisons between manual and autoscoring of data from 12 experiments. Finally, Auto-Scorer is compared to published automated sleep/waking scoring systems, and its strengths and limitations are discussed.
2.1. Rat experiments
Data for software testing were taken from an experiment gathering signals during baseline sleep/waking conditions from rats and following REM deprivation as part of a separate study in our research group. Six adult male Fisher 344 rats (325–400g) were implanted with one EEG screw electrode in the skull above the left hemisphere of the frontal cortex and one over the parietal cortex of the right hemisphere, one nuchal EMG electrode, and a single electrode implanted into the hippocampal fissure of the left hemisphere. The two screw electrodes were referenced to each other, while the deep hippocampal electrode was referenced to a sinus ground. Rats were allowed 1 week to recover after surgery. Recordings were taken in freely-behaving rats using tethers (Plastics One, Roanoke, VA) connecting the head-cap to the data acquisition hardware. Signals were passed through a digital amplifier (Neuralynx, Tucson, AZ) and digitizing board (Neuralynx Cheetah EDT board) and recorded with a 1 kHz sampling rate for 8 hours. REM deprivation was accomplished using the multiple platform over water technique, originally developed by Jouvet and colleagues (Jouvet et al., 1964; Mendelson et al., 1974), for 24 hours. Food and water were freely accessible during these experiments.
2.2. Sleep Scorer program description
The graphical user interface (GUI)-based software includes two components. First, a program called Sleep Scorer enables the user to pre-score representative epochs of 5 different sleep/waking states (active waking (AW), quiet waking (QW), non-REM or quiet sleep (QS), transition-to-REM (TR), and REM sleep (REM)). The second component, Auto-Scorer, is used to visualize the representative epochs and set thresholds based on power spectrum densities of the EMG signal and σ (sigma), δ (delta), and θ (theta) frequency bands of the EEG signal and on the well-established measures of δ-θ ratio and the σ × θ product. A logic-based algorithm is then implemented within Auto-Scorer which scores all epochs of the record.
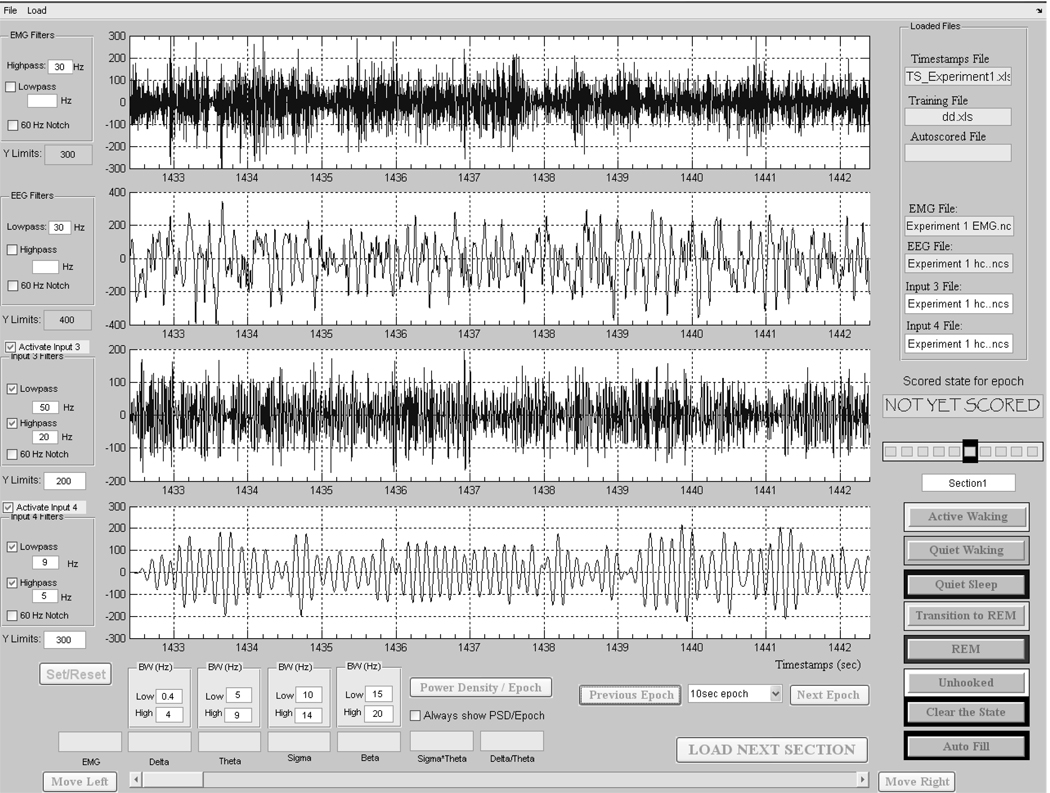
The Sleep Scorer program has high-pass, low-pass, and notch filters for up to four electrophysiological signals that the user can enable and define (GUI shown in Figure 1). For both manually scoring the data in Sleep Scorer and autoscoring with Auto-Scorer, the EMG signal was passed through a 30 Hz high-pass Cauer filter, and the EEG signals were passed through a 30Hz low-pass Cauer filter. Cauer (elliptic) filters were chosen since they are equiripple in the stop- and pass-bands (i.e., the filter waveform has the same small oscillations on both sides of the cut-off frequency) and provide sharper roll-off characteristics than Chebyshev and Butterworth filters. The signals were then down-sampled to 250 Hz (user-defined), which was more than sufficient to avoid aliasing (i.e., lacking the necessary number of data points to reconstruct the signal) the signals of interest. In addition, the values for the EMG power and the σ, δ, θ, and β bands of the EEG power spectral density (PSD) in the epoch currently in view is optionally displayed below the signal charts (Figure 1). The filter settings for σ, δ, θ, and β bands in the present experiments were 0.4–3.9 Hz, 4–9 Hz, 10–14 Hz, and 15–20 Hz, respectively. The filter settings and down-sampling value are automatically saved with the manually scored epochs and are read by the Auto-Scorer in order to process the signals in the same manner as done in Sleep Scorer before autoscoring.
Figure 1.
Sleep Scorer graphical user interface used for manually scoring and correcting files. The top 2 horizontal panels show example EMG and EEG signals, respectively. The third and fourth panels show the EEG signal in panel 2 using different filter ranges.
A history bar lets the user to see the scores for the 5 previous epochs and 4 subsequent epochs, allowing the user to evaluate or re-evaluate an epoch, in light of the flow of states (Figure 1). The user-selectable epoch length was chosen for demonstration purposes here to be 10 s for both manual and autoscoring—which is a typical epoch length for scoring sleep/waking states in rats (Benington et al., 1994; Ruigt et al., 1989a; Van Gelder et al., 1991; Witting et al., 1996). A longer epoch such as 30 s would lead to an underestimation of REM sleep since the average REM episode duration in a rat is approximately 120 s and is often as short as 10 or 20 s. A shorter duration epoch, such as 2 s, could bias results toward short duration episodes (Robert et al., 1999) which may or may not be physiologically meaningful. However, since users may desire to use different epoch lengths than 10 s for their own experimental aims, the program provides a drop-down menu to change the epoch length. The user must make sure to set the epoch length the same as that used to manually score the training file in Sleep Scorer.
2.3. Auto-Scorer program description
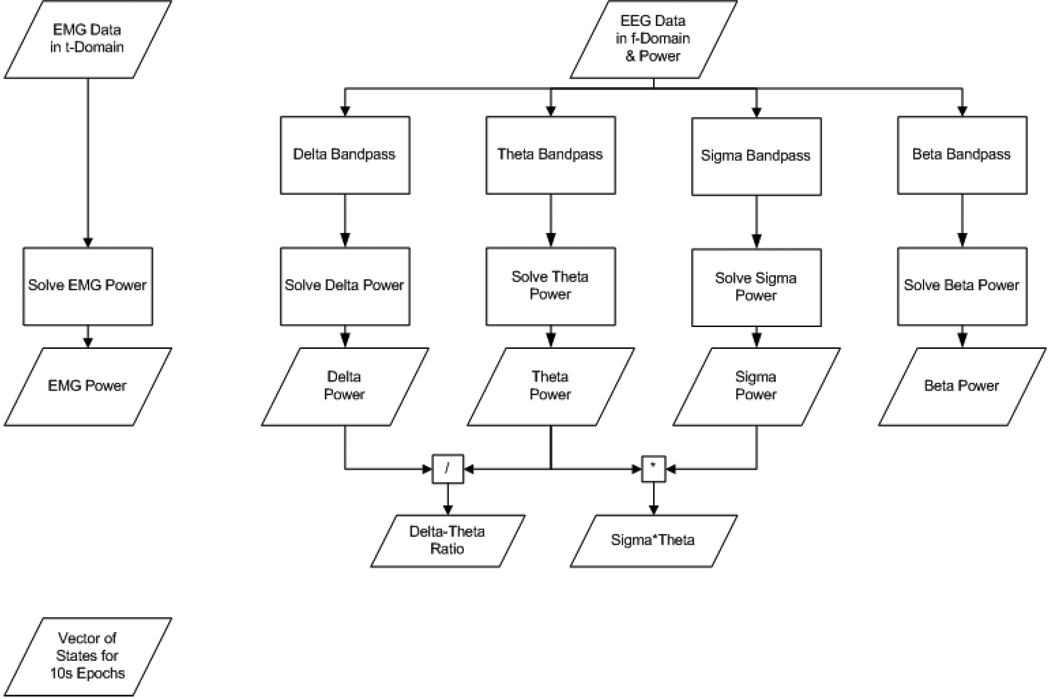
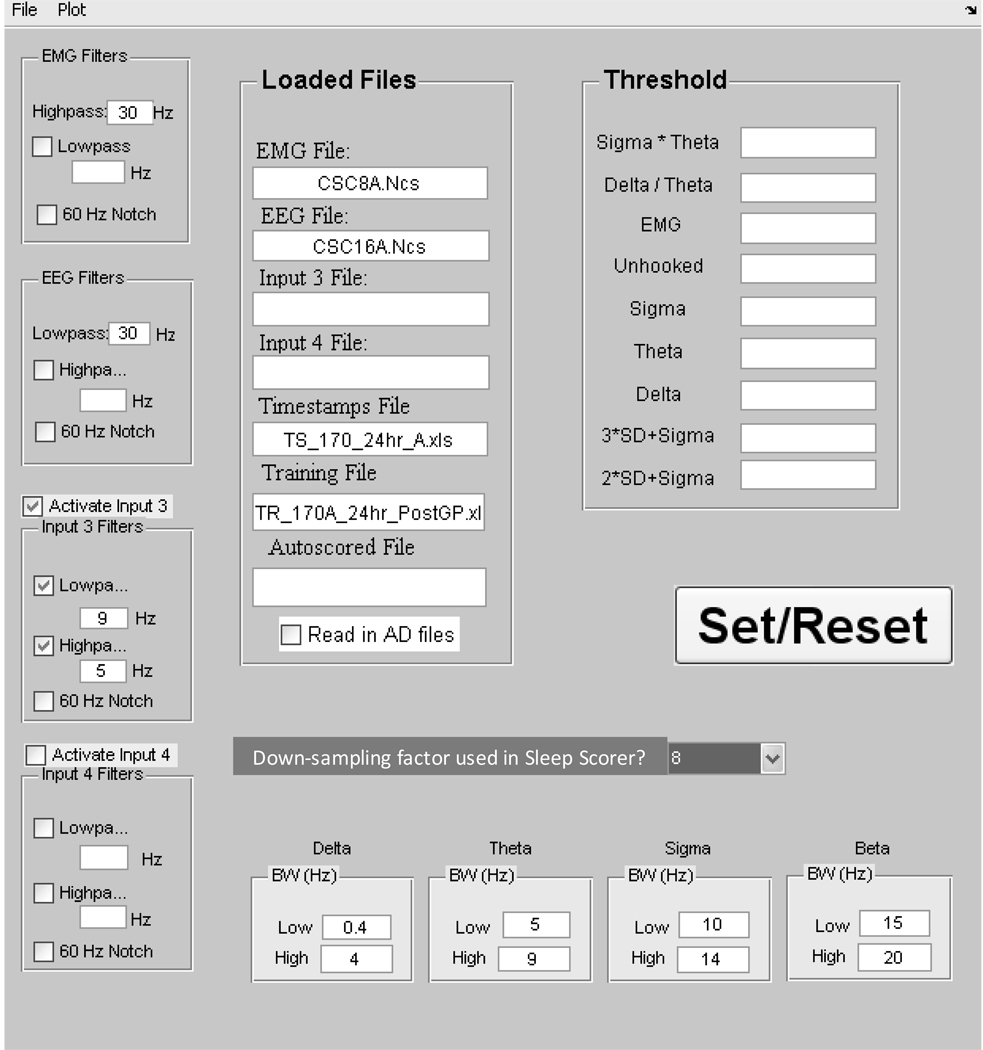
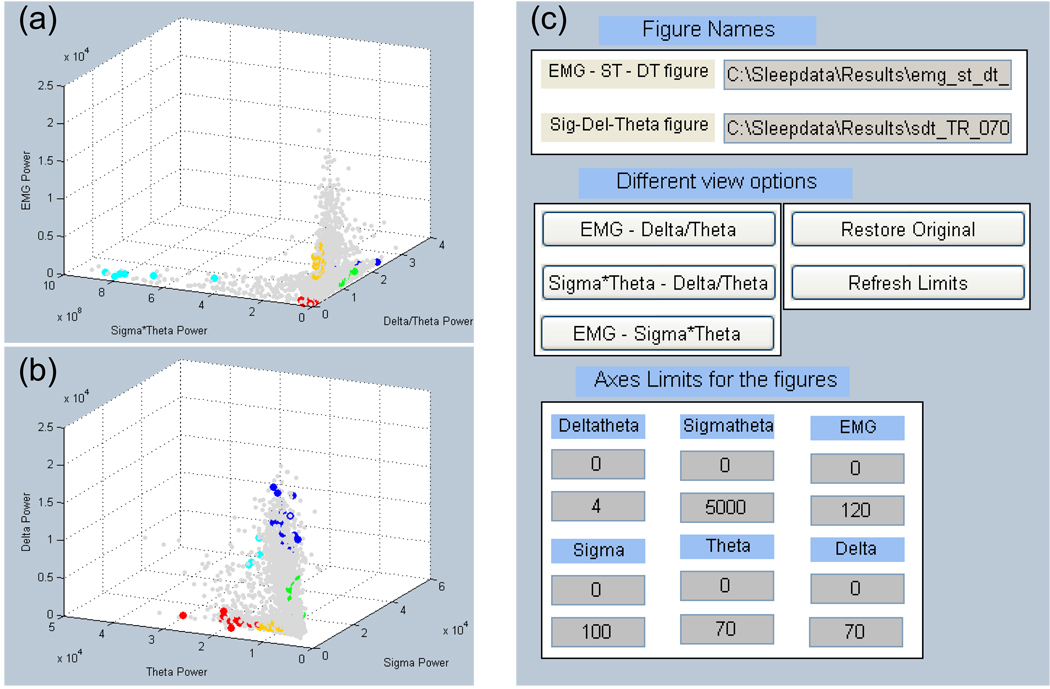
After manually scoring representative epochs of each of the 5 states, the training data (i.e., scored states and their PSD values—see Figure 2 for the process flow) are then loaded into Auto-Scorer (Figure 3), which displays two 3-D graphs and a GUI for manipulating them (Figure 4). The scored states of the epochs are distinguished using 5 distinct colors: yellow = AW, green = QW, blue = QS, turquoise = TR, and red = REM. In addition, the un-scored epochs are plotted in gray (Figure 4a–b and Figure 5a–f). The Auto-Scorer algorithm processes one EMG and one EEG signal, but it could be expanded to accept additional inputs by the user since it is open-sourced. For the performance evaluation presented here, we used the hippocampal EEG signal. The first graph shows EMG power versus δ-θ ratio versus σ × θ (Figure 4a). The PSDs of the σ, δ, and θ bands are displayed on the second graph (Figure 4b). The user then sets threshold values, based on the literature and as elucidated below, in order for the algorithm to distinguish the different states. The PSD values of the aforementioned parameters for all epochs of the record are stored in a file named by the user in a pop-up box.
Figure 2.
Process flow for data analysis prior to importing to Auto-Scorer.
Figure 3.
Main graphical user interface for the Auto-Scorer. Data files are loaded and thresholds are entered for auto-scoring.
Figure 4.
User interface for determining rule-based threshold settings and visualizing auto-scored states. (a) 3D graph of states for 10 s epochs based on EMG power, sigma power*theta power, and the ratio of delta power to theta power. (b) Epochs graphed by delta, theta, and sigma powers. (c) GUI for manipulating the graphs in (a) and (b). The scored states of the epochs are distinguished using 5 distinct colors: yellow = AW, green = QW, blue = QS, turquoise = TR, and red = RE. In addition, the unscored epochs for the recording are plotted as light gray dots.
Figure 5.
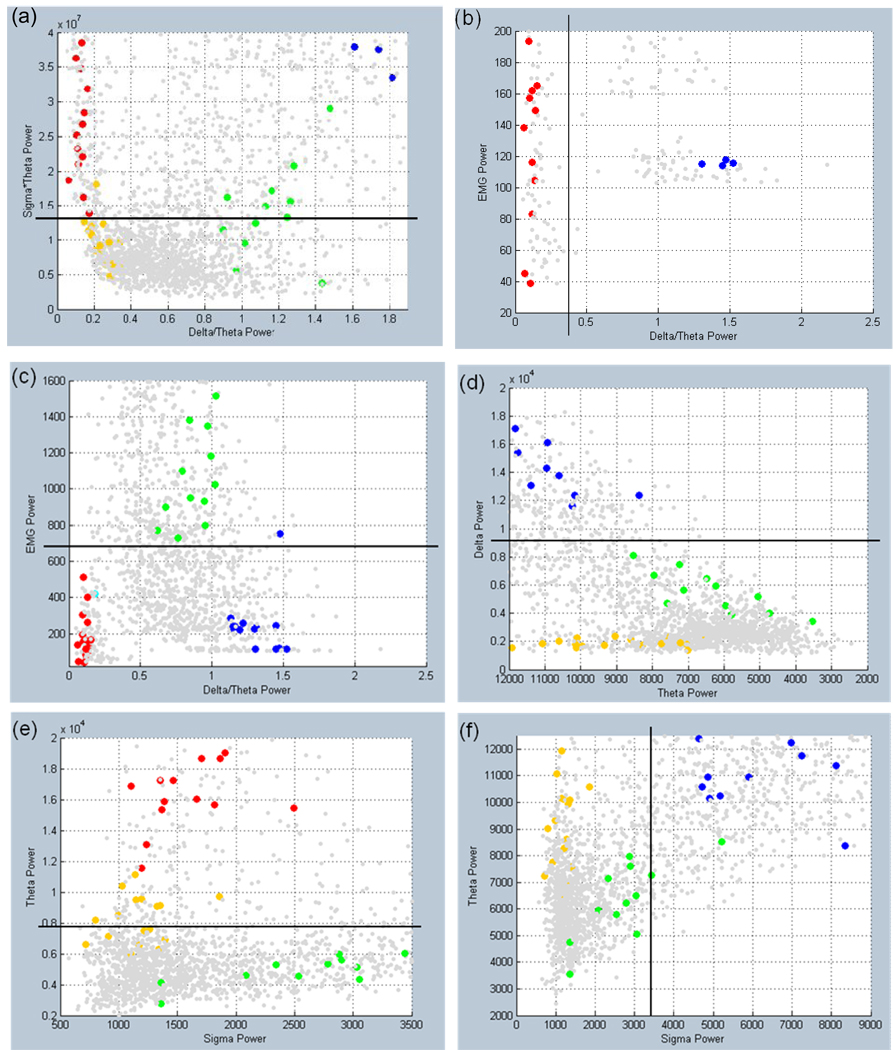
a–f Threshold settings illustrated by black lines on 2D graphs of a user’s training data set. All users followed the guidelines described in section 2.3. The scored states of the epochs are distinguished using 5 distinct colors: yellow = AW, green = QW, blue = QS, turquoise = TR, and red = RE. In addition, the as yet unscored epochs from the recording are plotted as light gray dots.
The guidelines used for setting the thresholds in our experiments are as follows. The σ × θ parameter is used to separate sleep states from waking states with the stipulation that all sleep epochs must have values above the threshold setting (Figure 5a). The δ/θ threshold is used to initially separate REM (below threshold) from Quiet Sleep, optimally setting the threshold above the unscored epochs that appear to form a cluster with REM while keeping most of the Transition-to-REM sleep above the threshold if possible (Figure 5b). As seen in Figure 5c, the EMG threshold is set to separate sleep from waking epochs while ignoring transition-to-REM states. The overall goal for setting the σ, δ, and θ thresholds is to identify and isolate Quiet Waking (Figure 5d–f): the δ threshold is set to separate Quiet Sleep (above threshold) from Quiet Waking (below threshold) with cutoff set closer to Quiet Waking (Figure 5d), the θ threshold is used to divide Quiet Waking from REM (above the bulk of Quiet Waking; Figure 5e). The σ threshold was set above the bulk of Quiet Waking (Figure 5f). The ‘Threshold’ settings box (Figure 3) also displays the ‘2 ×SD + σ’ and ‘3 × SD + σ’ (SD = standard deviation), automatically calculated when the training file is loaded into Auto-Scorer, and ‘Unhooked’ (set for most data files to 0.001 and used as an additional σ × θ threshold—see Figure 6).
Figure 6.
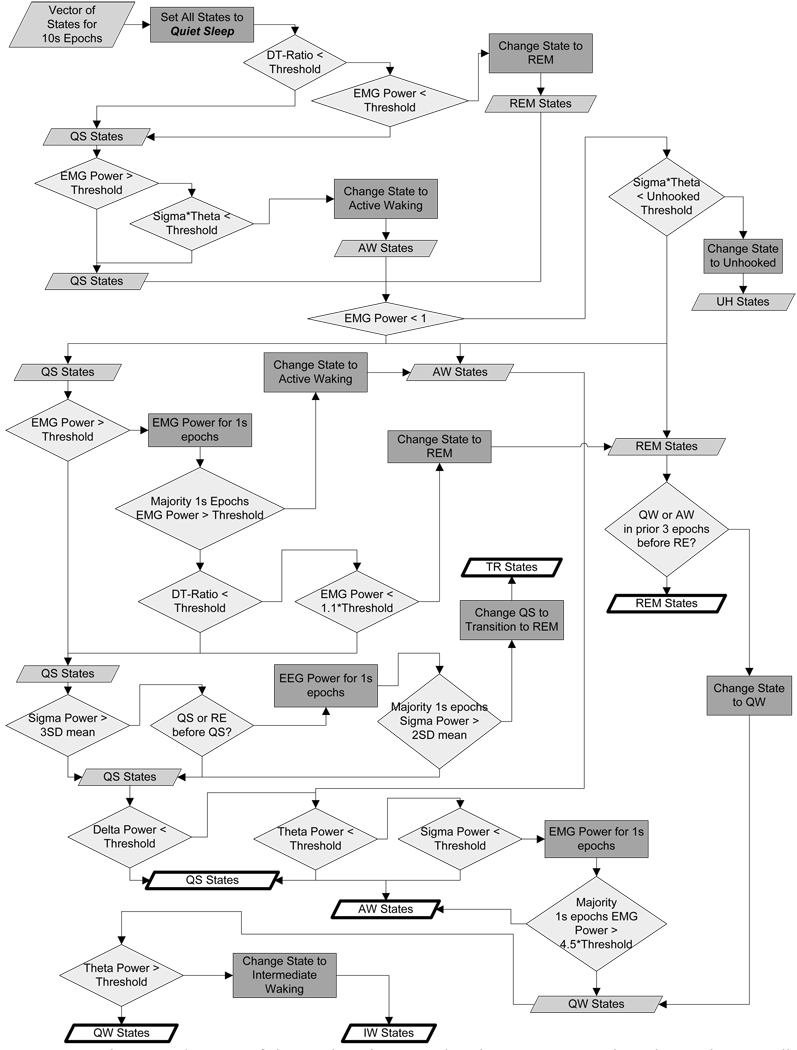
A schematic diagram of the Boolean logic used in the Auto-Scorer algorithm is shown. Filled parallelograms represent the assigned state for the 10 s epoch. Diamonds represent logical decisions with true/false passing out the right/bottom side of the diamond. Rectangles represent a step when the state was changed. Heavy outlined parallelograms represent final state assignment.
Once the threshold values have been set, Auto-Scorer then scores the entire data set of the recording under study. The auto-scoring software’s algorithm runs on power density input to Boolean logic (Figure 6). The logical decisions are based on previously published research and our scorers’ observations, and were implemented to improve the agreement between human scorers and the autoscoring software. An extra state labeled as intermediate waking was introduced into the algorithm to allow the user to score epochs that were not clearly determined to be Active or Quiet Waking. Out of the total amount of waking epochs scored, the average percent scored by Auto-Scorer as intermediate waking epochs was a mere 0.2%.
2.4. Data analysis
Auto-Scorer was evaluated by comparing its results to 12 fully scored files from 3 users and determining if its reliability was significantly different from that of user-to-user agreement. Each user generated auto-scored files by inputting their thresholds taken from the training data set. Each autoscored file was then compared to the user’s manually scored file. We chose the most widely used measure of performance for automated systems, percent agreement, to evaluate Auto-Scorer (Benington et al., 1994; Costa-Miserachs et al., 2003; Crisler et al., 2007; Ferri et al., 1989; Mamelak et al., 1991; Martin et al., 1972; Nielsen et al., 1997; Norman et al., 2000; Robert et al., 1996; Ruigt et al., 1989a; Ruigt et al., 1989b; Svetnik et al., 2007; Van Gelder et al., 1991; Witting et al., 1996). Active Waking and Quiet Waking were combined into one waking state for the final analysis for two reasons. First, the average pair-wise agreement among users for Quiet Waking was 40.4 +/− 16.9%—with the other user scoring the mismatched epoch most often as Active Waking. Second, waking is most often reported as one state in the literature.
A decision tracking system was implemented in order to determine where in the logic the final state was scored for each epoch. This enabled fine-tuning of the logic if weak decisions were found.
Hypothesis testing to compare performance of Auto-Scorer with manual scoring was carried out using Student’s t test. Two-tailed t tests were performed on the two subsets of experimental data— control and post-REM deprived. In addition, we performed two-tailed paired t tests to determine if any differences in the proportion of time spent in each sleep/waking state existed between manual scoring and autoscoring within each group (control and post-REM deprived) for the data used to evaluate the Auto-Scorer.
3. Results
The time required for manually scoring 8 hour recordings ranged between 2–4 hours depending on the quality of the recorded signals, whereas the time required for creating a training file, setting thresholds and running Auto-Scorer was under one hour and as little as 30 minutes for the same 8 hour file. Thus, the time spent scoring using this automated system is approximately one-fourth the time required for manual scoring.
Overall performance comparisons were made between Auto-Scorer and manual scoring for 12 rat experiments using 4 scored states (Waking, non-REM sleep, transition-to-REM, and REM sleep), resulting in a mean agreement of 80.24 +/− 7.87% when consistently following guidelines for threshold settings. This is comparable to the average pair-wise agreement between 3 manual scorers for the 12 experiments (83.03 +/− 4.00%). The results of the t tests showed that there are not significant differences between user-user and user-Auto-Scorer agreement ratios. The p-values for the control and post-RD groups were 0.15 and 0.24, respectively (n=18, 6 experiments × 3 user-user or user-Auto-Scorer pairs).
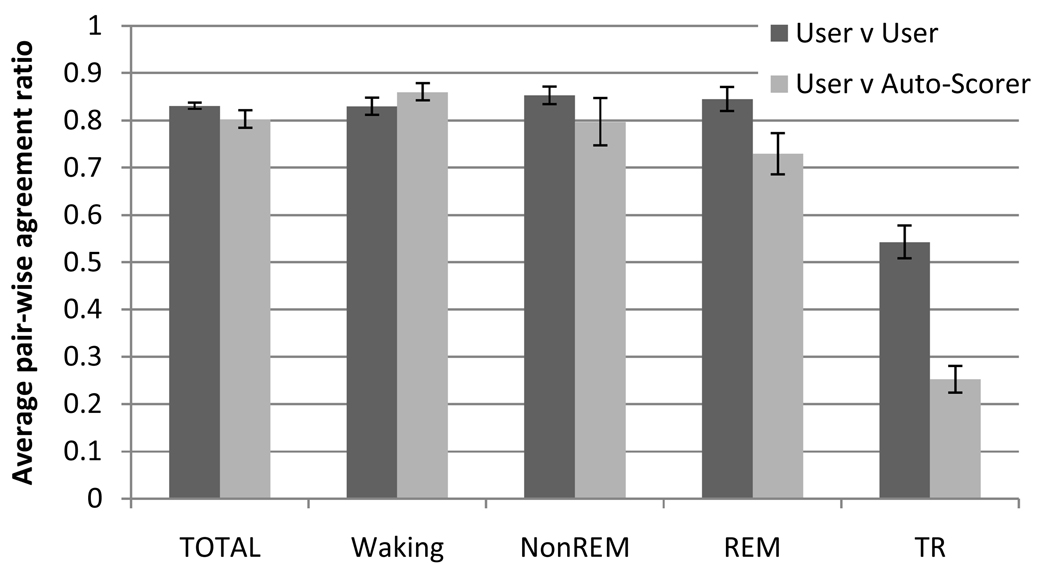
Considering the agreement with manual scoring for individual sleep/waking states (Figure 7), Auto-Scorer had the lowest agreement on scoring TR at 25.3+/−12.1%. However, the agreement between users was also low (54.3+/−20.8%) and was expected since TR is more transient. Waking had the highest agreement between users (83.0+/−4.0%) and between Auto-Scorer to manual scoring (80.2+/−7.9%).
Figure 7.
Average pair-wise agreement for the 3 users and Auto-Scorer for 12 experiments. Error bars represent +/−1 standard error of the mean.
The proportion of time spent in a given sleep/waking state is of interest when comparing results of different experimental conditions. The results of the two-tailed paired t tests showed that there were no significant differences in the proportion of time spent in a given state between manual scoring and autoscoring in both the control (p-values: Waking= 0.192, non-REM=0.393, REM=0.439) and post-REM deprived (p-values: Waking= 0.224, non-REM=0.635, REM=0.818) groups.
4. Discussion
The Auto-Scorer program requires 30–60 minutes to score a day’s sleep recording and can be done in three steps: (1) the user creates a training file (requires the most time, typically); (2) the user sets threshold values (requires about 5 minutes); and (3) Auto-Scorer scores all epochs of the file based on set thresholds and Boolean logic (requires less than a minute on a typical PC). Researchers can use Sleep Scorer and Auto-Scorer to shorten the time to a quarter of what is required manually for stage scoring of sleep data.
Performance of Auto-Scorer compares well to other automated systems (Table 1) (Benington et al., 1994; Costa-Miserachs et al., 2003; Crisler et al., 2007; Ferri et al., 1989; Mamelak et al., 1991; Martin et al., 1972; Nielsen et al., 1997; Norman et al., 2000; Robert et al., 1999; Ruigt et al., 1989a; Ruigt et al., 1989b; Svetnik et al., 2007; Van Gelder et al., 1991; Witting et al., 1996). In most of the published automated programs that have higher agreement, researchers only compared epochs where all users agreed on the state, or they perform manual changes of epoch states on parts of the autoscored file before computing the agreement. In addition, the average inter-observer agreement is consistent with previously published studies (Table 1).
Table 1.
A comparison of published automated sleep scoring programs. (States: Number of states scored, User-User: Average percent of epochs agreed upon by manual scorers, User-Auto: Average percent agreement between manual scoring and auto-scoring program). The two programs that preform better than ours (that do not hand-pick epochs or use post-processing steps in improve state agreement) by user-auto comparison are Mamelak (1991) in the cat and Benington (1994) in the rat.
| # Scorers | Comparison Type | Subjects | Species | States | Epoch (s) | User-User | User-Auto | Software | Parameters | Reference | Year |
|---|---|---|---|---|---|---|---|---|---|---|---|
| 3 | Intra-laboratory | 9 | Human | 6 | 30 | 89.3 | 80.8 | Custom Algorithm | Power spectra | Martin et al | 1972 |
| 17 | Intra- & Inter-laboratory | 4 | Human | 6 | 40 | 60.9 & 96.0 | N/A | Medilog Sleep Stager | Not listed | Ferri et al | 1989 |
| 2 | Intra-laboratory | 32 | Rat | 6 & 3 | 2 | --(c) | 81 & 98.5 | Logic Algorithm | Power spectra, Movement | Ruigt et al | 1989 |
| 2 | Intra-laboratory | 6 | Cat | 4 | 15 | 95.7 | 93.3 | Neural Networks | Wave counting | Mamelak | 1991 |
| 2 | Intra-laboratory | 4 | Mouse | 4 | 10 | 94.5 | 94 (c) | SCORE | Zero-crossing, harmonics, behavior |
Van Gelder et al | 1991 |
| 2 | Intra-laboratory | 3 | Rat | 4 | 10 | 95.2 | 91 | Logic Algorithm | Power spectra | Benington et al | 1994 |
| 2 | Intra-laboratory | 4 | Rat | 4 | 10 | 89.2 | 84.3 | Logic Algorithm | Power spectra, Euclidean distance |
Witting et al | 1996 |
| -- | Intra-laboratory | 6 | Human | -- | -- | 71.4 | N/A | N/A | N/A | Nielsen et al | 1997 |
| 2 | Intra-laboratory | 6 | Rat | 3 | 8 | 94.58 | 93 to 95 (c,d) | Neural Networks | Time-domain parameters, statistics |
Robert et al | 1998 |
| 5 | Intra-laboratory | 62 | Human | 5 | 30 | 65 to 85 | N/A | N/A | N/A | Norman et al | 2000 |
| 2 | Intra-laboratory | 5 | Rat | 3 | 20 | 96.45 | 94.32 (c) | Logic Algorithm | time-domain statistics, sequences |
Costa-Miserachs et al | 2003 |
| 2 | Intra-laboratory | 6 | Rat | 3 | 20 | 86.3 | 96.3 (c) | Custom SVM | time & frequency paramters | Crisler et al | 2007 |
| -- | Intra-laboratory | 82 | Human | 6 | 30 | N/A | 70 & 75.9 (b) | Morpheus | Not listed | Svetnik et al | 2007 |
| -- | Intra-laboratory | 82 | Human | 6 | 30 | N/A | 72.3 & 73 (b) | Somnolyzer 24x7 | Not listed | Svetnik et al | 2007 |
| 3 | Intra-laboratory | 12 | Rat | 4 | 10 | 83.0+/−4.0 | 80.2+/−7.9 | Auto-Scorer | Power Spectra | Our results |
Intense training for universal scoring
Percent agreement after partial user correction
Only visually agreed upon epochs used to compare with auto-scoring algorithm
Post-processing logic used to improve state agreement
The user-user and user-algorithm agreement by Benington et al (1994) appears to be higher than our results. This could be due to the threshold validation step that they use to optimize the results of their algorithm when compared to manual scoring. Also, it is not clear how many scored epochs of each state they use to set threshold values. Mamelak et al (1991) also report better performance using an artificial neural network approach. While we do not discount the advantages of a system that learns and can adapt to new situations, they used 960 manually scored epochs to train the network. This may be of benefit if several days of data recorded from one animal could be scored using the network. However, performance over days would probably decrease if the implanted sensors move slightly or recordings degrade due to neuroinflammatory responses. The aim of our program is to score a small number of epochs of each state in order to set the threshold values. Threshold settings can be created for each file since the time required to create the training file is short, and this enables us to avoid potential changes in recording characteristics that can occur over time.
The low performance in scoring Transition-to-REM was expected for both Auto-Scorer-user and user-user agreement. TR is not generally included in sleep studies, probably because it is so brief and comprises such a small percentage of the total sleep state. However, its regulation may be important for some processes (Datta, 2000), and efforts to standardize its identification and quantification are worthwhile. The high agreement in scoring waking, both among users and between manual and autoscoring, was also anticipated since waking tends to have a clearly higher EMG power than in sleep and a prominently lower σ × θ value (low power in both σ and θ bands) than Non-REM (high σ) and REM (high θ) sleep. Non-REM sleep agreement ratios are high. Using these parietal/hippocampal EEG signals, the Non-REM state is most confused with quiet waking because the hippocampal source displays large slow waves during quiet waking as well as quiet sleep. REM sleep is most often confused with TR since that state also tends to have high θ values and low neck EMG power.
Many auto-scoring programs, including the one presented here, are customized for a specific experimental design, animal or human subject, sensor types and location. To expand the use of an automated sleep scoring program it needs to be adaptable to these variations. Intelligent systems using artificial neural networks show the most promise in adapting to the varying needs of researchers. However, customizable logic-based programs with easily accessible code can be uniquely beneficial in sleep research. They allow the researcher to modify the logic algorithm to particular needs in order to improve agreement between autoscoring and manual scoring for a specific protocol and data format.
The MATLAB program files developed here contain extensive descriptions (comments) of the code, and pertinent code for the logic are grouped together for the user to more easily make modifications. Thus, this open source software can be modified by end-users with little programming experience.
As long as the format of the acquired data can be imported into MATLAB either by one of its many import functions or by a conversion program from the hardware manufacturer, such as Neuralynx’s free download MATLAB functions, the programs are independent of the data acquisition system. For example, data acquired using the AD recording system (M. Wilson and L. Frank, MIT) has also been converted and imported to our software for scoring. Data acquired using a monitoring system with a proprietary format can be converted into ASCII format with a defined delimiting parameter (e.g., comma, space, tab, etc.) if the company provides a conversion program. The data can then be imported to Sleep Scorer and Auto-Scorer using the ‘dlmread()’ function built into MATLAB.
In conclusion, we have presented the programs Sleep Scorer and Auto-Scorer that together can automatically score epochs of EMG and EEG signals as sleep/waking states. This set of programs addresses the time-consuming nature of state scoring and the need for flexibility among research protocols, and displays performance on par with other automated programs and user-user agreement rates.
Acknowledgments
We would like to thank Meghan Carroll, Lisa Matlen, and Ashley Turner for manually scoring the records. This research was funded by NIH 60670, Dept. of Anesthesiology, and Neurology Training Grant T32-NS007222 for Dr. Gross.
Footnotes
Publisher's Disclaimer: This is a PDF file of an unedited manuscript that has been accepted for publication. As a service to our customers we are providing this early version of the manuscript. The manuscript will undergo copyediting, typesetting, and review of the resulting proof before it is published in its final citable form. Please note that during the production process errors may be discovered which could affect the content, and all legal disclaimers that apply to the journal pertain.
References
- Benington JH, Kodali SK, Heller HC. Scoring Transitions to REM Sleep in Rats Based on the EEG Phenomena of Pre-REM Sleep: An Improved Analysis of Sleep Structure. SLEEP-NEW YORK- 1994;17:28. doi: 10.1093/sleep/17.1.28. [DOI] [PubMed] [Google Scholar]
- Costa-Miserachs D, Portell-Cortés I, Torras-Garcia M, Morgado-Bernal I. Automated sleep staging in rat with a standard spreadsheet. Journal of Neuroscience Methods. 2003;130:93–101. doi: 10.1016/s0165-0270(03)00229-2. [DOI] [PubMed] [Google Scholar]
- Crisler S, Morrissey MJ, Anch AM, Barnett DW. Sleep-stage scoring in the rat using a support vector machine. Journal of Neuroscience Methods. 2007 doi: 10.1016/j.jneumeth.2007.10.027. [DOI] [PubMed] [Google Scholar]
- Datta S. Avoidance task training potentiates phasic pontine-wave density in the rat: a mechanism for sleep-dependent plasticity. Journal of Neuroscience. 2000;20:8607. doi: 10.1523/JNEUROSCI.20-22-08607.2000. [DOI] [PMC free article] [PubMed] [Google Scholar]
- Ferri R, Ferri P, Colognola RM, Petrella MA, Musumeci SA, Bergonzi P. Comparison between the results of an automatic and a visual scoring of sleep EEG recordings. Sleep. 1989;12:354–362. [PubMed] [Google Scholar]
- Gottesmann C, Kirkham PA, LaCoste G, Rodrigues L, Arnaud C. Automatic analysis of the sleep-waking cycle in the rat recorded by miniature telemetry. Brain Res. 1977;132:562–568. doi: 10.1016/0006-8993(77)90205-0. [DOI] [PubMed] [Google Scholar]
- Grözinger M, Fell J, Röschke J. Neural net classification of REM sleep based on spectral measures as compared to nonlinear measures. Biological Cybernetics. 2001;85:335–341. doi: 10.1007/s004220100266. [DOI] [PubMed] [Google Scholar]
- Jouvet D, Vimont P, Delorme F, Jouvet M. Study of selective deprivation of the paradoxal sleep phase in the cat. CR Seances Soc Biol Fil. 1964;158:756–759. [PubMed] [Google Scholar]
- Lubin A, Johnson LC, Austin MT. Discrimination among states of consciousness using EEG spectra. Psychophysiology. 1969;6:122–132. doi: 10.1111/j.1469-8986.1969.tb02891.x. [DOI] [PubMed] [Google Scholar]
- Mamelak AN, Quattrochi JJ, Hobson JA. Automated staging of sleep in cats using neural networks. Electroencephalogr Clin Neurophysiol. 1991;79:52–61. doi: 10.1016/0013-4694(91)90156-x. [DOI] [PubMed] [Google Scholar]
- Martin WB, Johnson LC, Viglione SS, Naitoh P, Joseph RD, Moses JD. Pattern recognition of EEG-EOG as a technique for all-night sleep stage scoring. Electroencephalogr Clin Neurophysiol. 1972;32:417–427. doi: 10.1016/0013-4694(72)90009-0. [DOI] [PubMed] [Google Scholar]
- Mendelson W, Guthrie R, Frederick G, Wyatt R. The flower pot technique of rapid eye movement (REM) sleep deprivation. Pharmacology, Biochemistry, and Behavior. 1974;2:553. doi: 10.1016/0091-3057(74)90018-5. [DOI] [PubMed] [Google Scholar]
- Mistlberger RE, Bergmann BM, Rechtschaffen A. Relationships among wake episode lengths, contiguous sleep episode lengths, an? electroencephalographic delta waves in rats with suprachiasmatic nuclei lesions. Sleep(New York, NY) 1987;10:12–24. [PubMed] [Google Scholar]
- Neuhaus HU, Borbely AA. Sleep telemetry in the rat. II. Automatic identification and recording of vigilance states. Electroencephalogr Clin Neurophysiol. 1978;44:115–119. doi: 10.1016/0013-4694(78)90112-8. [DOI] [PubMed] [Google Scholar]
- Nielsen KD, Kjaer A, Jensen W, Dyrby T, Andreasen L, Andersen J, Andreassen S. Causal probabilistic network and power spectral estimation used in sleep stage classification. Methods Inf Med. 1997;36:345–348. [PubMed] [Google Scholar]
- Norman RG, Pal I, Stewart C, Walsleben JA, Rapoport DM. Interobserver agreement among sleep scorers from different centers in a large dataset. Sleep(New York, NY) 2000;23:901–908. [PubMed] [Google Scholar]
- Rechtschaffen A, Kales A. Washington, DC: US Government Printing Office, Department of Health Education and Welfare; A manual of standardized terminology, techniques and scoring system for sleep stages of human subjects (NIH Publication 204) 1968
- Robert C, Gaudy JF, Limoge A. Electroencephalogram processing using neural networks. Clinical Neurophysiology. 2002;113:694–701. doi: 10.1016/s1388-2457(02)00033-0. [DOI] [PubMed] [Google Scholar]
- Robert C, Guilpin C, Limoge A. Automated sleep staging systems in rats. Journal of Neuroscience Methods. 1999;88:111–122. doi: 10.1016/s0165-0270(99)00027-8. [DOI] [PubMed] [Google Scholar]
- Robert C, Guilpin C, Limoge A. Review of neural network applications in sleep research. Journal of Neuroscience Methods. 1998;79:187–193. doi: 10.1016/s0165-0270(97)00178-7. [DOI] [PubMed] [Google Scholar]
- Robert C, Karasinski P, Natowicz R, Limoge A. Adult rat vigilance states discrimination by artificial neural networks using a single EEG channel. Physiol Behav. 1996;59:1051–1060. doi: 10.1016/0031-9384(95)02214-7. [DOI] [PubMed] [Google Scholar]
- Roberts S, Tarassenko L. Analysis of the sleep EEG using a multilayer network with spatial organisation. 1992:420–425. [Google Scholar]
- Ruigt GS, Van Proosdij JN, Van Delft AM. A large scale, high resolution, automated system for rat sleep staging. I. Methodology and technical aspects. Electroencephalogr Clin Neurophysiol. 1989a;73:52–63. doi: 10.1016/0013-4694(89)90019-9. [DOI] [PubMed] [Google Scholar]
- Ruigt GS, Van Proosdij JN, Van Wezenbeek LA. A large scale, high resolution, automated system for rat sleep staging. II. Validation and application. Electroencephalogr Clin Neurophysiol. 1989b;73:64–71. doi: 10.1016/0013-4694(89)90020-5. [DOI] [PubMed] [Google Scholar]
- Schaltenbrand N, Lengelle R, Toussaint M, Luthringer R, Carelli G, Jacqmin A, Lainey E, Muzet A, Macher JP. Sleep stage scoring using the neural network model: comparison between visual and automatic analysis in normal subjects and patients. Sleep. 1996;19:26–35. doi: 10.1093/sleep/19.1.26. [DOI] [PubMed] [Google Scholar]
- Sinha RK. Artificial neural network and wavelet based automated detection of sleep spindles, REM sleep and wake states. Journal of Medical Systems. 2008;32:291–299. doi: 10.1007/s10916-008-9134-z. [DOI] [PubMed] [Google Scholar]
- Svetnik V, Ma J, Soper KA, Doran S, Renger JJ, Deacon S, Koblan KS. Evaluation of automated and semi-automated scoring of polysomnographic recordings from a clinical trial using zolpidem in the treatment of insomnia. Sleep. 2007;30:1562–1574. doi: 10.1093/sleep/30.11.1562. [DOI] [PMC free article] [PubMed] [Google Scholar]
- Van Gelder RN, Edgar DM, Dement WC. Real-time automated sleep scoring: validation of a microcomputer-based system for mice. Sleep. 1991;14:48–55. doi: 10.1093/sleep/14.1.48. [DOI] [PubMed] [Google Scholar]
- van Luijtelaar E, Coenen AML. An EEG averaging technique for automated sleep-wake stage identification in the rat. Physiology & Behavior. 1984;33:837–841. doi: 10.1016/0031-9384(84)90056-8. [DOI] [PubMed] [Google Scholar]
- Witting W, van der Werf D, Mirmiran M. An on-line automated sleep-wake classification system for laboratory animals. Journal of Neuroscience Methods. 1996;66:109–112. doi: 10.1016/0165-0270(96)00027-1. [DOI] [PubMed] [Google Scholar]


