

Abstract
Vacuolating cytotoxin (vacA) alleles of Helicobacter pylori vary, particularly in their mid region (which may be type m1 or m2) and their signal peptide coding region (type s1 or s2). We investigated nucleotide diversity among vacA alleles in strains from several locales in Asia, South America, and the USA. Phylogenetic analysis of vacA mid region sequences from 18 strains validated the division into two main groups (m1 and m2) and showed further significant divisions within these groups. Informative site analysis demonstrated one example of recombination between m1 and m2 alleles, and several examples of recombination among alleles within these groups. Recombination was not sufficiently extensive to destroy phylogenetic structure entirely. Synonymous nucleotide substitution rates were markedly different between regions of vacA, suggesting different evolutionary divergence times and implying horizontal transfer of genetic elements within vacA. Non-synonymous/synonymous rate ratios were greater between m1 and m2 sequences than among m1 sequences, consistent with m1 and m2 alleles encoding functions fitting strains for slightly different ecological niches.
The Gram-negative bacterium Helicobacter pylori is centrally involved in the pathogenesis of human peptic ulceration and is a major risk factor for the development of distal gastric adenocarcinoma and gastric lymphoma [4]. It exhibits an unusually high level of genetic diversity between strains [7], which has important implications for virulence, antibiotic resistance, and vaccine development. Implications of diversity for virulence are most obvious for the vacuolating cytotoxin gene, vacA, in that the various allelic types of vacA are differently associated with cytotoxicity and with disease state [1, 2]. How genetic diversity in H. pylori is established and maintained remains unclear: recombination between strains appears important, but two studies using multilocus enzyme electrophoresis have given different assessments of its extent [7, 8]. Recently, Suerbaum et al. analyzed nucleotide sequence from parts of the two flagella genes flaA and flaB and from a small part of the vacuolating cytotoxin gene, vacA [24]: they found that recombination had been so frequent that all evidence of phylogenetic descent was obscured. We have studied vacA and have developed a pathogenically relevant PCR-based typing system based on vacA nucleotide sequence heterogeneity [1, 2, 26]. During the development of this system, we collected multiple sequence data from the two variable regions of vacA on which our typing system was based, the 0.7-kb mid region (for which we described two types, m1 and m2) and the region encoding the second half of the signal sequence (type s1a, s1b, s1c, or s2). Analysis of our sequence data provides contrasting results to those of Suerbaum et al. in that, although we demonstrate (by different methodology) that recombination has occurred between vacA alleles, we also show that this has not entirely disrupted the underlying phylogenetic relationship between sequences. In particular, our data provide evidence for the phylogenetic validity of our vacA typing and provide some insight into how vacA has evolved.
Materials and Methods
H. pylori isolates
For comparative sequence analysis of the vacA mid region, the following 18 isolates were studied (references in square brackets where the sequence has previously been published): two Peruvian isolates from Lima (90-11, 90-40); three Thai isolates from Bangkok (88-29, 88-32, 88-35); two Chinese isolates from Shandong Province (Ch2, Ch4); two Japanese isolates, one from Yamagucchi (HPK3) and a second (43526 [15]); five USA isolates, one from Nashville (J150), two from Colorado (86-313, 87-203 [5]), two from Texas (Tx30a [1], 84-183: ATCC 53726 [5]); two UK isolates, one type strain (60190: ATCC 49503 [5]) and the strain for which the genome sequence has been published (26695) [25]); one type strain from Australia (NCTC 11638 [19]); and a strain from Germany (185-44 [23]). For comparative analysis of the region encoding the vacA signal sequence, 14 of the above isolates were studied; for nine strains nucleotide sequence data were already available [1], and for five strains these data were obtained specifically for this study.
PCR-based sequencing of vacA segments
For five strains (90-40, 88-29, 88-32, Ch2, HPK3), we had sequenced 1.7-kb vacA fragments (coordinates 726 to 2445 bp in the published vacA sequence of strain Tx30a [1]) to assess suitable sites for design of primers for PCR typing the vacA mid region. vacA fragments from these strains had been PCR-amplified with primers VA10-F (5′-CGCTGAAATCTCTCTTTATG) and VA10-R (5′-CATGCTTTGATTGCCGATAGC). PCR products were subcloned into pT7Blue (Novagen, Madison, WI), then sequenced on both strands with a minimum of twofold redundancy. Because these strains were predominantly vacA mid region type m1, for the purposes of multiple sequence comparisons we also PCR-amplified (primers VA4-F and -R [1]), subcloned, and sequenced a distal section of the mid region of vacA, (corresponding to coordinates 1967-2278 bp in Tx30a [1]) from four vacA m2 strains (90-11, 88-35, Ch4 and J150). The vacA region encoding the N-terminal signal sequence (coordinates 1-99 bp in 60190 [5]) was PCR-amplified with primers A1043 (5′-ATTTTACCTTTTTACACATTCTAGCC) and B771 (5′-AGAAGCCCTGAGACCG) and sequenced directly. Nucleotide sequencing was performed with an automated ABI sequencer.
Genetic analysis
vacA sequence data obtained by us or others were available for 312 bp in the distal mid-region (1967–2278 bp in strain Tx30a [1]) for all 18 strains, for 1.7 kb of vacA which included this region for 14 strains (coordinates 726 to 2445 bp in Tx30a [1]), and for all of vacA for six strains. The neighbor-joining method was used to construct phylogenetic trees [22], and the stability of tree positions was tested by bootstrapping [6]. For Fig. 1A, we used sequence alignments of 289 of the 312 bp in the distal mid region for which we had sequence data for all 18 strains. We omitted 19 nucleotides at the 3′ end of the 312-bp sequence because they could not be aligned with confidence, and since the 5′ end of the 312-bp segment appeared to include the breakpoint in a recombination event in the ancestry of the Ch2 allele (see below), four nucleotides at this end were also excluded. We refer to this region henceforth as region A. For Fig. 1B, we aligned 365 nucleotides immediately proximal (5′) to region A; the 5′ end of this region was defined by a region of gaps in the alignment of m1 and m2 sequences. We refer to this region henceforth as region B. Putatively recombinant alleles were analyzed with informative sites in four sequence alignments and the positions of recombinational breakpoints estimated by maximum chi squared analysis [12, 21]. The extents of synonymous (KS) and nonsynonymous (KA) nucleotide substitutions per site were estimated by Li's method for correcting for multiple hits [11].
Fig. 1.
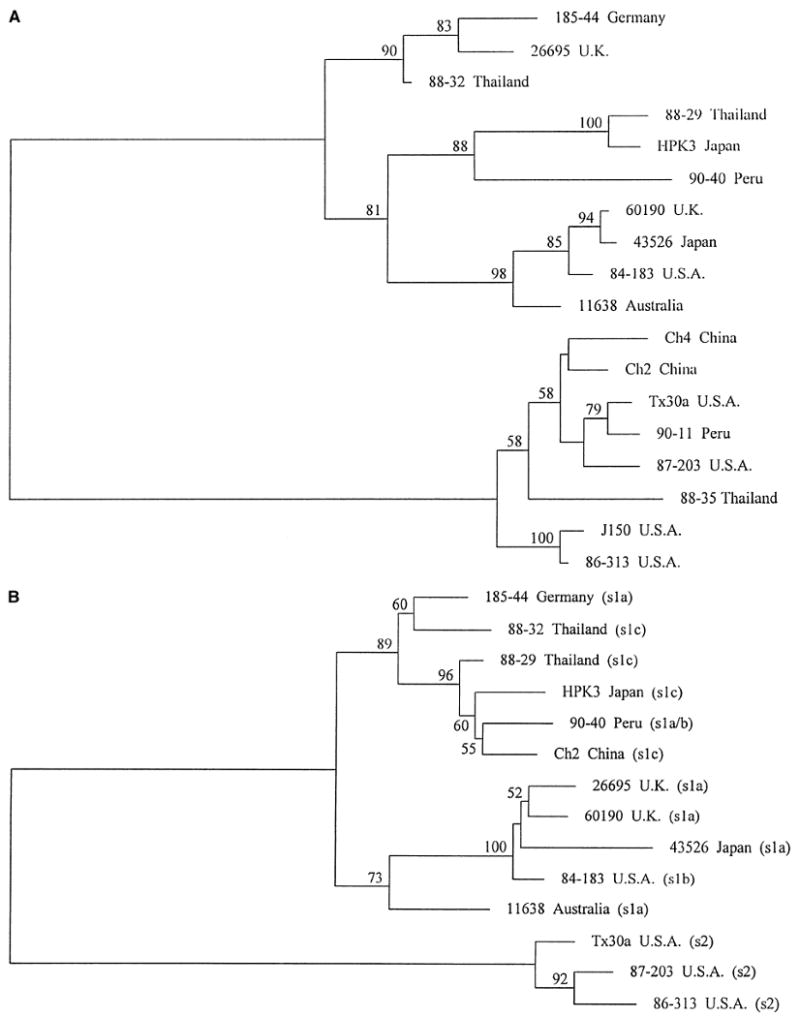
Phylogenetic relationships among strains based on two adjacent sections of the vacA mid region sequence. Trees were mid-pointed rooted, separating the vacA type m1 strains (upper cluster) from the vacA type m2 strains (lower cluster). Horizontal distances between strains indicate relatedness. Numbers on branches indicate the percentage of bootstrap replicates in which the clusters to the right were found (only values greater than 50% are shown); in both cases, the separation of the two main clusters occurred in 100% of bootstraps. Panel A is based on multiple sequence alignments of part of the distal mid region of vacA (region A, coordinates 1971–2259 bp in strain Tx30a [1]). Panel B is based on the part of the vacA mid region immediately 5′ region to that analyzed in Panel A (region B, coordinates 1606–1970 bp in strain Tx30a [1]). Five m2 strains are not included in Panel B because sequence data were not obtained for them for this region. The type of signal sequence coding region in each strain, as determined by nucleotide sequence analysis, is added in brackets. Strain 90-40 has a signal region type intermediate between s1a and s1b.
Results
Analysis of diversity and relatedness between vacA mid region sequences
Analysis of relatedness of vacA sequences in region A [the 312 bp of distal mid region sequence for which data were available from all 18 strains included in the study (Fig. 1A)] revealed two distinct clusters, corresponding to the m1 and m2 types previously described. The mean difference between m1 and m2 sequences was 24.9%, compared with 8.8% and 4.6% within the m1 and m2 clusters, respectively. Bootstrap analysis showed several significant branch points, but little clustering by country of origin. For region B (the 365 nucleotides of the vacA mid region immediately proximal to region A) sequences from the 14 alleles for which data were available again fell into the two distinct m1 and m2 clusters (Fig. 1B). The average difference between m1 and m2 sequences was 25.9%, compared with 8.2% and 3.7% within the m1 and m2 clusters, respectively. There was some clustering by country of origin, although strain 43526 (Japan) clustered with strains from the UK and USA, and strains 1885-44 (Germany) and 90-40 (Peru) clustered with strains from Asia. Overall, the average levels of diversity were similar in the two regions, and in both regions m1 sequences were more diverse than m2 sequences.
Recombination within vacA between m1 and m2 alleles
Although there was considerable similarity between the phylogenies of the two adjacent parts of the mid region described above, as would be expected in the absence of recombination, there were some significant differences between trees. Most strikingly, the Ch2 sequence was type m2 in the more distal part (region A, Fig. 1A) but was type m1 in the more proximal part (region B, Fig. 1B), suggesting that it was a hybrid generated by recombination between m1 and m2 alleles. This was strongly supported by the bootstrap values for the m1 and m2 clusters in Fig. 1A and 1B. Examination of the alignments of the Ch2 sequence with sequences of vacA m1 and m2 strains demonstrated the region containing the recombinational breakpoint (Fig. 2). To assess the statistical significance of the data supporting recombination, we examined the distribution of phylogenetically informative sites placing the Ch2 sequence within the m1 or m2 clades. The simplest methodology employs a four-sequence alignment, where the four sequences are the putative recombinant (in this case Ch2), two sequences closely related to those thought to be involved as “parents” in the recombination (90-40 and Tx30a) and a fourth strain representing an outgroup (which was not possible in this case) or at least a lineage not closely related to either parent (we chose 11638). Phylogenetically informative sites are those at which two sequences share one nucleotide and the other two another, and provide support for one of the three possible (unrooted) trees involving four sequences [21]). In this case, informative sites could suggest the grouping of Ch2 with: (1) 90-40 (as in Fig. 1B), (2) Tx30a (as in Fig. 1A), or (3) 11638. If Ch2 is indeed a mosaic of 90-40-like and Tx30a-like sequences, we expect to find sites of types (1) and (2) clustered within different regions of the alignment, while sites of type (3) should be rare and scattered. There were 70 informative sites within the combined 654 bp of regions A and B analyzed in Fig. 1, 13 of type (1), 55 of type (2) and 2 of type (3). Maximum chi square analysis [12] showed that the optimum breakpoint between regions composed of mostly type (1) or type (2) sites was in the region shown in Fig. 2. The significance of this non-random distribution of sites of types (1) and (2) was estimated by 10,000 random permutations of the informative sites; none produced a chi square as large as that observed, suggesting p < 10−4.
Fig. 2.

Region of vacA containing the recombination site in strain Ch2 (coordinates 1931–2030 bp in strain Tx30a [1]). Homologous sequence from the three ml (top) and three m2 (bottom) alleles that cluster most closely with sequence from strain Ch2 on either side of the recombination site are shown. Dots represent identity compared with the sequence from strain 90-40. For the first part of the sequence shown, up to the grey box, the Ch2 sequence is highly similar to that from vacA m1 strains. After the box, the sequence closely matches that from m2 strains. The box contains the likely recombination point.
Evidence for further recombination between vacA alleles
In both region A and region B within the vacA mid region, there appeared to be a similar phylogenetic substructure within the m1 cluster. However, strain 26695 clustered with 185-44 in the proximal region (region B, Fig. 1B), but with the 60190/43526/84-183 subcluster in the distal region (region A, Fig. 1A). Bootstrap support was very strong, indicating that 26695 might represent another mosaic sequence, in this case generated by recombination between two distinct m1 alleles. The recombination breakpoint was again estimated by maximum chi square analysis of informative sites in a four-sequence alignment, using strains 60190 and 185-44 as representatives of the parental lineages and HPK3 as the reference sequence (Fig. 3). Again, the nonrandom distribution of informative sites was highly significant (p < 10−4). There were other indications of past recombination within vacA in the contrast between Fig. 1A and 1B. Among the m2 sequences, 87-203 appeared more closely related to 86-313 in region B, but more closely related to Tx30a in region A, with a probable recombination point between sites 70 and 111 of the combined 654 bp sequence of regions A and B. Strain 11638 also showed evidence of probable recombination from informative site analysis. Across the concatenated 654 bp of regions A and B, this sequence was most similar to strains 60190, 43526, and 84-183. However, there was a central region (bases 270–449) in which 11638 differed from 185-44 at just two sites (1.1%), whereas 60190, 43526, and 84-183 differed from 185-44 at between 20 and 24 sites (average 12.1%); since this region straddled regions A and B used to derive the trees in Fig. 1, the position of 11638 did not differ significantly between the two trees. Within the m1 cluster, the 88-29/HPK3/90-40 subcluster was more closely related to the 185-44/88-32 subcluster in region B (Fig. 1B), but more closely related to the 60190/43526/84-183/11638 subcluster in region A (Fig. 1A). This is most easily explained by a recombinational event in the common ancestor of strains 88-29, HPK3, and 90-40.
Fig. 3.
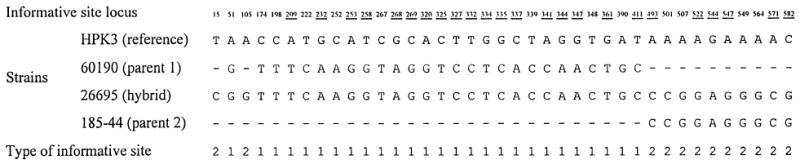
Informative site analysis to demonstrate the hybrid nature of vacA in strain 26695, the strain for which the complete genome sequence has been determined [25]. Dashes represent nucleotide identity with the reference sequence (HPK3). Strains 60190 and 185-44, which cluster most closely with 26695 in Fig. 1B and 1A, respectively, were taken as parent-like strains, and strain HPK3, which clusters distantly in both trees, was used as a reference strain. Only informative sites (sites where two pairs of strains have identical nucleotides) are shown, and these are numbered from the beginning of the concatenated sequence of regions A and B analyzed in Fig. 1 (coordinates 1606–2259 bp in strain Tx30a [1]). Type 1 sites suggest clustering of 26695 with 60190, type 2 with 185-44, and type 3 (of which there are none) with HPK3. Underlined and emboldened loci are non-synonymous substitutions compared with the other pair of sequences. The distribution of type 1 and 2 informative sites is clearly non-random (p < 10−4) and shows a recombination point somewhere between sites 411 and 493 of the concatenated sequence.
Nucleotide sequence analysis of the signal peptide coding region provides further insights into geographical clustering and recombination within vacA
Sequence data for the signal region for the 14 strains shown in Fig. 1b confirmed the previously reported significant division into s1 and s2 lineages, and within the s1 lineage, the division into s1a, s1b, and s1c subgroups [1, 2, 26] (data not shown). Geographical grouping was evident; for example, strains in the upper clade in Fig. 1b were mainly signal region type s1c. However, there was also evidence of recombination; for example, two strains in the upper clade (185-44 and 90-40) were type s1a rather than s1c, and strain 84-183 (which was type s1b) clustered closely for mid region with strains 26695, 60190, and 43526 (which were s1a). Both these points suggest recombination at a site between signal and mid regions. Thus, recombination has occurred, but has not been sufficiently extensive to destroy all phylogenetic substructure.
Analysis of nucleotide substitution rates between vacA sequences
To explore the evolutionary basis for differences between the m1 and m2 vacA allelic families, we analyzed KS (the mean number of synonymous substitutions per site), KA (the mean number of non-synonymous substitutions per site), and the KA/KS ratio, for all possible pairs of aligned sequences. We derived these data using region A (Fig. 1A) within the vacA mid region, since sequence data were available for this region of vacA for all strains studied. Since there is no evidence that synonymous codon usage is constrained in H. pylori (Lafay B, Atherton JC, Sharp PM, unpublished data), KS should roughly reflect the divergence time between sequences. As expected from the phylogenetic trees (Fig. 1), the value of KS between the m1 and m2 groups was greatest (Table 1), confirming the m1/m2 division as the most ancient. Also, KS was greater among m1 than among m2 sequences, indicating a more recent common ancestor for the latter. The KA/KS ratio controls for difference in divergence time and so provides a measure of functional constraint on protein sequences. Within the m1 and m2 groups, KA/KS tended to be lower for m2 than for m1 vacA, suggesting as or more intense functional constraints for m2 sequences (which usually encode VacA which induces minimal or no vacuolation of HeLa cells in vitro [1]) than m1 sequences (which usually encode VacA which causes intense vacuolation of HeLa cells [1]). The value of the KA/KS ratio between the m1 and m2 groups was higher than the value within the groups, implying different selective pressures on m1 and m2 VacA, which could thus confer survival advantage for slightly different ecological niches. These findings are consistent with the hypothesis that m1 and m2 mid regions may encode different receptor-binding domains [16].
Table 1.
Mean synonymous (KS) and non-synonymous (KA) nucleotide substitution rates between pairs of alleles within the distal vacA mid regiona
To determine whether our findings for the vacA mid region were applicable to other parts of vacA, we first assessed whether there were logical regions within vacA to analyze separately. To do this, we plotted amino acid diversity against position in vacA for overlapping 100-bp windows for the six strains for which full-length vacA sequence data were available [1, 5, 15, 19, 23, 25], five of which were m1 and one m2. This analysis confirmed the presence of a mid region with higher levels of diversity than the flanking 5′ and 3′ regions, and allowed estimation of the approximate boundaries of these regions (Table 2). Among the five m1 strains, KS was higher for the mid region than for the 5′ and 3′ regions. The existence of regions within vacA for which KS is different, and thus which are apparently of different ages, is further evidence of previous recombination. The KA/KS ratio for the 3′ region of vacA was similar both among m1 strains, and between m1 strains and the single m2 strain (Table 2). This implies that the 3′ region (which encodes the C-region of the protoxin important for protein transport across the outer membrane [23]) has similar functional constraints for m1 and m2 VacA.
Table 2.
Mean synonymous (KS) and non-synonymous (KA) nucleotide substitution rates between pairs of sequences within three defined regions of vacA. Comparisons among five m1 alleles with full-length vacA sequence data,a and between these five alleles and the one m2 allele with full-length sequence datab
| Comparison | Number of comparisons | 5′ regionc | Mid regiond | 3′ regione | ||||||
|---|---|---|---|---|---|---|---|---|---|---|
| KS | KA | KA/KS | KS | KA | KA/KS | KS | KA | KA/KS | ||
| m1 vs m1 | 10 | 0.11 | 0.029 | 0.25 | 0.17 | 0.051 | 0.31 | 0.11 | 0.027 | 0.25 |
| m1 vs m2 | 5 | 0.23 | 0.105 | 0.46 | 0.47 | 0.273 | 0.58 | 0.11 | 0.032 | 0.30 |
Strains and references for these five vacA alleles are 60190 [4]; 26695 [25]; 11638 [19]; 185-44 [23]; 43526 [15].
Strain Tx30a [1].
Defined as 1 to 1620 bp of published sequence of strain 60190 [4].
Defined as 1621 to 2571 bp of published sequence of strain 60190 [4].
Defined as 2572 to 3864 bp of published sequence of strain 60190 [4].
An alternative or additional explanation for the relatively high KA/KS values for vacA, particularly the mid region and the m1 type, is that these reflect a positive selection for amino acid diversity. That the value of the KA/KS ratio for vacA is less than one indicates that there are functional constraints on sequence, but the absolute value of the ratio is uninformative in isolation since typical KA/KS values for H. pylori genes have not been published. To address this, we assessed KA/KS ratios between strains 11638 and 26695 for vacA and 17 other H. pylori genes with GenBank sequences. The value of 0.26 for vacA was similar to the mean value for comparisons among five m1 strains (Table 2). The median value for the other 17 genes was 0.10. One gene, prmA, had a ratio (0.45) substantially higher than vacA, while two others (dapB, hpaA) had values (0.29, 0.27) similar to vacA; all other genes had values less than 0.2. The comparatively high KA/KS values for vacA, in particular the mid region, suggest but do not prove positive selection for amino acid diversity.
Discussion
We have shown previously that individual vacA alleles consist of one of many possible combinations of signal sequence and mid region types [1], suggesting recombination between vacA alleles in vivo. Studies using multilocus enzyme electrophoresis support this concept [7, 8], as does Suerbaum et al.'s recent analysis of short segments of flaA, flaB, and vacA, using compatibility matrices and a newly described “homoplasy” test [24]. As for many other bacteria with recombinational population structures, recombination between H. pylori strains in vitro following natural transformation [9, 14, 28] or a conjugation-like mechanism [9] has been demonstrated experimentally. In this study, we used methodologies different from that of Suerbaum et al. to provide further direct evidence for previous recombination within vacA and to demonstrate sites at which this occurred.
Although, like Suerbaum et al., we have demonstrated recombination within vacA, the results of the two studies contrast markedly in the level of recombination demonstrated. The Suerbaum study suggested that H. pylori undergoes a massive amount of recombination so that sequences of different strains are a complete mosaic of regions with different phylogenetic histories; this means that even nearby sites do not retain the same phylogenetic message. In contrast, in our study, phylogenetic structure was partially preserved. This was most obviously the case for division of vacA sequences into the two main groups, m1 and m2, but we also found other significant branch points within these groups (Fig. 1A and 1B). Thus, large sections of vacA sequence in our study are comprised of sites in linkage disequilibrium, that is, that retain their phylogenetic message.
The two main differences between our study and that of Suerbaum which could affect the apparent extent of recombination were the strain population selected and the region of vacA examined. Our population was geographically widespread, whereas the main group of vacA sequences studied by Suerbaum et al. was from a single city in Canada. Recombination between strains might be expected to be more common in a defined geographical area, especially if the population was homogeneous, as there would be expected to be more frequent contact between strains. The strains in our study were from opposite sides of the world and from racially distinct groups. Given these factors, it is perhaps surprising that even limited past recombination was evident. That most examples were changes in the final branch point in the trees, and that putative parent strains had such close sequence similarity to recombinants, implies that geographical isolation occurred prior to recombination. Interestingly, in addition to studying vacA in Canadian strains, Suerbaum et al. also studied vacA in strains from a Cape Colored population in South Africa where mixing between racial groups has been relatively recent. In this case they found recombination to be less frequent.
The second difference between this study and that of Suerbaum et al. was that the region of vacA studied by Suerbaum et al. was 5′ to the region analyzed in this study, and within the region termed the “5′ region” in Table 2. This part of vacA is less variable than the mid region (Table 2), and in other bacteria recombination frequency decreases exponentially with sequence divergence [20]. Strain Ch2 possesses the only vacA allele demonstrating recombination between m1 and m2 mid region sequences that we have found among 77 strains that we have screened from the USA, Peru, Japan, Thailand, and China (J. Atherton, unpublished data), although others have described occasional vacA alleles with a similar structure in Chinese strains [17, 27]. Furthermore, in the Ch2 allele, the recombination site is contained in a short stretch of sequence that is more similar between m1 and m2 alleles than are surrounding areas. In contrast, at least four examples were evident of recombination between the more similar sequences within the m1 or m2 groups for the 14 strains for which sufficient sequence data were available. This is likely to be an underestimate, as recombination between similar sequences is difficult to identify, since diagnostic informative sites are infrequent. Thus, it appears that recombination between sequences in H. pylori is less frequent where the sequences are more divergent, and this may partly explain the differences between our results and those of Suerbaum.
In summary, we have shown that widely geographically divergent strains of H. pylori have recombined at some stage in their history, but that recombination has not been sufficiently frequent entirely to disrupt phylogenetic structure based on sequence within vacA. Increasing mobility of human populations in modern life may allow more contact between H. pylori strains and so provide the opportunity for more recombination between divergent sequences. H. pylori prevalence is falling in developed countries, owing presumably to changes in its niche, the human stomach, with better nutrition, better hygiene, and widespread use of antibiotics [3]. Whether recombination is sufficiently frequent and strain dissemination sufficiently efficient to allow H. pylori to evolve and adapt to these changing evolutionary pressures will have important future implications for H. pylori-associated diseases and thus human health.
Acknowledgments
Grant support: AI 39657, DK 53707, a Center grant from the National Cancer Institute (CA 68485), and the Medical Research Service of the Department of Veterans' Affairs. John Atherton is funded by a Clinician Scientist Fellowship from the Medical Research Council (UK).
Literature Cited
- 1.Atherton JC, Cao P, Peek RM, Tummuru MKR, Blaser MJ, Cover TL. Mosaicism in vacuolating cytotoxin alleles of Helicobacter pylori. Association of specific vacA types with cytotoxin production and peptic ulceration. J Biol Chem. 1995;270:17771–17777. doi: 10.1074/jbc.270.30.17771. [DOI] [PubMed] [Google Scholar]
- 2.Atherton JC, Peek RM, Tham KT, Cover TL, Blaser MJ. Clinical and pathological importance of heterogeneity in vacA, the vacuolating cytotoxin gene of Helicobacter pylori. Gastroenterology. 1997;112:92–99. doi: 10.1016/s0016-5085(97)70223-3. [DOI] [PubMed] [Google Scholar]
- 3.Blaser MJ. The changing relationship of Helicobacter pylori and humans: implications for health and disease. J Infect Dis. 1999 doi: 10.1086/314785. in press. [DOI] [PubMed] [Google Scholar]
- 4.Cover TL, Blaser MJ. Helicobacter pylori infection, a paradigm for chronic mucosal inflammation: pathogenesis and implications for eradication and prevention. Adv Intern Med. 1996;41:85–117. [PubMed] [Google Scholar]
- 5.Cover TL, Tummuru MKR, Cao P, Thompson SA, Blaser MJ. Divergence of genetic sequences for the vacuolating cytotoxin among Helicobacter pylori strains. J Biol Chem. 1994;269:10566–10573. [PubMed] [Google Scholar]
- 6.Felsenstein J. Confidence limits on phylogenies: an approach using the bootstrap. Evolution. 1985;39:783–791. doi: 10.1111/j.1558-5646.1985.tb00420.x. [DOI] [PubMed] [Google Scholar]
- 7.Go MR, Kapur V, Graham DY, Musser JM. Population genetic analysis of Helicobacter pylori by multilocus enzyme electrophoresis: extensive allelic diversity and recombinational population structure. J Bacteriol. 1996;178:3934–3938. doi: 10.1128/jb.178.13.3934-3938.1996. [DOI] [PMC free article] [PubMed] [Google Scholar]
- 8.Hazell SL, Andrews RH, Mitchell HM, Daskalopoulus G. Genetic relationship among isolates of Helicobacter pylori: evidence for the existence of a Helicobacter pylori species-complex. FEMS Microbiol Lett. 1997;150:27–32. doi: 10.1111/j.1574-6968.1997.tb10345.x. [DOI] [PubMed] [Google Scholar]
- 9.Kuipers EJ, Israel DA, Kusters JG, Blaser MJ. Evidence for a conjugation-like mechanism of DNA transfer in Helicobacter pylori. J Bacteriol. 1998;180:2901–2905. doi: 10.1128/jb.180.11.2901-2905.1998. [DOI] [PMC free article] [PubMed] [Google Scholar]
- 10.Letley DP, Lastovica A, Louw JA, Hawkey CJ, Atherton JC. Helicobacter pylori vacuolating cytotoxin allelic diversity in South Africa: rarity of the vacA s1a genotype and natural occurrence of an s2/m1 allele. J Clin Microbiol. 1999 doi: 10.1128/jcm.37.4.1203-1205.1999. in press. [DOI] [PMC free article] [PubMed] [Google Scholar]
- 11.Li WH. Unbiased estimation of the rates of synonymous and nonsynonymous substitution. J Mol Evol. 1993;36:96–99. doi: 10.1007/BF02407308. [DOI] [PubMed] [Google Scholar]
- 12.Maynard-Smith J. Analysing the mosaic structure of genes. J Mol Evol. 1992;34:126–129. doi: 10.1007/BF00182389. [DOI] [PubMed] [Google Scholar]
- 13.Morales R, Castillo G, Gonzalez G, Ballesteros A, Ponce de Leon S, Cravioto A, Atherton JC, Lopez-Vidal Y. High levels of vacA diversity in the context of infection with multiple Helicobacter pylori strains in Mexican patients. Gastroenterology. 1998;114:A233. [Google Scholar]
- 14.Nedenskov P, Sorensen G, Buckholm G, Bovre K. Natural competence for genetic transformation in Campylobacter pylori. J Infect Dis. 1990;161:365–366. doi: 10.1093/infdis/161.2.365. [DOI] [PubMed] [Google Scholar]
- 15.Ogura K, Kanai F, Maeda S, Yoshida H, Ogura M, Lan KH, Hirota K, Kawabe T, Shiratori Y, Omata M. High prevalence of cytotoxin positive Helicobacter pylori in patients unrelated to the presence of peptic ulcers in Japan. Gut. 1997;41:463–468. doi: 10.1136/gut.41.4.463. [DOI] [PMC free article] [PubMed] [Google Scholar]
- 16.Pagliaccia C, de Bernard M, Lupetti P, Ji X, Burroni D, Cover TL, Papini E, Rappuoli R, Telford JL, Reyrat JM. The m2 form of the Helicobacter pylori cytotoxin has cell type-specific vacuolating activity. Proc Natl Acad Sci USA. 1998;95:10212–10217. doi: 10.1073/pnas.95.17.10212. [DOI] [PMC free article] [PubMed] [Google Scholar]
- 17.Pan ZJ, Berg DE, van der Hulst RWM, Su WW, Raudonikiene A, Xiao SD, Dankert J, Tytgat GNJ, van der Ende A. Presence of vacuolating cytotoxin production and distribution of distinct vacA alleles in Helicobacter pylori from China. J Infect Dis. 1998;178:220–226. doi: 10.1086/515601. [DOI] [PubMed] [Google Scholar]
- 18.Perez-Perez GI, Tham KT, Peek RM, Atherton JC, Blaser MJ, Cover TL. Serologic responses to type m1 and m2 H. pylori VacA antigens, abstr. Gut. 1997;41:A110. [Google Scholar]
- 19.Phadnis SH, Ilver D, Janzon L, et al. Pathological significance and molecular characterization of the vacuolating toxin gene of Helicobacter pylori cytotoxic activity. Infect Immun. 1994;62:1557–1565. doi: 10.1128/iai.62.5.1557-1565.1994. [DOI] [PMC free article] [PubMed] [Google Scholar]
- 20.Roberts MS, Cohan FM. The effect of DNA sequence divergence on sexual isolation in Bacillus. Genetics. 1993;134:401–408. doi: 10.1093/genetics/134.2.401. [DOI] [PMC free article] [PubMed] [Google Scholar]
- 21.Robertson DL, Hahn BH, Sharp PM. Recombination in AIDS viruses. J Mol Evol. 1995;40:249–259. doi: 10.1007/BF00163230. [DOI] [PubMed] [Google Scholar]
- 22.Saitou N, Nei M. The neighbor-joining method; a new method for reconstructing phylogenetic trees. Mol Biol Evol. 1987;4:406–425. doi: 10.1093/oxfordjournals.molbev.a040454. [DOI] [PubMed] [Google Scholar]
- 23.Schmitt W, Haas R. Genetic analysis of the Helicobacter pylori vacuolating cytotoxin: structural similarities with the IgA protease type of exported protein. Mol Microbiol. 1994;12:307–319. doi: 10.1111/j.1365-2958.1994.tb01019.x. [DOI] [PubMed] [Google Scholar]
- 24.Suerbaum S, Maynard Smith J, Bapumia K, Morelli G, Smith NH, Kunstmann E, Dyrek A, Achtman M. Free recombination within Helicobacter pylori. Proc Natl Acad Sci USA. 1998;95:12619–12624. doi: 10.1073/pnas.95.21.12619. [DOI] [PMC free article] [PubMed] [Google Scholar]
- 25.Tomb JF, White O, Kerlavage AR, et al. The complete genome sequence of the gastric pathogen Helicobacter pylori. Nature. 1997;388:539–547. doi: 10.1038/41483. [DOI] [PubMed] [Google Scholar]
- 26.van Doorn LJ, Figueiredo C, Sanna R, Pena S, Midolo P, Ng EKW, Atherton JC, Blaser MJ, Quint WGV. Expanding allelic diversity of Helicobacter pylori vacA. J Clin Microbiol. 1998;36:2597–2603. doi: 10.1128/jcm.36.9.2597-2603.1998. [DOI] [PMC free article] [PubMed] [Google Scholar]
- 27.Wang HJ, Kuo CH, Yeh AAM, Chang PCL, Wang WC. Vacuolating cytotoxin production in clinical isolates of Helicobacter pylori with different vacA genotypes. J Inf Dis. 1998;178:207–212. doi: 10.1086/515600. [DOI] [PubMed] [Google Scholar]
- 28.Wang Y, Roos KP, Taylor DE. Transformation of Helicobacter pylori by chromosomal metronidazole resistance and by a plasmid with a selectable chloramphenicol resistance marker. J Gen Microbiol. 1993;139:2485–2493. doi: 10.1099/00221287-139-10-2485. [DOI] [PubMed] [Google Scholar]