Abstract
A pattern based recognition approach was developed for the rapid determination of identity, concentration, and enantiomeric excess of chiral vicinal diols, specifically threo diols. A diverse enantioselective sensor array was generated using three chiral boronic acid receptors and three pH indicators. The optical response produced by the sensor array was analyzed by two pattern recognition algorithms: principal component analysis and artificial neural networks. Principle component analysis demonstrated good chemoselective and enantioselective separation of the analytes, and an artificial neural network was used to accurately determine the concentration and enantiomeric excess of five unknown samples with an average absolute error of ± 0.08 mM in concentration and 3.6% in enantiomeric excess. The speed of the analysis was enhanced by using a 96-well plate format, which portents to applications in high-throughput screening for asymmetric catalyst discovery. X-ray crystallography and 11B NMR was utilized to study the enantioselective nature of boronic acid host-2.
Keywords: Enantioselectivity, High-throughput screening, Host-guest system, Indicator displacement assay, Principal component analysis, Artificial neural networks
INTRODUCTION
Animals are constantly surveying their external environment via their olfactory system for chemicals that indicate food sources and habitats, as well as chemical signals controlling social interactions and reproductive behavior.1 The olfactory system involves a recognition protocol where the detectors/sensors generate a pattern that is recognized and classified by the brain.2 Inspired by the olfactory system, the use of multivariate data analysis combined with sensors of partially overlapping selectivity has become a powerful tool in the field of molecular recognition.3-21
In an analogous fashion, a novel optical recognition scheme is described here for the rapid determination of the identity, enantiomeric excess (ee), and concentration ([G]t) of chiral vicinal diols particularly threo diols of close structural similarity. The differential receptors are chiral boronic acids, which are responsible for the sensors’ chemoselective and enantioselective discriminatory properties. The signaling relies upon indicator displacement assays (IDAs) to provide a colorimetric response. The assay was developed by using combinations of three differential receptors and three different indicators within a single array, which resulted in fingerprinting of each diol analyzed.
Indicator displacement assays rely on colorimetric or fluorescence indicators that reversibly interact with a receptor and, upon binding to the receptor, undergo change in their optical properties. A competition between the analyte and the indicator for the binding site of the receptor generates an equilibrium in solution that can be monitored optically and related to [G]t.22 Our group has pioneered the development of enantioselective indicator displacement assays that utilize a chiral receptor and where the color change is related to ee and [G]t.23,24
The data generated by the sensor arrays is commonly processed by unsupervised and supervised pattern recognition algorithms. A major unsupervised technique is principle component analysis (PCA), while an artificial neural network (ANN) is a supervised technique. PCA reduces multidimensional and partly correlated data to two, three or more dimensions. This is achieved by projecting the data onto fewer dimensions that represent maximum variance relationships between variables.25 ANN programs are based on a simplified model of the brain. ANN requires a training set that consists of a collection of known parameters. The training set then creates a neural network suitable for the analysis in hand. This network is then used to analyze unknown samples.26,27
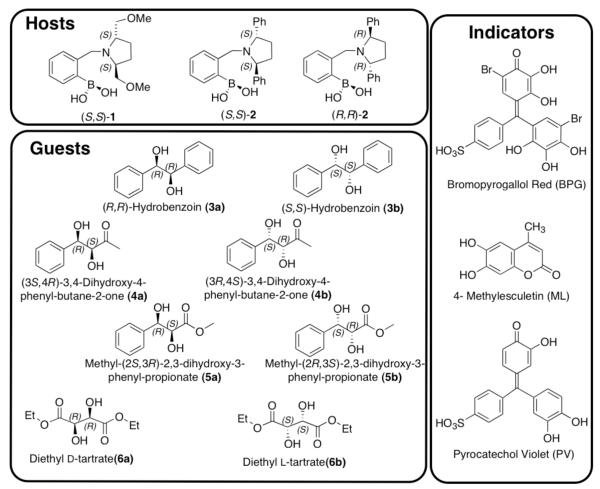
The goal of the present study was to demonstrate the ability to distinguish chirality as well chemical identity of subtly different analytes; therefore, diols 3-6 were selected as targets (Scheme 1). Analyte 3 has two phenyl groups, in contrast to 4 and 5, which contains only one. Analytes 4 and 5 differ in a ketone relative to an ester, respectively. Lastly, analyte 6 has two esters. Hence, we are challenging our array approach by using four analytes and their enantiomers, all possessing electron withdrawing groups of only subtle difference.
Scheme 1.
Structures of hosts, guests/analytes and indicators used in this study.
Our previous studies have shown that the use of cross-reactive sensors in a single array enhances the fingerprinting of the analytes, allowing one to determine structural similarities and chirality simultaneously.28 Furthermore, increasing the enantioselectivity of the receptors improves chiral discrimination. Due to previous results that showed that C2-symmetric chiral secondary amines on the boronic acid give excellent enantioselectivity, host-1 was chosen.29 With this guiding principle we now introduce host-2, which is also C2-symmetric about the pyrrolidine ring (Scheme 1). The aim was to develop a second highly enantioselective host that can be used in conjunction with host-1 in our pattern recognition protocol.
The use of an additional chiral receptor could allow for concentration as well as ee determination. In our previous studies, an achiral receptor has been consistently used to determine concentration.30 In the senses of taste and smell, however, the suites of receptors used are all chiral by virtue of their proteins structure. Yet, both handedness and relative concentrations of tastants and odorants can be determined. Hence, another goal of the work described herein was to show that a suite of chiral synthetic receptors could do the same. Further, in this study we explore the reason behind the enantioselectivities of the host-2 via x-ray crystallography and 11B NMR.
RESULTS AND DISCUSSION
Synthesis
Host-1 and host-2 were synthesized by reductive amination according to a published literature procedure.31 The diols used in this analysis are commercially available except for 4, which was synthesized by a previously established Sharpless asymmetric dihydroxylation reaction.32 Diol (3S,4R)-3,4 dihydroxy-4-phenyl-butane-2-one (4a) was isolated in 70% yield and 93% ee while (3R,4S)-3,4 dihydroxy-4-phenyl-butane-2-one (4b) was obtained in a 76% yield and 86 % ee. The ee of 4a and 4b were determined by using the James, et al. NMR analysis (Figure S7).33
X-ray Crystallographic Analysis
To study the enantioselective behavior of our boronic acid hosts, an x-ray quality crystal of host (R,R)-2 with (S,S)-hydrobenzoin (3b) was isolated by diffusing methanol into a concentrated solution of the complex in dichloromethane (Figure 1). Previously, our group has analyzed the free boronic acid host o-(pyrrolidin-1-ylmethyl)phenylboronic acid and its complexes with catechol by x-ray crystallography.34 It was shown that in these complexes the presence of the N-B bond is solvent dependent. An aprotic solvent (CHCl3) facilitates the formation of the N-B bond, while in protic solvent (CH3OH) a solvolysis pathway is operative. When complex 7 was crystallized from methanol, instead of the expected solvent inserted structure, the boron atom was found to be sp2 hybridized. The average B-O bond length is 1.36Å and the O-B-O angle of the cyclic (S,S)-hydrobenzoin boronate is 113.23°. As expected in such a case, there is no intramolecular B-N bond; instead an N-B distance of 4.43Å is observed. The optimal distance for an N-B bond is 1.5-1.8Å as reported for other boronic acid molecules with similar configurations.35,36 The absence of the solvent inserted structure could be due to the more sterically inaccessible nitrogen lone pair in the tertiary amine of host (R,R)-2; as we have recently found in another sterically congested system.37 Interestingly, the 11B NMR profile of the complex in CD3OD indicates that the boron atom is solvated in solution (see next section). Therefore, there is a discrepancy between the structure of the complex in solid state and in solution.
Figure 1.
Left: Crystal structure of host (R,R)-2 complex with (S,S)-hydrobenzoin (3b). Right: ChemDraw representation of the crystal structure (7).
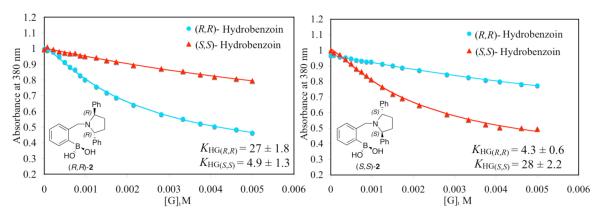
Nevertheless, the crystal structure does lend insight into the enantioselectivity of host-2. The indicator displacement isotherm for host (R,R)-2 and host (S,S)-2 with 3a and 3b using ML (Scheme 1) as an indicator is shown in Figure 2. As required by the principal of chirality, the enantiomeric hosts show opposite enantioselectivity for enantiomeric guests. As shown, host (R,R)-2 has a lower affinity for 3b than 3a. This can be explained through the crystal structure in which the phenyl group on the pyrrolidine ring of the host (R,R)-2 has an unfavorably steric interaction with the phenyl group of 3b. This unfavorable interaction would not be present in the complex of host (R,R)-2 and 3a.
Figure 2.
Enantioselective indicator displacement assay (eIDA) of host-2 (440 μM) /ML (75 μM) with (R,R)-hydrobenzoin and (S,S)-hydrobenzoin. All titrations were carried out in 100% MeOH, 10 mM para-toluenesulfonic acid and Hunig’s base buffer, pH 7.4, association constant KHG (102 M-1). All measurements were taken at 25°C. The solid lines are calculated curves resulting from iterative data fitting for a displacement assay.38
Structural Characterization in Solution by 11B NMR
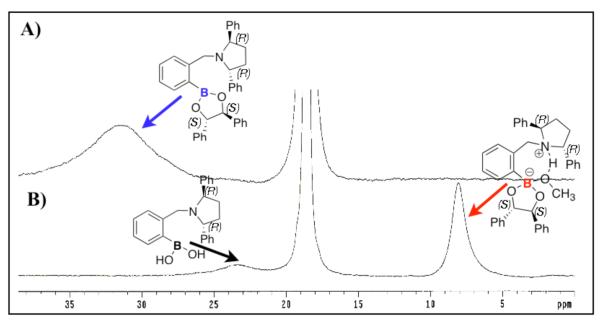
Structural studies using 11B NMR were carried out to investigate the effect of the solvent on the nature of the N-B interaction of complex 7 in solution. The 11B NMR chemical shift is dependent on hybridization, charge, coordination, and the substitutents present on the boron. Therefore, useful information about the structure of the molecule can be obtained by 11B NMR analysis. The 11B NMR signals of the complex and the receptor are assigned based on the comparison with our previous analysis of the o-(N,N-dialkylaminomethyl)arylboronate system.34
The sample of crystals used to obtain the x-ray structure of complex 7 displays one 11B signal at 31.3 ppm in CDCl3 (Figure 3A). The signal at 31.3 ppm is assigned to the trigonal planar boron species with no N-B bond. However, in CD3OD (Figure 3B), the same set of crystals of complex 7 shows two peaks. The major peak (~90%) at 8.1 ppm is assigned to the fully solvated sp3 hybridized boron species of complex 7 in solution. While, the minor signal (~20%) at 23.3 ppm corresponds to the 11B NMR signal of the free host-2 in methanol (See Supplementary Information).
Figure 3.
11B NMR spectra of complex 7 CDCl3 (A) and CD3OD (B). The signal at 18.6 ppm is the external standard trimethyl borate.
Host-2 by itself has a chemical shift of 28.8 ppm in CDCl3 and 23.3 ppm in CD3OD. The signal at 28.8 ppm was assigned to the trigonal planar boron in CDCl3. The signal at 23.3 ppm in CD3OD could not be assigned to a single boron species in solution because previously, we have determined that in o-(N,N-dialkylaminomethyl)arylboronate system the N-B coordinated species has a chemical shift of ~ 14 ppm. We postulate that there is a fast exchange between the solvent inserted sp3 hybridized boron and the sp2 hybridized boron of host-2 in methanol. Therefore, the signal at 23.3 ppm could not be assigned to a single structure of host-2 in methanol.
As expected, complex 7 exist as the B-sp3 hybridized solvated species in CD3OD with a chemical shift of 8.1 ppm. However, the crystal structure shows the presence of the B-sp2 hybridized species of complex 7. In order to explain this discrepancy we hypothesize that there is an equilibrium between the solvent inserted sp3 hybridized boron and sp2 hybridized boron of complex 7 in solution, but the sp2 hybridized species of complex 7 is what crystallizes out of solution.
In summary, we have studied for the first time the origin of enantioselectivity in our boronic acid based receptors, and a clear steric clash is seen in the unfavorable complex (Figure 1). Insight on the structure of the complex 7 in different solvent systems was also achieved. Complex 7 is B-sp2 hybridized in CDCl3 while there is an equilibrium between the sp3 solvent inserted boron and sp2 hybridized boron in CD3OD.
Generating a Chemo- and Enantioselective Array
Before creating our pattern based recognition procedures, we needed to establish the proper pairings of hosts and indicators to best enantiodifferentiate the chiral diol target, as described below. However, we first determined binding constants of the hosts with indicators because we have found that the optical response of an enantioselective IDA is best when the host is about 90% saturated with an indicator.29 Six catechol based indicators were used in the study described herein: alizarin (A), alizarin complexone dihydrate (AC), bromopyrogallol red (BPG), 4-methylesculetin (ML), pyrogallol red (PG), and pyrocatechol violet (PV). Host-1 has been studied previously, and thus the ratio to achieve 90% of saturated host-1 with each of the six indicators was calculated from literature binding constants.30 The binding constants for the indicators with host-2 are given in Table 1 (Figures S1-S6).
Table 1.
Binding constant KHI (104 M-1) of the host (S,S)-2 with the indicators.
| Indicators | A | AC | BPG | ML | PG | PV |
|---|---|---|---|---|---|---|
| (S,S)-2 | 8.42±1.76 | 6.41±2.21 | 191±131 | 3.61±0.13 | 1.02±00.7 | 1.36±0.02 |
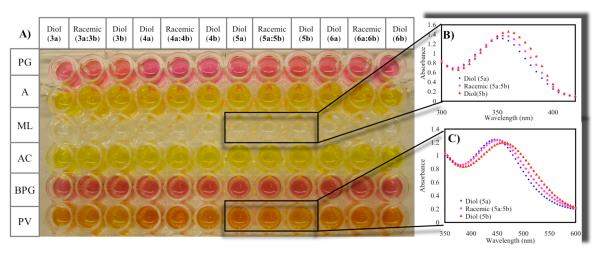
To establish the optimal host:indicator pairings for enantiodiscrimination, we screened host and indicator duos for colorimetric differences between the diol analytes. The concentration of each host that yields 90% saturation with each indicator was used in a 96-well plate (Table S1). The receptor/indicator pairs were treated with the diols, (Figure 4) such that the concentration of the diol was 5mM. The results of these plates identified three combinations: host-1:PV, host-2:PV and host-2:ML as good host:indicator duos for enantiomeric discrimination for all the diols, showing a ΔAbs > 0.05 (Table 2-3). Host-1:BPG also shows good discrimination, with ΔAbs of 0.23 and ΔAbs of 0.16, between the enantiomers of 3 and 5 respectively, but the discrimination is poor for the enantiomers of diols 4 and 6. This process allows us to rapidly identify the best host-indicator combination for the enantiodiscrimination of each chiral diol, and eliminates the need to carry out UV-vis titrations of each chiral diol with each host and indicator combination. The total number of UV-titrations that were circumvented is 96 as there are 8 diols, 2 host and 6 indicators.
Figure 4.
A) Method used to screen for host (R,R)-2 with indicators: pyrogallol red (PG), alizarin (A), 4-methylesculetin (ML), alizarin complexone dihydrate (AC), bromopygallol red (BPG), and pyrocatechol violet (PV). The concentration of the indicators and the host are listed in Table S1. (R,R)-hydrobenzoin (3a), (S,S)-hydrobenzoin (3b), (3S,4R)-2,3-dihydroxy-4-phenyl-butane-2-one (4a), (3R,4S)-2,3-dihydroxy-4-phenyl-butane-2-one (4b), methyl(2S,3R)-2,3-dihydroxy-3-phenyl-propionate (5a), methyl(2R,3S)-2,3-dihydroxy-3-phenyl-propionate (5b), diethyl D-tartrate (6a), diethyl L-tartrate (6b) B) Absorption spectra of host (R,R)-2:ML with diol 5a;Racemic mixture (5a: 5b); diol 5b. C) Absorption spectra of host (R,R)-2:PV with diol 5a;Racemic mixture (5a:5b); diol 5b. All studies were carried out in 100% MeOH, 10 mM buffered solution of Hunig’s base and para-toluenesulfonic acid to pH 7.4 at 25°C.
Table 2.
Screening plate results. Δ Abs between the enantiomeric guests (5 mM) with host (S,S)-1 and the indicators calculated for: A at 450 nm, AC at 550 nm, ML at 380 nm, BPG at 570 nm, PG at 520 nm and PV at 520 nm.
| Indicators | Diol (3) | Diol (4) | Diol (5) | Diol (6) |
|---|---|---|---|---|
| A | 0.007 | 0.035 | 0.024 | 0.007 |
| AC | 0.026 | 0.025 | 0.008 | 0.014 |
| BPG | 0.233 | 0.054 | 0.119 | 0.038 |
| ML | 0.145 | 0.061 | 0.102 | 0.043 |
| PG | 0.031 | 0.031 | 0.030 | 0.007 |
| PV | 0.107 | 0.080 | 0.072 | 0.057 |
Table 3.
Screening plate results. Δ Abs between the enantiomeric guests (5 mM) with host (R,R)-2 and the indicators calculated for: A at 450 nm, AC at 550 nm, ML at 380 nm, BPG at 570 nm, PG at 520 nm and PV at 520 nm.
| Indicators | Diol (3) | Diol (4) | Diol (5) | Diol (6) |
|---|---|---|---|---|
| A | 0.176 | 0.092 | 0.158 | 0.043 |
| AC | 0.161 | 0.042 | 0.107 | 0.002 |
| BPG | 0.251 | 0.046 | 0.156 | 0.018 |
| ML | 0.357 | 0.208 | 0.352 | 0.126 |
| PG | 0.005 | 0.010 | 0.031 | 0.112 |
| PV | 0.216 | 0.166 | 0.232 | 0.139 |
Principal Component Analysis (PCA)
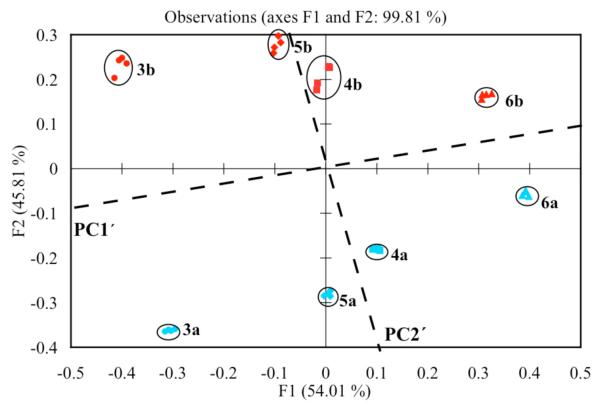
Our first goal was to demonstrate chemo and enantioselective discrimination of our analytes. As identified by the screening, our assay utilized three host:indicator combinations: (S,S)-1:PV, (R,R)-2:ML, and (S,S)-2:PV. Each diol at 5 mM concentration was treated with these three host:indicator combinations. The experiment was repeated four times to ensure reproducibility. A full spectrum of each sample was recorded, and the data was analyzed at nine different wavelengths: (496, 500, 516 nm) for host (S,S)-1:PV, (362, 366, 374 nm) for host (R,R)-2:ML, and (496, 500, 516 nm) for host (S,S)-2:PV (Table S2). These wavelengths were chosen based on the largest change in absorbance. The XLSTAT computer program was use to generate a PCA plot, which showed excellent discrimination for all the diols and their enantiomers (Figure 5). Tight clustering of identical samples and good spatial resolution for all the analytes was achieved. A slight rotation of the PCA axes showed chemoselectivity separated along PC1′, while chirality is correlated along PC2′. Guests with S stereochemistry on the stereocenter near the phenyl (or ester of 6) have positive scores along PC2′, while those with R stereochemistry have negative scores. Furthermore, the extent of enantioselectivity of the sensor array ((S,S)-1:PV, (R,R)-2:ML, and (S,S)-2:PV) to the diols is also graphed on the PCA plot. As shown, the enantiomers of diol 3 are farthest apart with respect to PC2′ as compared to the other diols, meaning that the array best discriminates the enantiomers of diol 3. The enantiomers of diol 6, however, are closer together with respect to PC2′ and they are not as well discriminated by the array. This result is supported by the screening plate analysis where the largest Δ Abs is observed between the enantiomers of diol 3 with (S,S)-1:PV, (R,R)-2:ML, and (S,S)-2:PV combinations as compared to the other diols. Therefore, the PCA plot also graphically displays how well each diol is enantiomerically discriminated by the array.
Figure 5.
PCA of the enantiomers of the four diols analyzed with host (S,S)-1:PV host (R,R)-2:ML, and host (S,S)-2:PV. The diols are labeled on the PCA plot. All studies were carried out in 100% MeOH, 10 mM buffered solution of Hunig’s base and para-toluenesulfonic acid to pH 7.4 at 25 °C.
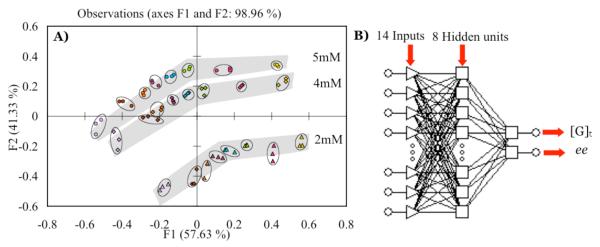
Having found excellent chemo and enantioselectivity, the next goal was to explore the ability to simultaneously determine [G]t and ee. For this purpose, we arbitrarily chose diol 5, while using the three different host indicator combinations. The earlier screening experiment discussed above for diol 5 determined that the best enantiomeric discrimination between 5a and 5b was achieved by host-1:BPG (Δ Abs 0.119), host-2:ML (Δ Abs 0.352) and host-2:PV (Δ Abs 0.232). Thus, ee titrations of diol-5 with only these three combinations of host and indicators were carried out at three different concentrations (2 mM, 4 mM and 5 mM) and eight different ee values (−1.0, −0.6, −0.2, 0, 0.2, 0.4, 0.6, 1.0), where 1.0 is 100% 5a and −1.0 is 100% 5b. Each ee titration was carried out at one concentration, and repeated three times. The data set consisting of wavelengths (570, 572, 574, 576, 578 nm) for host (S,S)-1:BPG, (512, 514, 516, 518 nm) for host (S,S)-2:PV, and (376, 378, 380, 382, 384 nm) for host (R,R)-2:ML was analyzed using PCA (Table S3). Good spatial resolution was obtained in the PCA plot showing clustering of identical samples and spatial resolution of concentration and ee (Figure 6A). The data sets of varying ee values at the same concentration were clustered together in smooth curves in Figure 6A. Ee values range within the stripe from +1 to −1 left to right respectively (See legend of Figure 6A). In this analysis we did not have to use an achiral host to determine concentration of analytes in contrast to our previous studies. Using data from different host and indicator combinations enabled us to eliminate the achiral host from our sensor array, thus simplifying the analysis.23
Figure 6.
A) PCA of diol 5 ee titration at three different concentrations △: 2 mM, ◇: 4 mM, ○: 5 mM. ee, yellow: −1, pink: −0.6, green: −0.2, blue: 0, red: 0.2, orange: 0.4, brown: 0.6, purple: 1, where 1 is 100% methyl(2S,3R)-(-)-2,3-dihydroxy-3-phenylpropionate (5a) and −1 is 100% methyl(2R,3S)-(-)-2,3-dihydroxy-3-phenylpropinate (5b) B) Multilayer perceptron (MLP) artificial neural network generated for the determination of ee and analyte total concentration ([G]t). All studies were carried out in 100% MeOH, 10mM buffered solution of Hunig’s base and para-toluenesulfonic acid to pH 7.4 at 25°C.
Artificial Neural Network (ANN) Analysis
The last goal was to analyze unknown samples for concentration and ee. A neural network was generated by using the same data set that was used to generate the PCA plot for diol 5, but now as an ANN training set (Figure 6B). The repetitive data was not included in the training set as ANN does not work well with redundant values. Statistica Neural Network software was used to develop the ANN. It has an embedded intelligent problem solver (IPS) function that automatically generates several networks that are suitable for the designated problem at hand. The input layer contains the absorbance of each ee titration giving a total of 14 absorbance values. The outputs are [G]t and % 5a. ANN does not work well with negative values, therefore % 5a was used instead of ee values. A multilayered perceptron (MLP) network with 14 inputs, 8 processing units in the hidden layer, and 2 outputs was selected for our analysis. The network was trained by back-propagation algorithms, which minimize the discrepancy between the input and the outputs. True unknown samples, prepared completely independent of the training set were then treated with the same sensor array and their [G]t and % 5a values were predicted by the network (Tabel S4). The % 5a values predicted by the network were converted to ee and are listed in Table 4. The average absolute error for [G]t was ± 0.08 mM and for ee was 6.72%. The ee error is high because of a single outlier that has an ee error of 19.38%. Without including the outlier, the average absolute error in ee drops to 3.57%. The ee error can be further reduced by using a larger training set as shown previously by our group.30
Table 4.
Artificial Neural Network Analysis of unknown solutions
| [G]t mM | ANN [G]t mM | Error [G]t ± mM | % ee | ANN % ee | Error % ee |
|---|---|---|---|---|---|
| 3.00 | 3.07 | 0.07 | 50.00 | 69.38 | 19.38 |
| 3.00 | 3.04 | 0.04 | 30.00 | 33.10 | 3.10 |
| 3.00 | 3.05 | 0.05 | 10.00 | 8.47 | 1.53 |
| 3.00 | 3.04 | 0.04 | −30.00 | −20.64 | 9.36 |
| 3.00 | 2.79 | 0.21 | −50.00 | −50.27 | 0.27 |
Overall, the time required for this entire analysis from screening, to training, to analysis by ANN and PCA, required approximately 24 hrs of work. The method is very rapid once an ANN network has been developed by using a training set for a particular analyte. The concentration and ee values of 96 unknown samples can be determined in 40 mins, as it take 30 min for the pipetting system to load a 96-well plate with the host, indicator, and unknown solutions, and 10 min for the 96-well plate reader to record the absorbances of 96 unknown samples at five different wavelengths needed for the ANN analysis. The absorbance data of unknown samples can be channeled to the developed ANN, which in real time gives the concentration and ee of unknown samples. In effect, this assay is a powerful tool which we are now transitioning to a high-throughput study to determine identity, [G]t, and ee of unknown samples of chiral vicinal diols.
CONCLUSION
We have described a technique that fingerprints chemical identity, concentration, and chirality of chiral vicinal diols. Pattern recognition protocols were used to analyze the data. Excellent fingerprinting was obtained where the diols are chemoselectively and enantioselectively separated. This was achieved by using a diverse sensor array made up of different host and indicator combinations. We have also shown that a highly enantioselective array that does not require the presence of an achiral boronic acid host can be used to calculate concentration of unknown samples. A family of chiral hosts and indicator combinations with ANN can provide both concentration and ee values of unknown samples with high accuracy. In addition, a new enantioselective boronic acid host-2 has been designed and synthesized in one step that showed excellent enantioselectivity for several chiral vicinal diol. To study the enantioselective behaviour of our boronic acid host, we solved an x-ray structure of host (R,R)-2 with (S,S)-hydrobenzoin (3b) (complex 7). Studies of the solution phase behaviour of the complex by 11B NMR lent some insight on the enantioselective behaviour of host-2 and suggests that the hybridization of the boronic acid species depends both on the solvent and the substrate, but also depends on the structure of the boronic acid receptor.
Supplementary Material
ACKNOWLEDGEMENT
We gratefully acknowledge support from NIH (5 RO1 GM077437) and the Welch Foundation (F-1151) for funding of this work.
Footnotes
SUPPORTING INFORMATION. Spectroscopic data of the host (S,S)-2 with the indicators, UV/vis data for PCA and ANN; Crystallographic information file (CIF) of complex 7; 11B NMR of host (R,R)-2 and complex 7 is available free of charge via the Internet at http://pubs.acs.org.
REFERENCES
- (1).Breer H, Fleischer J, Strotmann J. Cell. Mol. Life Sci. 2006;63:1465–1475. doi: 10.1007/s00018-006-6108-5. [DOI] [PMC free article] [PubMed] [Google Scholar]
- (2).Doty RL. Handbook of Olfaction and Gustation. 2nd ed Marcel Dekker; New York: 2003. [Google Scholar]
- (3).Janes LE, Lowendahl AC, Kazlauskas RJ. Chem. Eur. J. 1998;4:2324–2331. [Google Scholar]
- (4).Badalassi F, Klein G, Crotti P, Reymond J-L. Eur. J. Org. Chem. 2004;2004:2557–2566. [Google Scholar]
- (5).Ruta J, Ravelet C, Baussanne I, Decout J-L, Peyrin E. Anal. Chem. 2007;79:4716–4719. doi: 10.1021/ac070469d. [DOI] [PubMed] [Google Scholar]
- (6).Simeonov A, Masayuki Matsushita, Juban EA, Thompson EHZ, Hoffman TZ, IV AEB, Taylor MJ, Wirsching P, Rettig W, McCusker JK, Stevens RC, Millar DP, Schultz PG, Lerner RA, Janda KD. Science. 2000;290:307. doi: 10.1126/science.290.5490.307. [DOI] [PubMed] [Google Scholar]
- (7).Johnson SR, Sutter JM, Engelhardt HL, Jurs PC, White J, Kauer JS, Dickinson TA, Walt DR. Anal. Chem. 1997;69:4641–4648. [Google Scholar]
- (8).Rakow NA, Suslick KS. Nature. 2000;406:710. doi: 10.1038/35021028. [DOI] [PubMed] [Google Scholar]
- (9).Lavigne JJ, Anslyn EV. Angew. Chem., Int. Ed. 2001;40:3118–3130. doi: 10.1002/1521-3773(20010903)40:17<3118::AID-ANIE3118>3.0.CO;2-Y. [DOI] [PubMed] [Google Scholar]
- (10).Wiskur SL, Floriano PN, Anslyn EV, McDevitt JT. Angew. Chem., Int. Ed. 2003;42:2070–2072. doi: 10.1002/anie.200351058. [DOI] [PubMed] [Google Scholar]
- (11).Zhou H, Baldini L, Hong J, Wilson AJ, Hamilton AD. J. Am. Chem. Soc. 2006;128:2421–2425. doi: 10.1021/ja056833c. [DOI] [PubMed] [Google Scholar]
- (12).Palacios MA, Nishiyabu R, Marquez M, Anzenbacher P., Jr. J. Am. Chem. Soc. 2007;129:7538–7544. doi: 10.1021/ja0704784. [DOI] [PubMed] [Google Scholar]
- (13).Nieto S, Lynch VM, Anslyn EV, Kim H, Chin J. J. Am. Chem. Soc. 2008;130:9232–9233. doi: 10.1021/ja803443j. [DOI] [PMC free article] [PubMed] [Google Scholar]
- (14).Ponnu A, Edwards NY, Anslyn EV. New J. Chem. 2008;32:848–855. [Google Scholar]
- (15).Reetz MT, Zonta A, Schimossek K, Leibeton K, Jaeger K-E. Angew. Chem., Int. Ed. 1997;36:2830–2832. [Google Scholar]
- (16).Masayuki Matsushita, Yamamoto KYN, Wirsching P, Lerner RA, Janda KD. Angew. Chem., Int. Ed. 2003;42:5984–5987. doi: 10.1002/anie.200352793. [DOI] [PubMed] [Google Scholar]
- (17).Dey S, Karukurichi KR, Shen W, Berkowitz DB. J. Am. Chem. Soc. 2005;127:8610–8611. doi: 10.1021/ja052010b. [DOI] [PubMed] [Google Scholar]
- (18).Abato P, Seto CT. J. Am. Chem. Soc. 2001;123:9206–9207. doi: 10.1021/ja016177q. [DOI] [PubMed] [Google Scholar]
- (19).Li Z-B, Lin J, Qin Y-C, Pu L. Org. Lett. 2005;7:3441–3444. doi: 10.1021/ol0510163. [DOI] [PubMed] [Google Scholar]
- (20).Eelkema R, van RA, Feringa DBL. Angew. Chem., Int. Ed. 2004;43:5013–5016. doi: 10.1002/anie.200460822. [DOI] [PubMed] [Google Scholar]
- (21).Taran F, Gauchet C, Mohar B, Meunier S, Valleix A, Renard PY, Creminon C, Grassi J, Wagner A, Mioskowski C. Angew. Chem., Int. Ed. 2002;41:124–127. doi: 10.1002/1521-3773(20020104)41:1<124::aid-anie124>3.0.co;2-r. [DOI] [PubMed] [Google Scholar]
- (22).Nguyen BT, Anslyn EV. Coord. Chem. Rev. 2006;250:3118–3127. [Google Scholar]
- (23).Zhu L, Shabbir SH, Anslyn EV. Chem. Eur. J. 2007;13:99–104. doi: 10.1002/chem.200600402. [DOI] [PubMed] [Google Scholar]
- (24).Leung D, Anslyn EV. J. Am. Chem. Soc. 2008;130:12328–12333. doi: 10.1021/ja8038079. [DOI] [PMC free article] [PubMed] [Google Scholar]
- (25).Jurs PC, Bakken GA, McClelland HE. Chem. Rev. 2000:2649–2678. doi: 10.1021/cr9800964. [DOI] [PubMed] [Google Scholar]
- (26).Jansson PA. Anal. Chem. 1991;63:357A–362A. [Google Scholar]
- (27).Burns JA, Whitesides GM. Chem. Rev. 1993;93:2583–2601. [Google Scholar]
- (28).Folmer-Andersen JF, Kitamura M, Anslyn EV. J. Am. Chem. Soc. 2006;128:5652–5653. doi: 10.1021/ja061313i. [DOI] [PubMed] [Google Scholar]
- (29).Zhu L, Zhong Z, Anslyn EV. J. Am. Chem. Soc. 2005;127:4260–4269. doi: 10.1021/ja0435945. [DOI] [PubMed] [Google Scholar]
- (30).Shabbir SH, Regan CJ, Anslyn EV. Proc. Natl. Acad. Sci. U.S.A. 2009;106:10487–10492. doi: 10.1073/pnas.0809530106. [DOI] [PMC free article] [PubMed] [Google Scholar]
- (31).Zhu L, Anslyn EV. J. Am. Chem. Soc. 2004;126:3676–3677. doi: 10.1021/ja031839s. [DOI] [PubMed] [Google Scholar]
- (32).Walsh PJ, Sharpless KB. Synlett. 1993:605–606. [Google Scholar]
- (33).Kelly AM, Perez-Fuertes Y, Arimori S, Bull SD, James TD. Org. Lett. 2006;8:1971–1974. doi: 10.1021/ol0602351. [DOI] [PubMed] [Google Scholar]
- (34).Zhu L, Shabbir SH, Gray M, Lynch VM, Sorey S, Anslyn EV. J. Am. Chem. Soc. 2006;128:1222–1232. doi: 10.1021/ja055817c. [DOI] [PubMed] [Google Scholar]
- (35).Wiskur SL, Lavigne JJ, Ait-Haddou H, Lynch VM, Chiu YH, Canary JW, Anslyn EV. Org. Lett. 2001;3:1311–1314. doi: 10.1021/ol0156805. [DOI] [PubMed] [Google Scholar]
- (36).Wiskur SL, Lavigne JJ, Matzger A, Tobey SL, Lynch VM, Anslyn EV. Chem. Eur. J. 2004;10:3792–3804. doi: 10.1002/chem.200305737. [DOI] [PubMed] [Google Scholar]
- (37).Collins BE, Sorey S, Hargrove AE, Shabbir SH, Lynch VM, Anslyn EV. J. Org. Chem. 2009;74:4055–4060. doi: 10.1021/jo900187a. [DOI] [PubMed] [Google Scholar]
- (38).Connors KA. Binding Constant, The Measurment of Molecular Complex Stability. John Wiley and Sons; New York: 1987. [Google Scholar]
Associated Data
This section collects any data citations, data availability statements, or supplementary materials included in this article.


