

Summary
Kinetoplast DNA (kDNA), the trypanosome mitochondrial DNA, contains thousands of minicircles and dozens of maxicircles interlocked in a giant network. Remarkably, Trypanosoma brucei's genome encodes eight PIF1-like helicases, six of which are mitochondrial. We now show that TbPIF2 is essential for maxicircle replication. Maxicircle abundance is controlled by TbPIF2 level, as RNAi of this helicase caused maxicircle loss and its overexpression caused a 3- to 6-fold increase in maxicircle abundance. This regulation of maxicircle level is mediated by the TbHslVU protease. Previous experiments demonstrated that RNAi knockdown of TbHslVU dramatically increased abundance of minicircles and maxicircles, presumably because a positive regulator of their synthesis escaped proteolysis and allowed synthesis to continue. Here we found that TbPIF2 level increases following RNAi of the protease. Therefore this helicase is a TbHslVU substrate and the first example of a positive regulator, thus providing a molecular mechanism for controlling maxicircle replication.
Introduction
Kinetoplast DNA (kDNA), the mitochondrial genome of Trypanosoma brucei, is a giant chain mail-like network composed of several thousand minicircles topologically interlocked with a few dozen maxicircles (Liu et al., 2005a; Shlomai, 2004). The network is condensed into a disk-shaped structure, residing in a specialized region of the single mitochondrion near the flagellar basal body. The kDNA is connected to the basal body by a trans-membrane filament system known as the tripartite attachment complex (TAC) (Ogbadoyi et al., 2003). Maxicircles encode rRNAs and a few proteins (e.g. subunits of respiratory complexes). Maxicircle transcripts are edited, a process involving insertion or deletion of uridylate residues at specific sites to create an open-reading frame. Minicircles encode guide RNAs that are templates for editing (Simpson et al., 2003; Stuart et al., 2005).
kDNA replication is unusual (Liu et al., 2005a; Shlomai, 2004) and occurs during a phase of the cell cycle nearly concurrent with nuclear S-phase (Woodward and Gull, 1990). Prior to their replication, covalently-closed minicircles are released individually from the network into the kinetoflagellar zone (KFZ), a region of the mitochondrial matrix between the kDNA disk and flagellar basal body (Drew and Englund, 2001). Proteins within the KFZ trigger initiation of replication of the free minicircles. These proteins include universal minicircle sequence binding protein (UMSBP) that binds the replication origin (Abu-Elneel et al., 2001), DNA polymerases IB and IC (Klingbeil et al., 2002), primase (Li and Englund, 1997), and presumably other proteins such as a DNA helicase not yet identified. These proteins assemble a replication fork resulting in unidirectional θ-type replication. The two progeny minicircles are thought to migrate to the two antipodal sites, protein assemblies flanking the kDNA disk and positioned ∼180° apart (Ferguson et al., 1992). Within these sites are enzymes involved in later stages of minicircle replication including RNA primer removal and repair and ligation of most gaps between Okazaki fragments (Downey et al., 2005; Engel and Ray, 1998; Liu et al., 2005b; Torri and Englund, 1992). Finally, topoisomerase II, also positioned in the antipodal sites, attaches minicircle progeny, containing at least one nick or gap (hereafter we refer to these discontinuities as gaps), to the network periphery (Melendy et al., 1988; Wang and Englund, 2001). Since two minicircles attach for every one removed, the network grows in size. When double-sized, it splits in two and the remaining gaps are repaired, probably by DNA polymerase β-PAK (Saxowsky et al., 2003) and ligase kα (Downey et al., 2005), both situated within the kDNA disk. TAC mediates kDNA segregation because the separation of the basal bodies pulls the sister kinetoplasts into progeny cells.
There is little known about maxicircle replication. Maxicircles (23 kb in T. brucei) have a coding region of 15 kb and a variable region of 8 kb; the latter contains repetitive sequences that are divergent among trypanosomatids (Myler et al., 1993). Maxicircle replication initiates at an origin within the variable region and proceeds unidirectionally via θ-intermediates. Unlike minicircles, maxicircles remain linked to the network during replication (Carpenter and Englund, 1995; Hajduk et al., 1984). There is virtually no information on maxicircle replication enzymes. RNAi of mitochondrial RNA polymerase causes selective loss of maxicircles, suggesting that it may be involved (Grams et al., 2002). Finally, there is a dramatic change during the cell cycle in distribution of maxicircle loops projecting from the kDNA network periphery (Hoeijmakers and Weijers, 1980). On pre-replication and early replicating networks, the maxicircle loops distribute randomly around the network periphery. As the network elongates during replication, maxicircles concentrate in the central region. After minicircle replication is finished, and prior to segregation, the maxicircles are anchored in the center of the dumbbell-shaped double-size network. Following segregation of the daughter networks, the maxicircles redistribute around the network.
kDNA replication is regulated by TbHslVU, a mitochondrial proteasome-like protease (Li et al., 2008). RNAi of this enzyme causes a 20-fold increase in network minicircles and a 2.8-fold increase in maxicircles. Thus, TbHslVU is thought to degrade positive master regulators of minicircle and maxicircle replication at the appropriate time in the cell cycle, thereby stopping replication when these circles have doubled in copy number. When TbHslVU is knocked down, these regulators are not degraded and replication continues, causing the network to grow to enormous size. Until now, these regulators have not been identified.
Given the complexity of kDNA, many proteins must be required for its replication. Nevertheless, our previous reports that T. brucei has six mitochondrial DNA polymerases (Klingbeil et al., 2002; Saxowsky et al., 2003) was unexpected, as mitochondria in other species have only one, polymerase γ (Kaguni, 2004). Now we report another example of seemingly redundant activities of mitochondrial replication enzymes. We found that the T. brucei genome encodes 8 candidate helicases related to ScPif1p, the Saccharomyces cerevisiae mitochondrial helicase. Of these 8 proteins, named TbPIF1-8, we found that 6 are mitochondrial. We now focus on TbPIF2 and describe its remarkable role in regulating maxicircle replication.
Results
PIF1-like genes in T. brucei
Fig. S1 presents alignments of the sequences of the 8 PIF1-like helicases and describes some of their characteristics. Since 6 of the 8 TbPIFs (TbPIF1, 2, 4, 5, 7 and 8) have predicted N-terminal mitochondrial targeting sequences (analyzed by PSORT II, http://psort.nibb.ac.jp/form2.html), we expressed each protein tagged with GFP at the C-terminus. Fluorescence microscopy showed that these 6 proteins are indeed mitochondrial (Fig. S2). TbPIF1 and TbPIF2 localize throughout the tubular structure of the single mitochondrion, TbPIF4, 7 and 8 are predominantly in the kDNA disk, and TbPIF5 is enriched in the antipodal sites flanking the kDNA disk. Of the non-mitochondrial PIFs, TbPIF6 localizes in the nucleus and TbPIF3 localizes throughout the cytoplasm. As a first step in evaluating their functions, we subjected each PIF gene to RNAi, knockout, and overexpression, and Table S1 summarizes the results. Using RNAi we found that TbPIF1, 2 and 8 are essential for growth. Both alleles of TbPIF3 or TbPIF7 can be knocked out without affecting growth, indicating that they are not essential (Fig. S3). In the remainder of this paper we focus on TbPIF2 and we will report the properties of other PIFs in future publications.
Effect of TbPIF2 RNAi on growth and on kDNA
To knock down expression of TbPIF2, we used a stem-loop RNAi vector that produces dsRNA upon induction with tetracycline (Wang et al., 2000). RNAi decreased TbPIF2 mRNA by 90% after 2 days and stopped growth after 6 days (Fig. 1A).
Figure 1. Effect of TbPIF2 RNAi on trypanosome growth and kDNA abundance.
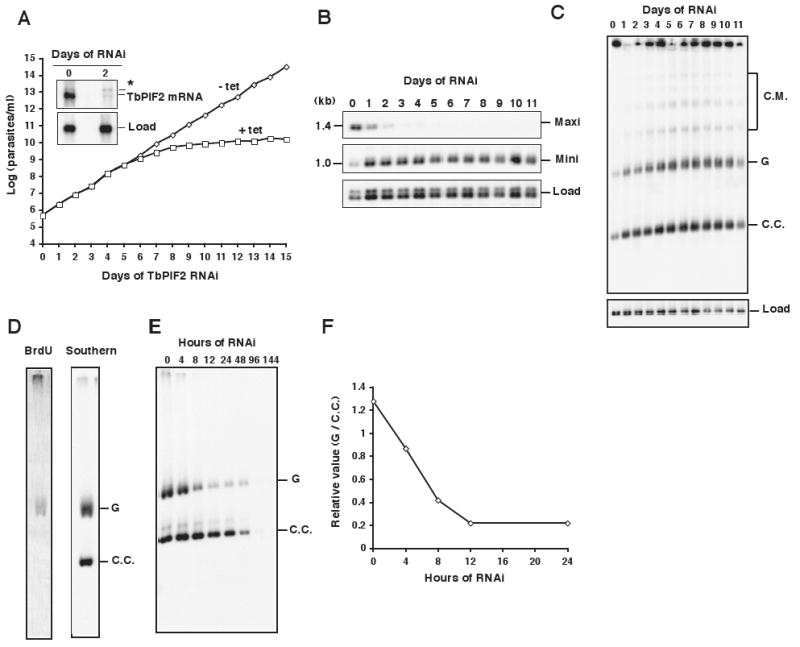
(A) Effect of TbPIF2 RNAi on cell growth. The value of parasites/ml on the y-axis is the measured value times the dilution factor. We have done this experiment many times with identical results. Inset, Northern blot of TbPIF2 mRNA (∼ 4 kb) without or with RNAi. * marks a band of unknown origin. (B) Kinetics of change in kDNA composition determined by Southern blot of total maxicircles (Maxi) and minicircles (Mini) after digestion of total DNA with restriction enzymes. The 1 kb band was the dominant species in the digest of the heterogeneous minicircles. The maxicircle probe detected only the 1.4 kb fragment. Two hexose transporter gene fragments were probed for the load control (Load). Each time point in this and other RNAi and overexpression experiments was a separate induction so that all time points could be collected on the same day; thus the gel was a composite of 12 separate experiments. (C) Southern blot showing effect of RNAi on free minicircle replication intermediates. Total DNA (106 cell equivalents/lane) was fractionated on a 1.5% agarose gel in TBE buffer (both the gel and running buffer contained 1 μg/ml ethidium bromide). C.M., catenated minicircles; G, gapped minicircles; C.C., covalently-closed minicircles. (D) Incorporation of BrdU into maxicircle species. Wild-type cells (6 ×10⁶ cells/ml) were labeled for 60 min with 50 μM BrdU (BrdU is used because tracer concentrations of [3H]thymidine are poorly taken up by procyclic trypanosomes). Isolated kDNA (from 4 × 10⁷ wild-type cells) was decatenated with topoisomerase IV, and the resulting product was fractionated on a 0.6% agarose gel. After transfer (a step including partial acid depurination, alkali treatment, and neutralization), BrdU label was detected by probing with anti-BrdU antibody (left panel). The membrane was stripped and subjected to Southern blot with a maxicircle probe (right panel). (E) Fractionation of total maxicircles. Isolated kDNA networks (1.5 × 10⁶ cell equivalents/lane) were treated with topoisomerase IV. The resulting products were fractionated on a 0.6% agarose gel in TBE buffer containing ethidium bromide (1 μg/ml) and then a Southern blot was probed for maxicircles. G, gapped maxicircles; C.C., covalently-closed maxicircles; This experiment does not have a load control because nuclear DNA was removed during the kDNA isolation and minicircles that were released from the network during decatenation ran off the gel. (F) The ratio of gapped to covalently-closed maxicircles as determined by phosphorimaging.
Since RNAi of many replication enzymes causes kDNA shrinkage and loss, we were surprised that TbPIF2 RNAi had little effect on kinetoplast size as judged by inspection of DAPI-stained cells (data not shown). In an alternative approach for measuring kDNA level, we isolated total DNA from cells each day after RNAi induction, digested each sample with Hind III/Xba I, fractionated the digests by agarose gel electrophoresis, and probed a Southern blot for fragments of minicircles and maxicircles (Fig. 1B). Maxicircles declined markedly after only 1 day of RNAi and became undetectable by day 4. In contrast, total minicircles surprisingly increased 2-3 fold during this period (determined by phosphorimaging). To study this increase in minicircles, we evaluated the effect of RNAi on free minicircle replication intermediates. We fractionated total DNA on an agarose gel in the presence of ethidium bromide. Probing a Southern blot for free minicircle species (Fig. 1C) revealed that both covalently-closed (the replication precursors) and gapped free minicircle (the progeny) also increased ∼ 2-3 times the normal level. This finding suggests that the increase in minicircle copy number is due to an increase in replication.
To further explore the effect of TbPIF2 RNAi on maxicircles, it was essential to determine whether maxicircles, like minicircles, are covalently-closed prior to replication and nicked or gapped afterwards (we will refer to maxicircle discontinuities as gaps). We decatenated networks by topoisomerase IV and then fractionated the maxicircle monomers on a 0.6% agarose-ethidium gel, conditions that separate gapped and covalently-closed maxicircles (Shapiro, 1993). To determine whether one of these species was newly replicated, we pulse-labeled cells 60 min with bromodeoxyuridine (BrdU), a thymidine analog (see Fig. 1 legend for rationale for using this DNA labeling procedure). This treatment labeled the gapped molecules but not the covalently-closed (Fig. 1D), indicating that the former are replication products and the latter are precursors. We then induced TbPIF2 RNAi and at several time points separated the covalently-closed and gapped maxicircles by gel electrophoresis. Probing a Southern blot for maxicircles revealed that gapped maxicircles decreased much more rapidly than covalently-closed (Fig. 1E and F). This experiment provided strong evidence that RNAi knockdown of TbPIF2 blocks maxicircle replication.
Effect of RNAi on network structure
We next used EM to examine networks isolated from RNAi cells. Figs. 2A, 2B show control networks from uninduced cells. The unit size network in Fig. 2A has multiple maxicircle loops extending from the network periphery. As reported previously (Hoeijmakers and Weijers, 1980), the double-size network in Fig. 2B, in a late stage of replication, has many maxicircle loops concentrated in the central region. In contrast, after 4 days of RNAi, most unit- and double-size networks do not have any detectable maxicircle loops (Figs. 2C, 2D).
Figure 2. EMs of kDNA networks.
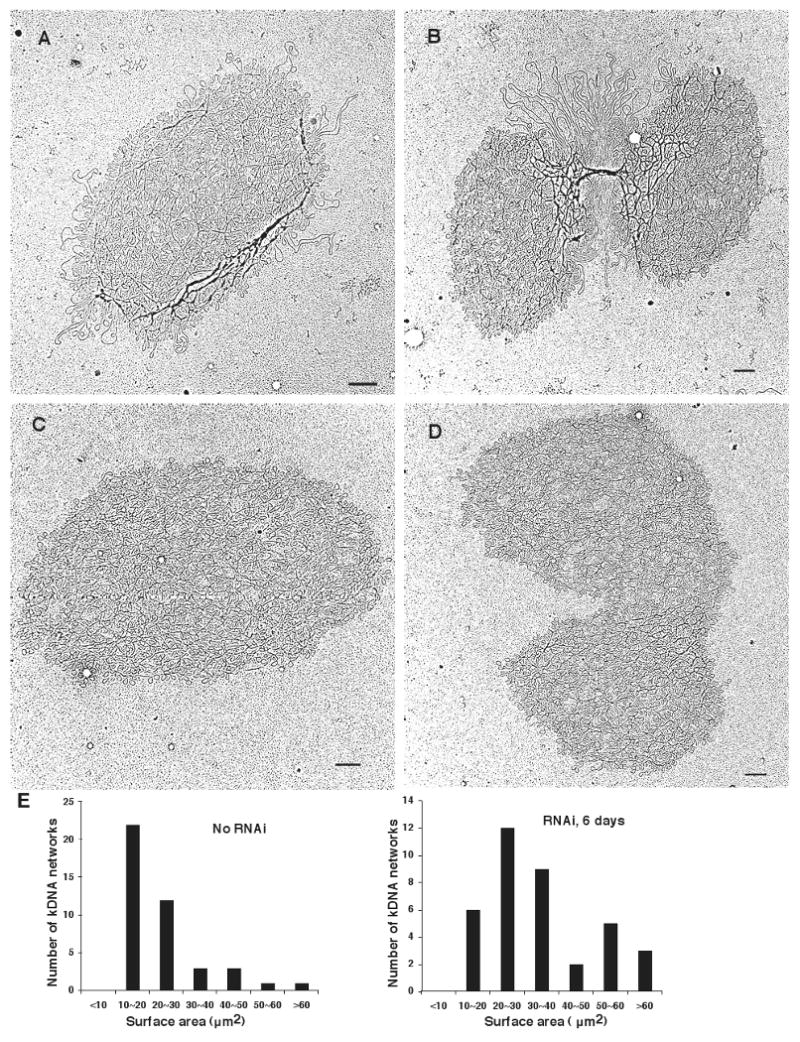
(A) and (B), kDNA isolated from wild-type cells. (C) and (D), kDNA isolated from TbPIF2 RNAi cells (4 days after induction). Networks in B and D are double-size and are undergoing segregation. Bar, 500 nm. (E) Bar graphs showing surface areas of randomly-chosen networks (including unit-size and double-size) from uninduced cells (left panel) and RNAi cells (6 days, right panel). Maxicircle loops on network periphery were not included in surface area measurement.
Consistent with the RNAi-mediated 2- to 3-fold increase in minicircle abundance (Fig. 1B), we found that the network surface areas were enlarged after 6 days of RNAi. Fig. 2E shows histograms of surface areas of randomly-chosen networks from uninduced cells and from those that had undergone RNAi for 6 days. The average size of networks in the latter population is 36.0 ± 13.7 μm2 (n=37) and that from uninduced cells is 23.3 ± 8.6 μm2 (n=42). Networks can also vary in density of minicircle packing, a parameter dependent on the average number of a minicircle's interlocked neighbors (Chen et al., 1995). We quantitated minicircle density by drawing random straight lines on enlarged EMs of isolated networks and then counting the strand crossovers per μm (Chen et al., 1995). There was no significant difference in density between networks from uninduced cells and those from RNAi cells (data not shown). From all of these data we conclude that TbPIF2 is essential for replication of maxicircles but not minicircles. In fact, RNAi causes an increase in minicircle level.
Maxicircle abundance dramatically increases after TbPIF2 overexpression
Since RNAi of TbPIF2 caused maxicircle loss, we next studied the effect of its overexpression. We used the pLew79-MHTAP overexpression vector that utilizes a tetracycline-regulated T7 promoter (Jensen et al., 2007). The northern blot in Fig. 3A (inset) shows that tetracycline induces a ∼10-fold increase in TbPIF2 mRNA 2 days after induction; note that overexpression also reduces the cell's growth rate (Fig. 3A). As in our RNAi experiment, we used a Southern blot of restriction digests of total DNA to evaluate the effect of TbPIF2 overexpression on levels of maxicircles and minicircles (Fig. 3B). Remarkably, maxicircle abundance increased about 3- to 6-fold starting at day 1 of overexpression (determined by phosphorimaging). During this period there were few if any changes in level of either total minicircles or free minicircle replication intermediates (Figs. 3B, 3C). We then compared the ratio of the gapped (replication products) to covalently-closed maxicircles (replication precursors) that had been decatenated from isolated networks by topoisomerase IV (Fig. 3D). During the first 24 h of overexpression, gapped maxicircles increased faster than covalently-closed forms (Figs. 3D, 3E), demonstrating that maxicircle replication is indeed increased after TbPIF2 overexpression.
Figure 3. Effects of TbPIF2 overexpression on minicircle and maxicircle abundance.
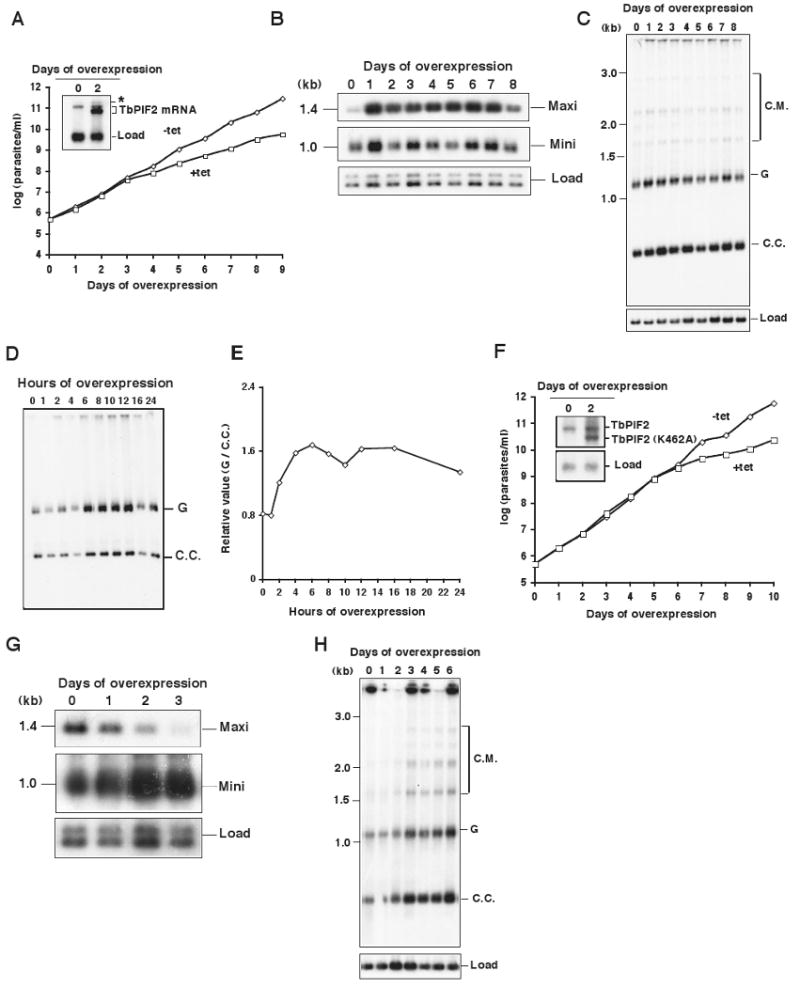
(A) Effect of TbPIF2 overexpression on cell growth. The value of parasites/ml on the y-axis is the measured value times the dilution factor. We have done this experiment many times with identical results. Inset, Northern blot of mRNA level without or with overexpression. * marks a band with unknown origin. (B) kinetics of change in kDNA composition was determined by Southern blotting of total maxicircles (Maxi) and minicircles (Mini) after digestion of total DNA (5 × 10⁵ cell equivalents/lane) with Hind III/Xba I. Load control in Panels B, C, G and H was same as in Fig. 1B. The results in Panels B and C were confirmed in a 3-day overexpression experiment. (C) Effect of TbPIF2 overexpression on free minicircle replication intermediates. The procedure and abbreviations are described in the legend of Fig. 1C. (D) Fractionation of gapped (G) and covalently-closed maxicircles (C.C.) as described in the legend of Fig. 1E. (E) Ratio of gapped to covalently-closed maxicircles as determined by phosphorimaging. (F) Effect of overexpression of TbPIF2 (K462A) on cell growth. Inset, Northern blot of mRNA level without or with overexpression. (G) Effect of TbPIF2 (K462A) overexpression on total maxicircles (Maxi) and minicircles (Mini). (H) Effect of TbPIF2 (K462A) overexpression on free minicircle replication intermediates.
We further examined gapped circles by labeling isolated kDNA networks with fluorescein-12-dUTP using terminal deoxynucleotidyl transferase (TdT). The signal detected by fluorescence microscopy is proportional to the number of gaps in minicircles or maxicircles, and we found that the percentage of TdT-positive networks increased from about 37% to 62% (Figs. S4A and B), indicating a substantial increase in networks with gapped circles. To determine if these extra gaps are in maxicircles and/or minicircles, we used fluorescence in situ hybridization (FISH) with minicircle and maxicircle probes under conditions in which only gapped circles are detectable (covalently-closed rings are non-denaturable and therefore do not hybridize). These data demonstrated that TbPIF2 overexpression increased gapped maxicircles (due to increased replication) but not gapped minicircles (Figs. S4C and D). Fig. S4C (lower row) shows an example of a cell that hybridizes only with the maxicircle probe. The non-specific fluorescence signal from the minicircle probe is due to the long exposure used. See legend of Fig. S4 for more information on this experiment.
Overexpression of a mutant helicase
To determine if the helicase activity of TbPIF2 is required for increasing maxicircle abundance or whether an inactive protein would suffice, we mutated lysine 462 in the ATP-binding domain to alanine (K462A). This residue is essential for the activity of ScPIF1 or other helicases (Hall and Matson, 1999; Zhou et al., 2000). Overexpression of this mutant for 6 days slowed cell growth, indicating that the mutant is toxic for trypanosome (Fig. 3F). In contrast to overexpression of wild type TbPIF2, which increased the maxicircle abundance, overexpression of the mutant markedly reduced the maxicircle copy number and increased the abundance of both total minicircle and free minicircle intermediates (Figs. 3G. 3H). Since this phenotype is very similar to the effects of TbPIF2 RNAi (Fig. 1A-C), it appears that the mutant TbPIF2 acts as a dominant negative, inhibiting maxicircle replication. Therefore, we conclude that enzymatic activity of TbPIF2 is required for maxicircle replication.
Effect of TbPIF2 overexpression on network structure
We next used EM to examine networks isolated from overexpressing cells. As predicted by the Southern blots in Fig. 3B, after only one day of TbPIF2 overexpression there was a massive increase in the number of maxicircle loops extending from the periphery; in addition, the network's central region, containing minicircles, was condensed (Fig. 4A). Some double-size networks, like that in Fig. 4B, had a long dense connection between the nascent sister networks (arrow in Fig. 4B) and they also have abundant maxicircle loops protruding not only from the connection but also from the edges of the sister networks (Fig. 4B). We found that treatment with ethidium bromide (50 μg/ml) supertwisted only a few loops (<5%), indicating that most maxicircles were gapped. Moreover, we observed linear branches on some maxicircles, structures most likely to be broken θ-structures (open arrowheads in Figs. 4A and B). We analyzed topoisomerase IV-decatenated networks by EM and measured the percentage of intact maxicircle θ-structures (see Fig. 4C for examples) plus maxicircles with one or two branches (assumed to be broken θ-structures). After evaluating more than 500 maxicircles from overexpressing cells (at day 1) we found that 1% were intact θ-structures, 27% had branches, and 72% were unbranched. Analysis of 125 broken molecules indicated that strand breakage was twice as likely to occur at a branch point or at a random position within the replication bubble than it was in the unreplicated segment. The low level of intact θ-structures, found in several experiments, contrasts with our previous study of these molecules (Carpenter and Englund, 1995) and the reason for this low recovery is unclear. We found a similar distribution of species in cells not induced for overexpression (n=∼500). Whereas the % of maxicircles undergoing replication (intact theta structures plus branched molecules) was 28% in cells induced for 1 day, in uninduced cells it was only 8.7%.
Figure 4. Electron micrographs of kDNA networks and maxicircles from TbPIF2 overexpression cells.
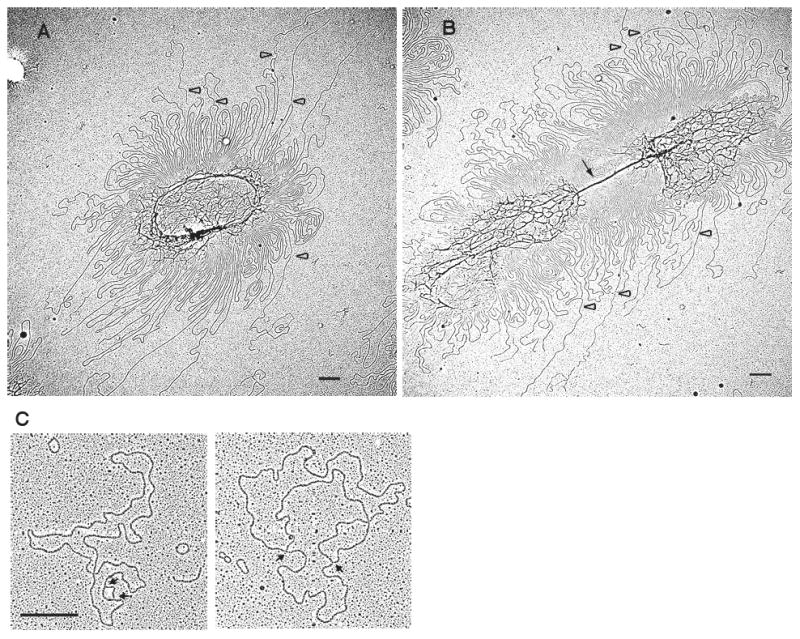
(A) and (B), kDNA isolated from TbPIF2 overexpression cells one day after induction. Black arrow, long dense connection between the two sister networks; empty arrowhead, maxicircle loops with one linear branch. Bar, 500 nm. (C), EM of θ-type replicating maxicircles. After in vivo trioxsalen cross-linking, kDNA was isolated, decatenated by topoisomerase IV and analyzed by EM. Arrows indicate branch points. Bar, 500 nm.
TbPIF2 overexpression causes kDNA loss in some cells
Given that overexpression causes an increase in maxicircles and no change in minicircles, it was surprising to find that overexpression in some cells caused shrinkage or loss of kDNA (Fig. 5A). This conclusion was based on visual estimates of the size of the DAPI-stained kinetoplast in >200 cells each day after inducing TbPIF2 overexpression (Fig. 5B). At day 6, only ∼50% of the cells had a normal kinetoplast, while ∼30% had no kinetoplast and <10% had a small kinetoplast. The number of cells with two kinetoplasts (2K) did not change during this period. Kinetoplast shrinking and loss could be due to a segregation defect discussed in the next paragraph.
Figure 5. The effect of TbPIF2 overexpression on kinetoplast segregation.
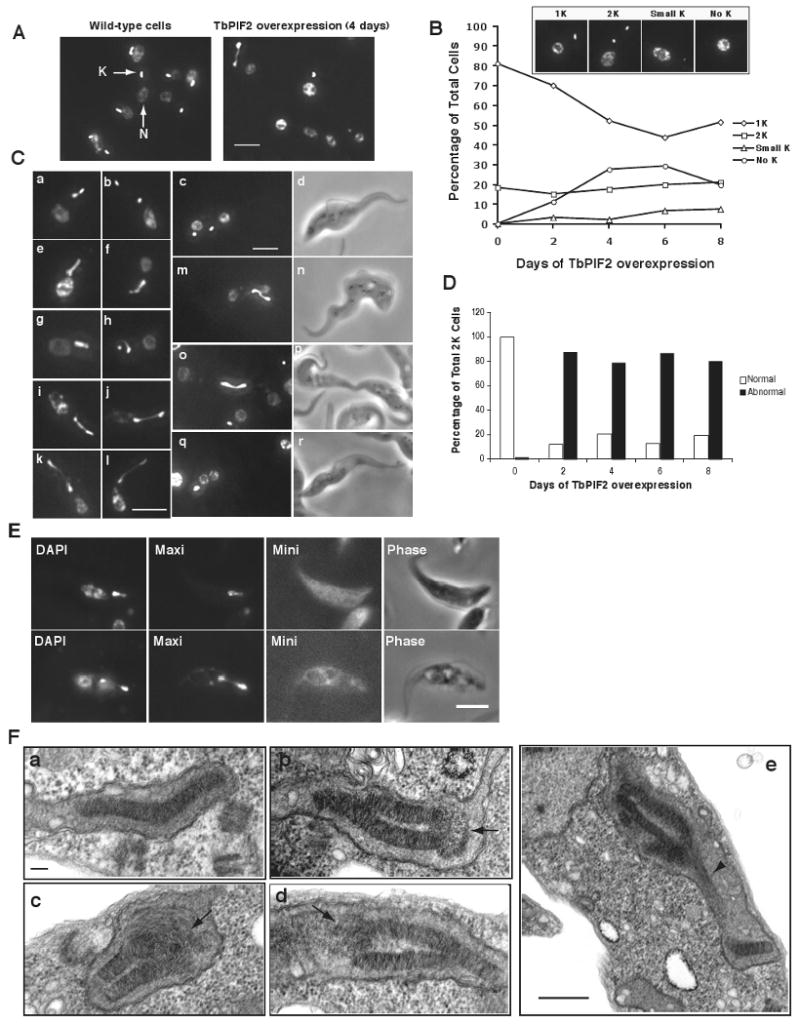
(A) DAPI staining of cells with (after 4 days induction) or without TbPIF2 overexpression. K, kinetoplast; N, nucleus. Bar, 5 μm. (B) Kinetics of kDNA loss as determined by visual analysis of images (> 200 randomly selected cells every two days). Inset images are examples of a cell with normal kDNA (1K), two segregated kDNAs (2K), small kDNA (Small K) and no kDNA (no K). (C) DAPI staining of cells with two kDNA networks with or without TbPIF2 overexpression (day 2). a and b, examples of wild-type cells with 2 kinetoplasts and one nucleus (2K1N); c and d, a wild-type cell with two kinetoplasts and two nuclei (2K2N); e-l, example of TbPIF2 overexpression cells with a thread structure (2K1N); m-n, examples of overexpression cells with 2K2N; o-p, example of a cell nearly finished with cytokinesis after TbPIF2 overexpression (2K2N); q and r, a TbPIF2 overexpression cell with a large kinetoplast and two nuclei (1K2N). Bar, 5 μm. (D) Quantitation of cells with two kinetoplasts. More than 100 DAPI-stained cells with two kinetoplasts were visually analyzed. Abnormal 2K cells include cells with thread structures (∼75%) and cells with one large kinetoplast and two nuclei (1K2N) (∼5%). Using our conditions for DAPI staining, the fluorescence of the nucleus was variable (e.g. compare panels e and g). (E) In situ hybridization of minicircles (Mini) and maxicircles (Maxi) in the kinetoplast with a thread structure (TbPIF2 overexpression cells, day 2). Fluorescent signals of minicircles are nonspecific due to an automatic long-time exposure. Bar, 5 μm. (F) Thin-section EMs of double-size kDNA. a, wild-type cell; b-d, double-size kinetoplast in TbPIF2 overexpression cells (day 1). Arrows mark disorganized connection between two nascent kinetoplasts. Bar, 100 nm; e, dividing kinetoplast in TbPIF2 overexpression cells (day 1). Arrowhead marks thread-like structure. Bar, 500 nm.
Segregation of kDNA networks is severely affected by TbPIF2 overexpression
In wild-type cells, the newly-replicated double-size kinetoplast divides into two daughters prior to nuclear division. Examples of these 2K1N cells, stained with DAPI, are shown in Fig. 5C, panels a and b. Then the nucleus divides, forming 2K2N cells (Fig. 5C, c and d). Eventually, these cells undergo cytokinesis, producing two 1K1N progeny (not shown). TbPIF2 overexpression strikingly affects kDNA segregation. We very frequently observed a “thread”-like connection between the two daughter kinetoplasts in 2K1N (e-l, Fig. 5C), 2K2N cells (m-n, Fig. 5C), and even in cells undergoing cytokinesis (o-p, Fig. 5C). This thread likely corresponds to the dense connection (and associated maxicircles) connecting the sister networks in the EM in Fig. 4B. Asymmetric division of the kinetoplasts or failure to segregate at all eventually generates some cells with a small kDNA or no kDNA. For example, there is a small fraction of cells with an unsegregated, large kDNA and two separated nuclei (q and r, Fig. 5C). In an estimate of the frequency of cells undergoing anomalous segregation, we visually inspected cells with two kinetoplasts as a function of time of overexpression (n >100). Although overexpression caused little change in the number of cells with two kinetoplasts (Fig. 5B), between days one to six roughly 80% had abnormal kDNA morphology (∼75% of the total have a thread and ∼5% have a large kDNA with two separated nuclei) (Fig. 5D). We further characterized the composition of the thread using fluorescence in situ hybridization (FISH). We detected gapped maxicircles but not gapped minicircles in the threads (Fig. 5E).
We next examined segregating kinetoplasts using EM of thin-sections. In wild-type cells, the kinetoplast typically forms a shallow V-shape structure during segregation (Fig. 5F, panel a). In contrast, after 1 day of overexpression most double-size kinetoplasts folded into two segments connected by a disorganized region containing longer fibers, presumably a cluster of maxicircles (arrow in b-d, Fig. 5F). Panel e in Fig. 5F shows an apparently asymmetrically-dividing kinetoplast with a thread-like structure (arrowhead) reminiscent of those observed by DAPI staining (Fig. 5C). Although evaluation of a 3-dimensional structure from EM analysis of a single thin section can be misleading, the images in Panel F, together with the results in Panels A to E, provide evidence that a major effect of TbPIF2 overexpression is defective kDNA segregation.
TbPIF2 protein level is regulated by TbHslVU protease
Since the level of maxicircle synthesis seems to be roughly proportional to the abundance of TbPIF2, it seemed possible that this helicase could be a regulator of maxicircle synthesis. In a preliminary experiment, we found that treatment of cells with a protein synthesis inhibitor (50 μg/ml cycloheximide, 4 h) caused a ∼30% decrease of TbPIF2 protein level (data not shown), suggesting that this helicase is susceptible to proteolysis. Therefore we tested whether TbHslVU protease could play a role in regulating TbPIF2 protein level (Li et al., 2008). We detected TbPIF2 level on a western blot using antibody against a C-terminal Myc-tag (3 copies of this epitope were added to the product of one allele). We then depleted this protease by RNAi of either the U1U2 or V subunit. Induction of RNAi for two days in the TbHslU1U2 RNAi or TbHslV RNAi cell line caused a nearly complete depletion of mRNA for the appropriate subunit (Fig. 6A). As expected, there was no effect on TbPIF2 mRNA (Fig. 6A), although the TbPIF2 protein level increased about 5-fold after day 4 in both cell lines (Fig. 6B). In the same experiment, there was no change in level of DNA polymerase β, another kDNA replication protein, demonstrating that the protease does not degrade all kDNA replication proteins. As we observed previously (Li et al., 2008), segregation of the kinetoplast was also affected after TbHslU1U2 RNAi or TbHslV RNAi. 32% of the cells with TbHslV RNAi (4 days) and 37% of the cells with TbHslU1U2 RNAi (6 days) have either a giant kinetoplast or thread-like connections between the two progeny kinetoplasts (see Fig. 6C for examples). Together these results indicate that TbHslVU regulates TbPIF2 level which in turn controls maxicircle abundance.
Figure 6. TbPIF2 in HslVU protease RNAi cells.
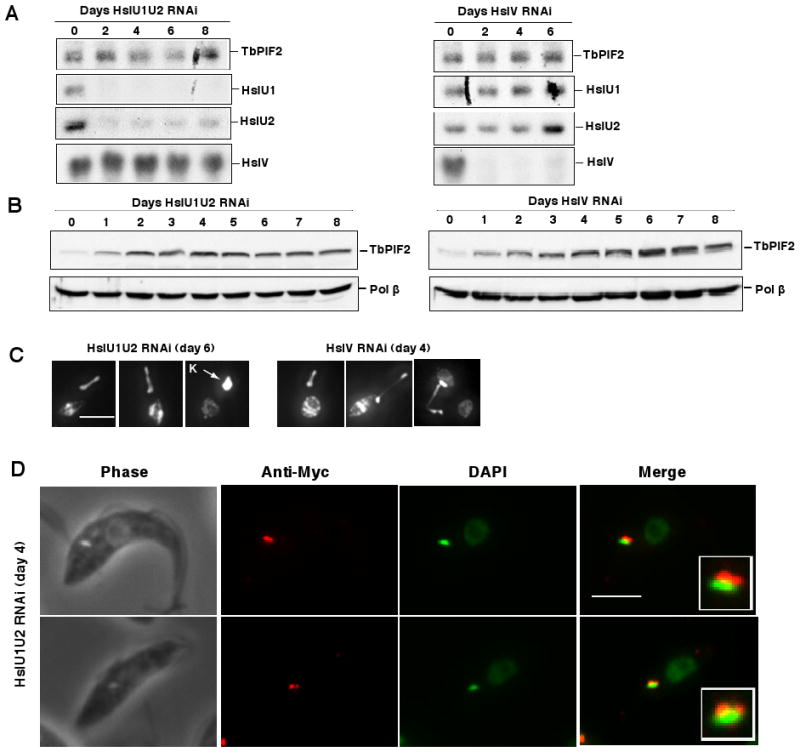
(A) Northern blots of HslU1U2 RNAi (left panel) and HslV RNAi (right panel) cells. (B) The effects of HslU1U2 RNAi (left panel) and HslV RNAi (right panel) on TbPIF2. Protein level of TbPIF2-Myc was analyzed by Western blot using anti-myc antibody. (C) Cells with a giant kinetoplast or thread structure after 6 days of HslU1U2 RNAi (left panel) or 4 days of HslV RNAi (right panel). Bar, 5 μm. (D) Localization of TbPIF2-myc after 4 days of HslU1U2 RNAi. Anti-Myc is in red, and DAPI in green. Inset, enlargement of merged picture showing localization of TbPIF2. Bar, 5 μm.
Localization of TbPIF2 in HslUV protease RNAi cells
In preliminary studies we found that a TbPIF2-GFP fusion protein expressed from a powerful procyclin promoter localizes throughout mitochondrion (Fig. S2). Because of uncertainties concerning the effect of the ∼30 kDa GFP on localization, especially when overexpressed, we wanted to localize the endogenous TbPIF2. Unfortunately, an antibody we generated was inadequate for immunofluorescence and we could not detect the protein in a cell line harboring one endogenous allele expressing a Myc-tagged TbPIF2. We therefore examined cells with an increased TbPIF2 level due to knockdown of TbHslU1U2 for 4 days (see Fig. 6B for western blot showing the increase in protein due to overexpression). In cells with a kinetoplast nearly normal in size, TbPIF2 is positioned as an elongated zone (Fig. 6D, upper panel) or two distinct foci (Fig. 6D, lower panel) in the KFZ similar to the localizations reported previously for DNA polymerase IB, IC (Klingbeil et al., 2002) or UMSBP (Abu-Elneel et al., 2001). Previous studies have demonstrated that minicircle replication initiates in the KFZ (Drew and Englund, 2001) and that the final stages (primer removal and gap repair) occur in the antipodal sites (Liu et al., 2005a), but we have had no information on the site of maxicircle replication. Although these data are limited by the structural changes in the kDNA network following knockdown of the TbHslVU protease, they do present the first suggestion that maxicircle replication also occurs in the KFZ. Further studies on TbPIF2 and other enzymes involved in maxicircle replication will be needed to provide proof.
Does TbPIF2 have helicase activity?
We prepared recombinant enzymes, GST-TbPIF2 and ΔNTbPIF2 (the latter is truncated at the N-terminus by 416 amino acid residues). See supplementary information for methods of their expression and purification. For both enzymes we assayed in parallel an identical protein with a K462A mutation (mentioned above). Figs. S5A and S5C show SDS-PAGE gels assessing purity (Coomassie stained in Panel A and silver–stained in panel C). All samples contain a major protein of the expected size (arrows), but a few other proteins are also present. We could detect helicase activity with the TbPIF2-GST (Fig. S5B). This activity was ATP- and MgCl2-dependent, as expected, and was markedly reduced in a GST-fusion containing the K462A mutation. The trace activity in the mutant protein could be due to contaminating E. coli helicases. We also detected significant helicase activity with ΔNTbPIF2. This enzyme was also dependent on MgCl2; however increasing MgCl2 concentration to 10 mM enhanced a contaminating nucleolytic activity in the preparation (not shown). The helicase unwinding activity was ATP-dependent (compare lanes 2 and 3 in panel D). Again, the K462A mutation eliminated most of the activity (compare lanes 5 and 7), providing strong evidence that the observed helicase activity is dependent on TbPIF2. Both recombinant enzymes were very unstable and had to be assayed immediately after purification.
Discussion
T. brucei has multiple mitochondrial PIF helicases
PIF1 helicases are conserved from yeast to humans (Bessler et al., 2001; Boule and Zakian, 2006). Whereas human and Schizosaccharomyces pombe have only one PIF helicase, S. cerevisiae has two, ScPif1p and Rrm3p, which localize both in the mitochondria and nucleus. Little is known about mitochondrial PIFs except that genetic studies suggest that a S. cerevisiae Pif1p mutant is deficient in recombination, repair and maintenance of the mitochondrial genome (Foury and Kolodynski, 1983; Lahaye et al., 1991). PIF helicases have multiple functions in the nucleus. Pif1p reduces telomerase processivity by dissociating it from the telomere (Boule et al., 2005), and it is also involved in maturation of Okazaki fragments (Budd et al., 2006). Another PIF homolog, Rrm3, helps overcome replication fork barriers within the ribosomal DNA region (Ivessa et al., 2000).
In a search for candidate kDNA replication proteins, we found that T. brucei has eight candidate PIF1-like helicases, and, remarkably, six of them are mitochondrial (Fig. S2). These 6 must be needed for different processes in replication and maintenance of the complex kDNA network. In this paper we have focused on TbPIF2 and showed that it plays a crucial role in maxicircle replication.
The effects of RNAi on TbPIF2
Our two preparations of recombinant TbPIF2 had catalytic activity (Fig. S5) which was low, due in part to extreme instability. However, both were dependent on ATP and Mg++ and both activities were virtually eliminated by the K462A mutation (Fig. S5). In addition, we demonstrated that catalytic activity is required in vivo (Figs. 3F, 3G, 3H) and that this enzyme plays a major role in replication of maxicircles. RNAi causes rapid loss of maxicircles, making them undetectable on a Southern blot (Fig. 1B) or on an EM of an isolated network (Fig. 2). RNAi caused gapped maxicircles (the products of replication, Fig. 1E) to decrease faster than covalently-closed forms (the replication precursor), providing evidence that TbPIF2 is needed for maxicircle replication. It was not surprising that maxicircle depletion did not have major effects on the stability or structure of the minicircle network; previous EM studies of isolated networks from Trypanosoma evansi, a T. brucei sub-species that is naturally deficient in maxicircles, resembled those in Fig. 2 (Hoeijmakers and Weijers, 1980). Furthermore, EM of T. evansi thin sections revealed the conventional disk-shape structure which appeared not to be affected by maxicircle loss (Lai et al., 2008).
Although TbPIF2 RNAi caused maxicircle loss, a Southern blot revealed that minicircles increased 2- to 3-fold (Fig. 1B). This increase caused an enlargement in the average network surface area observed by EM (Fig. 2E). We do not know the reason for the increase of total minicircles and also of free minicircle replication intermediates (Figs. 1B, 1C). The possibility that TbPIF2 acts as a repressor for minicircle replication is unlikely since TbPIF2 overexpression does not change either total or free minicircle levels. An alternative possibility is that knockdown of maxicircle synthesis allows the cell to direct its enzymatic machinery completely to the replication of minicircles. Arguing against this possibility is the fact that RNAi on mitochondrial RNA polymerase caused a striking decline in maxicircle level but did not increase the minicircle content (Grams et al., 2002).
The effects of TbPIF2 overexpression
We were very surprised to learn that TbPIF2 overexpression caused a 3- to 6-fold increase of total maxicircle abundance. Nevertheless, the facts that overexpression caused gapped maxicircles to increase faster than covalently-closed forms (Figs. 3D and 3E) and that it also caused a 3-fold increase of branched maxicircle replication intermediates, provide even stronger evidence that TbPIF2 is essential for maxicircle replication. As mentioned above, the enzymatic activity of TbPIF2 is indispensable for its function since overexpression of the presumably inactive mutant (K462A) decreased maxicircle abundance (Figs. 3G-H). In fact, the RNAi and overexpression studies together indicate that maxicircle level may be roughly proportional to the level of TbPIF2, a relationship suggesting that TbPIF2 controls a rate-limiting step in maxicircle replication and that it may be involved in controlling maxicircle synthesis.
It was not surprising to learn that the rapid rise in maxicircle content after TbPIF2 overexpression disturbs the normal structure of kDNA (Fig. 4) and eventually affects its segregation (Figs. 4B, 5C). Fig. 5F (panels b–e) shows EMs of kinetoplasts that are presumably undergoing segregation. Instead of segregating evenly into the two daughter cells, networks encumbered with excess maxicircles divide asymmetrically and eventually cannot divide at all. Sister networks undergoing segregation are usually joined by threads containing gapped maxicircles (Fig. 5E). The over-replication of maxicircles also affects reattachment sites of the newly-synthesized minicircles based on the TdT-labeling experiments (Fig. S4A). The conventional polar-labeling pattern is not found and, instead, most of the networks are uniformly labeled with TdT. However, it seems that this change does not reduce the rate of either minicircle replication or reattachment (Fig. 3B, 3C).
TbPIF2 controls maxicircle replication
Although we have not proven that TbPIF2 functions at the maxicircle replication fork, we have demonstrated that it is involved in regulation of maxicircle synthesis. Given that TbPIF2 level determines the maxicircle copy number (based on RNAi and overexpression experiments), it seemed likely that the helicase abundance would itself be regulated to establish that the maxicircle copy number exactly doubles each cell cycle. Now we have demonstrated that the level of TbPIF2 increases markedly following knockdown of the TbHslVU protease (Fig. 6A-C), providing strong evidence that TbPIF2 is a substrate for this protease. This is the most exciting finding in this paper and it provides stronger evidence that this mitochondrial proteasome-like protease controls maxicircle replication and undoubtedly minicircle replication as well.
With regard to control of the minicircle copy number, our longtime explanation for the precise doubling in minicircle level each generation has been that introduction of gaps into these circles marks them as having completed replication and prevents another round. The same model could establish maxicircle copy number, based on our finding that maxicircles are also covalently- closed prior to replication and gapped afterwards (Fig. 1D). Now, the discovery of the TbHslUV protease appears to make this control mechanism more complex than we previously thought (Li et al., 2008). For years we have had tools to explore the mechanism of kDNA replication. With the discovery of the TbHslVU protease and our identification of TbPIF2 as one of its substrates, we can now, for the first time, address the molecular mechanisms that regulate kDNA synthesis.
Experimental Procedures
Trypanosome growth and transfection
Procylic strain YTat1.1 (from E. Ullu, Yale University) and procyclic strain 29-13 (from G. Cross, Rockefeller University) were cultured and transfected as described previously (Klingbeil et al., 2002; Wang et al., 2000). HslU1U2 RNAi and HslV RNAi cell lines (Li et al., 2008) were from C.C. Wang, UCSF.
Primers and PCR templates for plasmid constructs
Sequences of primers used in this paper are listed in Table S2. T. brucei 427 genomic DNA was used as a template for PCR reactions.
RNAi and knock-out
For RNAi constructs, a ∼500 bp fragment of each PIF coding region was PCR-amplified and inserted into the pZJM or the stem loop vector. RNAi was conducted as described (Wang et al., 2000). See Supplementary Experimental Procedures for knock-out of TbPIF genes.
Overexpression of TbPIFs
The entire gene including the stop codon was inserted into the pLew79-MHTAP vector (a gift from Dr. Marilyn Parsons, Seattle Biomedical Research Institute) which expressed the gene product downstream of a T7 promoter under the control of a tetracycline operator (Jensen et al., 2007). The constructs were transfected into 29-13 cells. For induction of overexpression, cells (5 × 10⁵ cells/ml) were cultured in the growth medium containing 1.0 μg/ml tetracycline. They were diluted to the same density every two days.
Fluorescence microscopy and EM
For protein localization, the coding sequence of a full length PIF gene was PCR-amplified using procyclic form 427 genomic DNA as a template and the product was inserted into pXSGFPFUS (from Dr. C. Tschudi, Yale University). After transfection into YTat1.1 cells, GFP fluorescence was visualized as described previously (Klingbeil et al., 2002). Myc tagging of one genomic allele of TbPIF2 in HslUV RNAi cell lines was as described (Scocca and Shapiro, 2008). Immunostaining for Myc-tagged protein used 1: 50 rabbit anti-c-Myc (Santa Cruz) and 1:500 Alexa Fluor 594 conjugated goat anti-rabbit IgG (Invitrogen). We used previously-published methods for TdT labeling of isolated kDNA networks (Liu et al., 2005b), fluorescence in situ hybridization of maxicircles and minicircles (Li et al., 2008), EM of isolated kDNA networks (Pérez-Morga and Englund, 1993), and thin-section EM (McCaffery and Gillin, 1994). Surface areas of isolated kDNA networks on electron micrographs were measured using a planimeter (Keuffel & Esser Co.). Examination of θ-type maxicircles by EM was done as described (Carpenter and Englund, 1995) except we used topoisomerase IV (from Dr. J. Chen, University of Delaware) for decatenation of kDNA networks.
Other methods
DNA preparation, gel electrophoresis, Southern blotting, Northern blotting, Western blotting (Liu et al., 2006; Shapiro, 1993; Wang and Englund, 2001), and BrdU labeling (Liu et al., 2006) were conducted as described.
Supplementary Material
Acknowledgments
We thank members of our labs for many discussions. We thank CC Wang and Ziyin Li for providing the HslVU RNAi cell lines, Mike Delannoy for help with EM, Michael McCaffery for preparing samples for thin section EM, and Wade Gibson for use of his phosphorimager. We also thank Gokben Yildirir for valuable assistance. This work was supported in part by NIH grant AI058613 to P.T.E., grant 2005023 from the United States-Israel Binational Science Foundation to J.S. and P.T.E., and grant 54/06 from the Israel Science Foundation to J.S.
Footnotes
Publisher's Disclaimer: This is a PDF file of an unedited manuscript that has been accepted for publication. As a service to our customers we are providing this early version of the manuscript. The manuscript will undergo copyediting, typesetting, and review of the resulting proof before it is published in its final citable form. Please note that during the production process errors may be discovered which could affect the content, and all legal disclaimers that apply to the journal pertain.
References
- Abu-Elneel K, Robinson DR, Drew ME, Englund PT, Shlomai J. Intramitochondrial localization of universal minicircle sequence-binding protein, a trypanosomatid protein that binds kinetoplast minicircle replication origins. J Cell Biol. 2001;153:725–734. doi: 10.1083/jcb.153.4.725. [DOI] [PMC free article] [PubMed] [Google Scholar]
- Bessler JB, Torredagger JZ, Zakian VA. The Pif1p subfamily of helicases: region-specific DNA helicases? Trends Cell Biol. 2001;11:60–65. doi: 10.1016/s0962-8924(00)01877-8. [DOI] [PubMed] [Google Scholar]
- Boule JB, Vega LR, Zakian VA. The yeast Pif1p helicase removes telomerase from telomeric DNA. Nature. 2005;438:57–61. doi: 10.1038/nature04091. [DOI] [PubMed] [Google Scholar]
- Boule JB, Zakian VA. Roles of Pif1-like helicases in the maintenance of genomic stability. Nucleic Acids Res. 2006;34:4147–4153. doi: 10.1093/nar/gkl561. [DOI] [PMC free article] [PubMed] [Google Scholar]
- Budd ME, Reis CC, Smith S, Myung K, Campbell JL. Evidence suggesting that Pif1 helicase functions in DNA replication with the Dna2 helicase/nuclease and DNA polymerase delta. Mol Cell Biol. 2006;26:2490–2500. doi: 10.1128/MCB.26.7.2490-2500.2006. [DOI] [PMC free article] [PubMed] [Google Scholar]
- Carpenter LR, Englund PT. Kinetoplast maxicircle DNA replication in Crithidia fasciculata and Trypanosoma brucei. Mol Cell Biol. 1995;15:6794–6803. doi: 10.1128/mcb.15.12.6794. [DOI] [PMC free article] [PubMed] [Google Scholar]
- Chen J, Englund PT, Cozzarelli NR. Changes in network topology during the replication of kinetoplast DNA. EMBO J. 1995;14:6339–6347. doi: 10.1002/j.1460-2075.1995.tb00325.x. [DOI] [PMC free article] [PubMed] [Google Scholar]
- Downey N, Hines JC, Sinha KM, Ray DS. Mitochondrial DNA Ligases of Trypanosoma brucei. Eukaryot Cell. 2005;4:765–774. doi: 10.1128/EC.4.4.765-774.2005. [DOI] [PMC free article] [PubMed] [Google Scholar]
- Drew ME, Englund PT. Intramitochondrial location and dynamics of Crithidia fasciculata kinetoplast minicircle replication intermediates. J Cell Biol. 2001;153:735–744. doi: 10.1083/jcb.153.4.735. [DOI] [PMC free article] [PubMed] [Google Scholar]
- Engel ML, Ray DS. A structure-specific DNA endonuclease is enriched in kinetoplasts purified from Crithidia fasciculata. Nucleic Acids Res. 1998;26:4733–4738. doi: 10.1093/nar/26.20.4733. [DOI] [PMC free article] [PubMed] [Google Scholar]
- Ferguson M, Torri AF, Ward DC, Englund PT. In situ hybridization to the Crithidia fasciculata kinetoplast reveals two antipodal sites involved in kinetoplast DNA replication. Cell. 1992;70:621–629. doi: 10.1016/0092-8674(92)90431-b. [DOI] [PubMed] [Google Scholar]
- Foury F, Kolodynski J. pif mutation blocks recombination between mitochondrial rho+ and rho- genomes having tandemly arrayed repeat units in Saccharomyces cerevisiae. Proc Natl Acad Sci U S A. 1983;80:5345–5349. doi: 10.1073/pnas.80.17.5345. [DOI] [PMC free article] [PubMed] [Google Scholar]
- Grams J, Morris JC, Drew ME, Wang Z, Englund PT, Hajduk SL. A trypanosome mitochondrial RNA polymerase is required for transcription and replication. J Biol Chem. 2002;277:16952–16959. doi: 10.1074/jbc.M200662200. [DOI] [PubMed] [Google Scholar]
- Hajduk SL, Klein VA, Englund PT. Replication of kinetoplast DNA maxicircles. Cell. 1984;36:483–492. doi: 10.1016/0092-8674(84)90241-1. [DOI] [PubMed] [Google Scholar]
- Hall MC, Matson SW. Helicase motifs: the engine that powers DNA unwinding. Mol Microbiol. 1999;34:867–877. doi: 10.1046/j.1365-2958.1999.01659.x. [DOI] [PubMed] [Google Scholar]
- Hoeijmakers JHJ, Weijers PJ. The segregation of kinetoplast DNA networks in Trypanosoma brucei. Plasmid. 1980;4:97–116. doi: 10.1016/0147-619x(80)90086-4. [DOI] [PubMed] [Google Scholar]
- Ivessa AS, Zhou JQ, Zakian VA. The Saccharomyces Pif1p DNA helicase and the highly related Rrm3p have opposite effects on replication fork progression in ribosomal DNA. Cell. 2000;100:479–489. doi: 10.1016/s0092-8674(00)80683-2. [DOI] [PubMed] [Google Scholar]
- Jensen BC, Kifer CT, Brekken DL, Randall AC, Wang Q, Drees BL, Parsons M. Characterization of protein kinase CK2 from Trypanosoma brucei. Mol Biochem Parasitol. 2007;151:28–40. doi: 10.1016/j.molbiopara.2006.10.002. [DOI] [PMC free article] [PubMed] [Google Scholar]
- Kaguni LS. DNA polymerase gamma, the mitochondrial replicase. Annu Rev Biochem. 2004;73:293–320. doi: 10.1146/annurev.biochem.72.121801.161455. [DOI] [PubMed] [Google Scholar]
- Klingbeil MM, Motyka SA, Englund PT. Multiple mitochondrial DNA polymerases in Trypanosoma brucei. Mol Cell. 2002;10:175–186. doi: 10.1016/s1097-2765(02)00571-3. [DOI] [PubMed] [Google Scholar]
- Lahaye A, Stahl H, Thines-Sempoux D, Foury F. PIF1: a DNA helicase in yeast mitochondria. EMBO J. 1991;10:997–1007. doi: 10.1002/j.1460-2075.1991.tb08034.x. [DOI] [PMC free article] [PubMed] [Google Scholar]
- Lai DH, Hashimi H, Lun ZR, Ayala FJ, Lukes J. Adaptations of Trypanosoma brucei to gradual loss of kinetoplast DNA: Trypanosoma equiperdum and Trypanosoma evansi are petite mutants of T. brucei. Proc Natl Acad Sci U S A. 2008;105:1999–2004. doi: 10.1073/pnas.0711799105. [DOI] [PMC free article] [PubMed] [Google Scholar]
- Li C, Englund PT. A mitochondrial DNA primase from the trypanosomatid Crithidia fasciculata. J Biol Chem. 1997;272:20787–20792. doi: 10.1074/jbc.272.33.20787. [DOI] [PubMed] [Google Scholar]
- Li Z, Lindsay ME, Motyka SA, Englund PT, Wang CC. Identification of a bacterial-like HslVU protease in the mitochondria of Trypanosoma brucei and its role in mitochondrial DNA replication. PLoS Pathog. 2008;4:e1000048. doi: 10.1371/journal.ppat.1000048. [DOI] [PMC free article] [PubMed] [Google Scholar]
- Liu B, Liu Y, Motyka SA, Agbo EE, Englund PT. Fellowship of the rings: the replication of kinetoplast DNA. Trends Parasitol. 2005a;21:363–369. doi: 10.1016/j.pt.2005.06.008. [DOI] [PubMed] [Google Scholar]
- Liu B, Molina H, Kalume D, Pandey A, Griffith JD, Englund PT. Role of p38 in replication of Trypanosoma brucei kinetoplast DNA. Mol Cell Biol. 2006;26:5382–5393. doi: 10.1128/MCB.00369-06. [DOI] [PMC free article] [PubMed] [Google Scholar]
- Liu Y, Motyka SA, Englund PT. Effects of RNA interference of Trypanosoma brucei structure-specific endonuclease-I on kinetoplast DNA replication. J Biol Chem. 2005b;280:35513–35520. doi: 10.1074/jbc.M507296200. [DOI] [PubMed] [Google Scholar]
- McCaffery JM, Gillin FD. Giardia lamblia: ultrastructural basis of protein transport during growth and encystation. Exp Parasitol. 1994;79:220–235. doi: 10.1006/expr.1994.1086. [DOI] [PubMed] [Google Scholar]
- Melendy T, Sheline C, Ray DS. Localization of a type II DNA topoisomerase to two sites at the periphery of the kinetoplast DNA of Crithidia fasciculata. Cell. 1988;55:1083–1088. doi: 10.1016/0092-8674(88)90252-8. [DOI] [PubMed] [Google Scholar]
- Myler PJ, Glick D, Feagin JE, Morales TH, Stuart KD. Structural organization of the maxicircle variable region of Trypanosoma brucei: identification of potential replication origins and topoisomerase II binding sites. Nucleic Acids Res. 1993;21:687–694. doi: 10.1093/nar/21.3.687. [DOI] [PMC free article] [PubMed] [Google Scholar]
- Ogbadoyi EO, Robinson DR, Gull K. A high-order trans-membrane structural linkage is responsible for mitochondrial genome positioning and segregation by flagellar basal bodies in trypanosomes. Mol Biol Cell. 2003;14:1769–1779. doi: 10.1091/mbc.E02-08-0525. [DOI] [PMC free article] [PubMed] [Google Scholar]
- Pérez-Morga DL, Englund PT. Microtechnique for electron microscopy of DNA. Nucleic Acids Res. 1993;21:1328–1329. doi: 10.1093/nar/21.5.1327. [DOI] [PMC free article] [PubMed] [Google Scholar]
- Saxowsky TT, Choudhary G, Klingbeil MM, Englund PT. Trypanosoma brucei has two distinct mitochondrial DNA polymerase beta enzymes. J Biol Chem. 2003;278:49095–49101. doi: 10.1074/jbc.M308565200. [DOI] [PubMed] [Google Scholar]
- Scocca JR, Shapiro TA. A mitochondrial topoisomerase IA essential for late theta structure resolution in African trypanosomes. Mol Microbiol. 2008 doi: 10.1111/j.1365-2958.2007.06087.x. [DOI] [PubMed] [Google Scholar]
- Shapiro TA. Kinetoplast DNA maxicircles: Networks within networks. Proc Natl Acad Sci USA. 1993;90:7809–7813. doi: 10.1073/pnas.90.16.7809. [DOI] [PMC free article] [PubMed] [Google Scholar]
- Shlomai J. The structure and replication of kinetoplast DNA. Curr Mol Med. 2004;4:623–647. doi: 10.2174/1566524043360096. [DOI] [PubMed] [Google Scholar]
- Simpson L, Sbicego S, Aphasizhev R. Uridine insertion/deletion RNA editing in trypanosome mitochondria: a complex business. RNA. 2003;9:265–276. doi: 10.1261/rna.2178403. [DOI] [PMC free article] [PubMed] [Google Scholar]
- Stuart KD, Schnaufer A, Ernst NL, Panigrahi AK. Complex management: RNA editing in trypanosomes. Trends Biochem Sci. 2005;30:97–105. doi: 10.1016/j.tibs.2004.12.006. [DOI] [PubMed] [Google Scholar]
- Torri AF, Englund PT. Purification of a mitochondrial DNA polymerase from Crithidia fasciculata. J Biol Chem. 1992;267:4786–4792. [PubMed] [Google Scholar]
- Wang Z, Englund PT. RNA interference of a trypanosome topoisomerase II causes progressive loss of mitochondrial DNA. EMBO J. 2001;20:4674–4683. doi: 10.1093/emboj/20.17.4674. [DOI] [PMC free article] [PubMed] [Google Scholar]
- Wang Z, Morris JC, Drew ME, Englund PT. Inhibition of Trypanosoma brucei gene expression by RNA interference using an integratable vector with opposing T7 promoters. J Biol Chem. 2000;275:40174–40179. doi: 10.1074/jbc.M008405200. [DOI] [PubMed] [Google Scholar]
- Woodward R, Gull K. Timing of nuclear and kinetoplast DNA replication and early morphological events in the cell cycle of Trypanosoma brucei. J Cell Sci. 1990;95:49–57. doi: 10.1242/jcs.95.1.49. [DOI] [PubMed] [Google Scholar]
- Zhou J, Monson EK, Teng SC, Schulz VP, Zakian VA. Pif1p helicase, a catalytic inhibitor of telomerase in yeast. Science. 2000;289:771–774. doi: 10.1126/science.289.5480.771. [DOI] [PubMed] [Google Scholar]
Associated Data
This section collects any data citations, data availability statements, or supplementary materials included in this article.