Abstract
Analyses of complete genomes indicate that a massive prokaryotic gene transfer (or transfers) preceded the formation of the eukaryotic cell. In comparisons of the entire set of Methanococcus jannaschii genes with their orthologs from Escherichia coli, Synechocystis 6803, and the yeast Saccharomyces cerevisiae, it is shown that prokaryotic genomes consist of two different groups of genes. The deeper, diverging informational lineage codes for genes which function in translation, transcription, and replication, and also includes GTPases, vacuolar ATPase homologs, and most tRNA synthetases. The more recently diverging operational lineage codes for amino acid synthesis, the biosynthesis of cofactors, the cell envelope, energy metabolism, intermediary metabolism, fatty acid and phospholipid biosynthesis, nucleotide biosynthesis, and regulatory functions. In eukaryotes, the informational genes are most closely related to those of Methanococcus, whereas the majority of operational genes are most closely related to those of Escherichia, but some are closest to Methanococcus or to Synechocystis.
Prokaryotic and eukaryotic evolution has long been viewed primarily through the perspective of a single molecule, rRNA. Emphasis on this perspective has led to the simplified view that prokaryotes and eukaryotes have evolved as pure lineages relatively uncorrupted by horizontal gene transfer. This view has been contradicted by some puzzling phylogenetic relationships. Recent publications demonstrate that a number of proteins such as heat shock protein HSP70, glutamate dehydrogenase, l-malate dehydrogenase, aspartate amino transferase, and others do not fit the rRNA pattern. These, and other observations, have prompted fusion, or chimeric, theories for the origin of eukaryotes (1–6). Some also indicate an intricate assortment of prokaryotic relationships (6–9). The availability of complete genomes (10–13), including the first eukaryotic genome, now provides an opportunity to reconstruct a more complete picture of eukaryotic and prokaryotic evolution through the analysis of entire functional classes.
By using complete genomes from Saccharomyces cerevisiae (10), a eukaryote, Synechocystis 6803 (11), a cyanobacterium, Escherichia coli (12), a proteobacterium, and Methanococcus jannaschii (13), a methanogen, we have reconstructed the broad outlines of eukaryotic and prokaryotic evolution. Borrowing many of the comparative tools and techniques of molecular evolution (14) and having sufficiently large numbers of genes, we have followed the evolution of functional classes of genes (15) and have found two strikingly different inheritance patterns.
METHODS
Distances from blastp.
Approximate distances were calculated from the “sum probabilities” of blastp (16, 17) by using the distance to likelihood approximation of Kruskal (18). To assure that distances satisfied the “symmetry” property of distance metrics (18), P-values were symmetrized by the following procedure. If a and b are homologous genes in genomes A and B, respectively, and if PaB and PbA are the P-values obtained searching database B for gene a and database A for gene b, respectively, then the symmetrized P-value was the geometric mean of PaB and PbA. Distances were then calculated from the symmetrized P-values Pab by the transformation: Dab = −log(1.0 − (Pab)1/64).
Calculation of Scores.
Maximal-scoring segment pairs (MSPs) were calculated by the blast algorithm using the following parameters: W (word length) = 3, T (the neighborhood word score threshold) = 10, X (the maximum permissible drop off of the cumulative segment score) = 100, and the blosum62 substitution matrix. All possible words of the sequences analyzed were evaluated. The MSPs were converted into the similarity scores used in the three-dimensional plots by multiplying it by the fraction of the sequence (using the mean of both segments) present in the MSP.
Identification of Orthologs.
Identification of orthologous genes was performed at two levels of stringency. In the first, orthologs were selected according to a symmetrical (distance-like) procedure by using MSPs. If a and b are orthologous genes in genomes A and B, respectively, then we required that a blastp search of database B with gene a should select gene b and the reciprocal search of database A with gene b should select gene a. The four sequences with the highest MSPs were selected from each blastp comparison, and from this 4 × 4 array of scores, sij, reciprocal pairs were selected (if any existed). The best pair, corresponding to the minimum value of i + j and the maximum sum of scores, was then chosen as the ortholog pair. In a second level of selection, used for phylogenetic analyses, orthologous sets in addition were required to have been identified in the published descriptions of the genomes. These orthologs were accepted only if the genomic descriptions matched for all four proteins or if three of the four descriptions matched and the fourth was not described. This second selection added additional stringency, and because it relied on the work of others, it was independent of our assessments. Gene sets selected at this second level are likely orthologous.
Star Sequence Alignments.
The order of alignment can strongly bias the subsequent selection of phylogenetic trees (19). To reduce these biases, the star alignment procedure was used. In this procedure, each of the three prokaryotic amino acid sequences are, in turn, globally aligned with respect to the Saccharomyces guide sequence to generate an alignment of all four sequences (19). Protein sequences were aligned as amino acids, because these provide the most reliable alignments (20), and RNA sequences were aligned as nucleotides. (Specifically, for amino acids, an opening penalty of 7 and a gap extension penalty of 2 were used, and end gaps were penalized 0.3 times as much as internal gaps. The blosum62 matrix was used. For nucleotide sequences an opening penalty of 10, and a gap extension penalty of 1 were used, and end gaps were scored 0.4 times as much as internal gaps. Nucleotide identities, transversions, and transitions were scored as +6, +2, and 0, respectively. These scores were based on preliminary experiments with EF-1α and 18S rDNA.) Alignments and data are available on the web at: www.lifesci.ucla.edu/mcdbio/Faculty/Lake/Research/Lineages/.
Paralog Rooting.
To root the trees, methanogen and proteobacterial gene paralogs were identified among the set of 628 classified ORFs. To separate paralogs derived from ancient duplications, which can be used to root trees, from more recent duplications, we required that the methanogen and proteobacterial orthologs be topologically adjacent and that the methanogen and proteobacterial paralogs be adjacent in the four taxon trees. These initial trees were calculated from blastp distances (previously described) by using the four point criterion. Using the methanogen paralog as the guide sequence, alignments were constructed for the three prokaryotes plus the methanogen paralog and analyzed as described below. Ninety-five trees were supported at the lowest level (>50% bootstrap support) and 20 trees were strongly supported (>95% bootstrap support and tree central branch more than two SDs). For the informational lineage, six alignments strongly supported a root in the methanogen branch, whereas only one alignment supported a root elsewhere (in the cyanobacterial branch). For the operational lineage, five alignments strongly supported a root in the methanogen branch, three supported the proteobacterial branch, and six supported the cyanobacterial branch.
Phylogenetic Analyses.
Three methods of phylogenetic analysis, Jukes–Cantor distances (21), maximum parsimony (14), and paralinear (LogDet) distances (22, 23), were used to analyze both the ortholog sets and also the set containing the paralog root. For phylogenetic analysis only amino acid replacement positions were converted to nucleotides to reduce reconstruction artifacts.
RESULTS
Evidence for Two Functional Gene Superclasses.
Many genes evolve too rapidly to be useful for rigorous phylogenetic reconstructions but are useful for studies with approximate tools such as blastp (Basic Local Alignment Search Tool, ref. 17). Hence, approximate methods were used to survey all genes and reach preliminary conclusions. Only then were these conclusions tested and refined by applying rigorous reconstructions to fewer, more slowly evolving genes.
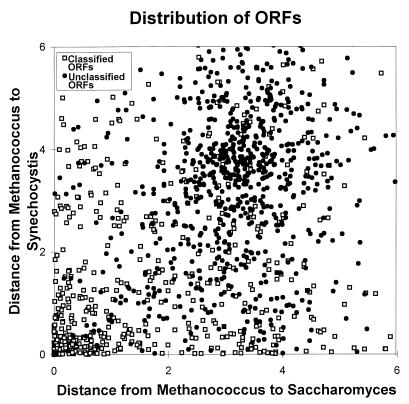
An initial analysis compared open reading frames (ORFs) of known function with those of unknown function. Each of the 1,397 points in Fig. 1 corresponds to a set of four gene orthologs found in Methanococcus, Escherichia, Saccharomyces, and Synechocystis. The open squares are methanogen ORFs classified by functional groupings (13) using Riley’s scheme (15), and the closed circles are ORFs that could not be identified (13). Using a simple distance metric (see Methods), the classified ORFs cluster about the origin, whereas the unclassified ORFs cluster in a region distant from the origin indicating that most of these pairs are weakly related. Hence, we restricted further analyses to the 628 classified methanogen genes and their orthologs.
Figure 1.
The distribution of ORFs indicates that classified ORFs are distributed differently than unclassified ORFs. This scatterplot displays the distance between a methanogen gene and its cyanobacterial ortholog on the vertical axis and the distance between the methanogen gene and its yeast ortholog on the horizontal axis. Orthologs of classified ORFs (□) are closely related (corresponding to small distances) and therefore are distributed about the origin at the lower left. In contrast, orthologs of unclassified ORFs (•) are distantly related and are distributed about (3.5, 3.8). Distance estimates between orthologous genes were obtained from blastp (17) probabilities (see Methods).
Scatterplots calculated from similarity scores are effective in revealing relationships because they deemphasize the least similar (and least reliable) orthologs by grouping them about the origin of the plot and emphasize the most similar (and most reliable) orthologs by spreading them throughout the plot. Hence, we used scatterplots based on similarity scores (see Methods) to study relationships among gene orthologs.
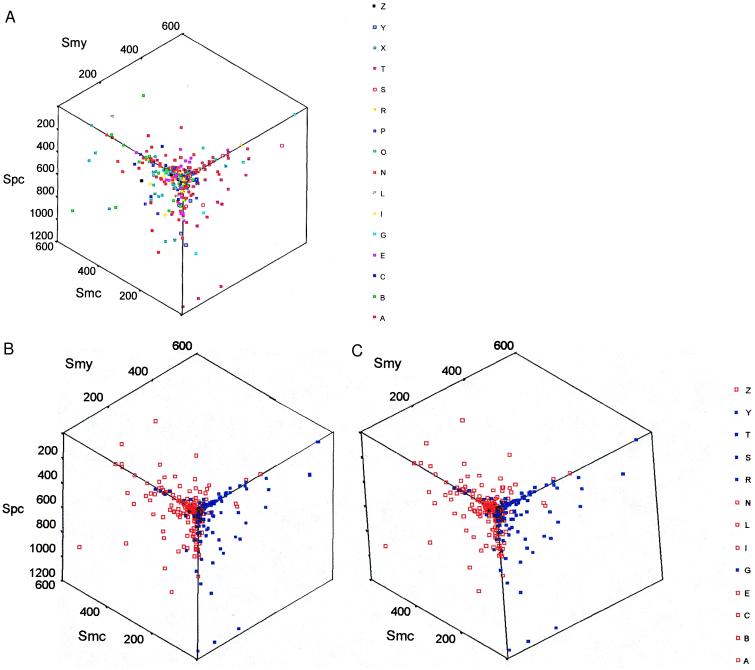
Any set of four gene orthologs can be usefully described by specifying the six pairwise similarity scores which relate orthologs. Thus, the evolution of the entire set of classified ORFs within the four genomes is represented by the distribution of 628 points in a six-dimensional similarity space. To discover possible relationships among genes of similar functional types, we systematically searched all twenty three-dimensional projections of similarity space looking for projections that would separate the maximum number of functional classes of genes. Although the representation shown in Fig. 2A looks complex, almost all functional classes are exclusively separated into one of two regions in this projection. The separation becomes obvious when individual classes are recoded into red and blue (Fig. 2B). The most striking result is that the red and blue functional superclasses of genes share fundamentally different functions. The blue genes function in information processing, [translation (T), transcription (S), and replication (R) and include homologs of vacuolar ATPases and GTPases (G), and tRNA synthetases (Y)], whereas the red genes function in cell operation [amino acid synthesis (A), biosynthesis of cofactors (B), cell envelope proteins (C), energy metabolism (E), intermediary metabolism (I), fatty acid and phospholipid biosynthesis (L), nucleotide biosynthesis (N), and regulatory genes (Z)]. Two classes were nearly separated [cell processes (P) and transport (X)] and one [other (O)] was mixed. These three were not recoded into blue or red. The low similarity scores observed for replication genes (R) make their assignment tentative. It should be noted that we have not changed the assignments of any genes from those classes published by Bult et al. (13), except that GTP-binding proteins (formerly in X), and vacuolar ATPase homologs (formerly in E) have been put into a new class (G). Members of the blue and red superclasses of genes will be referred to as informational and operational genes, respectively.
Figure 2.
A three-dimensional display of gene orthologs classified by function or by lineage. (A) The sets of gene orthologs are labeled by their functional classes. In the stereo view (B), the classes are combined into two superclasses corresponding to whether the genes function in informational (blue) or operational (red) processes. The axes are similarity scores between the methanogen and cyanobacterial orthologs, Smc, between the methanogen and yeast orthologs, Smy, and between the proteobacterial and the cyanobacterial orthologs, Spc. The functional categories are: amino acid synthesis (A), biosynthesis of cofactors (B), cell envelope proteins (C), energy metabolism (E), GTPases and homologs of vacuolar ATPases (G), intermediary metabolism (I), fatty acid and phospholipid biosynthesis (L), nucleotide biosynthesis (N), other (O), cell processes (P), replication (R), transcription (S), translation (T), transport (X), tRNA synthetases (Y), and regulatory genes (Z). The divisions into functional categories are good, but exceptions exist such as valyl-tRNA synthetase, which appears in the operational group.
Eukaryotic Origins.
To determine the prokaryotic sources of eukaryotic nuclear genes, trees were reconstructed from four taxon alignments of the orthologous prokaryotic and eukaryotic genes. From the set of classified methanogen genes, 513 genes were represented by orthologs in all genomes. These were aligned as protein sequences and analyzed as nucleotides (see Methods). The application of additional, more stringent, homology criteria (see Methods) resulted in the identification of 354 reliable orthologs. From these, phylogenetic trees were calculated by using maximum parsimony (14), Jukes–Cantor distances (21), and paralinear (LogDet) distances (22, 23). Trees were rated according to levels of confidence, and 78 gene trees (informational or operational) were rated at the highest category (>95% bootstrap support and tree central branch distance more than two SDs).
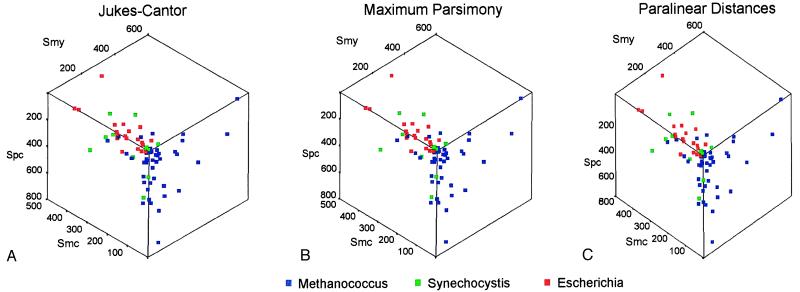
As shown in the scatterplot in Fig. 3, all methods produced essentially identical trees. The three colors identify trees in which the eukaryotic gene is most closely related to the proteobacterial (Escherichia) gene (red), to the cyanobacterial (Synechocystis) gene (green), or to the methanogen (Methanococcus) gene (blue). This is the same scatterplot projection shown in Fig. 2, so that the locations of the points in this plot indicate whether the genes are from the informational or operational lineages. The informational genes, which are found at the lower right cube face, are uniformly blue indicating that the informational genes of eukaryotes are derived almost exclusively from the orthologous methanogen genes. (Phylogenetic trees also were reconstructed from alignments of large and small ribosomal subunit rRNA genes and these, too, supported the eukaryote to methanogen relationship, consistent with these genes belonging to the informational class.) In contrast, the operational genes of eukaryotes, which are found on the lower left and on the upper faces of the cube, are derived primarily from orthologous proteobacterial genes (20 genes), but some also are derived from the cyanobacterial (12 genes) and methanogen (16 genes) orthologs. These data indicate eukaryotes have acquired their informational and operational genes from several different prokaryotic groups.
Figure 3.
The prokaryotic origins of eukaryotic genes. The results of phylogenetic analyses are shown plotted with respect to similarity scores, in the orientation used in Fig. 2, using three methods of analysis; Jukes–Cantor distances (A); maximum parsimony (B); and paralinear (LogDet) distances (C). In this representation, orthologs from the informational lineage are located on the lower right cube face and orthologs from the operational lineage are located either on the upper or the lower left cube face. Trees in which the eukaryotic gene is most closely related to the Methanococcus, the Synechocystis, or the Escherichia ortholog are indicated by blue, green, and red squares, respectively.
The Evolution of Informational and Operational Gene Lineages.
In Fig. 2B the separation into informational and operational genes is seen to be principally dependent on Smc (the similarity score relating the methanogen gene to its cyanobacterial ortholog). Because Smc is approximately inversely proportional to the distance between genes, it suggests that the distance between the methanogen and the cyanobacterium should be longer in informational gene trees than in operational gene trees. (This observation was verified subsequently when the similarity scores were cross correlated with reciprocal paralinear distances, cross correlation coefficient = 0.593 ± 0.109.)
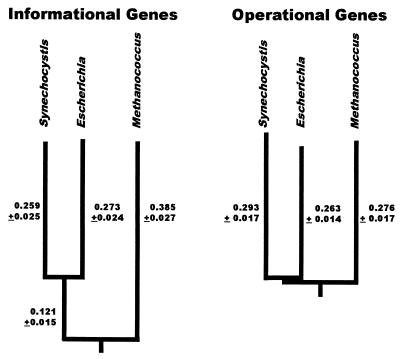
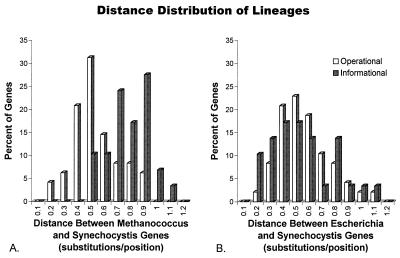
To investigate more rigorously these differences between operational and informational gene trees, paralinear (LogDet) distances were calculated from the 78 most reliable alignments (those analyzed in Fig. 3), and trees were reconstructed from the mean distances. (The trees also were rooted by using paralogous genes (24–26) as described in Methods.) These rooted trees are shown in Fig. 4 A and B. A striking result is that the length of the branch leading to the methanogen in the informational tree is 0.507 ± 0.031 Su (substitutions/position or substitution units) and is significantly shorter in the operational tree, only 0.276 ± 0.017 substitution units. In contrast, the mean lengths of the branches leading to the cyanobacterium and to the proteobacterium are indistinguishable (0.266 ± 0.025 for informational genes and 0.278 ± 0.016 for operational genes). The observation that the lengths of the cyanobacterial and proteobacterial branches are essentially identical in both operational and informational trees suggests that intrinsic gene properties probably cannot explain the longer branch length observed in the methanogen branch of the informational tree. Because the results of the scatterplot analyses previously discussed (Fig. 2B) indicate that the methanogen–cyanobacterial distance is longer for nearly all informational genes than for operational ones, it seems improbable that the rate of evolution would have accelerated in each of ≈200 independent informational gene trees but not in the ≈400 operational gene trees. Hence, we attribute the shorter methanogen branch in the operational tree to a more recent divergence of these genes rather than to an acceleration of the informational genes in the methanogen branch. Because mean properties can be misleading, we also analyzed the distribution of the distances for individual genes.
Figure 4.
Phylogenetic trees reconstructed from gene orthologs from the informational lineage and from the operational lineage. Distances on the trees refer to paralinear (LogDet) distances in nucleotide substitutions per replacement position. The error estimates correspond to one SD measured from 100 bootstrap replicates. The trees are both rooted in the methanogen branch by using paralogus genes as described in Methods.
The distribution of pairwise distances for the set of individual operational genes (48 genes) and informational genes (30 genes) used to construct the average tree is shown in Fig. 5. As expected, the mean paralinear distance between orthologous methanogen and cyanobacterial genes (Fig. 5A) is significantly greater for informational genes (Dmc = 0.78 ± 0.02 Su) than for operational (Dmc = 0.54 ± 0.03 Su) genes (significance = 0.000 by the t test for equality of means, see Table 1). In contrast, the mean distance between orthologous proteobacterial and cyanobacterial genes (Fig. 5B) is very similar for the operational (Dpc = 0.55 ± 0.05 Su) and informational (Dpc = 0.53 ± 0.03 Su) lineages. The distribution of distances between orthologous methanogen and cyanobacterial, operational genes (Fig. 5A) does not appear to be bimodal, effectively ruling out an averaging process causing the observed differences.
Figure 5.
The distribution of pairwise paralinear (LogDet) distances between orthologous ORFs for informational (gray) and operational (white) genes. (A) The distributions of distances between Methanococcus and Synechocystis are significantly different for informational and operational genes, whereas in B, the distributions of distances between Escherichia and Synechocystis are similar.
Table 1.
t test for the equality of mean pairwise distances
| Distances | Lineage | Mean Distances | SEM | Mean Difference | Significance |
|---|---|---|---|---|---|
| Dmp | I | 0.77 | 0.03 | ||
| O | 0.57 | 0.02 | 0.20 | 0.000 | |
| Dmc | I | 0.78 | 0.02 | ||
| O | 0.54 | 0.03 | 0.24 | 0.000 | |
| Dpc | I | 0.53 | 0.03 | ||
| O | 0.55 | 0.05 | 0.02 | 0.676 |
The independent-samples t test compares the means of one variable for two groups of cases. The test was performed for both the equal-variance t test and for the unequal variance t test (shown) and results were essentially identical for both tests. Operational and informational lineages are indicated by O and I, respectively.
DISCUSSION AND INTERPRETATIONS
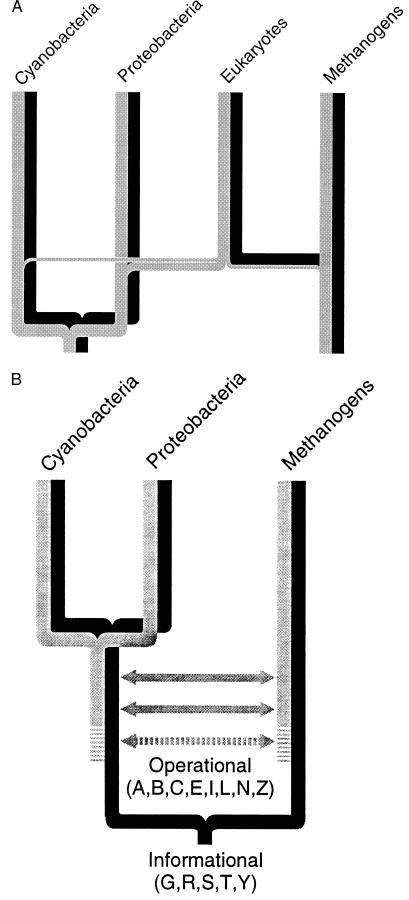
Our genomic analyses, summarized in Fig. 6A, strongly support the chimeric origin of eukaryotes. The data clearly indicate that the informational genes (black) have been transferred to eukaryotes almost exclusively from the methanogen side of the tree. In contrast, the operational genes (gray) have principally come from the proteobacteria, but cyanobacteria and methanogens also have contributed significantly. Hence, the contribution of eubacterial genes to the eukaryotic nucleus is much greater than generally appreciated, although two recent studies (7, 8) have demonstrated extensive eubacterial contributions to eukaryotes. Koonin et al. (9) have recently proposed an unusual chimeric theory in which methanogens are formed from a mixture of eubacterial and eukaryotic genes, rather than eukaryotes from a mixture of methanogen and eubacterial genes. Given the number of attractive proposals for a chimeric eukaryotic origin (1–9), it is not surprising that nuclear eukaryotic genes are derived from multiple prokaryotic sources. But it is startling that eukaryotic informational genes and operational genes have arisen from different types of prokaryotes. Whether operational nuclear genes were obtained from chloroplast and mitochondrial endosymbionts (27) and/or elsewhere (11–13) is still not clear; however, the complex mitochondrial genomes of early protists (28) and their nuclear genomes (29) will both be important for understanding the process of making the first eukaryote.
Figure 6.
Evolution of the operational and informational lineages. The, complex, evolution of eukaryotes is shown in A. The informational lineage (black) is inherited entirely from a methanogen ancestor, whereas the operational lineage (gray) is inherited principally from a proteobacterial ancestor, although methanogen and cyanobacterial ancestors also make a significant contribution. The prokaryotic evolution of the operational (gray) and informational (black) lineages is shown in B. Horizontal arrows indicate possible lateral gene transfers (see text).
Although our analyses of prokaryotic genomes solidly support a differential evolution of operational and informational genes, the exact mechanism by which these two gene lineages have evolved is less clear. Our preferred interpretation for the evolution of the operational and informational lineages in prokaryotes is shown diagrammatically in Fig. 6B. Within this tree, the informational lineage (black) branches deeply, whereas the operational lineage (gray) diverges much more recently. We have not tested whether the more recent divergence of the operational lineage was caused by a single massive horizontal gene transfer event or by an extended series of horizontal gene transfers. We favor the interpretation that horizontal transfer has been continuous within the operational lineage. Additional complete prokaryotic genomes will allow us to test this.
Whether in eukaryotes or prokaryotes, operational genes appear to be easily transferred horizontally, whereas informational genes do not. We can only surmise the underlying reasons for the differences between these lineages. The coherence of the informational lineage might reflect demanding functional constraints imposed on a tightly integrated set of genes. In contrast, the malleability of the operational lineage might reflect a less demanding functional coupling. The presence of two coexisting, semiautonomous functional lineages, possibly extending to the cenancestor of the tree of life, was a surprising finding. These two lineages may provide important clues for understanding the origin of life.
Acknowledgments
We thank C. Brunk and B. Runnegar for helpful comments and advice. R.J. was supported by a National Institutes of Health training grant, and J.E.M. was supported by a Ursula Mandel fellowship. This research was funded by National Science Foundation and National Institutes of Health grants to J.A.L.
ABBREVIATIONS
- Su
substitution unit
- MSPs
Maximal-scoring segment pairs
References
- 1.Henze K, Badr A, Wettern M, Cerff R, Martin W. Proc Natl Acad Sci USA. 1995;92:9122–9126. doi: 10.1073/pnas.92.20.9122. [DOI] [PMC free article] [PubMed] [Google Scholar]
- 2.Sogin M L. Curr Opin Genet Dev. 1991;1:457–463. doi: 10.1016/s0959-437x(05)80192-3. [DOI] [PubMed] [Google Scholar]
- 3.Golding G B, Gupta R S. Mol Biol Evol. 1994;12:1–6. doi: 10.1093/oxfordjournals.molbev.a040178. [DOI] [PubMed] [Google Scholar]
- 4.Doolittle W F. In: Evolution of Microbial Life. Roberts D M, Sharp P, Alderson G, Collins M A, editors. Cambridge, U.K.: Cambridge Univ. Press; 1996. pp. 1–21. [Google Scholar]
- 5.Lake J A. Proc Natl Acad Sci USA. 1982;79:5948–5952. doi: 10.1073/pnas.79.19.5948. [DOI] [PMC free article] [PubMed] [Google Scholar]
- 6.Gupta R S, Aitken K, Falah M, Singh B. Proc Natl Acad Sci USA. 1994;79:2895–2899. doi: 10.1073/pnas.91.8.2895. [DOI] [PMC free article] [PubMed] [Google Scholar]
- 7.Feng D-F, Cho G, Doolittle R F. Proc Natl Acad Sci USA. 1997;94:13028–13033. doi: 10.1073/pnas.94.24.13028. [DOI] [PMC free article] [PubMed] [Google Scholar]
- 8.Brown J R, Doolittle W F. Microb Mol Biol Rev. 1997;61:456–502. doi: 10.1128/mmbr.61.4.456-502.1997. [DOI] [PMC free article] [PubMed] [Google Scholar]
- 9.Koonin E V, Mushegian A R, Galperin M Y, Walker D R. Mol Microbiol. 1997;25:619–637. doi: 10.1046/j.1365-2958.1997.4821861.x. [DOI] [PubMed] [Google Scholar]
- 10.Goffeau, A., Aert, R., Agostini-Carbone, M. L., Ahmed, A., Aigle, M., Alberghina, L., Albermann, K., Albers, M., Aldea, M., Alexandraki, D., et al. (1997) Nature (London) 387, Suppl. 5–105.
- 11.Nakamura Y, Kaneko T, Hirosawa M, Miyajima N, Tabata S. Nucl Acids Res. 1998;26:63–67. doi: 10.1093/nar/26.1.63. [DOI] [PMC free article] [PubMed] [Google Scholar]
- 12.Blattner F R, Plunkett G, III, Bloch C A, Perna N T, Burland V, Riley M, Collado-Vides J, Glasner J D, Rode C K, Mayhew G F, et al. Science. 1997;277:1453–1462. doi: 10.1126/science.277.5331.1453. [DOI] [PubMed] [Google Scholar]
- 13.Bult C J, White O, Olsen G J, Zhou L, Fleischmann R D, Sutton G G, Blake J A, FitzGerald L M, Clayton R A, Gocayne J D, et al. Science. 1996;273:1058–1072. doi: 10.1126/science.273.5278.1058. [DOI] [PubMed] [Google Scholar]
- 14.Stewart C-B. Nature (London) 1993;361:603–607. doi: 10.1038/361603a0. [DOI] [PubMed] [Google Scholar]
- 15.Riley M. Microbiol Rev. 1993;57:862–952. doi: 10.1128/mr.57.4.862-952.1993. [DOI] [PMC free article] [PubMed] [Google Scholar]
- 16.Koonin E V, Tatusov R L, Rudd K E. Methods Enzymol. 1996;226:295–322. doi: 10.1016/s0076-6879(96)66020-0. [DOI] [PubMed] [Google Scholar]
- 17.Altschul S F, Gish W, Miller W, Myers E W, Lipman D J. J Mol Biol. 1990;215:403–410. doi: 10.1016/S0022-2836(05)80360-2. [DOI] [PubMed] [Google Scholar]
- 18.Kruskal J B. In: Time Warps, String Edits, and Macromolecules: The Theory and Practice of Sequence Comparison. Sankoff D, Kruskal J B, editors. Reading, MA: Addison–Wesley; 1983. pp. 1–44. [Google Scholar]
- 19.Lake J A. Mol Biol Evol. 1991;8:378–385. doi: 10.1093/oxfordjournals.molbev.a040654. [DOI] [PubMed] [Google Scholar]
- 20.Doolittle R F. Of URFs and ORFs. Mill Valley, CA : Univ. Sci. Books; 1996. [Google Scholar]
- 21.Jukes T H, Cantor C R. In: Mammalian Protein Metabolism III. Munro H N, editor. New York: Academic; 1969. pp. 21–132. [Google Scholar]
- 22.Lake J A. Proc Natl Acad Sci USA. 1994;91:1455–1459. doi: 10.1073/pnas.91.4.1455. [DOI] [PMC free article] [PubMed] [Google Scholar]
- 23.Lockhart P J, Steel M A, Hendy M D, Penny D. Mol Biol Evol. 1994;11:605–612. doi: 10.1093/oxfordjournals.molbev.a040136. [DOI] [PubMed] [Google Scholar]
- 24.Iwabe N, Kuma K-I, Hasegawa M, Osawa S, Miyata T. Proc Natl Acad Sci USA. 1989;86:9355–9359. doi: 10.1073/pnas.86.23.9355. [DOI] [PMC free article] [PubMed] [Google Scholar]
- 25.Gogarten J P, Kibak H, Dittrich P, Taiz L, Bowman E J, Bowman B J, Manolson M F, Poole R J, Date T, Oshima T, et al. Proc Natl Acad Sci USA. 1989;86:6661–6665. doi: 10.1073/pnas.86.17.6661. [DOI] [PMC free article] [PubMed] [Google Scholar]
- 26.Baldauf S L, Palmer J D, Doolittle W F. Proc Natl Acad Sci USA. 1989;93:7749–7754. doi: 10.1073/pnas.93.15.7749. [DOI] [PMC free article] [PubMed] [Google Scholar]
- 27.Gray M W. Curr Opin Genet Dev. 1993;3:884–890. doi: 10.1016/0959-437x(93)90009-e. [DOI] [PubMed] [Google Scholar]
- 28.Lang B F, Burger G, O’Kelly C J, Cedergren R, Golding G B, Lemieux C, Sankoff D, Turmel M, Gray M W, et al. Nature (London) 1997;387:493–497. doi: 10.1038/387493a0. [DOI] [PubMed] [Google Scholar]
- 29.Sogin M L, Silberman J D, Hinkle G, Morrison H G. In: Evolution of Microbial Life. Roberts D M, Sharp P, Alderson G, Collins M A, editors. Cambridge, U.K.: Cambridge Univ. Press; 1996. pp. 168–184. [Google Scholar]


