Abstract
Objective:
To assess driving performance in Parkinson disease (PD) under low-contrast visibility conditions.
Methods:
Licensed, active drivers with mild to moderate PD (n = 67, aged 66.2 ± 9.0 years, median Hoehn–Yahr stage = 2) and controls (n = 51, aged 64.0 ± 7.2 years) drove in a driving simulator under high- (clear sky) and low-contrast visibility (fog) conditions, leading up to an intersection where an incurring vehicle posed a crash risk in fog.
Results:
Drivers with PD had higher SD of lateral position (SDLP) and lane violation counts (LVC) than controls during fog (p < 0.001). Transition from high- to low-contrast visibility condition increased SDLP and LVC more in PD than in controls (p < 0.01). A larger proportion of drivers with PD crashed at the intersection in fog (76.1% vs 37.3%, p < 0.0001). The time to first reaction in response to incursion was longer in drivers with PD compared with controls (median 2.5 vs 2.0 seconds, p < 0.0001). Within the PD group, the strongest predictors of poor driving outcomes under low-contrast visibility conditions were worse scores on measures of visual processing speed and attention, motion perception, contrast sensitivity, visuospatial construction, motor speed, and activities of daily living score.
Conclusions:
During driving simulation under low-contrast visibility conditions, drivers with Parkinson disease (PD) had poorer vehicle control and were at higher risk for crashes, which were primarily predicted by decreased visual perception and cognition; motor dysfunction also contributed. Our results suggest that drivers with PD may be at risk for unsafe driving in low-contrast visibility conditions such as during fog or twilight.
GLOSSARY
- ADL
= activities of daily living;
- CFT
= Complex Figure Test;
- CS
= contrast sensitivity;
- FOV
= field of view;
- FR
= functional reach;
- FVA
= far visual acuity;
- JLO
= judgment of line orientation;
- LVC
= lane violation counts;
- PD
= Parkinson disease;
- SDLP
= SD of lateral position;
- SFM
= structure from motion;
- SIREN
= Simulator for Interdisciplinary Research in Ergonomics and Neuroscience;
- TFR
= time to first reaction;
- UFOV
= useful field of view;
- UPDRS
= Unified Parkinson’s Disease Rating Scale.
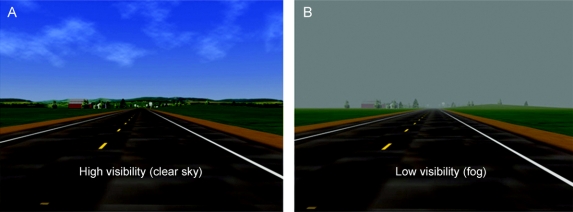
Reduced contrast sensitivity (CS) is a common feature of Parkinson disease (PD)1–11 and is associated with poor outcomes on driving tests in parkinsonian drivers.12–14 However, there are no published reports on driving under low visibility due to low-contrast lighting conditions in PD. This study evaluates the effect of different environmental visibility settings (high contrast = clear sky, low contrast = fog, as in figure 1) on vehicle control (indexed by SD of lateral position [SDLP] and lane violation counts [LVC]) during uneventful driving, and response to sudden hazards under low-contrast visibility conditions in drivers with PD using a driving simulator.
Figure 1 A scene during the drive, shown under both high-visibility (clear sky; A) and low-contrast visibility (fog; B) settings
To test driver response to a sudden hazard under low-contrast visibility conditions, we used a collision avoidance scenario at an intersection.15–17 Although intersections constitute only a small part of the roadways, more than 50% of all crashes in urban areas and more than 30% in rural areas occur at intersections.18
We tested the hypotheses that, compared with neurologically normal drivers, drivers with PD 1) have poorer vehicle control (indexed by SDLP and LVC) under low-contrast visibility conditions and have more deterioration in their vehicle control going from high- to low-contrast visibility condition, and 2) are at a higher risk of crashes in a simulated complex driving situation under low-contrast visibility conditions that posed a hazard for a collision. We hypothesized that driving performance under low-contrast visibility conditions can be predicted using performance on tests of cognitive, visual, and motor function within the PD group.
METHODS
Participants.
The drivers with PD were recruited from the Movement Disorders Clinics at the Department of Neurology, University of Iowa, and Veterans Affairs Medical Center, both in Iowa City. Potential participants were asked consecutively whether they were still licensed and driving. Those who were still driving were offered the opportunity to participate in the study. The controls were respondents to a newspaper ad to recruit comparison drivers without neurologic disease. All participants were examined by a board-certified neurologist with subspecialty training in PD (E.Y.U.) to confirm the diagnosis of PD and rule out neurologic disease in the control group.
We included participants with idiopathic PD (PD group) or without neurologic disease (control group) who were currently active drivers with a valid state driver’s license and driving experience of greater than 10 years.
Exclusion criteria were cessation of driving before the encounter; acute illness or active, confounding medical, neurologic, or psychiatric conditions; secondary parkinsonism (e.g., drug induced); Parkinson-plus syndromes; concomitant treatment with centrally acting dopaminergic blockers within 180 days before baseline; or treatment with any investigational drug within 60 days before baseline.
We performed all testing during the times when the participant would normally feel ready to drive, i.e., during the “on” times, and also allowed participants to take rest periods as needed.
Standard protocol approvals, registrations, and patient consents.
The study was approved by the Institutional Review Boards and Human Subjects Office of the University of Iowa. A written informed consent was obtained from all participants in the study.
Off-road testing battery.
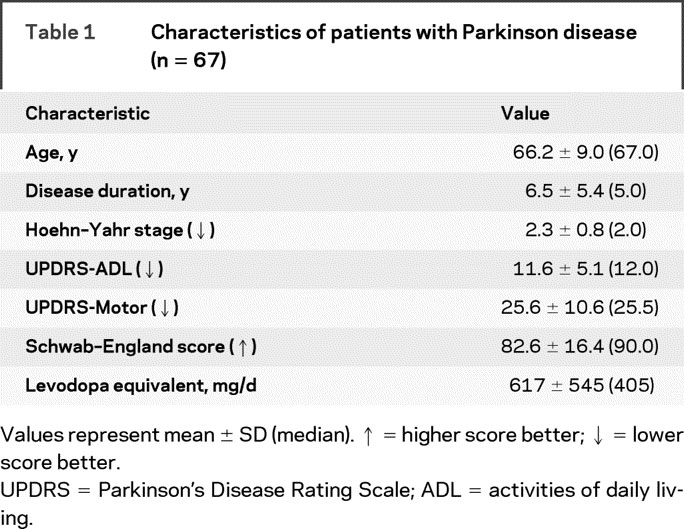
The battery methodology is explained in detail in our recent work.1 For all tests, raw scores were used for analysis. Table 1 and table e-1 on the Neurology® Web site at www.neurology.org show the elements of the off-road battery, abilities tested by each measure, and the direction of good performance. Details on this battery can be found in appendix e-1.
Table 1 Characteristics of patients with Parkinson disease (n = 67)
Driving simulator assessment.
The Simulator for Interdisciplinary Research in Ergonomics and Neuroscience (SIREN) creates an immersive, real-time virtual environment for safely testing driving behavior in subjects with a range of cognitive abilities.19–21 SIREN comprises a 1994 GM Saturn, embedded electronic sensors, miniature video cameras for recording driver performance, a sound system and surrounding screens (150° forward field of view [FOV], 50° rear FOV), 4 LCD projectors with image generators, an integrated host computer, and another computer for scenario design, control, and data collection. A tile-based scenario development tool (DriveSafety, Salt Lake City, UT) allows us to select from multiple road types and populate roadways with different vehicles that interact with the driver and each.
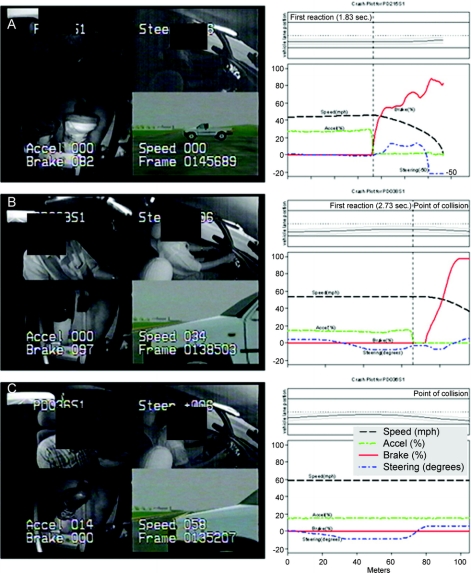
Experimental performance data such as speed, steering wheel position (in degrees), and position of the car in the lane were collected digitally at 30 Hz and reduced to means, SDs, or counts for each virtual road segment. Lane violation (any wheel of the car crossing the lane) counts are obtained using lateral lane position of the vehicle with respect to the center line or the shoulder. Driving performance is captured (at 30 Hz) using miniature cameras to record the scene observed by the driver and provide a backup record of the driver’s performance and lane tracking. Figure 2 shows part of the data output of the simulator superimposed on multiplex views of the participants.
Figure 2 Final moment in the intersection incursion scenario (A) and plots of driver reaction and vehicle kinematics after intersection incursion (B)
Left column: The final moment in the intersection incursion scenario for 3 participants (A, B, and C). The multiplex view shows 4 channels of video data with superimposed digital driving data. The upper left panel shows the driver’s face and the view through the rear window (as seen in the rear view mirror). The upper right panel provides an over-the-shoulder view of the driver’s actions with superimposed steering wheel position (degrees). The lower left panel provides a record of the participant’s control of the foot pedals with superimposed percentage application of the brake and accelerator pedals. The lower right panel displays the view of the forward roadway that the driver should see, with superimposed speed (miles per hour). Right column: Diagrams of vehicle kinematics and the vehicle path after the intersection incursion was triggered (4.0 seconds before the intersection as determined by driver speed) in 3 participants. The common ordinate scale shows the driver’s vehicle speed, percentage of pedal application for accelerator and brake, and steering wheel rotations in degrees (upward deflections are counterclockwise rotations). The x-axis ends at the expected position of the incurring vehicle. The upper panel shows vehicle path inside the lane. (A) A control participant able to stop timely before colliding with the incurring vehicle. At 1.83 seconds after the trigger, he releases the accelerator and starts braking with a smooth deceleration. The brake is applied 82% at the time of stopping. (B) The driver with Parkinson disease (PD) reacts late (2.73 seconds) and collides with the incurring vehicle at 34 mph. (C) This driver with PD does not perceive the incurring vehicle, does not react at all, and crashes at 58 mph.
After familiarizing the driver with the simulator, each participant drove approximately 37 miles on a simulated rural 2-lane highway (speed limit 55 mph = 88.5 km/h) with interactive traffic. The first 30% of the drive took place under high-visibility conditions (clear sky, figure 1), followed by low-contrast visibility conditions that simulated mild fog (figure 1). The high-contrast scene (figure 1A) used the “unlimited” visibility setting (of the HyperDrive simulation software, DriveSafety, Salt Lake City, UT), and the low-contrast scene (figure 1B) used the “1200 m” visibility setting (mild fog). Using luminance values (Luminance Meter LS-110, Konica Minolta, Osaka, Japan) of the incurring vehicle (the truck in figure 2; Lmax) and the background (Lmin) at different distances from the intersection, we observed that the spatial contrast [= (Lmax − Lmin)/(Lmax + Lmin)]22 between the vehicle and the background was markedly greater under high-visibility conditions compared with low-visibility conditions (data not shown).
Mean and median speed, SDLP, and LVC (number of errors per mile) for high- and low-contrast visibility conditions were determined using segments that were comparable in terms of road geometry (straight, 2 lane), ambient traffic (minimal), and difficulty (no secondary task). Increased SDLP and LVC indicate poor vehicle control.23 The participants completed a questionnaire after the drive.24
Intersection incursion scenario.
The simulator drive culminated with a collision avoidance scenario at an intersection under low-contrast visibility conditions. The intersection had a pickup truck positioned in one crossing lane and a sedan in the opposing lane, both waiting to cross perpendicular to the driver (figure e-1). As the driver approached to within 4.0 seconds of the intersection, the pickup truck pulled out in front of the driver.
The main dependent measure was occurrence of a crash, a binary measure. Another dependent measure was time to first reaction (TFR), i.e., time to first driver reaction to avert a collision (releasing the accelerator, or pressing the brake, or steering 10° or more) after the vehicle incursion began. Crash speed was also determined to estimate the severity of the crash if it occurred.
We do not have evidence to directly link intersection incursion scenario crashes with real-world crash results. However, all participants in this study also completed a road test. Across groups, participants who crashed in the simulator had higher error counts on the road than drivers who did not crash (crasher median count = 38.5, noncrasher median count = 31.5, p = 0.027, Wilcoxon rank sum test; unpublished observations).
Statistical analysis.
We compared the PD and control groups with respect to demographic, visual, cognitive, mobility, and vehicle control measures and the TFR using the Wilcoxon rank sum test. Within-group changes in vehicle control measures were analyzed using the Wilcoxon signed rank test. For binary outcomes such as crashes, we calculated odds ratios and tested for significance using logistic regression. To adjust group comparisons for age, education, gender, and other covariates, we used linear regression for continuous outcomes and logistic regression for binary outcomes. Within the PD group, we determined the univariate predictors of SDLP and LVC during low- and high-contrast visibility conditions and of the TFR during the intersection incursion scenario by calculating Spearman correlations between these dependent measures and the off-road battery (demographic characteristics and performance on tests of cognition, vision, and motor function). Multivariate analyses (stepwise regression) were performed using univariate predictors with a p value ≤0.05 to identify the most important predictors for poor vehicle control under low-contrast visibility conditions, and occurrence of crashes and prolonged TFR during the intersection incursion scenario within PD.
RESULTS
Participants.
Thirteen of the 76 drivers with PD (11.8%) and 9 of 64 control drivers (20.3%) did not finish the drive because of simulator discomfort (p = 0.17). Ratings using a standard self-report tool24 did not show a difference in the severity of simulator discomfort between the groups (p > 0.05).
The drivers with PD had mild to moderate disease severity (table 1). The PD group was less educated, had a larger proportion of males, performed worse on neuropsychological and visual tests, showing mild cognitive and visual impairments (table e-1), and performed worse on motor tests, consistent with PD.
Comparison of driving performance between groups.
Vehicle control under low- and high-visibility conditions.
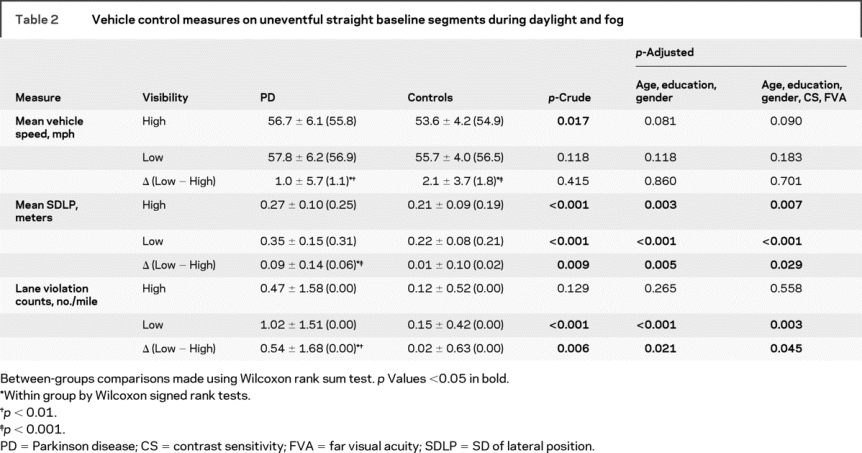
Compared with controls, drivers with PD drove faster (crude p < 0.05, adjusted p < 0.1) and showed poorer vehicle control on the low-contrast visibility (foggy) segment as shown by greater SDLP and LVC (crude p < 0.01, adjusted p < 0.05, table 2). On the high-visibility segment, the PD group tended to have higher SDLP compared with controls, but there was no significant difference in LVC. Vehicle control worsened from high- to low-contrast visibility conditions only within the PD group as manifested by significantly increased SDLP and LVC. The increase in SDLP and LVC from high- to low-contrast visibility conditions was significantly higher in the PD group compared with the control group (table 2), showing that the PD group was more affected by the decrease in visibility created by fog. All group comparisons were adjusted for age, education, gender, far visual acuity [FVA], and CS.
Table 2 Vehicle control measures on uneventful straight baseline segments during daylight and fog
Outcome of the intersection incursion scenario.
The proportion of crashers was higher in the PD group (table e-2): 51 of 67 drivers with PD (76.1%) crashed, whereas only 19 of 51 control drivers (37.3%) crashed in the control group, p < 0.0001. The drivers with PD entered the crash zone at a faster speed than controls (mean ± SD [median] 56.4 ± 6.7 [56.1] vs 53.1 ± 4.9 [54.3], Wilcoxon rank sum, p = 0.003). The mean ± SD (median) speed at the time of collision in crashers with PD, 49.1 ± 13.7 (52.3) mph, was faster than that of controls, 38.5 ± 17.7 (44.7) mph (Wilcoxon rank sum, p = 0.025). The time to first reaction was slower in drivers with PD (table e-2): 2.70 ± 0.79 (2.53) seconds in PD vs 2.07 ± 0.81 (2.00) seconds in controls (p < 0.0001, Wilcoxon rank sum test). The group differences in these comparisons remained significant after adjusting for age, education, gender, FVA, and CS (table e-2). Figure 2 shows vehicle control diagrams during the intersection incursion scenario and multiplex views of the final moment of the scenario in one control who was able to avoid collision (figure 2A) and 2 participants with PD who collided with the incurring vehicle (figure 2, B and C).
Predictors of driving performance under low-contrast visibility conditions in PD.
Vehicle control.
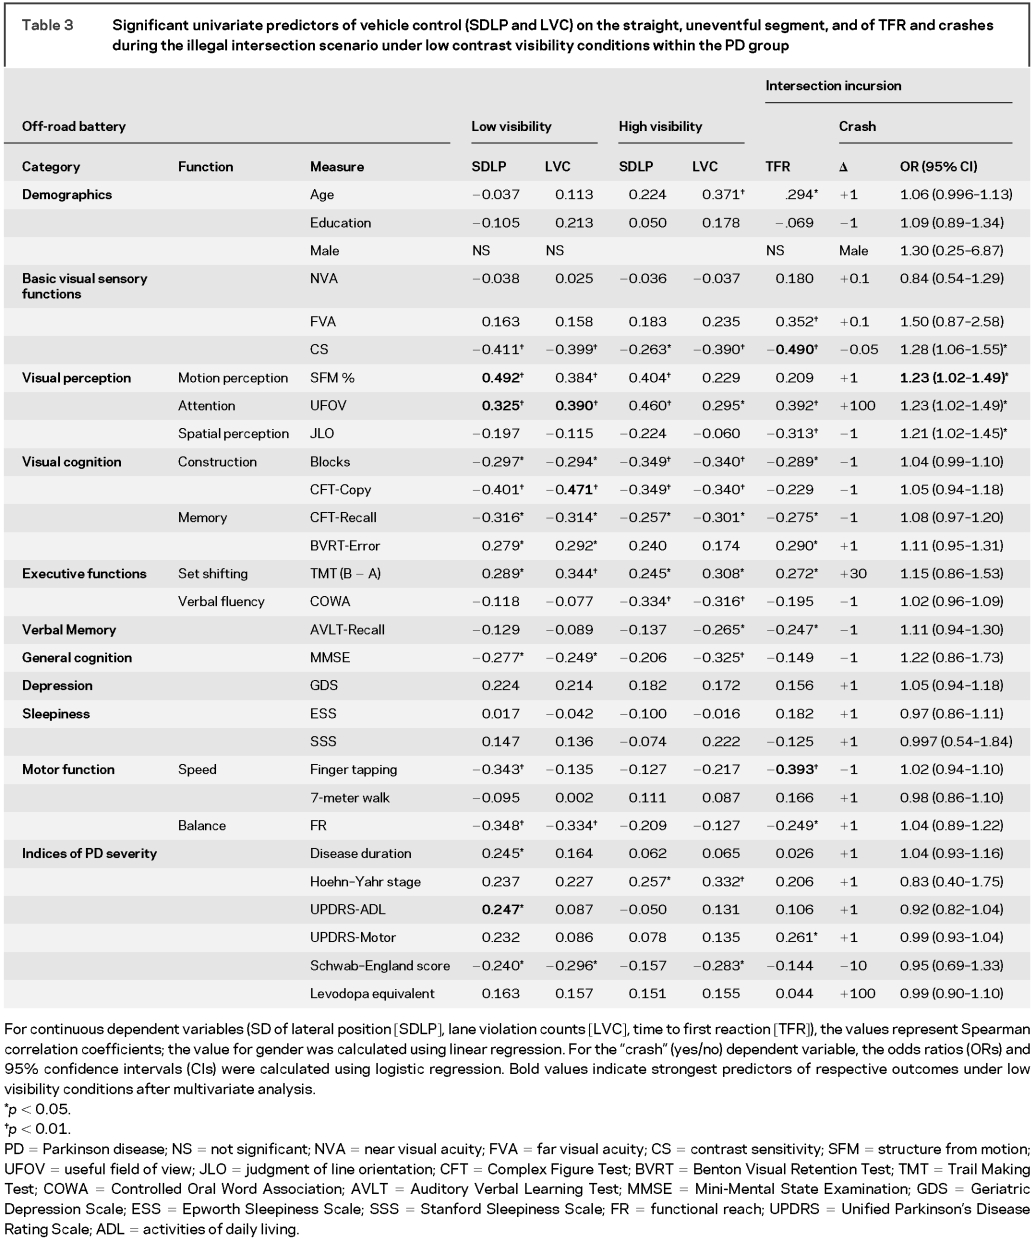
The significant univariate predictors (Spearman correlations, p < 0.05) common to both increased SDLP and LVC within the PD group were worse performances on tests of basic visual sensory function (CS), visual perception (useful field of view [UFOV], structure from motion [SFM]), visual cognition (Blocks, Complex Figure Test [CFT]-Copy, CFT-Recall, Benton Visual Retention Test), general cognition (Mini-Mental State Examination), postural stability functional reach [FR], and level of independence in doing daily chores (Schwab–England scale score), as shown in table 3. Decreased finger tapping speed, longer PD duration, and worse Unified Parkinson’s Disease Rating Scale (UPDRS)–activities of daily living (ADL) scores were also predictive of higher SDLP. Similar visual and cognitive independent variables correlated with vehicle control measures under high-visibility conditions, but indices of motor function such as finger tapping speed and FR did not correlate with driving measures under high-visibility conditions (table 3). Multivariate analysis showed that UFOV and CFT-Copy were the most important predictors of increased LVC, whereas SFM, UFOV, and UPDRS-ADL scores were the most important predictors of increased SDLP under low-contrast visibility conditions.
Table 3 Significant univariate predictors of vehicle control (SDLP and LVC) on the straight, uneventful segment, and of TFR and crashes during the illegal intersection scenario under low contrast visibility conditions within the PD group
Intersection incursion scenario.
The significant univariate predictors of crashes at the foggy intersection within the PD group were worse performances on tests of basic visual sensory function (CS) and visual perception (SFM, UFOV, judgment of line orientation [JLO[) as seen in table 3. Multivariate analysis using stepwise regression showed that impaired motion perception as measured by SFM was the most important predictor crashes within the PD group. The significant univariate predictors (Spearman correlations, p < 0.05) of prolonged TFR to illegal incursion at the foggy intersection within the PD group were older age and worse performances on tests of basic visual sensory function (FVA, CS), visual perception (UFOV, JLO), and motor function (UPDRS-Motor score, speed: finger tapping) as seen in table 3. Multivariate analysis showed that CS and finger tapping were the most important predictors of prolonged TFR.
DISCUSSION
This study showed that drivers with PD had poorer vehicle control and committed more safety errors, and were slower in responding to hazards and at higher risk for crashes compared with controls under simulated low-contrast visibility driving conditions. Transition from high- to low-contrast visibility conditions degraded the performance of drivers with PD more than controls. The adverse effects of low-contrast visibility on driving performance in drivers with PD persisted after group comparisons were adjusted for variety of factors, suggesting that the lower education, predominantly male gender, or impaired basic visual sensory functions such as FVA and CS of the participants with PD were not enough to explain the group differences. Among crashers, drivers with PD crashed at faster speeds than controls, suggesting higher severity collisions.
Poor vehicle control of drivers with PD in fog, as measured by SDLP and LVC, was primarily predicted by worse performances on tests of basic visual sensory function, visual processing speed and attention, motion perception, visuospatial constructional abilities, and visual memory, showing the contribution of visual dysfunction across all levels of the visual system (as documented in PD1) to the degradation of driving safety under low-contrast visibility conditions. Under high-visibility conditions, correlations of vehicle control measures with performances on visual perception and cognition tasks were similar to those observed for low-visibility conditions, consistent with the visual demands of driving. However, worse performance on motor measures (e.g., speed of movement as indexed by finger tapping) correlated with poorer vehicle control predominantly during low-visibility driving, suggesting that motor slowing due to PD can become an important negative factor affecting vehicle control under visually challenging conditions.
Poor performances on measures of visual attention (UFOV → SDLP and LVC) and visuoconstructional abilities (CFT-Copy → LVC) and motion perception (SFM → SDLP, crashes at the intersection) were the most important predictors of impaired driving under low-contrast visibility conditions after multivariate analyses. These findings suggest that disturbances in “higher level” visual functions play an independent and critical role in driving safety under low-contrast visibility conditions in PD, even in the presence of reduced basic sensory functions such as visual acuity or CS.
Cognitive and visual impairments due to PD were the primary predictors of driving outcomes in our study consistent with previous research by us14,25,26 and others.12,13,27–34 Here, we also find that motor dysfunction of PD is associated with poor driving outcomes as shown by the correlation of indices of PD severity with vehicle control measures and TFR to the intersection incursion. Poor postural stability (reduced FR) and low levels of independence (low SE scores) correlated with both high SDLP and LVC. Finger tapping speed, disease duration, and UPDRS-ADL score also correlated with SDLP, and poor UPDRS-ADL score was one of the most important predictors of high SDLP. High motor UPDRS score and reduced finger tapping speed correlated with TFR. Furthermore, reduced tapping speed emerged as one of the 2 most important predictors of the slowing of the TFR after multivariate analysis, suggesting that worse motor function might have indirectly contributed to the occurrence of crashes, independent of cognitive and visual dysfunction of PD.
Contribution of motor dysfunction to poor driving performance in PD was also reported by others.12,30,32,35 The predictors of driving performance in PD may depend on the task demands. For example, in our previous work on driving performance and safety during multitasking with secondary visual and cognitive demands, the predictors of driving performance outcomes were measures of visual and cognitive function.14,25,26 Motor dysfunction becomes an important predictor of driving performance when speed of behavior is critical as in responding to sudden hazards as in our intersection incursion scenario or controlling the lane position of the vehicle under challenging low-contrast visibility conditions.
Our study had various limitations: We did not compare response to hazardous intersection incursion under high- and low-contrast visibility conditions. The intersection incursion scenario in fog was placed as a terminal event in the drive. Experiencing a similar crash event during a prior phase in high-visibility conditions and then continuing the drive could have diminished the realism of this simulated drive and would have introduced practice effects. Another limitation could be that the order of presentation of high- and low-visibility driving segments was the same for all participants, raising the question of whether fatigue over the course of the drive might have contributed to poorer performance on the low-visibility segment. However, both participants with PD and control participants rated their level of sleepiness and boredom as low on the postdrive questionnaire,24 and these measures were not associated with change in vehicle control measures from high- to low-visibility settings.
Use of a driving simulator allowed us to make observations of the behavior of drivers with PD under challenging low-contrast visibility conditions in a controlled and safe manner. Our results suggest that a large proportion of drivers with PD maybe at further risk for unsafe driving during fog or twilight because of visual, cognitive, and motor impairments.
AUTHOR CONTRIBUTIONS
Statistical analysis was performed by J.D.D., E.D., J.S., and E.Y.U.
DISCLOSURE
Dr. Uc has received speaker honoraria for activities not sponsored by industry and has received an honorarium from Current Medicine Group LLC for writing an invited article; has served as a grant reviewer for the Parkinson Study Group; and receives research support from the NIH [NINDS NS044930 (PI)], the US Department of Veterans Affairs [Merit Review from Rehabilitation R&D Branch; B6261R (PI) and 1 I01 RX000170 (PI)], and the Parkinson Disease Foundation. Dr. Rizzo, Dr. Anderson, Ms. Dastrup, and Mr. Sparks report no disclosures. Dr. Dawson received honoraria from the NIH for serving on review panels and data safety monitoring boards and as a grant reviewer for Singapore NMRC and the Canada Foundation for Innovation; and has received research support as a Coinvestigator from the NIH [NS044930, HL082711, AG17177, AG026027, HL087761, HL61857, HL54730, HL070740, AI053034, and AG15071] and the USDVA [B5-4394R].
Supplementary Material
Address correspondence and reprint requests to Dr. Ergun Y. Uc, Department of Neurology, University of Iowa, Carver College of Medicine, 200 Hawkins Dr., 2RCP, Iowa City, IA 52242 ergun-uc@uiowa.edu
Supplemental data at www.neurology.org
Supported by National Institute of Neurological Disorders and Stroke R01 NS044930 (Predicting Driver Safety in Parkinson’s Disease) to E.Y.U., and NIA R01 AG 17717 and NIA R01 AG 15071 to M.R.
Disclosure: Author disclosures are provided at the end of the article.
Received March 3, 2009. Accepted in final form July 14, 2009.
REFERENCES
- 1.Uc EY, Rizzo M, Anderson SW, et al. Visual dysfunction in Parkinson disease without dementia. Neurology 2005;65:1907–1913. [DOI] [PubMed] [Google Scholar]
- 2.Pieri V, Diederich NJ, Raman R, et al. Decreased color discrimination and contrast sensitivity in Parkinson’s disease. J Neurol Sci 2000;172:7–11. [DOI] [PubMed] [Google Scholar]
- 3.Hutton JT, Morris JL, Elias JW. Levodopa improves spatial contrast sensitivity in Parkinson’s disease. Arch Neurol 1993;50:721–724. [DOI] [PubMed] [Google Scholar]
- 4.Jones RD, Donaldson IM, Timmings PL. Impairment of high-contrast visual acuity in Parkinson’s disease. Mov Disord 1992;7:232–238. [DOI] [PubMed] [Google Scholar]
- 5.Price MJ, Feldman RG, Adelberg D, et al. Abnormalities in color vision and contrast sensitivity in Parkinson’s disease. Neurology 1992;42:887–890. [DOI] [PubMed] [Google Scholar]
- 6.Hutton JT, Morris JL, Elias JW, et al. Spatial contrast sensitivity is reduced in bilateral Parkinson’s disease. Neurology 1991;41:1200–1202. [DOI] [PubMed] [Google Scholar]
- 7.Mestre D, Blin O, Serratrice G, et al. Spatiotemporal contrast sensitivity differs in normal aging and Parkinson’s disease. Neurology 1990;40:1710–1714. [DOI] [PubMed] [Google Scholar]
- 8.Struck LK, Rodnitzky RL, Dobson JK. Circadian fluctuations of contrast sensitivity in Parkinson’s disease. Neurology 1990;40:467–470. [DOI] [PubMed] [Google Scholar]
- 9.Bodis-Wollner I, Marx MS, Mitra S, et al. Visual dysfunction in Parkinson’s disease: loss in spatiotemporal contrast sensitivity. Brain 1987;110(pt 6):1675–1698. [DOI] [PubMed] [Google Scholar]
- 10.Bulens C, Meerwaldt JD, van der Wildt GJ, et al. Contrast sensitivity in Parkinson’s disease. Neurology 1986;36:1121–1125. [DOI] [PubMed] [Google Scholar]
- 11.Kupersmith MJ, Shakin E, Siegel IM, et al. Visual system abnormalities in patients with Parkinson’s disease. Arch Neurol 1982;39:284–286. [DOI] [PubMed] [Google Scholar]
- 12.Devos H, Vandenberghe W, Nieuwboer A, et al. Predictors of fitness to drive in people with Parkinson disease. Neurology 2007;69:1434–1441. [DOI] [PubMed] [Google Scholar]
- 13.Worringham CJ, Wood JM, Kerr GK, et al. Predictors of driving assessment outcome in Parkinson’s disease. Mov Disord 2006;21:230–235. [DOI] [PubMed] [Google Scholar]
- 14.Uc EY, Rizzo M, Anderson SW, et al. Impaired visual search in drivers with Parkinson’s disease. Ann Neurol 2006;60:407–413. [DOI] [PubMed] [Google Scholar]
- 15.Reinach SJ, Rizzo M, McGehee DV. Driving with Alzheimer disease: the anatomy of a crash. Alzheimer Dis Assoc Disord 1997;11(suppl 1):21–27. [PubMed] [Google Scholar]
- 16.Rizzo M, Reinach S, McGehee D, et al. Simulated car crashes and crash predictors in drivers with Alzheimer disease. Arch Neurol 1997;54:545–551. [DOI] [PubMed] [Google Scholar]
- 17.Rizzo M, McGehee DV, Dawson JD, et al. Simulated car crashes at intersections in drivers with Alzheimer disease. Alzheimer Dis Assoc Disord 2001;15:10–20. [DOI] [PubMed] [Google Scholar]
- 18.Kuciemba SR, Cirillo JA. Safety Effectiveness of Highway Design Features: Vol V, Intersections. Washington, DC: Federal Highway Administration; 1992. FHWA-RD-91-048.
- 19.Uc EY, Rizzo M, Anderson SW, et al. Unsafe rear-end collision avoidance in Alzheimer’s disease. J Neurol Sci 2006;251:35–43. [DOI] [PubMed] [Google Scholar]
- 20.Rizzo M, Jermeland J, Severson J. Instrumented vehicles and driving simulators. Gerontechnology 2002;1:291–296. [Google Scholar]
- 21.Rizzo M, Shi Q, Dawson JD, et al. Stops for cops: impaired response implementation for older drivers with cognitive decline. Transportation Res Rec 2005;1992:1–8. [Google Scholar]
- 22.Broughton KL, Switzer F, Scott D. Car following decisions under three visibility conditions and two speeds tested with a driving simulator. Accid Anal Prev 2007;39:106–116. [DOI] [PubMed] [Google Scholar]
- 23.Brookhuis KA, de Waard D, Fairclough SH. Criteria for driver impairment. Ergonomics 2003;46:433–445. [DOI] [PubMed] [Google Scholar]
- 24.Rizzo M, Sheffield RA, Stierman L, et al. Demographic and driving performance factors in simulator adaptation syndrome. In: Proceedings of the Second International Driving Symposium on Human Factors in Driver Assessment, Training and Vehicle Design. Iowa City: University of Iowa; 2003:201–208. [Google Scholar]
- 25.Uc EY, Rizzo M, Anderson SW, et al. Impaired navigation in drivers with Parkinson’s disease. Brain 2007;130:2433–2440. [DOI] [PubMed] [Google Scholar]
- 26.Uc EY, Rizzo M, Anderson SW, et al. Driving with distraction in Parkinson disease. Neurology 2006;67:1774–1780. [DOI] [PubMed] [Google Scholar]
- 27.Heikkila VM, Turkka J, Korpelainen J, et al. Decreased driving ability in people with Parkinson’s disease. J Neurol Neurosurg Psychiatry 1998;64:325–330. [DOI] [PMC free article] [PubMed] [Google Scholar]
- 28.Wood JM, Worringham C, Kerr G, et al. Quantitative assessment of driving performance in Parkinson’s disease. J Neurol Neurosurg Psychiatry 2005;76:176–180. [DOI] [PMC free article] [PubMed] [Google Scholar]
- 29.Amick MM, Grace J, Ott BR. Visual and cognitive predictors of driving safety in Parkinson’s disease patients. Arch Clin Neuropsychol 2007;22:957–967. [DOI] [PMC free article] [PubMed] [Google Scholar]
- 30.Madeley P, Hulley JL, Wildgust H, et al. Parkinson’s disease and driving ability. J Neurol Neurosurg Psychiatry 1990;53:580–582. [DOI] [PMC free article] [PubMed] [Google Scholar]
- 31.Moller JC, Stiasny K, Hargutt V, et al. Evaluation of sleep and driving performance in six patients with Parkinson’s disease reporting sudden onset of sleep under dopaminergic medication: a pilot study. Mov Disord 2002;17:474–481. [DOI] [PubMed] [Google Scholar]
- 32.Zesiewicz TA, Cimino CR, Malek AR, et al. Driving safety in Parkinson’s disease. Neurology 2002;59:1787–1788. [DOI] [PubMed] [Google Scholar]
- 33.Stolwyk RJ, Triggs TJ, Charlton JL, et al. Impact of internal versus external cueing on driving performance in people with Parkinson’s disease. Mov Disord 2005;20:846–857. [DOI] [PubMed] [Google Scholar]
- 34.Stolwyk RJ, Triggs TJ, Charlton JL, et al. Effect of a concurrent task on driving performance in people with Parkinson’s disease. Mov Disord 2006;21:2096–2100. [DOI] [PubMed] [Google Scholar]
- 35.Radford K, Lincoln N, Lennox G. The effects of cognitive abilities on driving in people with Parkinson’s disease. Disabil Rehabil 2004;26:65–70. [DOI] [PubMed] [Google Scholar]
Associated Data
This section collects any data citations, data availability statements, or supplementary materials included in this article.


