Abstract
Recently, next-generation sequencing has been introduced as a promising, new platform for assessing the copy number of transcripts, while the existing microarray technology is considered less reliable for absolute, quantitative expression measurements. Nonetheless, so far, results from the two technologies have only been compared based on biological data, leading to the conclusion that, although they are somewhat correlated, expression values differ significantly. Here, we use synthetic RNA samples, resembling human microRNA samples, to find that microarray expression measures actually correlate better with sample RNA content than expression measures obtained from sequencing data. In addition, microarrays appear highly sensitive and perform equivalently to next-generation sequencing in terms of reproducibility and relative ratio quantification.
Keywords: next-generation sequencing, microarrays, microRNA, gene expression, RNA quantification, Illumina
INTRODUCTION
For the past decade, microarrays have grown in popularity as the primary tool for gene expression analysis. Recently, however, “digital gene expression” by next-generation sequencing has been introduced as a promising, new platform for assessing the copy number of transcripts, thereby providing a digital record of the numerical frequency of a sequence in a sample.
So far, the general assumption that microarrays are producing less reliable, absolute quantitative measurements is based on comparison studies, assuming that sequencing provides a better approximation of the actual transcript content in a sample. Such studies compare microarray data from biological samples to Illumina sequencing data (Marioni et al. 2008; ′t Hoen et al. 2008) or to massively parallel signature sequencing (MPSS) data (Coughlan et al. 2004; Chen et al. 2007; Liu et al. 2007). However, most high-throughput sequencing methods rely on a polymerase chain reaction (PCR) based sample amplification step, in which bias may be introduced. This is the case for Roche's 454 (GS FLX), Illumina's Genome Analyzer (GA), and ABI's SOLiD technologies. Although ratios from microarray and sequencing data have been found to correlate (Marioni et al. 2008; ′t Hoen et al. 2008), no previous study has evaluated next-generation sequencing and microarray technologies by directly comparing data from samples with well-defined RNA content.
Here, we address the question of relative and absolute RNA quantification using Exiqon's LNA-based microarrays and Illumina's GA-II sequencing platform. Furthermore, we assess the two platforms’ sensitivity and reproducibility. For this purpose, we constructed two synthetic samples from 744 synthetic RNA oligos reflecting the biological variation of real microRNA samples, but without the noise from unspecified RNA components. This approach enables a direct comparison of obtained expression data from each platform to the known RNA content.
RESULTS AND DISCUSSION
Artificial samples A and B
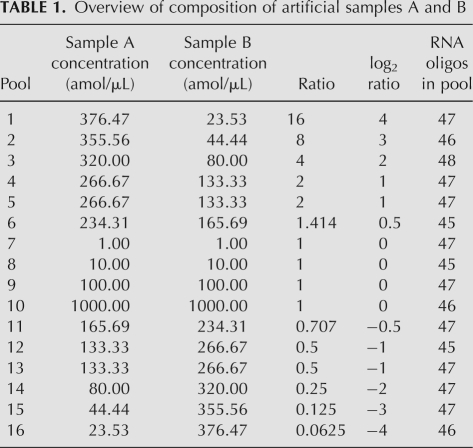
Two artificial samples (A and B) were constructed by mixing different amounts of the 16 synthetic RNA pools (comprising a total of 744 RNA oligos), as listed in Table 1. A comparison of these two samples gives us 11 different expected log2 ratios in the −4 to 4 range, and measurements at 14 different concentrations spanning four orders of magnitude. By using such “constructed” samples in the analysis instead of biological samples, the measurements from each platform may be compared to the “actual” RNA concentrations/content based on optical density and chemical high-performance liquid chromatograph (HPLC) analysis of individual synthetic RNAs.
TABLE 1.
Overview of composition of artificial samples A and B
By using pools, in which the most similar sequences were distributed in separate pools, any cross-hybridization on the array platform will affect the result more severely than if similar sequences were grouped together in the same pool. For example, if a probe targeting an RNA present at 1 amol/μL concentration cross-hybridizes to an RNA present at 1000 amol/μL concentration, it will affect the expression value more than if it just cross-hybridized to an RNA present at the same concentration. Thus, by using similarity separated RNA pools rather than similarity pooled RNAs the experiment is designed to maximally challenge the performance of the microarrays or any other expression technique with potential “cross-hybridization” issues.
Absolute and relative quantification
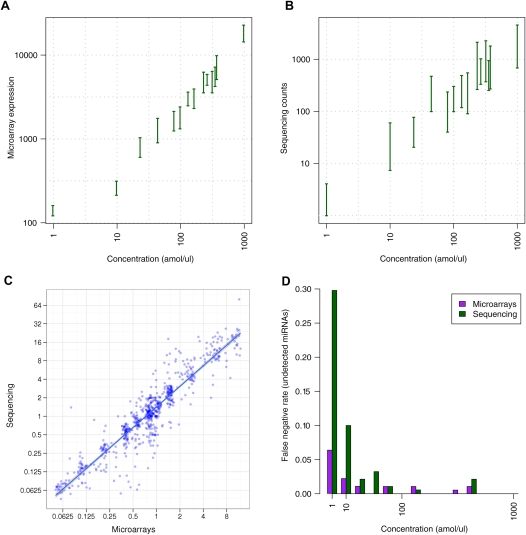
Good absolute gene expression measurements are required for studies comparing the expression of different genes, for example when identifying which microRNAs are highly expressed. Here, we found that microarray data correlated well with the known RNA concentration (r = 0.69) (Fig. 1A), while sequencing data were significantly less correlated (r = 0.50; Fisher's z test for difference in correlation coefficients: P-value < 2.74e−08) (Fig. 1B).
FIGURE 1.
Comparison of microarray and sequencing data. (A,B) Ninety-five percent confidence intervals for sample A intensities versus RNA concentrations. (C) Illumina sequencing ratios versus microarray ratios. (D) Bar plot of the undetected fraction (false discovery rate) of synthetic RNAs at each concentration. The lower the bar, the better sensitivity.
Figure 1, A and B, illustrates the estimated 95% confidence intervals for expression measures at each of the 14 concentrations. Here, it appears that expression measures from sequencing vary more within each concentration. Consequently, microarray data may provide a more confident measure of absolute gene expression for predicting if one miRNA is truly expressed at a higher rate than another. In fact, we estimated that for microarrays, on average, a 72 amol/μL difference in concentration is needed for a statistically significant difference (P-value < 0.05) in absolute expression values between pools of synthetic RNAs, while for sequencing a minimum of 125 amol/μL concentration difference is necessary.
While we do not suggest that microarrays are indeed quantitative, it is surprising that we find them to be more correlated with RNA content than expression sequencing, a platform commonly believed to be more quantitative than microarrays. However, next-generation sequencing is still in its infancy, while microarray probes have been Tm (melting temperature) normalized and perfected over several array generations, thus increasingly limiting the noise contribution from variations in hybridization efficiency.
Also worth noticing is that, even though sequencing counts spanned three orders of magnitude wider than microarray expression intensities (∼1–670,000 counts for sequencing versus ∼100–65,000 intensity for arrays), the 95% confidence intervals of counts lie within the same dynamic range (three orders of magnitude).
Interestingly, only intermediate correlations were found between absolute expression measurements from the two platforms—microarray intensities versus sequencing counts (r = 0.47) (Supplemental Fig. 1). On the other hand, for relative quantification (ratios between sample A and B expression measures), data from the two platforms were highly correlated (r = 0.93) (Fig. 1C), and both correlated extremely well with the expected ratios (r = 0.96) (Supplemental Fig. 2). Ratios from sequencing were close to the expected (slope ∼0.97), while ratios were slightly underestimated for microarrays (slope ∼0.8), which is a commonly observed phenomenon for microarray fold changes (Wurmbach et al. 2003). This does not necessarily mean that expression sequencing is more likely to find significant differential expression than microarrays, since this depends on a system's overall signal-to-noise ratio, that is, lower variance between repeated measurements would compensate for reduced ratios. Although we observed a slightly lower variance between replicates (synthetic RNAs with the same concentration in samples A and B) in the microarray data, this may be due to differences in the technicians’ experience with the platforms.
Reproducibility and sensitivity
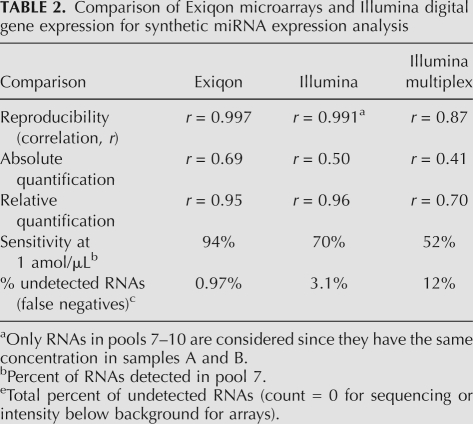
To further assess data quality, we examined reproducibility and sensitivity in terms of detected/undetected synthetic RNAs. The results are summarized in Table 2 and Figure 1D. Generally, data from both platforms were highly reproducible (r ≈ 1) (Table 2), while microarrays were more sensitive than sequencing, especially at the lowest concentration.
TABLE 2.
Comparison of Exiqon microarrays and Illumina digital gene expression for synthetic miRNA expression analysis
For sequencing data, the low sensitivity was found when accepting miRNAs with one sequencing count as detected. However, numerous unmapped sequences were also identified, many with counts considerably higher than 1. In fact, 16% of all reads (sample A) did not match perfectly to any of the synthetic RNAs. Also, we found >130,000 different read sequences among reads from each of samples A and B, although only 744 different synthetic RNA oligo sequences were present originally in each sample. This is in line with the previously reported sequence read variation issue on the Illumina sequencing platform (Dohm et al. 2008).
Sequencing data “sequence variation”
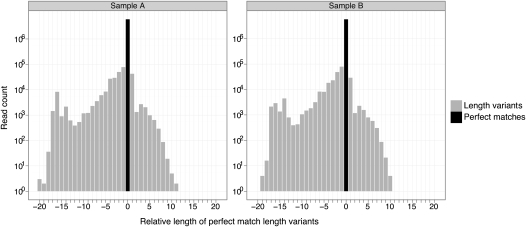
A majority of read variants (∼88% of unique sequences) could be aligned to the synthetic reference sequences by allowing a maximum of three sequence errors/mismatches. These included 10% length variants (sample A) that aligned perfectly to the synthetic reference sequence either in its full read length or the full synthetic sequence's length. Of these, approximately half were shorter length variants that may be somewhat explained by truncated RNA impurities in the synthetic sample. The average read count of variant reads was 9, with maximum counts of 17,396 and 8,817 in samples A and B, respectively. Figure 2 illustrates the variations in read lengths for all length variants. The remaining 12% and 11% read variants (samples A and B, respectively) did not resemble any of the synthetic RNAs, thus posing a challenge for correct discovery by de novo sequencing.
FIGURE 2.
Histogram of read variants’ lengths in Illumina sequencing data. The black bar shows the number of exact sequence read matches for all synthetic RNAs, while the gray bars show the number of length variants that are perfect matches but shorter or longer than the synthetic RNA it resembles the most. “Relative length” is the read length relative to the length of the synthetic RNA it resembles the most.
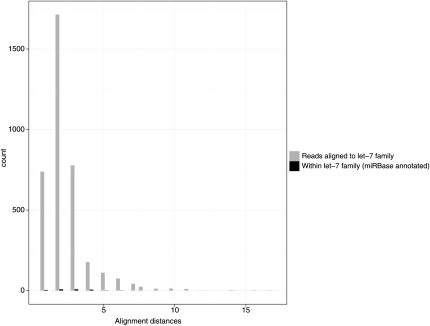
Sequencing “errors” for synthetic RNA reads were compared with the single-nucleotide variations known to exist within miRNA families, such as the well-characterized let-7 family. Here, sequence read variations found in Illumina GA-II sequencing data were much higher than variations found within the miRNA family (Fig. 3). On microarrays, families of close homologous miRNAs can lead to cross-hybridization when sequence variations are found in the sequence extremities. Likewise, digital gene expression by sequencing apparently has a “cross-sequencing” specificity issue, making it hard to distinguish expression of closely related RNAs.
FIGURE 3.
Histogram of the alignment distances (sum of mismatches and gaps in alignments) between the human let-7 family sequences (black) according to the miRBase sequences and unique variant reads aligning to the let-7 family members (gray) as its best match. In comparison, many variant read sequences have much higher alignment distances to their closest matching synthetic RNA sequence than alignment distances observed within the let-7 miRNA family.
The observed gross sequence variation and the identified longer variants may reflect the amount of errors introduced during sample preparation (PCR) or sequencing. Ideally, pre-processing such as sequence correction by evaluating read quality scores in conjunction with genome mapping would improve the results obtained from sequencing. We tested pre-processing with Bowtie (Langmead et al. 2009), a sequence read genome alignment program with a quality-aware backtracking algorithm that permits mismatches. However, although various settings were tested, this type of pre-processing not only resulted in decreased sensitivity, but also reduced absolute and relative quantification correlations slightly (data not shown). This may be due to the particular sequence properties of miRNAs, for which single-nucleotide differences often exist between miRNA family members. As discussed above, this within miRNA family sequence variation was much lower than the observed read sequence variation.
Also, sequence neighborhood-based correction methods developed for SAGE libraries (Akmaev and Wang 2004; Beissbarth et al. 2004) may be adapted to correct sequence bias in next-generation sequencing data. However, although these algorithms may succeed somewhat in correcting sequencing bias, they are also susceptible to over-correction of low abundant miRNA sequences that are similar to high abundant reads with reduced sensitivity as a consequence.
We acknowledge that the Illumina GAII sequencer is a very sensitive instrument, and that the protocol for library preparation may have a crucial impact on the results. Thus, improved sample preparation protocols for small RNA sequencing libraries, such as the one (v.1.5) recently developed by Illumina (fewer gel purification steps and fewer PCR cycles), are more likely to limit sequencing bias than the application of sophisticated bias correction algorithms. However, this remains to be experimentally verified. Although the original sample preparation protocol was applied in this study, one of the critical gel elution steps was skipped since the synthetic RNA library did not require any size fractioning, thus limiting the sources of experimental bias in this study.
Multiplexed high-throughput expression sequencing affects data quality
To increase throughput for expression sequencing, samples may be run in a multiplexed experimental setup. The multiplexed approach resulted in decreased sensitivity due to reduced sequencing depth and, overall, a significantly lower data quality in terms of reproducibility, absolute quantification, and even relative quantification (Table 2). For example, the correlation for ratio data (relative expression quantification) dropped to an average of 0.70 (compared to 0.96 for single-sample sequencing protocol), and only 52% of the RNAs were detected at the lowest concentration compared to 70% for single-sample sequencing (see the details in Supplemental Note 1). The somehow poorer results obtained with the multiplexed setup are most probably due to the bar-coding step, where individual barcodes may have differential ligation and amplification efficiencies, which will skew the results.
Supporting results
Supporting the results presented here for Exiqon's microarrays, we obtained similar absolute quantitative correlations from Agilent's microarrays for the subset of synthetic microRNAs targeted by this array platform (Supplemental Note 2). The observed lower sensitivity (78% of covered microRNAs) of Agilent's microarrays (Supplemental Note 2), however, indicates that sensitivity is a product-specific parameter and independent of the chosen technology.
Concluding remarks
Previous evaluations of expression analysis platforms all rely on measurements from biological samples compared with data obtained by another expression measurement technology (Coughlan et al. 2004; Chen et al. 2007; Liu et al. 2007; Arikawa et al. 2008; Marioni et al. 2008; ′t Hoen et al. 2008). In contrast to this, our experimental approach, using synthetic RNAs with known sequences and concentrations, produces a well-characterized input as the basis for estimates of each platform's performance (summarized in Table 2).
In conclusion, for quantification of small RNAs such as microRNAs, microarray expression analysis appears as a both highly specific and very sensitive technology that still surpasses next-generation sequencing with respect to absolute RNA expression quantification. Nonetheless, sequencing offers other advantages, such as enabling discovery of new sequence variants, although our study indicates that thorough filtering is important in order to avoid over-interpretation of potential sequencing errors. Both technologies deliver highly reproducible expression data and perform well in relative gene expression studies.
MATERIALS AND METHODS
Synthetic RNA
All synthetic RNAs used in this study were 5′ phosphorylated RNA molecules (IDT) that were between 18 and 28 nucleotides (nt) long and HPLC purified. Concentration was determined by OD260, and all oligos where validated by mass spectrometry (ESI) and capillary electrophoresis. The purity was >90% on average and >84% for 90% of the synthetic RNAs. Due to the applied RNA synthesis and purification technique, impurities may only be attributed to truncated—shorter—RNA oligos with incomplete RNA synthesis. That is, once a synthesis coupling fails, the oligo is not extended further and results in a shorter variant of the expected oligo sequence.
Synthetic miRNA pools
We constructed a library of 744 synthetic RNA sequences, corresponding to 708 human mature microRNAs (miRNAs) from miRBase (http://microrna.sanger.ac.uk/) version 10.0 as well as 36 in-house miRNA sequences. The additional 36 in-house miRNAs comprise a subset of RNAs with particularly similar sequences. RNAs were divided into 16 different pools of ∼47 oligos each. Similar sequences where placed in separate pools according to a divisive clustering scheme (see the details in the Supplemental Methods). In this way, miRNA sequences within a pool are less likely to cross-hybridize to the same probes and also less likely to hybridize to each other in solution.
Illumina Genome Analyzer data
Pre-processed Illumina sequencing data were obtained from service provider Fasteris in Switzerland (http://www.fasteris.com/). Here, samples were prepared using Illumina's small RNA sample preparation protocol, although the first gel purification step for purification of small RNAs was skipped for the synthetic RNAs. Samples were then sequenced in separate lanes on an Illumina GA-II instrument. Reads were trimmed for adapter sequences using standard settings in Illumina's GAPipeline1.0. In brief, the data were screened for the sequence of the 5′ adapter using the last 10 bases of this adapter. Then, all reads were processed for the 3′ adapter location and removal. The adapter sequences were trimmed in three steps:
The 21-nt adapter sequence was used to identify “inserts” of 15 nt or less.
If no adapter sequence was found, in successive steps, the last base of the adapter was removed and the sequence was searched at the end of the reads. The minimum adapter size of six bases permits identifying inserts of up to 30 bases.
Finally the remaining reads were searched for nonexact matches of the adapter. The first four bases of the adapter were searched within the full read sequences, and at least 75% of the following bases must be identical to the adapter sequence (maximum = 31 nt). One PhiX lane was used as the reference channel for the calculation of the phasing and pre-phasing (note: This lane is used for the validation of the quality of the run by an Eland mapping). Then the sequences were passed through the chastity filter of value “>0.6.”
Pre-processed Illumina data were matched to the known synthetic RNA sequences. Only perfect matches were counted in the main analysis. Sensitivity was estimated as the fraction of synthetic RNAs detected at each concentration (minimum count = 1). For correlation calculations, one pseudocount was added to all counts to avoid having to take the log of zero.
For analysis of read variations on the Illumina platform, read sizes at least 5 nt were aligned to the synthetic RNA sequences using Vmatch (http://www.vmatch.de). If multiple alignments were found for a read, only the closest match was kept.
Additional pre-processing by genome matching was assessed with Bowtie (Langmead et al. 2009) using NCBI v36 of the human genome and default parameters except for including Illumina's quality scores and guaranteeing best possible alignments. Additional changes to parameters were tested to improve genome mapping such as reducing seed length, limiting number of allowed mismatches, and limiting low quality reads.
Exiqon microarrays
Microarray experiments were conducted as single-channel Hy3 experiments in duplicates on Exiqon's miRCURY LNA microRNA Array, v.10.0. The RNA labeling was done according to the Exiqon protocol: miRCURY LNA microRNA Array Power Labeling kit without the use of synthetic spike controls. Hybridization of labeled RNA to the array was performed on a Tecan HS Pro 4800 hybridization station.
Slides were scanned using Agilent DNA microarray scanner model G2565BA and image analysis was conducted in Feature Extraction 9.5.3. The median of the spot median signals was used as the raw expression value. Only probes with a single synthetic RNA target were considered. If a synthetic RNA target had multiple probes targeting it, the median of the signals was used.
The background signal was estimated as the median intensity from extended spike-in control spots, since spike-ins were not included in the hybridization mixture. Sensitivity was estimated as the fraction of synthetic RNAs with signal above the background level.
Raw data
The microarray data and the Illumina expression sequencing data have been submitted to the Gene Expression Omnibus (GEO) database under the series accession number GSE14511. Here, the concentration for each individual synthetic RNA is also listed for the expression data in samples A and B.
Data analysis
Absolute and relative quantification were estimated as Pearson correlation coefficients between logged expression values and logged RNA concentrations (absolute quantification) or logged expression ratios and logged RNA concentration ratios. A Fisher's z test was used to compare two correlation coefficients.
For microarrays, the reproducibility score is the Pearson correlation between logged expression values for replicate samples. For sequencing data, the reproducibility score is the Pearson correlations between logged counts for RNAs in pools 7–10, for which the concentrations are identical in samples A and B.
Ratio reproducibility scores are the mean of the Pearson correlations for all combinations of sample A versus sample B ratios (microarrays only).
Ninety-five percent confidence intervals of expression measurements for individual pools were estimated as ±1.58 IQR/sqrt(n) (n, number of observations; IQR, the interquartile range), which is roughly a 95% confidence interval for the difference in two medians (McGill et al. 1978).
The difference in RNA concentration necessary to detect a significant difference between the expression levels (median expression) of two miRNAs was estimated by using the information from the pool-to-pool expression variation. Thus, we computed log P-values (two-sided Wilcoxon rank sum tests) for each pool-to-pool combination (e.g., comparison of expression values from pool 1 miRNAs with pool 2 miRNAs). We then fitted a regression line to the concentration difference versus log P-values, obtained by comparing expression measurements for each pool with all other pools. From this regression line, we estimated the concentration difference necessary to produce a significant P-value of 0.05.
SUPPLEMENTAL MATERIAL
Supplemental material can be found at http://www.rnajournal.org.
ACKNOWLEDGMENTS
We thank Christina Wolsted, Søs M. Ludvigsen, Gitte Friis, and Tina S. Bisgaard for technical assistance, and Carsten Alsbo for feedback on the manuscript. We also thank Dr. Laurent Farinelli at Fasteris for help with evaluating the bar-code data and for the small RNA sample preparation protocols.
Footnotes
Article published online ahead of print. Article and publication date are at http://www.rnajournal.org/cgi/doi/10.1261/rna.1699809.
REFERENCES
- Akmaev VR, Wang CJ. Correction of sequence-based artifacts in serial analysis of gene expression. Bioinformatics. 2004;20:1254–1263. doi: 10.1093/bioinformatics/bth077. [DOI] [PubMed] [Google Scholar]
- Arikawa E, Sun Y, Wang J, Zhou Q, Ning B, Dial SL, Guo L, Yang J. Cross-platform comparison of SYBR® Green real-time PCR with TaqMan PCR, microarrays and other gene expression measurement technologies evaluated in the MicroArray Quality Control (MAQC) study. BMC Genomics. 2008;9:328. doi: 10.1186/1471-2164-9-328. [DOI] [PMC free article] [PubMed] [Google Scholar]
- Beissbarth T, Hyde L, Smyth GK, Job C, Boon WM, Tan SS, Scott HS, Speed TP. Statistical modeling of sequencing errors in SAGE libraries. Bioinformatics. 2004;20(Suppl 1):i31–i39. doi: 10.1093/bioinformatics/bth924. [DOI] [PubMed] [Google Scholar]
- Chen J, Agrawal V, Rattray M, West MA, St Clair DA, Michelmore RW, Coughlan SJ, Meyers BC. A comparison of microarray and MPSS technology platforms for expression analysis of Arabidopsis. BMC Genomics. 2007;8:414. doi: 10.1186/1471-2164-8-414. [DOI] [PMC free article] [PubMed] [Google Scholar]
- Coughlan SJ, Agrawal V, Meyers B. A comparison of global gene expression measurement technologies in Arabidopsis thaliana. Comp Funct Genomics. 2004;5:245–252. doi: 10.1002/cfg.397. [DOI] [PMC free article] [PubMed] [Google Scholar]
- Dohm JC, Lottaz C, Borodina T, Himmelbauer H. Substantial biases in ultra-short read data sets from high-throughput DNA sequencing. Nucleic Acids Res. 2008;36:e105. doi: 10.1093/nar/gkn425. [DOI] [PMC free article] [PubMed] [Google Scholar]
- Langmead B, Trapnell C, Pop M, Salzberg SL. Ultrafast and memory-efficient alignment of short DNA sequences to the human genome. Genome Biol. 2009;10:R25. doi: 10.1186/gb-2009-10-3-r25. [DOI] [PMC free article] [PubMed] [Google Scholar]
- Liu F, Jenssen TK, Trimarchi J, Punzo C, Cepko CL, Ohno-Machado L, Hovig E, Kuo WP. Comparison of hybridization-based and sequencing-based gene expression technologies on biological replicates. BMC Genomics. 2007;8:153. doi: 10.1186/1471-2164-8-153. [DOI] [PMC free article] [PubMed] [Google Scholar]
- Marioni JC, Mason CE, Mane SM, Stephens M, Gilad Y. RNA-seq: An assessment of technical reproducibility and comparison with gene expression arrays. Genome Res. 2008;18:1509–1517. doi: 10.1101/gr.079558.108. [DOI] [PMC free article] [PubMed] [Google Scholar]
- McGill R, Tukey JW, Larsen WA. Variations of box plots. Am Stat. 1978;32:12–16. [Google Scholar]
- ′t Hoen PA, Ariyurek Y, Thygesen HH, Vreugdenhil E, Vossen RH, de Menezes RX, Boer JM, van Ommen GJ, den Dunnen JT. Deep sequencing-based expression analysis shows major advances in robustness, resolution and inter-lab portability over five microarray platforms. Nucleic Acids Res. 2008;36:e141. doi: 10.1093/nar/gkn705. [DOI] [PMC free article] [PubMed] [Google Scholar]
- Wurmbach E, Yuen T, Sealfon SC. Focused microarray analysis. Methods. 2003;31:306–316. doi: 10.1016/s1046-2023(03)00161-0. [DOI] [PubMed] [Google Scholar]


