Abstract
High gamma (HG) power changes during motor activity, especially at frequencies above 70 Hz, play an important role in functional cortical mapping and as control signals for BCI (brain computer interface) applications. Most studies of HG activity have used ECoG (electrocorticography) which provides high-quality spatially localized signals, but is an invasive method. Recent studies have shown that non-invasive modalities such as EEG and MEG can also detect task related HG power changes. We show here that a 27 channel EEG (electroencephalography) montage provides high-quality spatially localized signals non-invasively for HG frequencies ranging from 83 to 101 Hz. We used a generic head model, a weighted minimum norm least squares (MNLS) inverse method, and a self-paced finger movement paradigm. The use of an inverse method enables us to map the EEG onto a generic cortex model. We find the HG activity during the task to be well localized in the contralateral motor area. We find HG power increases prior to finger movement, with average latencies of 462 ms and 82 ms before EMG (electromyogram) onset. We also find significant phase-locking between contra- and ipsilateral motor areas over a similar HG frequency range; here the synchronization onset precedes the EMG by 400 ms. We also compare our results to ECoG data from a similar paradigm and find EEG mapping and ECoG in good agreement. Our findings demonstrate that mapped EEG provides information on two important parameters for functional mapping and BCI which are usually only found in HG of ECoG signals: spatially localized power increases and bihemispheric phase-locking.
Keywords: high gamma, motor cortex, synchronization, EEG, BCI
Introduction
High gamma (HG) oscillations of electrocorticogram (ECoG) signals play a crucial role both for functional brain mapping (Edwards et al., 2005; Crone et al., 2006; Miller et al., 2007; Schalk et al., 2008) and for BCI research (Pfurtscheller et al., 2003; Leuthardt et al., 2004; Schwartz et al., 2006). These HG signals are spatially localized over specific areas of the cortex directly related to the individuals environment and behavior. Consequently, these HG signals provide unique spatio-temporal-spectral signatures of task-related brain activity. Recent reports indicate that an individuals HG signals are stable over time and after they have been mapped, these HG signals do not require continuing adaption of the BCI (Shenoy et al., 2008; Blakely et al., 2009). The two characteristic HG signatures that have been extracted using ECoG and then used for language and motor mapping and to operate BCIs are the signal power and the phase synchronization between distant cortical sites (Brunner et al., 2005; Darvas et al., 2009). The major advantages of the HG signals compared to the traditional alpha and beta signals are (1) an increased information transfer rate and (2) a higher spatial specificity (Miller et al., 2007). To use phase synchrony as control signals requires reliable real-time estimation of the phase synchrony. This requires averaging over several cycles of the phase at the signal frequency. These averages can be carried out in a shorter time at higher frequencies thereby lowering the real-time response (Lauchaux et al., 2000). The major obstacle preventing the routine use of HG oscillations is the invasive nature of ECoG. Recent reports suggest that HG power changes can also be observed using EEG (Ball et al., 2008) and using MEG (Magnetoencephalography) (Dalal et al., 2008; Cheyne et al., 2008). Of course, MEG, due its immobility and infrastructure requirements, is not a practical modality for everyday applications. This leaves EEG as the only known practical non-invasive method. In this study, we show that EEG can be used to provide the two above mentioned task induced HG signatures: (1) spatially localized HG power changes and (2) interhemispheric phase synchronization signals, both for a self-paced index finger motion task. While previous studies have shown, that EEG is in principle capable of detecting HG activity in the channel domain, we extend the use of EEG here to functional mapping of the HG activity to the cortex, which allows a direct comparison with ECoG. The classical low-frequency alpha and beta control signals for finger motion tasks have been extensively studied using both invasive and non-invasive methods for a long time (Pfurtscheller and Neuper, 1992; Gerloff et al., 1998; Ohara et al., 2000). They have also been the focus of recent non-invasive studies using MEG (Dalal et al., 2008; Cheyne et al., 2008). In this paper we demonstrate that scalp EEG detects early premotor and motor HG activity in the primary motor area prior to finger movement using a simple setup that is well suited for real-time functional mapping and BCI applications. By comparing our results with data recorded using ECOG during a similar finger motion paradigm, we show that EEG inverse mappings show the same spatio-temporal-spectral patterns as ECoG. We also show that there is early interhemispheric synchronization in the HG band between the motor areas prior to movement. This highlights another distinct advantage of EEG over ECoG, namely its ability to localize activity, albeit with limited spatial resolution, anywhere on the cortical surface.
Materials and methods
Subjects
Data were recorded from ten healthy adult subjects (8 male, mean age=34.1, range 19–64). Nine subjects were right handed, one subject was left handed. Subjects gave their informed consent according to the protocol approved by the internal review board (IRB) of the University of Washington.
Task
The subjects were instructed to perform voluntary abductions of the right index finger (left index finger for the left handed subject). Subjects were seated comfortably during the experiment and were instructed to tap their fingers briskly three times at their own discretion and, in order to get a sufficiently long rest period between movement activity, to wait 4–7 seconds before initiating a new tap sequence. The subjects had their eyes open and fixated, using a fixation cross. We recorded 4 blocks for each subject with 30 index finger tap sequences per block and with short breaks between blocks.
Recording
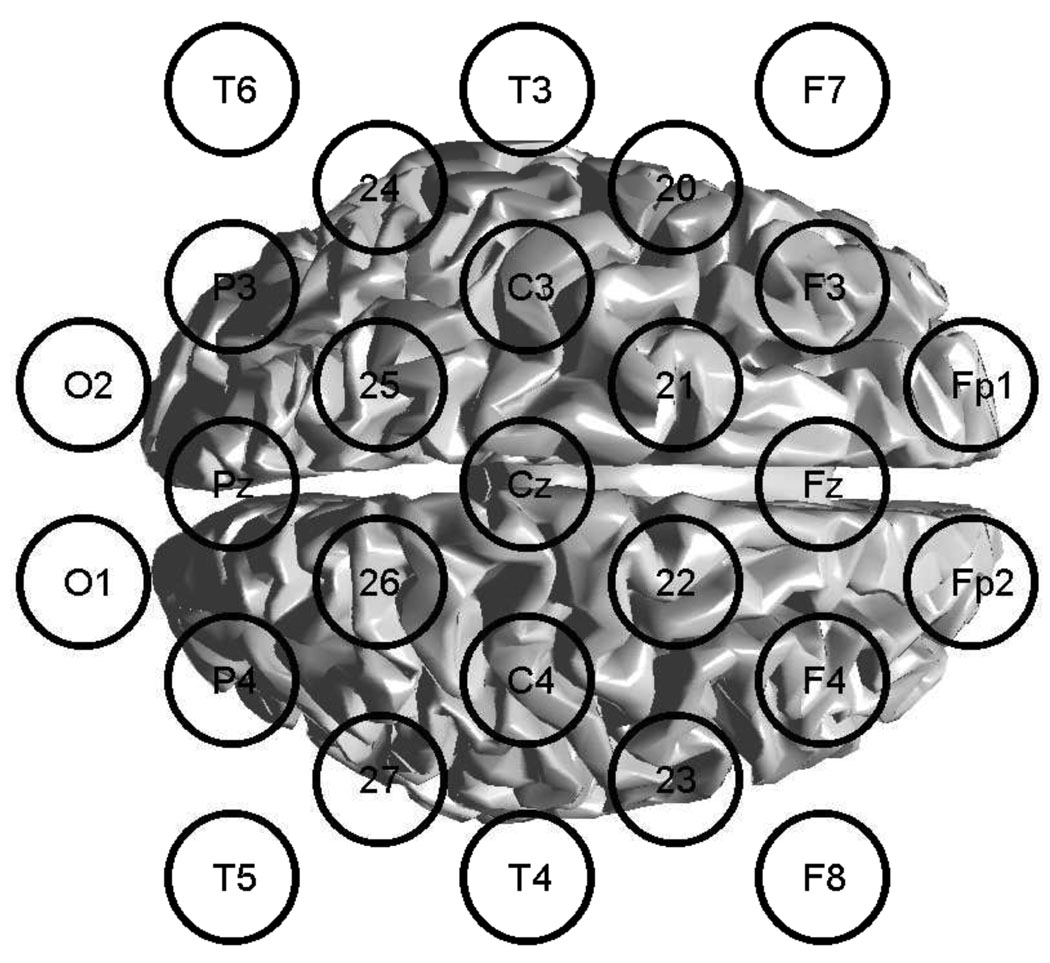
Data was recorded from 27 electrodes, using an extended 10–20 system, where 8 additional electrode positions over the motor areas where used. A schematic of the montage is shown in figure 1
Figure 1.
Schematic view of the expanded 10–20 system and the generic cortex surface used for EEG data acquisition.
Data was sampled from DC to 4800 Hz with an anti aliasing filter at 2400 Hz, using two GugerTec (GugerTec, Graz, Austria) EEG amplifiers. In parallel, we recorded at the same sampling rate the EMG (Electromyogram) from the extensor indicis in a bipolar setup. Also, subjects had their index fingers placed on a photo diode, for which a digital signal was recorded parallel to the EEG. The photo diode threshold was set such that a TTL pulse was generated, whenever the subject removed the index finger from the diode.
We used a 3D localizer (Patriot, Polhemus, Colchester, VT) to determine the electrode positions for each subject as well as the positions of three anatomical landmarks, Nasion and the left and right pre-auricular points.
Data preprocessing and head modeling
Headmodeling
We used the anatomical landmarks and 10–20 electrode positions for each subject to compute a realistically shaped head model, by warping a generic head model, the Montreal brain phantom (Collins et al., 1998), to match individual positions (Darvas et al., 2006). We used the warped anatomical model to construct a boundary element model (BEM) for each subject.
The BEM computation was carried out with the BrainStorm software package (www.neuroimage.usc.edu/Brainstorm). The BEM consisted of three layers, skin, outer and inner skull. The bioelectric forward problem was solved with this BEM, using the generic cortex, which was tessellated into 10001 nodes, as source space. The resulting 27 × 10001 forward field matrix, which maps the electrical potentials of all unit dipolar sources on the cortex to all 27 electrodes, was used in subsequent inverse computations for each subject, which map the electrical potential changes, as measured on the scalp, to the cortex (Darvas et al., 2004). While this surface landmark based warp will not produce an exact representation of each individuals head geometry, it will nevertheless be sufficient to identify, whether activity is mapped to the right functional anatomical locations, e.g. the primary motor areas. An advantage of the generic head model is that activity for all subjects will be mapped into the same source space and hence it will allow us to perform a group analysis on cortical activity maps.
Data preprocessing
The data was segmented into trials, based on the recorded EMG. We band-pass filtered the continuous EMG signal between 70 and 80 Hz and applied a Hilbert transform to the narrow band filtered signal, to compute the time varying analytical amplitude of the EMG. We used a 99 percentile threshold of the analytic amplitude, taken over the whole recording, to detect movement onset. Visual comparison of the output of this automatic algorithm with the output of the photo diode was used to remove trials, where there was no clear coincidence between the two measures of movement onset. We also rejected trials, where subsequent finger movements were closer than 2 s in time or where the total movement lasted less than 200 ms. For each trial, data was selected between 2s prior to movement onset to 1s after movement onset. We visually inspected each trial of the EEG data for eye and movement artifacts. Trials were rejected, if artifacts were present in any one channel between 1s prior to movement and 0 s. Overall, the segmentation procedure resulted in between 69 and 108 trials per subject. We down sampled the EEG data to 480 Hz to facilitate the subsequent signal analysis. All EEG data were also re-referenced to a common average reference (CAR) to reduce common mode noise.
Signal analysis
Inverse solution
We used a weighted linear minimum norm least squares (MNLS) method to map data from the EEG sensor space to the generic cortical surface. In this approach, the forward field matrix was weighted by the regularized noise covariance matrix of the EEG data in order to reduce the impact of noisy channels on the cortical mapping (Dale and Sereno, 1993). The noise covariance was computed from all trials over a time segment from −1 s to −0.6 s. Source orientations in our approach were constrained to be perpendicular to the cortical surface.
Detection of high gamma power changes
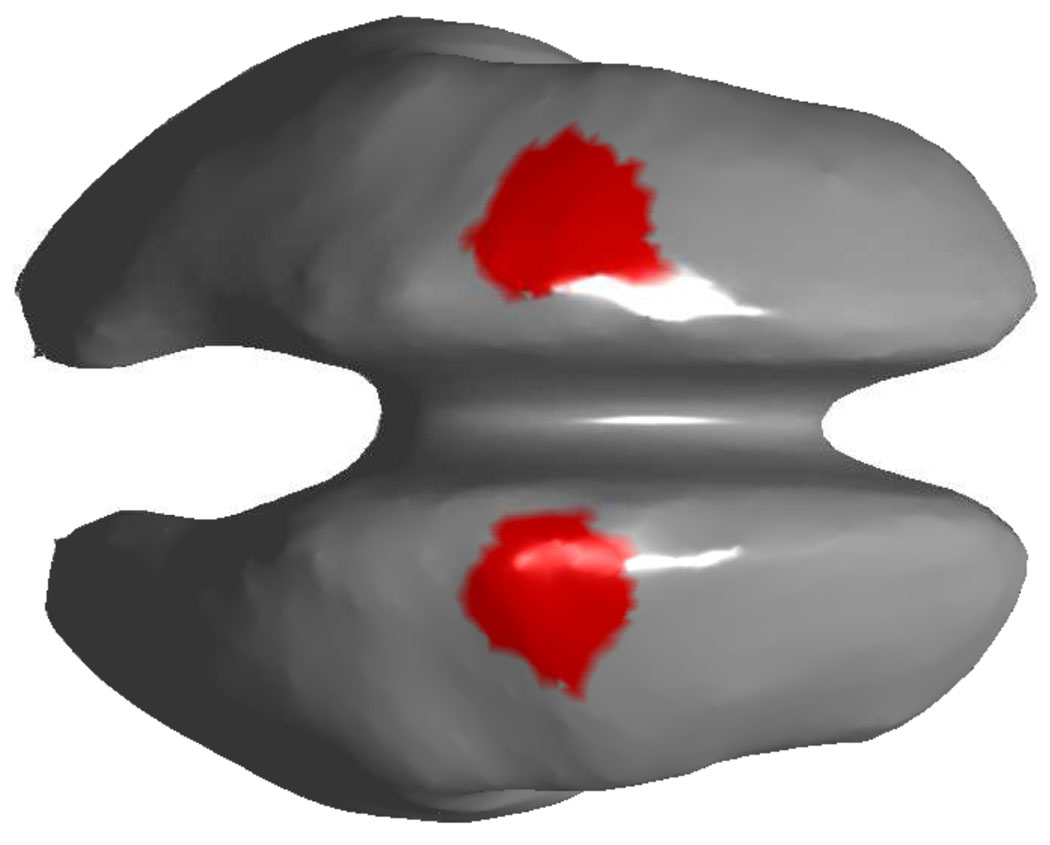
We used a hypothesis driven approach to identify HG power change in the motor areas during the self paced finger movement, based on earlier reports of HG changes in a 70–110 Hz range in the contralateral motor area for finger movements (Ball et al., 2008; Cheyne et al., 2008). Our hypothesis is that changes in that frequency band should become apparent some time between 0.5 s prior to movement onset, when the later component of the motor related bereitschaftspotential sets in (Shibasaki and Hallett, 2006). For each subject, we computed for each single trial an inverse solution for both motor areas, which we defined broadly on the generic cortex (see figure 2). For each voxel in these regions of interest, we computed a time-frequency map (TF). TF maps were computed by the following procedure: First we bandpass filter the data in a narrow band (2 Hz wide) around a center frequency. Then we apply a Hilbert transform to the filtered data. Since both the filter and the Hilbert transform are linear operations, we can apply these before the linear MNLS mapping. Then we compute the MNLS mapping of the analytic signals for our regions of interest (ROI). The time varying band power for each voxel in the ROI is then determined by taking the absolute value of the analytic signal. Finally, we average across all trials and voxels in the ROI to determine the overall TF map of the region. These steps were repeated for center frequencies ranging from 3 to 130 Hz in 1 Hz steps. We use the regional average to determine the TF, because the number of voxels in each ROI is ≈ 100 and it would not be practical to analyze hundreds of maps per subject. We applied a Z-score transform (Tallon-Baudry et al., 2005) to these maps, i.e., for each band, we subtracted the mean band power in the baseline interval from −1 s to −0.6 s and divided the resulting signal by the standard deviation (over time) of the baseline. We used the resulting Z-score maps to determine the dominant HG frequency for each subject. We then used this band to map activity to the whole cortex for each subject. For each subject, we converted the band power maps to Z-scores, which allows us to compute a spatial group average over all subjects. From the band specific maps, we select those voxels, which show maximal increase over the baseline period prior to EMG onset.
Figure 2.
Left and right motor area region of interest on the generic cortex. The cortex surface has been smoothed for better visibility. We use these areas to compute TF maps for HG activation and to compute interhemispheric phase-locking in the HG band.
Detection of bihemispheric phase synchronization
Interhemispheric synchronization during self paced finger movements has been observed in the lower rhythms (alpha and beta band, Gerloff et al. (1998); Serrien (2008)). However, this synchronization may not be limited to these low frequency rhythms and therefore we tested for HG synchronization between the motor areas, using our generic model and the regions of interest, as shown in figure 2. We used the phase-locking value (PLV) (Lachaux et al., 1999) to test for interhemispheric interactions, specifically in the HG band. We computed interactions between each voxel in the left hemispheric ROI (111 locations) and each voxel in the right hemispheric ROI (115 locations), resulting in 12765 interaction maps. In order to eliminate the influence of evoked potentials on the PLV computation, we subtracted the trial average from each single trial. PLV maps were computed for center frequencies ranging from 5 Hz to 130 Hz in 1 Hz steps and from times 1 s prior to movement onset to 0.5 s post movement onset, i.e, over 1247 samples. Like TF maps, a PLV map covers time and frequency and it would be impractical to analyze each single map for each time and frequency. In order to determine whether significant interaction between any of the 12765 voxel pairs exists prior to movement onset, we averaged the PLV across all interaction pairs and applied a Z-score transform to the resulting mean PLV map to determine the relevant interaction frequencies.
Results
Local power changes
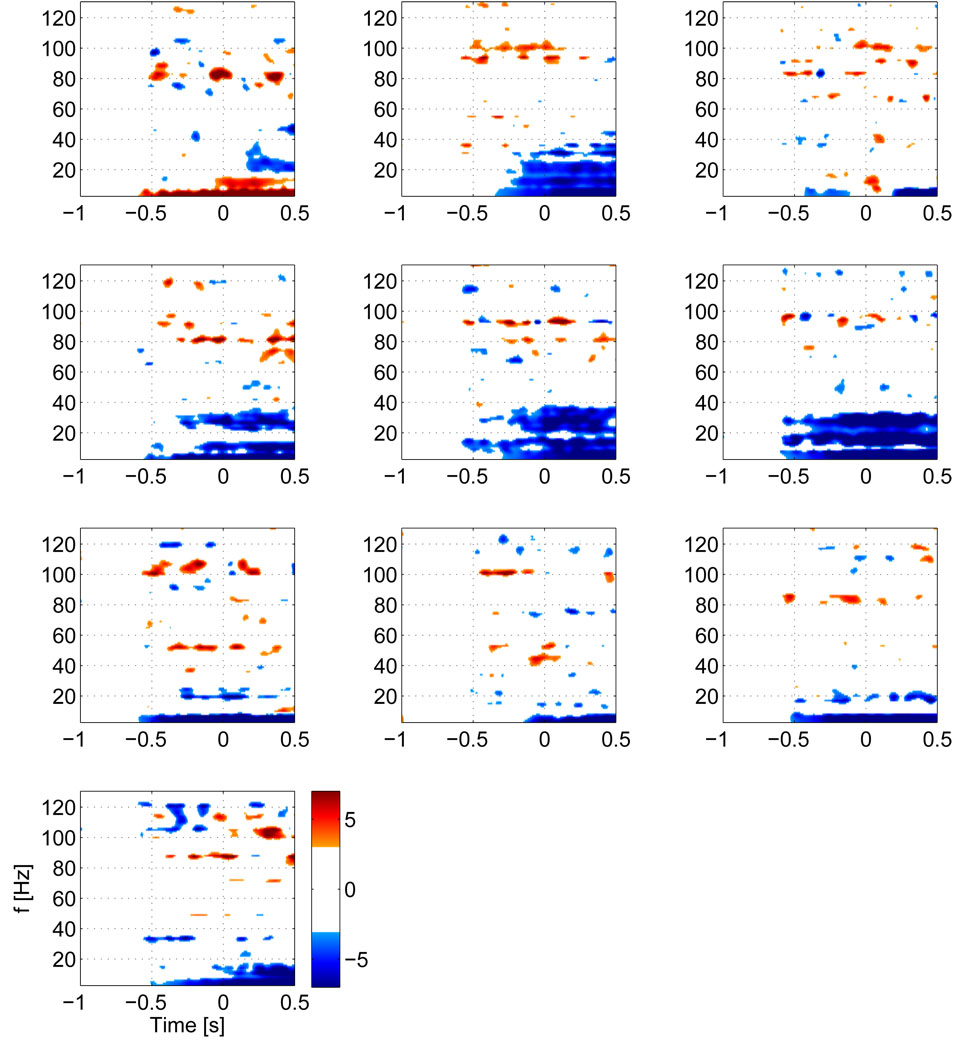
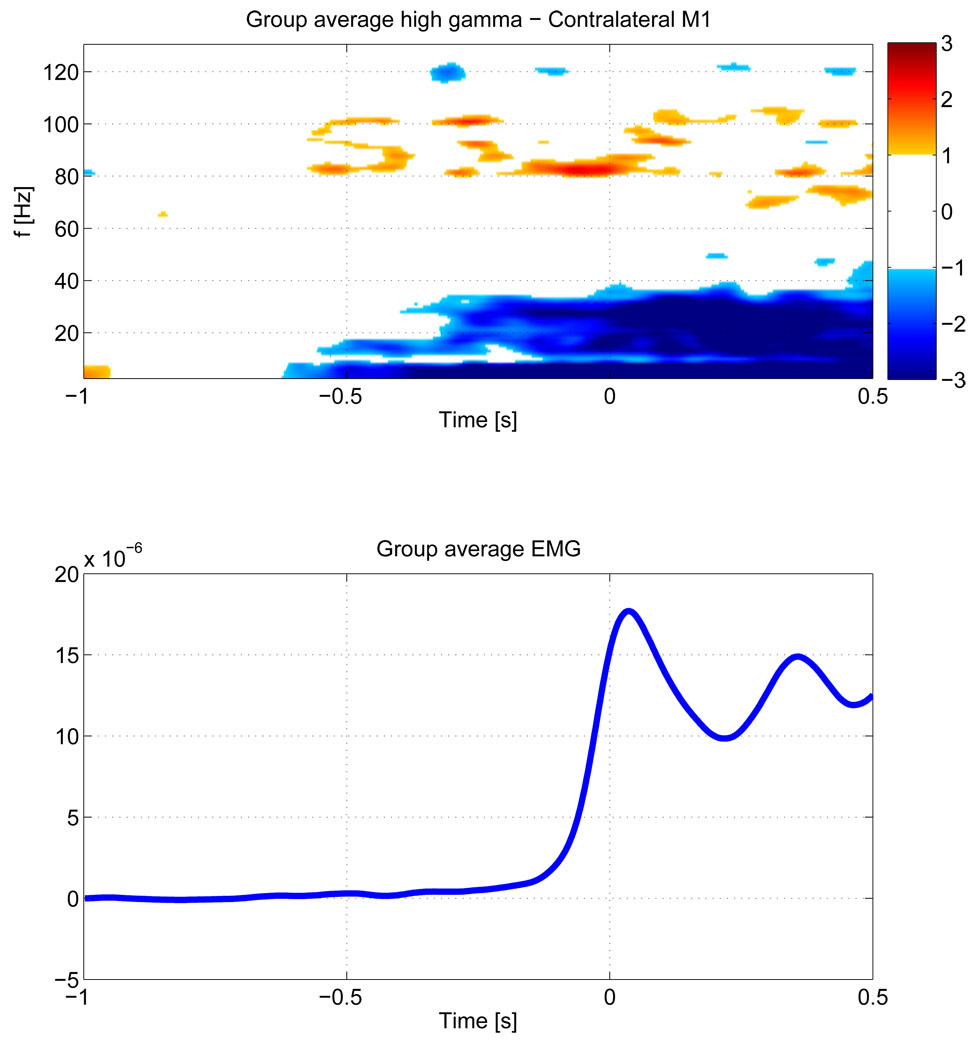
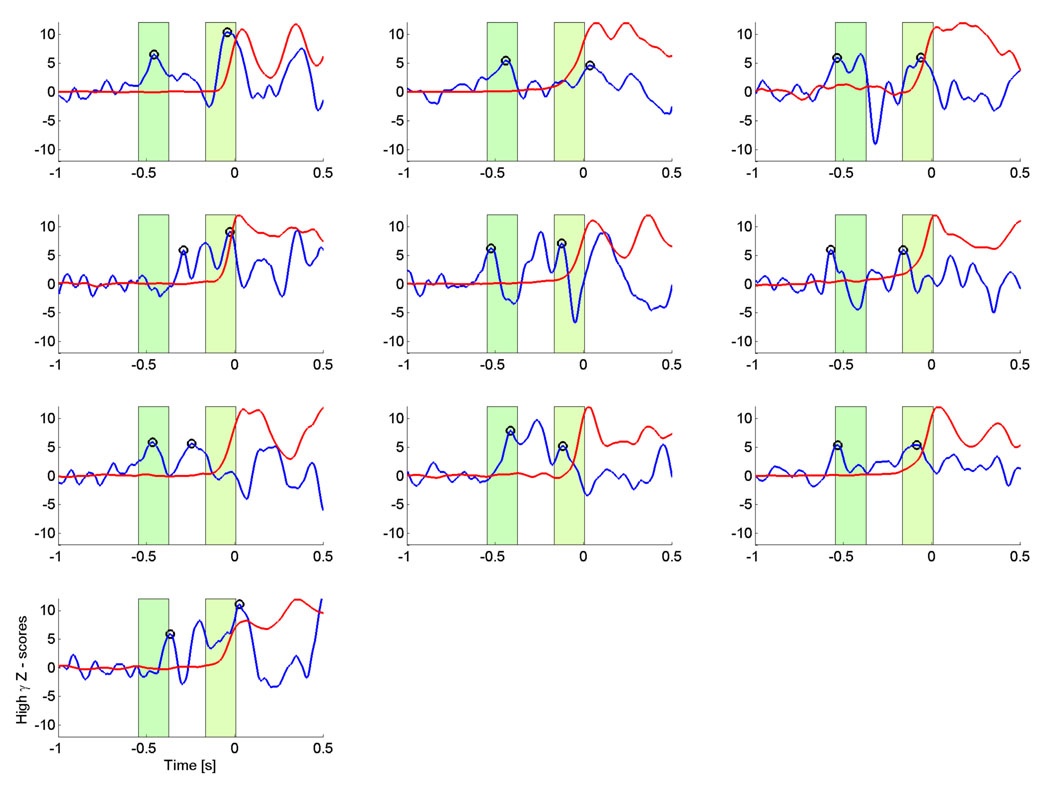
We first computed the TF maps for each single subject for the strongest voxel in the contralateral motor area , which are shown in figure 3. All subjects show significant HG activity prior to movement in relatively narrow bands, centered between 81 and 101 Hz. All subjects, except for subjects 3 and 7, show a prominent drop in beta activity. Individual peak frequencies in the HG range and latencies for these peak frequencies are shown in table 1. While the mean frequency of over all subjects lies at 90.6 Hz, there appears to be a clustering around two frequency bands at around 80 and 100 Hz. This can also be seen in the group average of individual TF maps over all subjects (figure 4), where the stronger activity is focused shortly before EMG onset around 80 Hz, but earlier activity takes also place at around 100 Hz. In order to identify common HG onset latencies, we plot the time courses of the peak HG frequencies for the contralateral motor area for each subject (figure 5). We identified local maxima closest to the baseline (i.e, at −600 ms) and to the nominal EMG onset (at time 0) for each subject. On average (across subjects) we find that the first peak of HG activity prior to movement occurs at −461 ms, followed by a second peak shortly before EMG onset (average −82 ms). However, some subjects also show activity between these latencies.
Figure 3.
Z-score TF maps for each subject for activity in the contralateral motor area. Note that subject 1, whose map is shown in the top left corner was left handed and performed a left index finger movement, hence activity in the right motor area is shown. All other subjects were right handed and hence all other maps show activity for the left motor area. The maps have a threshold at ‖Z‖ ≥ 3, which corresponds to an uncorrected p-value ≤ 0.01. The individual maps show, that all subjects have significant pre-movement HG increases in a narrow band.
Table 1.
High gamma frequencies
| subject | hand. | age | gender | finger | peak freq. [Hz] (band power) |
peak freq. [Hz] (PLV) |
lat. 1 [ms] | lat. 2 [ms] |
|---|---|---|---|---|---|---|---|---|
| 1 | left | 37 | m | left | 83 | 84 | −458 | −44 |
| 2 | right | 25 | m | right | 94 | 89 | −441 | 35 |
| 3 | right | 36 | m | right | 83 | 88 | −538 | −65 |
| 4 | right | 22 | m | right | 81 | 85 | −292 | −29 |
| 5 | right | 19 | m | right | 93 | 94 | −525 | −125 |
| 6 | right | 64 | f | right | 97 | 94 | −573 | −165 |
| 7 | right | 21 | m | right | 101 | 88 | −467 | −246 |
| 8 | right | 58 | m | right | 101 | 94 | −415 | −119 |
| 9 | right | 37 | m | right | 85 | 89 | −533 | −88 |
| 10 | right | 22 | f | right | 88 | 81 | −366 | 25 |
| mean | 34.1 | 90.6 | 88.6 | −461 | −82 | |||
| std | 15.8 | 7.6 | 4.5 | 86.8 | 86.0 | |||
Figure 4.
Group average of the Z-score TF maps across all subjects (top) and the mean EMG activity at 72–105 Hz (bottom). The threshold for the Z-score map is set at ‖Z‖ ≥ 1. Since we average over nine subjects this threshold corresponds to 3 std which is equivalent to an uncorrected p ≤ 2.3 * 10−5. The group average also shows significant pre-movement HG increase across all subjects.
Figure 5.
Time course of the HG activity (blue) for the strongest voxels and peak frequencies in the contralateral motor area. Activity has been converted to Z-scores, based on the −1 s to −0.6 s interval. The red curves show the scaled mean EMG power at the same frequencies. Most subjects show HG activity curves with an early and a late increase. Black circles indicate the earliest and the latest peak of HG activity prior to EMG onset. The green shaded areas indicate the time interval corresponding to the mean +/− 1 std of the peak time across all subjects. This implies that for all subjects, the peak HG activity takes place at two distinct latencies prior to EMG onset.
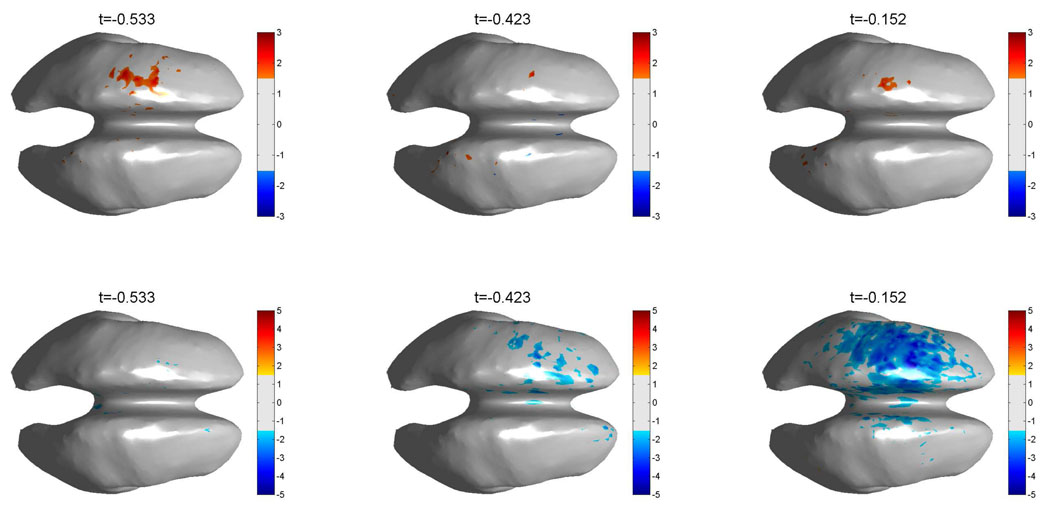
We found that our EEG recordings in some subjects suffer strongly from EMG contamination after movement onset, which has strong high frequency components. In order to ensure that the TF maps and time courses are not caused by EMG artifacts, we mapped the peak HG activity to the generic cortex for each subject and formed a group average of the individual cortical maps, after applying a Z-score transform to each individual map. It can be expected, that EMG artifacts will produce a broad activation, which would not be located in specific functionally related cortical areas. The group averages of the spatial mapping of the HG changes and the associated beta band (15–35 Hz) power changes are shown in figure 6. Note that the group average was computed for the nine right handed subjects, since subject one used the left hand and consequently, HG activity for this subject mapped to the right hemisphere.
Figure 6.
Group average maps for all right handed subjects (n = 9). The top row shows the average HG activity across all subjects for three pre EMG onset latencies. The bottom row shows the corresponding beta band (15–35 Hz) activity. The band power maps for each subject have been converted to Z-scores, based on the −1 s to −0.6 s interval, prior to averaging. A threshold of ‖Z‖ ≥ 1.5 is used for both, HG and beta band activity. Note that, since we average over nine subjects, only values exceeding 4.5 std are shown, corresponding to an uncorrected p ≤ 2 * 10−10 for each voxel. These maps show, that HG and Beta band changes in the motor areas are the dominant activity.
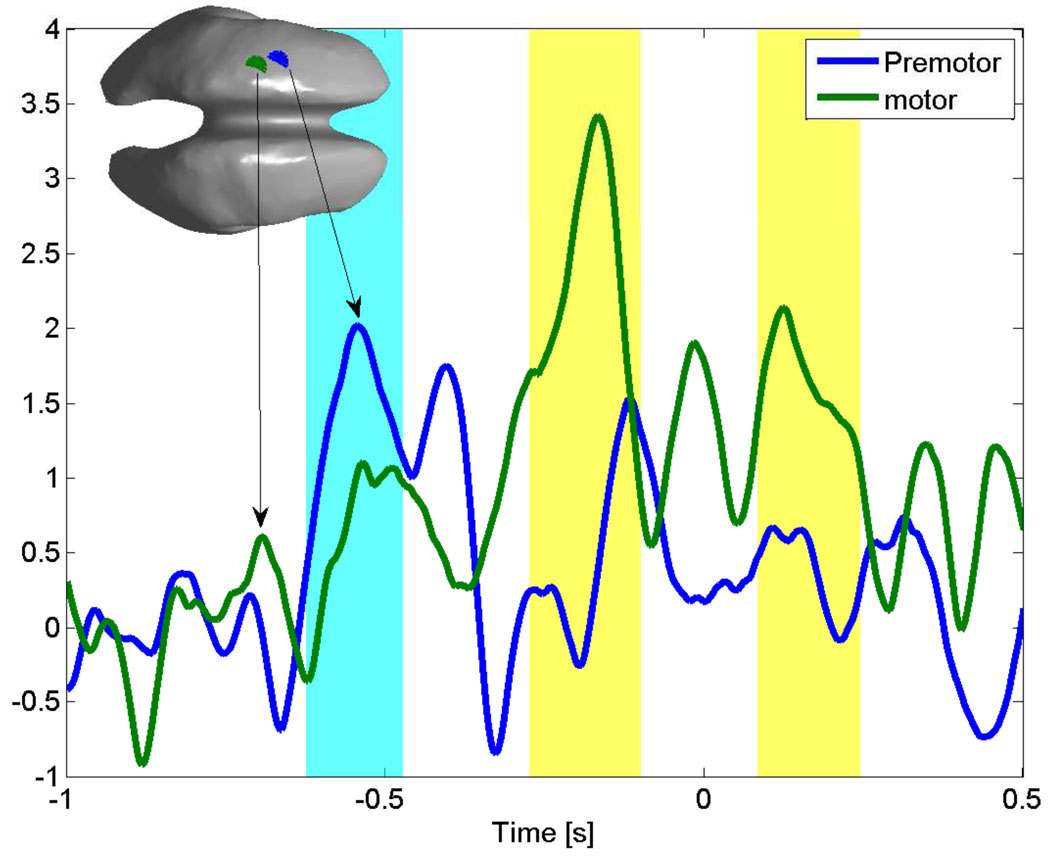
The group average was carried out over the same generic representation of the cortex, that was used to compute the band power maps for individual subjects and therefore we cannot expect precise anatomical localization from these maps. Nevertheless, the maps qualitatively show the correct anatomical sites being active before movement onset, i.e, first at the earlier latencies, more frontal, premotor areas are active and then activity shifts towards the primary motor area shortly before movement onset. The group average Z-score time series for the most active voxels during premotor and motor activity are shown in figure 7. We used a bootstrap (Efron and Gong, 1983) method to compute the 95% confidence interval across subjects. Time intervals, where the group average for the respective cortical location exceeds the mean base line activation, are shaded. The consistent increase in HG power across subjects for the group average shows clearly the separation between the more frontal and posterior motor areas into early and late activation.
Figure 7.
Time series for the premotor (blue line) and motor area (green line) of the group average HG activity. The shaded areas (cyan for the premotor activity and yellow for motor activity) indicate the times, where the lower bound of the 95% confidence interval for each time series exceeds the mean baseline activity. The inset shows the position of the premotor (blue) and motor (green) voxels on the generic cortex. The premotor area activity peak (blue) precedes the motor area (green) peak.
The well documented drop in beta band power (Stancak and Pfurtscheller, 1996) during self paced movements also maps to the left hemisphere, but sets in later than the earlier HG power increase. In accordance with previous ECoG studies (Crone et al., 1998; Miller et al., 2007) the group average for the HG power shows a focal activation, while the beta power drop covers a broad region. Since these activities are well localized in the correct functional areas, this also indicates, that prior to movement onset the recorded HG activity is of genuine cortical origin.
Comparison with ECoG data
To put our results into context, we compare them to ECoG data, recorded from 7 patients, who had electrode grids implanted for preoperative screening that covered their motor areas. All subjects carried out repetitive cued index finger movements, using the hand contralateral to the grid. The details of this study are described in (Miller et al., 2007). Finger positions were recorded with a data glove and data was segmented based on the rising flank of the data glove output for the index finger. Since ECoG records directly from the cortical surface and ECoG electrodes pick up only local activity, ECoGs, unlike EEG, where cross talk affects data on the electrode level and propagates into the inverse solution as well , allows us to monitor specific anatomical locations. Also, ECoG is little affected by muscle artifacts and thus provides reliable data during the period when the finger is actually moving. We processed the ECoG data in the same way as the EEG data, i.e, time frequency maps were converted into Z-score maps, based on the −1 s to −0.6 s interval, prior to forming group averages. Instead of ROIs we selected single electrodes over the premotor and motor areas in each subject. The ECoG TF map for the premotor electrodes shows a similar timing of HG activity as our EEG data, with activity beginning at 380 ms prior to movement onset. The premotor electrodes also show later peaks of activity at −208 ms and −60 ms, similar to the EEG findings. It also shows, similar to the EEG, that high-gamma activity takes place in two bands with centers at 74 and 99 Hz. The motor area electrodes however show their earliest activity after movement onset, and also peak in discrete bands at 77 Hz, 85 Hz and 95 Hz. Note, that since these maps are group averages, individually more pronounced HG activity bands appear smeared out in the average.
The group average TF maps for the ECoG data are shown in figure 8, along with the average data glove output for the index finger. Similar to the EEG results, the premotor region shows a late HG component in addition to the early activation.
Figure 8.
Group averagemaps for the motor and premotor areas as recorded by ECoG for cued index finger movements (n = 7). The left figure shows the Z-score map for the premotor electrodes. The middle figure shows motor activity. The band power maps for each subject have been converted to Z-scores, based on the −1 s to −0.6 s interval, prior to averaging. A threshold of ‖Z‖ ≥ 3 is used for both areas, corresponding to 8 std of the baseline. The right figure shows the mean data glove output across all subjects. Our ECoG shows premotor/motor HG activity patterns that are similar to our EEG.
Interhemispheric Phase locking
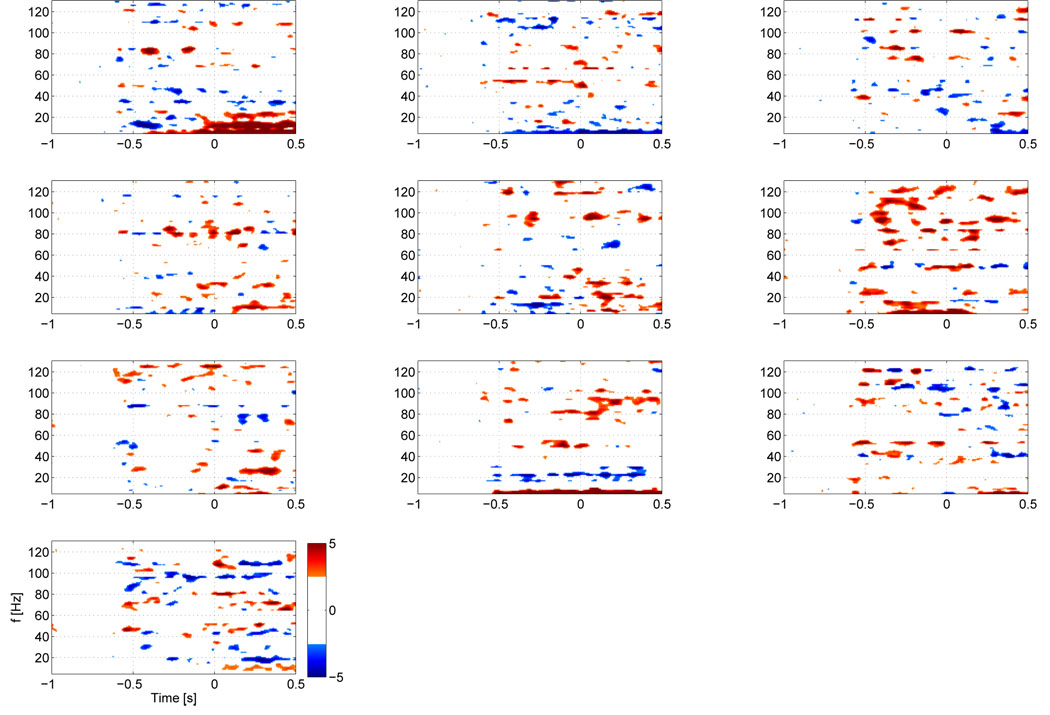
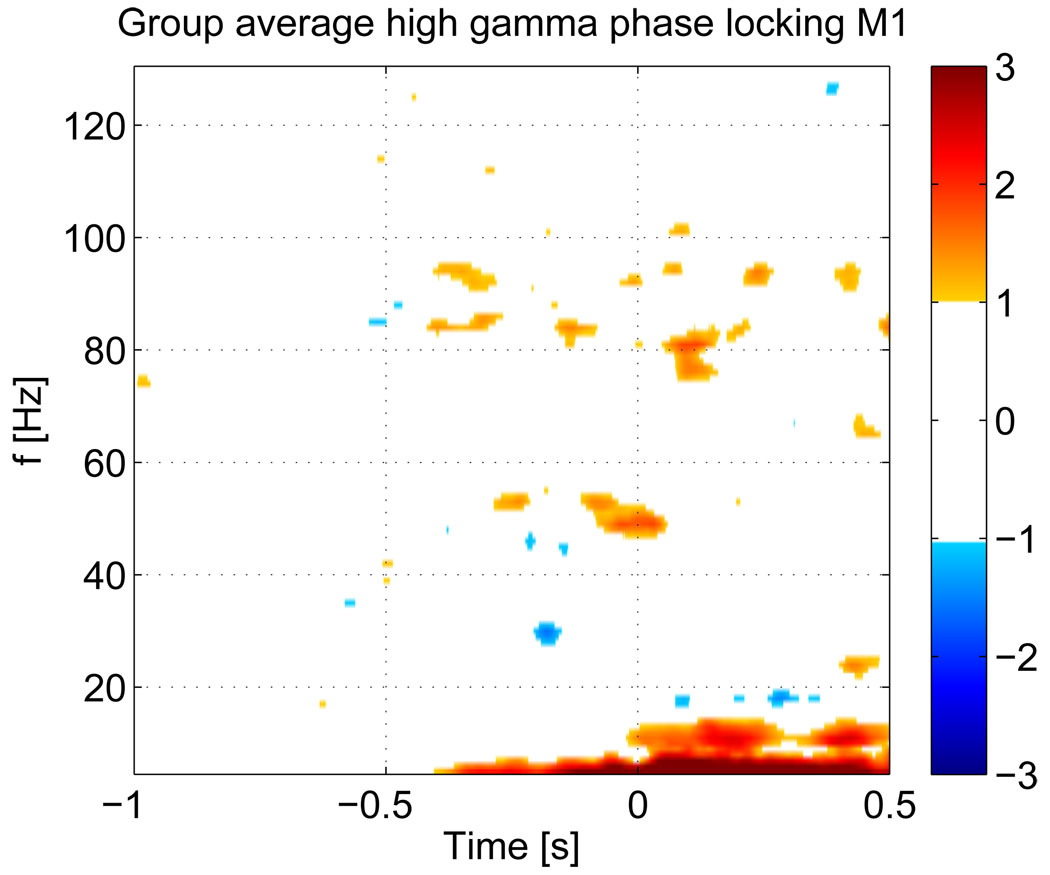
The phase-locking maps for individual subjects between voxels in the generic motor areas, after normalization with respect to the baseline, are shown in figure 9. The maps there reflect the normalized mean phase-locking over all left-right hemispheric voxel pairs. While most subjects exhibit significant HG phase-locking, there is also phase-locking in other bands and individual results are less clear. The group average of individual Z-score maps is shown in figure 10. Both, the individual maps and the group average of the PLV show, that there is significant phase-locking between the left and right motor areas prior to movement onset. Since the PLV is a symmetric measure, we included subject 1, who was left handed, in the group statistic. Just as for the HG band power changes, there is some variation in the frequencies at which maximum synchronization takes place and the synchronization frequencies are not exactly the same as the maximum band power changes (see table 1), but they fall well within the range of the power changes. The group average also shows significant synchronization in the mu-band (9–13 HZ) after EMG onset. The map also shows strong changes at very low frequencies (≤ 7 Hz), however at these low frequencies, the 400 ms long baseline segment contains less than 3 cycles of the respective frequencies and therefore estimates of relative changes with respect to the baseline become increasingly unreliable for lower frequencies.
Figure 9.
Phase locking maps for interhemispheric synchronization between the left and right motor areas. Phase locking was computed between all voxels in the left and right motor areas and then averaged over all pairs. The PLV values have been converted to Z-scores based on the −1 s to −0.6 s interval. The threshold for the Z-score map is set at ‖Z‖ ≥ 3. Unlike the individual HG power changes, the PLV increases for individual subjects are not limited to the HG range and show a much greater variation across subejcts.
Figure 10.
Group average of the mean PLV for all subjects. The threshold for the Z-score map is set at ‖Z‖ ≥ 1. Note that ,since we average over ten subjects, only values exceeding 3.16 std are shown, corresponding to an uncorrected p ≤ 10−5 for each voxel. In contrast to individual results, the group average shows that phase-locking is limited to the HG range.
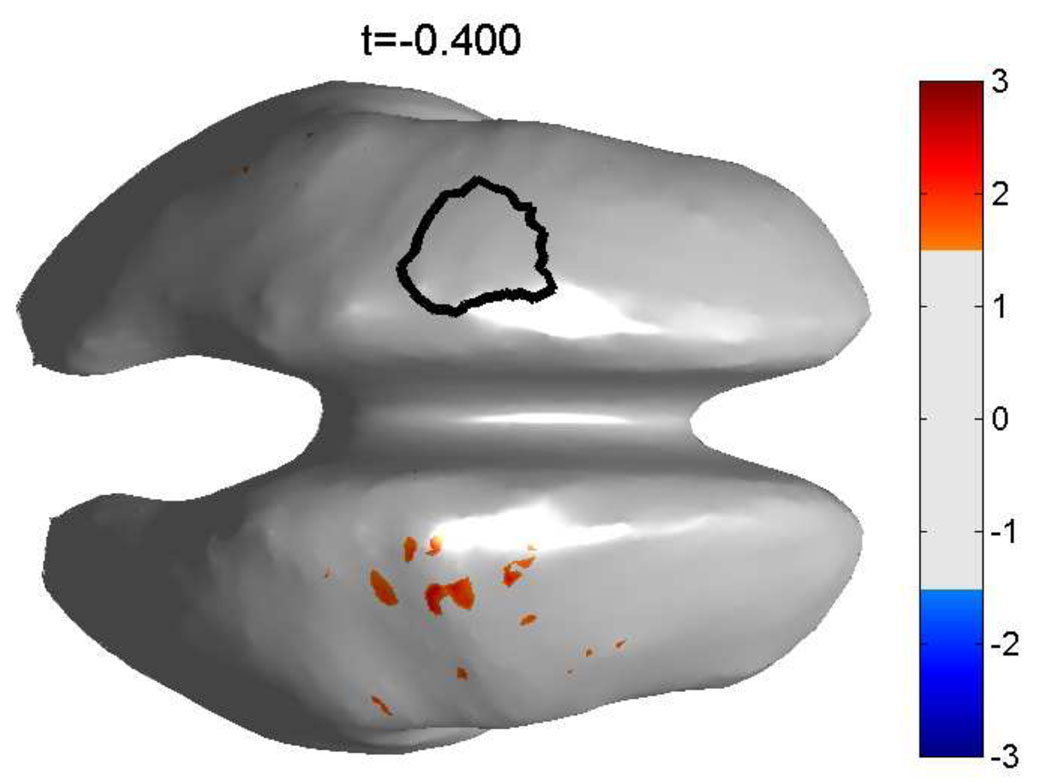
The average HG synchronization map, which maps the Z-transformed PLV between all voxel pairs across subjects is shown in figure 11. The left hemispheric ROI was used as seed region.
Figure 11.
Map of the group average over all subjects for the PLV between all voxels in the left hemispheric ROI and the right hemispheric ROI. The threshold is set at ‖Z‖ ≥ 1.5, corresponding to 4.5 std or an uncorrected p-value of p ≤ 2 * 10−10 for each voxel. The left hemispheric ROI, outlined in black, was used as the seed region. The map shows that synchronization from the seed area to the right motor area is the only significant synchronization at this latency (400 ms before movement onset).
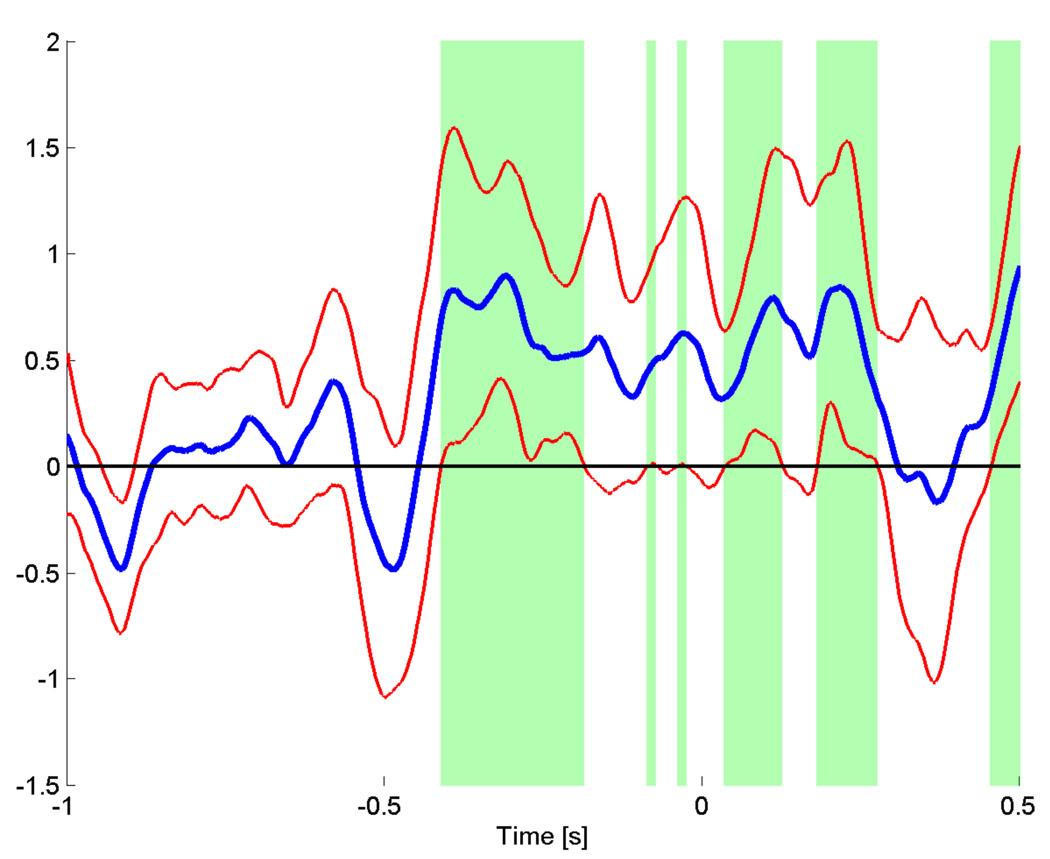
The average PLV time course across all subjects for the right hemispheric ROI is shown in figure 12, where we averaged the Z-scores for all frequencies between 81 and 95 Hz, covering the peak frequencies for each subject. We determined the 5% confidence intervals of the group average by bootstrapping the mean across subjects.
Figure 12.
Group average time course of the PLV between the left and right hemispheric motor areas, averaged from 81 to 95 Hz. Red lines indicate the lower and upper 5% confidence interval across subjects. The green areas indicate times where the lower 5% confidence interval of the PLV Z-score exceeds the mean Z-score of the baseline (−1 s to −0.6 s).The synchronization between left and right motor area peaks at −400 ms and stays high until 275 ms after the EMG onset.
Discussion
In agreement with previous studies (Ball et al., 2008; Cheyne et al., 2008) we have shown that movement related HG activity can be detected by non-invasive methods. We have also demonstrated, using a simple and inexpensive setup which is well suited for BCI and functional mapping applications, that EEG provides spatially localized HG power changes in the correct anatomical locations associated with movement. We also find highly consistent mapping of the HG activity to the contralateral motor area. We observe focal HG increases and the spatially delocalized beta band decrease across subjects that is in good agreement with previous reports that used ECoG (Crone et al., 1998; Pfurtscheller et al., 2003; Miller et al., 2007) as well as with our own ECoG recordings. For HG the range of reported frequencies is quite large (59–85 Hz, Ball et al. (2008), 65–90 Hz, Dalal et al. (2008), 70–85 Hz, Cheyne et al. (2008), 70–90 Hz, Pfurtscheller et al. (2003), 75–100 Hz, Crone et al. (1998)) and our findings, ranging from 81 to 101 Hz, also fall within that range. Mapping the EEG data onto the generic cortex allows us to separate the pre-movement HG activity in space, time, and frequency. It should be noted that such a separation cannot be achieved in the channel domain, since electrode topographies are not necessarily reflections of the underlying cortical activity. We find the earliest activity in the premotor area followed later by activation in the primary motor area. Earlier MEG studies, using functional localization, (Huang et al., 2004; Onishi et al., 2006) also showed that the movement induced power increases in the contralateral primary motor area peaked slightly before movement onset. A study by Waldert et al. (2008) also showed early activation of the HG prior to movement onset in the channel domain in contralateral prefrontal channels. We also find a post EMG onset activation of the motor area, similar to the results reported by (Cheyne et al., 2008). Both the temporal order and the spatial localization of our observed HG activity suggest that it is associated with movement planning and movement initiation (Pfurtscheller et al., 2003). Other ECoG studies have shown that there is post-movement onset HG that is strongly correlated with ongoing individual finger motion that could also provide a control signal (Miller et al., 2007). In contrast to our EEG data, the post-movement ECoG activity does not suffer from EMG artifacts. Strong EMG contamination after the subject started to move made our signal-to-noise ratios too low to reliably use the post-movement activity to provide useful control signals. We also found a significant movement induced increases in the HG interhemispheric phase locking. This supports the speculation by (Cheyne et al., 2008) that there might be an underlying network that links the motor areas at alpha and beta frequencies (Gerloff et al., 1998; Mima et al., 2000; Pollok et al., 2005), but also in the HG range. We also see increased interhemispheric phase synchronization in the alpha band (see figure 10) after movement onset. In contrast, the HG band synchronization we detect starts earlier, on average 400 ms prior to EMG onset, and remains high throughout movement onset. Compared to the average latency of the earliest contralateral activity, the bilateral synchronization starts later. This suggests that movement initiation begins in the contralateral premotor areas and then activates the ipsilateral motor areas via phase synchronization. Our group average EEG results compared with our group average ECoG results show that during the quiet artifact-free period prior to movement onset the two modalities agree. Consequently, spatially mapped EEG can be used as a non-invasive alternative to ECoG to study HG activity.
Acknowledgments
This work was supported by NIH grant EB007362, NSF grants 0642848 and 0622252, a Packard fellowship to RPR and the Microsoft External Research program.
Footnotes
Publisher's Disclaimer: This is a PDF file of an unedited manuscript that has been accepted for publication. As a service to our customers we are providing this early version of the manuscript. The manuscript will undergo copyediting, typesetting, and review of the resulting proof before it is published in its final citable form. Please note that during the production process errors may be discovered which could affect the content, and all legal disclaimers that apply to the journal pertain.
References
- Ball T, Demandt E, Mutschler I, Neitzel E, Mehring C, Vogt K, Aertsen A, Schulze-Bonhage A. Movement related activity in the high gamma range of the human eeg. NeuroImage. 2008;41(2):302–310. doi: 10.1016/j.neuroimage.2008.02.032. [DOI] [PubMed] [Google Scholar]
- Blakely T, Miller K, Zanos S, Rao RN, Ojemann JG. Robust, long-term control of an electrocorticographic brain-computer interface with fixed parameters. Neurosurgical Focus. 2009 doi: 10.3171/2009.4.FOCUS0977. in press. [DOI] [PubMed] [Google Scholar]
- Brunner C, Graimann B, Huggins JE, Levine SP, Pfurtscheller G. Phase relationships between different subdural electrode recordings in man. Neurosci Lett. 2005;375(2):69–74. doi: 10.1016/j.neulet.2004.11.052. [DOI] [PubMed] [Google Scholar]
- Cheyne D, Bells S, Ferrari P, Gaetz W, Bostan AC. Self-paced movements induce high-frequency gamma oscillations in primary motor cortex. NeuroImage. 2008;42(1):332–342. doi: 10.1016/j.neuroimage.2008.04.178. [DOI] [PubMed] [Google Scholar]
- Collins DL, Zijdenbos AP, Kollokian V, Sled JG, Kabani NJ, Holmes CJ, Evans AC. Design and construction of a realistic digital brain phantom. IEEE Trans Med Imaging. 1998;17(3):463–468. doi: 10.1109/42.712135. [DOI] [PubMed] [Google Scholar]
- Crone NE, Miglioretti DL, Gordon B, Lesser RP. Functional mapping of human sensorimotor cortex with electrocorticographic spectral analysis. ii. event-related synchronization in the gamma band. Brain. 1998;121:2301–2315. doi: 10.1093/brain/121.12.2301. [DOI] [PubMed] [Google Scholar]
- Crone NE, Sinai A, Korzeniewska A. High-frequency gamma oscillations and human brain mapping with electrocorticography. Prog Brain Res. 2006;159:275–295. doi: 10.1016/S0079-6123(06)59019-3. [DOI] [PubMed] [Google Scholar]
- Dalal SS, Guggisberg AG, Edwards E, Sekihara K, Findlay AM, Canolty RT, Berger MS, Knight RT, Barbaro NM, Kirsch HE, Nagarajan SS. Five-dimensional neuroimaging: localization of the time-frequency dynamics of cortical activity. NeuroImage. 2008;40(4):1686–1700. doi: 10.1016/j.neuroimage.2008.01.023. [DOI] [PMC free article] [PubMed] [Google Scholar]
- Dale AM, Sereno MI. Improved localizadon of cortical activity by combining eeg and meg with mri cortical surface reconstruction: A linear approach. Journal of Cognitive Neuroscience. 1993;5(2):162–176. doi: 10.1162/jocn.1993.5.2.162. [DOI] [PubMed] [Google Scholar]
- Darvas F, Ermer JJ, Mosher JC, Leahy RM. Generic head models for atlas-based eeg source analysis. Hum Brain Mapp. 2006;27(2):129–143. doi: 10.1002/hbm.20171. [DOI] [PMC free article] [PubMed] [Google Scholar]
- Darvas F, Miller KJ, Rao RP, Ojemann JG. Nonlinear phase-phase cross-frequency coupling mediates communication between distant sites in human neocortex. J Neurosci. 2009;29(2):426–435. doi: 10.1523/JNEUROSCI.3688-08.2009. [DOI] [PMC free article] [PubMed] [Google Scholar]
- Darvas F, Pantazis D, Kucukaltun-Yildirim E, Leahy RM. Mapping human brain function with meg and eeg: methods and validation. Neuroimage. 2004;23 Suppl 1:S289–S299. doi: 10.1016/j.neuroimage.2004.07.014. [DOI] [PubMed] [Google Scholar]
- Edwards E, Soltani M, Deouell LY, Berger MS, Knight RT. High gamma activity in response to deviant auditory stimuli recorded directly from human cortex. J Neurophysiol. 2005;94(6):4269–4280. doi: 10.1152/jn.00324.2005. [DOI] [PubMed] [Google Scholar]
- Efron B, Gong G. A leisurely look at the bootstrap, the jackknife, and cross-validation. American Statistician. 1983;37(1):36–48. [Google Scholar]
- Gerloff C, Richard J, Hadley J, Schulman AE, Honda M, Hallett M. Functional coupling and regional activation of human cortical motor areas during simple, internally paced and externally paced finger movements. Brain. 1998;121:1513–1531. doi: 10.1093/brain/121.8.1513. [DOI] [PubMed] [Google Scholar]
- Huang MX, Harrington DL, Paulson KM, Weisend MP, Lee RR. Temporal dynamics of ipsilateral and contralateral motor activity during voluntary finger movement. Hum Brain Mapp. 2004;23(1):26–39. doi: 10.1002/hbm.20038. [DOI] [PMC free article] [PubMed] [Google Scholar]
- Lachaux JP, Rodriguez E, Martinerie J, Varela FJ. Measuring phase synchrony in brain signals. Hum Brain Mapp. 1999;8(4):194–208. doi: 10.1002/(SICI)1097-0193(1999)8:4<194::AID-HBM4>3.0.CO;2-C. [DOI] [PMC free article] [PubMed] [Google Scholar]
- Lauchaux J, Rodriguez E, Le Van Quyen M, Lutz A, Martinerie J, Varela FJ. Studying single-trials of phase-synchronous activity in the brain. International Journal of Bifurcation and Chaos. 2000;10(10):2429–2439. [Google Scholar]
- Leuthardt EC, Schalk G, Wolpaw JR, Ojemann JG, Moran DW. A brain-computer interface using electrocorticographic signals in humans. J Neural Eng. 2004;1(2):63–71. doi: 10.1088/1741-2560/1/2/001. [DOI] [PubMed] [Google Scholar]
- Miller KJ, Leuthardt EC, Schalk G, Rao RP, Anderson NR, Moran DW, Miller JW, Ojemann JG. Spectral changes in cortical surface potentials during motor movement. J Neurosci. 2007;27(9):2424–2432. doi: 10.1523/JNEUROSCI.3886-06.2007. [DOI] [PMC free article] [PubMed] [Google Scholar]
- Mima T, Matsuoka T, Hallett M. Functional coupling of human right and left cortical motor areas demonstrated with partial coherence analysis. Neuroscience Letters. 2000;287(2):93–96. doi: 10.1016/s0304-3940(00)01165-4. [DOI] [PubMed] [Google Scholar]
- Ohara S, Ikeda A, Kunieda T, Yazawa S, Baba K, Nagamine T, Taki W, Hashimoto N, Mihara T, Shibasaki H. Movement-related change of electrocorticographic activity in human supplementary motor area proper. Brain. 2000;123(6):1203–1215. doi: 10.1093/brain/123.6.1203. [DOI] [PubMed] [Google Scholar]
- Onishi H, Soma T, Kameyama S, Oishi M, Fuijmoto A, Oyama M, Furusawa AA, Kurokawa Y. Cortical neuromagnetic activation accompanying two types of voluntary finger extension. Brain Research. 2006;1123(1):112–118. doi: 10.1016/j.brainres.2006.09.033. [DOI] [PubMed] [Google Scholar]
- Pfurtscheller G, Graimann B, Huggins JE, Levine SP, Schuh LA. Spatiotemporal patterns of beta desynchronization and gamma synchronization in corticographic data during self-paced movement. Clin Neurophysiol. 2003;114(7):1226–1236. doi: 10.1016/s1388-2457(03)00067-1. [DOI] [PubMed] [Google Scholar]
- Pfurtscheller G, Neuper C. Simultaneous eeg 10 hz desynchronization and 40 hz synchronization during finger movements. Neuroreport. 1992;3(12) doi: 10.1097/00001756-199212000-00006. [DOI] [PubMed] [Google Scholar]
- Pollok B, Gross J, Mueller K, Aschersleben G, Schnitzler A. The cerebral oscillatory network associated with auditorily paced finger movements. NeuroImage. 2005;24(3):646–655. doi: 10.1016/j.neuroimage.2004.10.009. [DOI] [PubMed] [Google Scholar]
- Schalk G, Brunner P, Gerhardt LA, Bischof H, Wolpaw JR. Brain-computer interfaces (bcis): Detection instead of classification. Journal of Neuroscience Methods. 2008;167(1):51–62. doi: 10.1016/j.jneumeth.2007.08.010. [DOI] [PubMed] [Google Scholar]
- Schwartz AB, Cui XT, Weber DJ, Moran DW. Brain-controlled interfaces: movement restoration with neural prosthetics. Neuron. 2006;52(1):205–220. doi: 10.1016/j.neuron.2006.09.019. [DOI] [PubMed] [Google Scholar]
- Serrien DJ. The neural dynamics of timed motor tasks: evidence from a synchronization-continuation paradigm. Eur J Neurosci. 2008;27(6):1553–1560. doi: 10.1111/j.1460-9568.2008.06110.x. [DOI] [PubMed] [Google Scholar]
- Shenoy P, Miller KJ, Ojemann JG, Rao RPN. Generalized features for electrocorticographic bcis. Ieee Transactions on Biomedical Engineering. 2008;55(1):273–280. doi: 10.1109/TBME.2007.903528. [DOI] [PubMed] [Google Scholar]
- Shibasaki H, Hallett M. What is the bereitschaftspotential? Clinical Neurophysiology. 2006;117(11):2341–2356. doi: 10.1016/j.clinph.2006.04.025. [DOI] [PubMed] [Google Scholar]
- Stancak AJ, Pfurtscheller G. Event-related desynchronisation of central beta-rhythms during brisk and slow self-paced finger movements of dominant and nondominant hand. Brain Res Cogn Brain Res. 1996;4(3):171–183. doi: 10.1016/s0926-6410(96)00031-6. [DOI] [PubMed] [Google Scholar]
- Tallon-Baudry C, Bertrand O, Henaff MA, Isnard J, Fischer C. Attention modulates gamma-band oscillations differently in the human lateral occipital cortex and fusiform gyrus. Cerebral Cortex. 2005;15(5):654–662. doi: 10.1093/cercor/bhh167. [DOI] [PubMed] [Google Scholar]
- Waldert S, Preissl H, Demandt E, Braun C, Birbaumer N, Aertsen A, Mehring C. Hand movement direction decoded from meg and eeg. Journal of Neuroscience. 2008;28(4):1000–1008. doi: 10.1523/JNEUROSCI.5171-07.2008. [DOI] [PMC free article] [PubMed] [Google Scholar]


