

Abstract
The mechanical environment plays an important role in cell signaling and tissue homeostasis. Unraveling connections between externally applied loads and the cellular response is often confounded by extracellular matrix (ECM) heterogeneity. Image-based multiscale models provide a foundation for examining the fine details of tissue behavior, but they require validation at multiple scales. In this study, we developed a multiscale model that captured the anisotropy and heterogeneity of a cell-compacted collagen gel subjected to an off-axis hold mechanical test and subsequently to biaxial extension. In both the model and experiments, the ECM reorganized in a nonaffine and heterogeneous manner that depended on multiscale interactions between the fiber networks. Simulations predicted that tensile and compressive fiber forces were produced to accommodate macroscopic displacements. Fiber forces in the simulation ranged from −11.3 to 437.7 nN, with a significant fraction of fibers under compression (12.1% during off-axis stretch). The heterogeneous network restructuring predicted by the model serves as an example of how multiscale modeling techniques provide a theoretical framework for understanding relationships between ECM structure and tissue-level mechanical properties and how microscopic fiber rearrangements could lead to mechanotransductive cell signaling.
Keywords: mechanobiology, tissue mechanics, biomechanics, cruciforms
Many activities of anchorage-dependent cells, including proliferation (1, 2), migration (3–5), gene expression/protein synthesis (6, 7), chemical responsiveness (8, 9), and differentiation (10, 11), are mediated by mechanical interactions between the cells and their environment. Although it is often convenient for us to treat the cell's environment and interactions therewith as isotropic and homogeneous, the vast body of biology argues against that simplification. Tissues may appear homogeneous at the macroscopic scale, but they are, in fact, highly hierarchical, appearing as discrete structural entities (e.g., fibers) when viewed at the scale of a cell. Likewise, the cell does not interact smoothly with its surroundings, but rather forms cell-matrix adhesions, which are also distributed heterogeneously at discrete locations over the cell surface (12).
It is thus imperative that we explore mechanobiology not just in terms of gross tissue mechanics, but also in terms of the constituents of the tissue, taking as detailed a view as possible. One must recognize that a nominally homogeneous loading environment on the tissue scale, such as uniaxial extension, in fact is highly heterogeneous at the fiber scale, with some fibers possibly even being in compression (i.e., buckled) because of the complex interactions of the network. Because the cell interrogates only a fraction of the total fiber population, a more detailed view of the extracellular matrix (ECM) is needed. Our group is developing multiscale modeling techniques to understand how the complex mechanical interactions that arise within the ECM microstructure are integrated into the mechanical response of the whole tissue, particularly in engineered tissues (13–15). In our experiments, we mechanically test cross-shaped, cell-compacted collagen gels (cruciforms) (16) while simultaneously imaging local collagen fiber network restructuring (17). An image-based multiscale computational model is then constructed that must match both the macroscopic mechanical response of the cruciform and the microscopic rearrangements of the ECM fiber network that occur during loading. In the model, unique 3D fiber networks are constructed consistent with the direction and strength of fiber alignment measured by polarized-light imaging. Fiber-level constitutive parameters used to simulate the cruciform response to an off-axis hold test are then used to predict the cruciform response to an equibiaxial stretch test. In this work, we demonstrate how an image-based multiscale model composed of spatially varying microstructural networks can be used to simulate multiple macroscopic deformations of the same sample and how the microstructural rearrangements predicted by the model are consistent with polarized-light images of deformed samples. To our knowledge, experimental data acquired at multiple-length scales in a cell-compacted collagen gel have not previously been successfully predicted. From the experiments and model simulations, we see that ECM reorganization proceeds in a nonaffine and heterogeneous fashion that depends on multiscale interactions communicated between the fiber networks. Furthermore, an examination of fiber-level kinematics reveals a location and loading-protocol-dependent distribution of fiber forces that includes both tension and compression.
Results
The fibroblast-populated type I collagen cruciform used in this study was allowed to compact for 4 days to generate fiber alignment but minimize the synthesis of additional ECM components (1). For the mold geometry studied, cell compaction produced strong alignment along the vertical and horizontal arms of the cruciform and gave the central region slightly more alignment in the horizontal direction because of the wider horizontal arms used (16). During mechanical testing, real-time fiber reorganization in the cruciform was assessed by monitoring changes in fiber direction (θ) and strength of fiber alignment (δ*) with polarimetric fiber alignment imaging (PFAI). These data were used to construct 3D microstructural networks at equivalent locations in the multiscale model and to track and compare microstructural changes in response to loading. Two parameters used in the fiber constitutive equation, A = Ef Af = 52 nN and B = 3.8, were selected to fit the macroscopic response of the cruciform to off-axis stretch (Fig. 1). The equibiaxial stretch test was then simulated by using the same model parameters. Ef is a fitting parameter that reduces to the Young's modulus in the limit of small strain and Af is the fiber cross-sectional area. To provide a sense of the physical meaning of A, a collagen fiber with a diameter of 100 nm and A = 52 nN would have an Ef = 6.8 MPa.
Fig. 1.

Cruciform mechanical response to off-axis hold and equibiaxial stretch. (A) Inset shows a representative cruciform in mold with horizontal and vertical arm widths of 8 and 4 mm, respectively. Parameters A and B, which define the mechanical response of a network fiber, were selected so that the model predictions (red lines) matched the off-axis hold experiment (circular markers) and were used to predict the model response to equibiaxial stretch. In the off-axis hold test (A), the vertical arms of the cruciform were each displaced 2 mm (λy = 1.29) in 15 sec while the horizontal arms remained stationary. The average loading response of both axes is plotted as a function of vertical axis extension. (B) For equibiaxial stretch, both arms were extended 1.5 mm (λy = 1.21) in 15 sec. The model reasonably predicted the cruciform response but underpredicted nonlinearity in the vertical arm.
Macroscopic Response to Off-Axis Hold and Equibiaxial Stretch Tests.
For the off-axis hold test (Fig. 1A), the force developed in the vertical arm was greater than in the stationary horizontal arm, reaching peak values of 8.4 mN and 2.4 mN, respectively. The model likely underpredicted the initial mechanical response here because of failure to account for rotational stiffness at the cross-links. When the cruciform was subjected to equibiaxial stretch (Fig. 1B), the mechanical response increased in nonlinearity, with more force required to distend the wider horizontal arm (peak force 14.8 mN) than the thinner vertical arm (peak force 7.1 mN). The model captured this behavior but underpredicted the nonlinearity in the vertical arm.
The finite element model domain was specified at the grips to match the grip displacements in the experiment, leaving the curved surface free to deform in accord with network restructuring occurring within the elements. A comparison of the model domain and the cruciform (Fig. 2) shows that for the off-axis hold test, model predictions of domain expansion were less accurate with increasing stretch [Table 1, Overlap Parameter (OP) (see Model Domain Overlap)]. The position of the curved surface was overpredicted near the horizontal grip and underpredicted in the center of the curve. The equibiaxial stretch simulation preformed similarly. Initially, the model domain slightly underpredicted the experiment domain. With increasing stretch, however, boundary expansion was mostly overpredicted.
Fig. 2.

Cruciform domain changes and microstructural reorganization for off-axis and equibiaxial stretch. The bottom left quadrant of the cruciform is shown with the model domain and network alignment properties (red) overlaid on PFAI measurements of fiber orientation and strength of alignment (white). The areas of black on the horizontal and vertical are the compression grips, which are spanned by the free surface of the cruciform. The difference in principal direction between the model and experiment is depicted in the Inset. Also shown is the network angle distribution in the model (red) and the experiment (blue). (A) For the off-axis hold test, the model predicts the measured rotation and alignment of the fiber networks with extension of the vertical axis. (B) The same model subjected to equibiaxial stretch predicts that local network direction rotates some toward the horizontal and reasonably matches the experiment.
Table 1.
Difference in network properties and domain overlap
| Model | Displacement, mm | 〈Δθ〉,° | 〈Δδ*〉,° | OP |
|---|---|---|---|---|
| Off-axis | 0.00 | 1.6 ± 2.0 | 0.052 ± 0.044 | 1.48 |
| 1.00 | 7.3 ± 7.6 | 0.075 ± 0.053 | 2.13 | |
| 2.00 | 7.0 ± 9.5 | 0.112 ± 0.083 | 3.04 | |
| Equibiaxial | 0.00 | 7.8 ± 8.3 | 0.073 ± 0.051 | 2.58 |
| 1.00 | 10.0 ± 7.0 | 0.112 ± 0.085 | 2.42 | |
| 1.50 | 8.3 ± 6.1 | 0.125 ± 0.085 | 2.70 |
Microscopic Response to Off-Axis Hold and Equibiaxial Stretch.
Model networks were created to match the initial principal direction (θ) and strength of alignment (δ*) of the cruciform before the off-axis hold test (Table 1). An isotropic network with no preferred direction is denoted by δ* = 0, whereas a completely aligned network with each fiber oriented in the same direction is denoted by δ* = 1 (see Materials and Methods). In the off-axis hold test, extension of the vertical axis caused the collagen networks to rotate and stretch with the vertical grip. The model captured this behavior, although there are some regions of disagreement (Fig. 2). For equibiaxial stretch, the networks, which were already preferentially aligned in either the horizontal or vertical direction, became more so with increasing stretch, and a similar level of agreement between the model and the experiment was observed. Distributions for the principal angle at each stage of deformation indicate that the model captured gross network reorganization both in the off-axis hold test, where the microstructure's mean orientation rotated from the horizontal to the vertical direction, and the equibiaxial stretch test, where a small net rotation toward the horizontal occurred. In some regions, network reorientation was not matched. For the most part, these regions correspond to locations where the network was nearly isotropic, and the principal direction was thus poorly defined. For example, in the off-axis hold test at d = 1.00 mm, a network near the cruciform center with δ* = 0.103 was highly inaccurate in principal direction with Δθ = 34.0°. This network became more aligned at full extension as it completed its transition from a principal direction oriented horizontally to one oriented vertically, and the agreement was much improved (Δθ = 11.8°). The top left network, however, does not fall in this category. Instead, the collagen network in this location reorganized in a manner poorly predicted by the model (Δθ = 70.4°). Despite this network, the average difference in principal angle for maximum extension was only Δθ = 7.0 ± 9.5° and Δθ = 8.3 ± 6.1° for the off-axis hold and equibiaxial stretch tests, respectively. Likewise, the average difference in retardation was only Δδ* = 0.112 ± 0.083° and Δδ* = 0.125 ± 0.085°. These results show that, overall, the model captured network restructuring well. At the start of the equibiaxial stretch simulation, however, some of the networks were not well matched with their equivalent locations in the experiment, suggesting that changes in the microstructure occurred as a result of the off-axis hold test.
Location-Dependent Network Behavior and Fiber Kinematics.
Model simulations were also used to predict the response of individual fibers within the networks. For the off-axis hold test, at maximum extension, where the macroscopic stretch ratio in the y-direction was λy = 1.29, fiber stretch ratios, λf, ranged from 0.39 to 1.44 (〈λf〉 = 1.06 ± 0.08), revealing that a significant fraction of fibers in the model were in compression (12.1%). The percentage of fibers in compression varied regionally. More network fibers were compressed in elements in the center of the cruciform than elsewhere in the domain (fcmax = 25.2%, where fc is the fraction of compressed fibers in an element, and the superscript indicates this is either the maximum or minimum value for all of the elements in the domain). The lowest percentage of compressed fibers were found in elements at the vertical grip boundary (fcmin = 3.1%). By comparison, for equibiaxial stretch (λx = λy = 1.21) the range of λf increased to span from 0.38 to 1.68 (〈λf〉 = 1.11 ± 0.09), and the percentage of fibers in compression (5.5%) decreased. For equibiaxial stretch, the highest percentage of compressed fibers was found along the curved boundary (fcmax = 14.2%) and the lowest in the cruciform center (fcmin = 2.0%). The amount of network contraction in the z-direction varied and depended on how strongly networks were aligned with the principal loading directions. In general, equibiaxial stretch constrained in-plane fiber rotation and accelerated network contraction in the z-direction.
To illustrate better the network-level fiber kinematics, we examined networks at three locations in the model (Fig. 3). In the vertical arm of the cruciform, for the off-axis hold test, a network that was initially strongly aligned in the vertical direction (Table 2) increased in alignment and fiber forces from −8.5 to 45.6 nN were predicted (Fig. 31). A histogram of the fiber stretch ratios shows that most of them are below the macroscopic stretch ratio, λy, and that a small number of fibers are in compression. The same network subjected to equibiaxial stretch developed similar levels of force in the fibers, but at a lower stretch because fibers in other parts of the model that were free before to rotate toward the vertical were no longer capable of doing so because of stretch in the horizontal direction. These effects were transmitted throughout, even into the vertical arm of the cruciform. The added constraints produced more fibers with a stretch ratio that exceeded λy than before.
Fig. 3.

Network reorganization in response to off-axis and equibiaxial stretch. Depicted are networks from three different regions in the cruciform before stretch (Center) and their response to increasing stretch via off-axis stretch (Center to Left) and equibiaxial stretch (Center to Right). Network reorganization occurs in a location-dependent manner and a range of intranetwork forces develops. A histogram of the fiber stretch ratios in the deformed networks reveals that some fibers are in compression, even though a macroscopic tensile load is applied to the sample. Solid red lines show the macroscopic, tissue-level stretch ratio (λy) in the y-direction (vertical axis). λy = 1.15 at d = 1.00 mm, λy = 1.21 at d = 1.50 mm, and λy = 1.29 at d = 2.0 mm.
Table 2.
Properties of individual networks depicted in Fig. 3
| Network | Model | Displacement, mm | δmodel*, ° | θmodel*, ° | Δ δ *, ° | Δ θ, ° |
|---|---|---|---|---|---|---|
| 1 | Off-axis | 0.00 | 0.811 | 90.5 | 0.001 | 1.7 |
| 1.00 | 0.818 | 90.3 | 0.070 | 3.6 | ||
| 2.00 | 0.907 | 89.9 | 0.064 | 5.7 | ||
| Equibiaxial | 0.00 | 0.811 | 90.5 | 0.021 | 4.1 | |
| 1.00 | 0.770 | 90.7 | 0.040 | 0.5 | ||
| 1.50 | 0.833 | 90.8 | 0.123 | 1.3 | ||
| 2 | Off-axis | 0.00 | 0.113 | 162.8 | 0.055 | 3.9 |
| 1.00 | 0.072 | 122.5 | 0.062 | 3.3 | ||
| 2.00 | 0.168 | 100.3 | 0.172 | 1.2 | ||
| Equibiaxial | 0.00 | 0.113 | 162.8 | 0.174 | 14.8 | |
| 1.00 | 0.138 | 167.9 | 0.211 | 11.6 | ||
| 1.50 | 0.149 | 169.4 | 0.170 | 9.3 | ||
| 3 | Off-axis | 0.00 | 0.559 | 163.7 | 0.018 | 0.9 |
| 1.00 | 0.560 | 159.7 | 0.037 | 22.2 | ||
| 2.00 | 0.566 | 155.4 | 0.024 | 14.3 | ||
| Equibiaxial | 0.00 | 0.559 | 163.7 | 0.018 | 0.9 | |
| 1.00 | 0.608 | 165.0 | 0.165 | 8.8 | ||
| 1.50 | 0.628 | 165.1 | 0.174 | 7.4 |
Location-dependent network restructuring was more apparent in the central region of the cruciform (Fig. 32). Networks in this area initially possessed moderate alignment in the horizontal direction. During the off-axis hold test, many fibers were able to rotate and stretch into the vertical direction as the vertical grip was displaced (Fig. 3). As a result, forces in the fibers remained lower (−5.3 to 39.1 nN) than in the vertical region of the cruciform. For equibiaxial stretch, the fibers were not as free to rotate vertically and higher forces were developed. Histograms of the fiber stretch ratio reveal that all fibers were below λy for the off-axis hold test, but a fraction of the fibers exceeded λy with equibiaxial stretch.
Networks along the curved surface of the domain rotated in a manner that produced what would appear as shear when viewed at a higher length scale (e.g., the network or tissue level) (Fig. 33). For off-axis hold, the λf values were well below λy, even at maximum extension, resulting in lower forces in this region. In contrast, equibiaxial stretch limited fiber rotation, with the fibers instead deforming axially and developing the highest forces of the three networks depicted.
Discussion
In this work, we constructed an image-based multiscale model that matched the geometry, local microstructure, and mechanical response of a cell-compacted cruciform subjected to an off-axis hold extension test. The model was then used to predict the multiscale mechanical response of the cruciform to an equibiaxial stretch test. Even though idealized fiber networks were used, the model was able to match both the macroscopic and microscopic mechanical and structural responses. Our results demonstrate that these modeling techniques provide a theoretical framework for interpreting experimental mechanical data in terms of ECM structure and heterogeneity. In this work, the model showed how externally applied loads are communicated throughout the cruciform and met with nonaffine network restructuring, which resulted in a distribution of tensile and compressive fiber forces. Detailed models are needed for investigating how tissue-level mechanical properties are dependent on ECM structure and composition. Without such a model, it would be difficult to appreciate the multiscale interactions involved.
Technical Assessment of the Model.
In formulating the model, a number of key assumptions were made. First, important contributions from the cells and the interstitial fluid were ignored. Several studies have shown that the cells contribute both actively and passively to the mechanics of compacted gels (18) and that interstitial fluid supports compressive loads and contributes to the gel's viscoelastic response (19). Differences in the cruciform's mechanical response to the two mechanical tests could reflect a dependence on the experiment strain rates. Both the off-axis hold and equibiaxial stretch tests were extended fully in 15 sec, which corresponds to linear strain rates of 116 and 84 strain (%)/min, respectively. Using data from a similar experiment where uniaxial testing was conducted on acellular collagen gels (20), we estimated only a 5% difference in linear modulus for these strain rates (17.8 vs. 18.6 kPa). The concept of a single strain rate, however, is not appropriate for comparison here because the loading conditions were different.
A second simplification was that the microstructure was idealized as a single network of uniform diameter collagen fibers, and other ECM components were excluded. Scanning electron microscopy conducted on acellular collagen gels revealed a heterogeneous population of fiber diameters. Measured fiber diameters ranged from 42 to 255 nm with a mean diameter of 69 nm. The cruciform was cultured for 4 days to limit ECM synthesis but it was likely not a pure collagen network. Fiber-level mechanics was specified using an exponential constitutive equation, and fiber–fiber cross-links were constructed to permit fibers to rotate but not bend or slide past each other. In a previous study (21), we assessed the sensitivity of the model to the form of the fiber constitutive equation and found no qualitative difference between an exponential or linear equation. The assumptions we have made regarding fiber cross-links are an approximation that is consistent with experimental observations made in a previous study (19). However, more work must be done to elucidate the details of these interactions. The nonlinear material response captured in the model arises primarily from the properties of the network, where fibers accommodate the macroscopic stretch through rotations at the cross-links before stretching along the fiber axis. Finally, a relationship between measured sample retardation and modeled network strength of alignment was assumed. Although all of these issues are important, and each is the subject for potential future investigation, the current model was still effective at describing both the microscopic and macroscopic behavior of the cruciform.
The amount of domain overlap between the model and experiment was used to assess model accuracy, but it also provided an assessment of the importance of mesh refinement and network microstructure. Increasing the number of elements from 64 to 134 did not improve overlap appreciably, thus indicating that the coarser mesh accounted sufficiently for the scale of microstructural heterogeneity in the cruciform. At maximum extension (d = 2.00 mm) in the off-axis hold test, the overlap parameter (OP) in the refined model was 2.9 versus 3.0 in the coarse model. Specification of the fiber network microstructure was clearly important for the accuracy of the simulations. For the off-axis hold test, a non-image-based model composed of one, nearly isotropic network underpredicted domain expansion along the curved surface of the cruciform with OP = 4.4 and OP = 7.9 at d = 1.00 mm and d = 2.00 mm, respectively. When a set of networks was used that matched the cruciform principal directions but had artificially elevated alignment (〈δ* = 0.927 ± 0.019〉), the domain was overpredicted by OP = 7.3 and OP = 13.8 at d = 1.00 mm and d = 2.00 mm. The large change in overlap error when incorrect fiber distributions are used demonstrates the need for a structural view of the cruciform if detailed mechanical analysis is to be performed.
Implications for Mechanotransduction.
Mechanical signals are an important component of tissue homeostasis and growth (22). The importance of mechanical signaling as a source of stimulation for growth and remodeling in engineered connective tissues has been clearly demonstrated (23–26). In these studies, engineered tissues were subjected to a variety of loading protocols, and a range of cellular responses that improved construct mechanical properties were observed, including increased cell proliferation and ECM deposition. Isolating the signaling mechanisms that led to these changes in cell activity is difficult because the associated events, in addition to being dynamic, span several length scales and are conducted through a heterogeneous ECM. Even for relatively simple external loading protocols, such as uniaxial extension, load transmission and ECM restructuring produce a complex array of potential mechanical signals. Multiscale models, when informed by the tissue microstructure, provide a conceptual framework for characterizing a cell's microenvironment and identifying the mechanical signals for a specific cell activity.
Although cells were not included in this model, some insights on the kinds of mechanical signals a cell might sense when loaded are possible. The networks in the model represent a box edge length of ≈8 μm in the physical domain, a scale on par with that of a cell in a 3D environment (20 μm). A cell adherent to these fiber networks would sense a range of fiber forces (bounded from −11.3 to 437.7 nN, with 〈F〉 = 9.86 ± 10.02 nN in these simulations) expressed differentially over the cell and in a manner dependent on the cell-fiber connections and location within the cruciform.
There are many different modeling treatments of biopolymer networks (e.g., refs. 27–29). In future mechanobiological studies, it will be essential to recognize not only the universal features of such networks but also the unique features of each biopolymer system (see ref. 30). The inclusion of these biopolymer models, molecular level models (Buehler), cell models (32), and additional experimental data (33), all of which could potentially be incorporated into this theoretical framework, would clarify the mechanical cause and effect for these cell-level events, such as the relationship between gene transcription and force transmission within the ECM, cytoskeleton, and nucleus (34). Other phenomena that could be addressed include fiber damage and preconditioning effects as seen in this experiment.
Image-based multiscale models, such as the one presented here, provide a means to integrate large amounts of data from multiple length scales. Such models are but one part of an important set of tools necessary to unravel and define the connections between the ECM's composition and organization, the tissue's macroscopic mechanical behavior, and the cell's activity in response to its structural and mechanical microenvironment.
Materials and Methods
Sample Preparation.
Collagen gels were prepared by mixing neonatal human dermal fibroblasts with acid-soluble type I collagen (Organogenesis) and cast in a cross-shaped Teflon mold (cruciform) to produce a final collagen concentration of 1.5 mg/mL and a cell concentration of 1 × 10⁶ cells per milliliter. The mold geometry consisted of a vertical channel 4 mm wide and a horizontal channel 8 mm wide. This configuration produces strong alignment in the arms and produces slightly more horizontal alignment in the center (16). The cruciform was cultured for 4 days to allow compaction, which stiffens and aligns the gel, without allowing significant remodeling to occur. Gels were cultured in DMEM (Gibco) supplemented with 10% FBS (HyClone) 100 units/mL penicillin, 2 μg/mL insulin, 50 μg/mL ascorbic acid, 2.5 μg/mL amphotericin-β, 1 ng/mL TGF-β2.
Mechanical Testing and Polarimetry.
Mechanical testing was conducted on an Instron planar biaxial testing unit. Samples arms were attached via compression grips to 5-N load cells and tested in PBS at room temperature. Samples were first subjected to an off-axis hold test in which the horizontal arms (8 mm) remained stationary while the vertical arms (4 mm) were displaced to a stretch ratio of 1.29. Samples were then subjected to an equibiaxial stretch test where both arms were displaced to a stretch ratio of 1.21. Both tests were conducted in 15 sec to accommodate video acquisition. PFAI was used to measure the real-time change in local network fiber direction and strength of fiber alignment during mechanical testing (see ref. 17).
Multiscale Model.
The image-based modeling techniques used here are based on the theory of volume averaging and are described in refs. 14 and 15 and SI Appendix and Fig. S1. The model used the Galerkin finite element method for the macroscopic problem, but instead of using a constitutive equation to relate the deformation to the stress, a set of microscopic network problems was solved at the locations where the stress is needed for the finite element solution. Within this framework, three equations are necessary to solve the problem: an equation for the macroscopic stress balance, a volume averaging equation that relates the microscopic force balance on the network fibers to the macroscopic stress at the finite element integration points, and a constitutive equation that describes fiber mechanics. We used the phenomenological constitutive equation (35) F = A/B[exp(Bεf) − 1], where F is the fiber force, A and B are constitutive constants, and ε is the Green's strain given by 0.5(λf2 − 1), where λf is the fiber stretch ratio.
Microscopic Fiber Networks.
A finite element (FE) mesh was created containing 64 hexagonal trilinear elements (one element through the thickness) that matched the geometry of the sample. With an assumption of symmetry, only one quadrant was modeled. For each element, a unique 3D collagen network was created. The average retardation and angle associated with each element was obtained by using the projected FE area as a mask on the PFAI data. Because the data from the PFAI measurements represents values projected from a 3D microstructure, the networks were created so that their projections matched. Fiber network orientation was quantified with the length weighted second-rank orientation tensor, given by
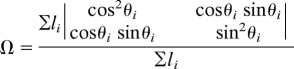 |
where li is the length of fiber i, and θi is the angle that fiber i makes with respect to the horizontal, and the sum is over all of the fibers in the network. Networks were created with a stochastic growth algorithm and chosen so that their principal eigenvector matched the PFAI fiber direction (θ) and the difference in their eigenvalues matched the scaled retardation (δ*) within a given tolerance. PFAI raw retardation (δ) was converted to network anisotropy through δ* = δ/C = ω2 − ω1. where C is a lumped proportionality constant (here, C = 75°), and ω2 and ω1 are the major and minor eigenvalues, respectively, of Ω. C accounts for the influence of collagen concentration, composition, sample thickness, and other factors affecting polarized light transmission that are assumed homogeneous throughout the sample. This assumption is valid provided that the number of retarders in a given location does not change. As a result, variations in sample thickness and collagen concentration are permissible as long as they are coupled in this manner. Under this convention, for an isotropic network δ* = 0 and for a completely aligned network δ* = 1. Networks were accepted if the dot product of the network principal direction and the PFAI principal angle exceeded 0.99. No restrictions were explicitly placed on matching δ and δ* because the average difference between model and experiment was only 0.06 ± 0.04.
Computational Implementation and Demands.
The multiscale code was complied in C and executed on an IBM BladeCenter Linux Cluster at the Minnesota Supercomputing Institute. The problem involved ≈500,000° of freedom. The computational demands arose chiefly from the microscopic network problems, with each network containing ≈325 cross-links (x, y, z cross-link position), eight networks per element, and 64 elements. By comparison, the macroscopic problem contained 182 nodes and only 546° of freedom (x, y, z node position). To improve run time, the microscopic problem was parallelized by using message passing interface (MPI). For these simulations, 12 Opteron 2218 processors (dual core 2.6 GHz) were used with a wall time just under 1 h.
Model Domain Overlap.
The amount of pixel overlap between the model and the experiment was calculated to assess the model's predictive capabilities. Cruciform images were imported into Matlab, thresholded, and segmented with a Canny edge detection algorithm to find the cruciform boundary and remove background pixels. An exclusive or (XOR) operation on the cruciform and model areas gave the number of nonoverlapping pixels, which were then normalized by the number of pixels that made up the boundary of the curved surface in the model. This value, which we call the OP, corresponds to the average number of pixels off the curved boundary is in the model. OP = 0 when the model and experiment domains perfectly overlap and increases as model predictions worsen.
Supplementary Material
Acknowledgments.
This work was supported by National Institutes of Health Grants R01 EB005813 and F32 EB007433 and carried out in part using computing resources at the University of Minnesota Supercomputing Institute.
Footnotes
The authors declare no conflict of interest.
This article is a PNAS Direct Submission.
This article contains supporting information online at www.pnas.org/cgi/content/full/0903716106/DCSupplemental.
References
- 1.Nakagawa S, Grinnell F. Long-term culture of fibroblasts in contracted collagen gels: Effects on growth and biosynthetic activity. J Invest Dermatol. 1989;93:792–798. doi: 10.1111/1523-1747.ep12284425. [DOI] [PubMed] [Google Scholar]
- 2.Grinell F, Zhu M, Carlson MA, Abrams JM. Release of mechanical tension triggers apoptosis of human fibroblasts in a model of regressing granulation tissue. Exp Cell Res. 1999;248:608–619. doi: 10.1006/excr.1999.4440. [DOI] [PubMed] [Google Scholar]
- 3.Pelham RJ, Wang Y. Cell locomotion and focal adhesions are regulated by substrate flexibility. Proc Natl Acad Sci USA. 1997;94:13661–13665. doi: 10.1073/pnas.94.25.13661. [DOI] [PMC free article] [PubMed] [Google Scholar]
- 4.Lo C, Wang H, Dembo M, Wang Y. Cell movement is guided by the rigidity of the substrate. Biophys J. 2000;79:144–152. doi: 10.1016/S0006-3495(00)76279-5. [DOI] [PMC free article] [PubMed] [Google Scholar]
- 5.Zaman MH, et al. Migration of tumor cells in 3D matrices is governed by matrix stiffness along with cell-matrix adhesion and proteolysis. Proc Natl Acad Sci USA. 2006;103:10889–10894. doi: 10.1073/pnas.0604460103. [DOI] [PMC free article] [PubMed] [Google Scholar]
- 6.Kessler D, et al. Fibroblasts in mechanically stressed collagen lattices assume a “synthetic” phenotype. J Biol Chem. 2001;276:36575–36585. doi: 10.1074/jbc.M101602200. [DOI] [PubMed] [Google Scholar]
- 7.Trächslin J, Koch M, Chiquet M. Rapid and reversible regulation of collagen XII expression by changes in tensile stress. Exp Cell Res. 1999;247:320–328. doi: 10.1006/excr.1998.4363. [DOI] [PubMed] [Google Scholar]
- 8.Nakagawa S, Pawelek P, Grinnell F. Extracellular matrix organization modulates fibroblast growth and growth factor responsiveness. Exp Cell Res. 1989;182:572–582. doi: 10.1016/0014-4827(89)90260-7. [DOI] [PubMed] [Google Scholar]
- 9.Arora PD, Narani N, McCulloch AG. The compliance of collagen gels regulates transforming growth factor-β induction of α-smooth muscle actin in fibroblasts. Am J Path. 1999;154:871–882. doi: 10.1016/s0002-9440(10)65334-5. [DOI] [PMC free article] [PubMed] [Google Scholar]
- 10.Wozniak MA, Desai R, Solski PA, Der CJ, Keely PJ. ROCK-generated contractility regulates breast epithelial cell differentiation in response to the physical properties of a three-dimensional collagen matrix. J Cell Biol. 2003;163:583–595. doi: 10.1083/jcb.200305010. [DOI] [PMC free article] [PubMed] [Google Scholar]
- 11.Engler AJ, Sen S, Sweeney HL, Discher DE. Matrix elasticity directs stem cell lineage specification. Cell. 2006;126:677–689. doi: 10.1016/j.cell.2006.06.044. [DOI] [PubMed] [Google Scholar]
- 12.Cukierman E, Pankov R, Stevens DR, Yamada KM. Taking cell-matrix adhesions to the third dimension. Science. 2001;294:1708–1712. doi: 10.1126/science.1064829. [DOI] [PubMed] [Google Scholar]
- 13.Chandran PL, Stylianopoulos T, Barocas VH. Microstructure-based modeling for the mechanical behavior of hydrated fiber networks. Multiscale Modeling Simulation. 2008;7:22–43. [Google Scholar]
- 14.Stylianopoulos T, Barocas VH. Volume-averaging theory for the study of the mechanics of collagen networks. Comput Methods Appl Mech Eng. 2007;196:2981–2990. [Google Scholar]
- 15.Sander EA, Stylianopoulos T, Tranquillo RT, Barocas VH. Image-based biomechanics of collagen-based tissue equivalents: Multiscale models compared to fiber alignment predicted by polarimetric imaging. IEEE Eng Med Biol. 2009;28(3):10–18. doi: 10.1109/MEMB.2009.932486. [DOI] [PMC free article] [PubMed] [Google Scholar]
- 16.Jhun C, Evans MC, Barocas VH, Tranquillo RT. Planar biaxial mechanical behaviour of bioartificial tissues possessing prescribed fiber alignment. J Biomech Eng. 2009;131 doi: 10.1115/1.3148194. 081006. [DOI] [PMC free article] [PubMed] [Google Scholar]
- 17.Tower TT, Neidert MR, Tranquillo RT. Fiber alignment imaging during mechanical testing of soft tissues. Ann Biomed Eng. 2002;30:1221–1233. doi: 10.1114/1.1527047. [DOI] [PubMed] [Google Scholar]
- 18.Wakatsuki T, Kolodney MS, Zahalak GI, Elson EL. Cell mechanics studied by a reconstituted model tissue. Biophys J. 2000;79:2353–2368. doi: 10.1016/S0006-3495(00)76481-2. [DOI] [PMC free article] [PubMed] [Google Scholar]
- 19.Chandran PL, Barocas VH. Microstructural mechanics of collagen gels in confined compression: Poroelasticity, viscoelasticity, and collapse. J Biomech Eng. 2004;126:152–166. doi: 10.1115/1.1688774. [DOI] [PubMed] [Google Scholar]
- 20.Roeder BA, Kokini K, Sturgis JE, Robinson JP, Voytik-Harbin SL. Tensile mechanical properties of three-dimensional type I collagen extracellular matrices with varied microstructure. J Biomech Eng. 2002;124:214–222. doi: 10.1115/1.1449904. [DOI] [PubMed] [Google Scholar]
- 21.Stylianopoulos T, Barocas VH. Multiscale, structure-based modeling for the elastic mechanical behavior of arterial walls. J Biomech Eng. 2007;129:611–618. doi: 10.1115/1.2746387. [DOI] [PubMed] [Google Scholar]
- 22.Shraiman BI. Mechanical feedback as a possible regulator of tissue growth. Proc Natl Acad Sci USA. 2005;10:3318–3323. doi: 10.1073/pnas.0404782102. [DOI] [PMC free article] [PubMed] [Google Scholar]
- 23.Garvin J, Qi J, Maloney M, Banes AJ. Novel system for engineering bioartificial tendons and applications to mechanical load. Tissue Eng. 2003;9:967–979. doi: 10.1089/107632703322495619. [DOI] [PubMed] [Google Scholar]
- 24.Seliktar D, Nerem RM, Galis ZS. Mechanical strain-stimulated remodeling of tissue-engineered blood vessel constructs. Tissue Eng. 2003;9:657–666. doi: 10.1089/107632703768247359. [DOI] [PubMed] [Google Scholar]
- 25.Isenberg BC, Tranquillo RT. Long-term cyclic distension enhances the mechanical properties of collagen-based media-equivalents. Ann Biomed Eng. 2003;31:937–949. doi: 10.1114/1.1590662. [DOI] [PubMed] [Google Scholar]
- 26.Syedain ZH, Weinberg JS, Tranquillo RT. Cyclic distension of fibrin-based constructs: Evidence of adaptation during growth of engineered connective tissue. Proc Natl Acad Sci USA. 2008;105:6537–6542. doi: 10.1073/pnas.0711217105. [DOI] [PMC free article] [PubMed] [Google Scholar]
- 27.Dalhaimer P, Discher DE, Lubensky TC. Crosslinked actin networks show liquid crystal elastomer behaviour, including soft-mode elasticity. Nat Phys. 2007;3:354–360. [Google Scholar]
- 28.Storm C, Pastore JJ, MacKintosh FC, Lubensky TC, Janmey PA. Nonlinear elasticity in biological gels. Nature. 2005;435:191–194. doi: 10.1038/nature03521. [DOI] [PubMed] [Google Scholar]
- 29.Wang H, Berhan L, Sastry AM. Structure, mechanics, and failure of stochastic fibrous networks: part I—Microscale considerations. J Eng Mater Tech. 2000;122:450–468. [Google Scholar]
- 30.Sander EA, Stein AM, Swickrath MJ, Barocas VH. Trends in Computational Nanomechanics: Transcending Length and Time Scales. In: Dumitrica T, editor. New York: Springer; 2009. [Google Scholar]
- 31.Buehler MJ. Nature designs tough collagen: Explaining the nanostructure of collagen fibrils. Proc Natl Acad Sci USA. 2006;103:12285–12290. doi: 10.1073/pnas.0603216103. [DOI] [PMC free article] [PubMed] [Google Scholar]
- 32.Chan CE, Odde DJ. Traction dynamics of filopodia on compliant substrates. Science. 2008;322:1687–1691. doi: 10.1126/science.1163595. [DOI] [PubMed] [Google Scholar]
- 33.Pizzo Am, Kokini K, Vaughn LC, Waisner BZ, Voytik-Harbin SL. Extracellular matrix microstructural composition regulates local cell-ECM biomechanics and fundamental fibroblast behavior: A multidimensional perspective. J Appl Phys. 2005;98:1909–1921. doi: 10.1152/japplphysiol.01137.2004. [DOI] [PubMed] [Google Scholar]
- 34.Dahl KN, Ribeiro AJS, Lammerding J. Nuclear shape, mechanics, and mechanotransduction. Circ Res. 2008;102:1307–1318. doi: 10.1161/CIRCRESAHA.108.173989. [DOI] [PMC free article] [PubMed] [Google Scholar]
- 35.Billiar KL, Sacks MS. Biaxial mechanical properties of the native and glutaraldehyde-treated aortic valve cusp: Part II—A structural constitutive model. J Biomech Eng. 2000;122:327–335. doi: 10.1115/1.1287158. [DOI] [PubMed] [Google Scholar]
Associated Data
This section collects any data citations, data availability statements, or supplementary materials included in this article.