Abstract
Completely penetrant mutations in the surfactant protein B gene (SFTPB) and ≥75% reduction of SFTPB expression disrupt pulmonary surfactant function and cause neonatal respiratory distress syndrome. To inform studies of genetic regulation of SFTPB expression, we created a catalogue of SFTPB variants by comprehensive resequencing from an unselected, population-based cohort (N=1,116). We found an excess of low frequency variation (81 SNPs and 5 small insertion/deletions). Despite its small genomic size (9.7 kb), SFTPB was characterized by weak linkage disequilibrium (LD) and high haplotype diversity. Using the HapMap Yoruban and European populations, we identified a recombination hot spot that spans SFTPB, was not detectable in our focused resequencing data, and accounts for weak LD. Using homology based software tools, we discovered no definitively damaging exonic variants. We conclude that excess low frequency variation, intragenic recombination, and lack of common, disruptive exonic variants favor complete resequencing as the optimal approach for genetic association studies to identify regulatory SFTPB variants that cause neonatal respiratory distress syndrome in genetically diverse populations.
INTRODUCTION
The 9.7 kb surfactant protein B gene (SFTPB) (GeneID: 6439 Locus tag: HGNC:10801; MIM: 178640) encodes a 79-amino acid, hydrophobic protein that is critical for function of the pulmonary surfactant (1). Functional pulmonary surfactant, a phospholipid-protein mixture that lines alveoli at the air-liquid interface, maintains alveolar patency at end expiration and is required for successful fetal-neonatal pulmonary transition. Studies in human newborn infants with rare, recessive loss of function SFTPB mutations have demonstrated that genetic disruption of SFTPB expression is completely penetrant and lethal due to dysfunction of the pulmonary surfactant (2, 3). Studies in conditionally regulated murine lineages and human infants indicate that >75% reduction in SFTPB expression is sufficient to cause surfactant dysfunction and respiratory distress (4, 5). To provide a catalogue of SFTPB variants (single nucleotide polymorphisms (SNPs) or insertion-deletions (in/dels)) for use in statistical and functional studies of SFTPB regulation, we used high throughput, comprehensive resequencing of SFTPB in a cohort of sufficient size (N=1,116) to detect low frequency variants. We report an excess of low frequency variation, high rates of intragenic recombination, and a lack of common, damaging exonic variants. Our results suggest that comprehensive resequencing will likely be advantageous over tagSNP genotyping approaches in genetic association analysis of SFTPB.
METHODS
Automated amplification and sequencing
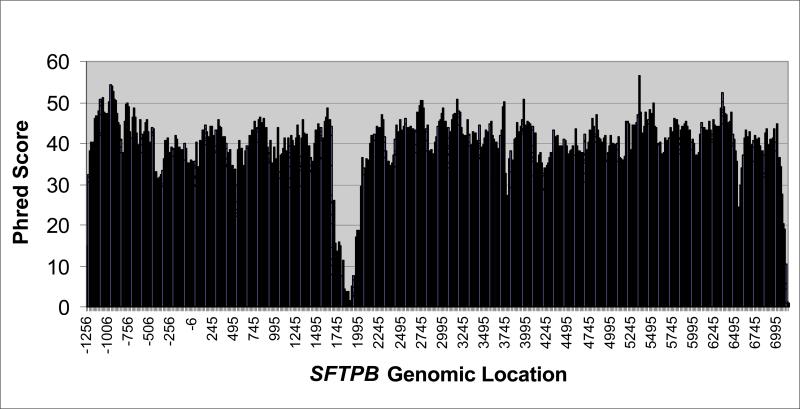
We extracted genomic DNA from 1,116 Guthrie cards collected for newborn screening by the Missouri Department of Health and Senior Services (DHSS) (6). We linked each DNA sample anonymously to clinical characteristics in a vital statistics (birth-death certificate) database maintained by the Missouri DHSS to determine ethnicity. Using small amplicons (<500 basepairs), robotic, high throughput automated processes, and BigDye terminator sequencing chemistry (7), we bidirectionally sequenced SFTPB, including 1.8 kB of the promoter region, 1.1 kB of exonic sequence (all 10 translated exons), and 5.9 kB that includes all intervening intronic sequence except 380 base pairs (genomic position 1649-2028) in intron 4. We omitted part of intron 4 due to the inability of BigDye terminator sequencing chemistry to resolve variable numbers of dinucleotide repeats in this region (8). We also omitted 1 untranslated exon (exon 11), and its preceding intron (intron 10). All amplification and sequencing primers and conditions are available at http://genome.wustl.edu/activity/med_seq/primers.cgi. We used software applications (Phred, Phrap, PolyPhred, and Consed) to call bases, assemble contigs, and scan sequencing chromatograms for variation (http://www.phrap.org/phredphrapconsed.html). To assess overall sequence quality, we used a quality averaging program (J. Sloan, University of Washington) to quantify Phred score at each base across SFTPB (Figure 1). Because of variation in trace file quality, analysts reviewed and confirmed or edited all polymorphic sites identified by Polyphred, sites with in/dels, and all sites previously identified as polymorphic in dbSNP in each individual. After manual polymorphism validation, we extracted genotypes for each DNA sample at the confirmed polymorphic sites for analysis. An average of 90% of genotypes were called in each individual using a minimum Phred score of 20.
Figure 1. Average Phred score by genomic location in SFTPB.
Average Phred score calculated and averaged at each site on finished SFTPB sequence. Sequence quality in intron 4 was low due to the inability of BigDye sequencing chemistry to resolve multiple CA repeats.
False positive and negative rates of SNP discovery
Because of the high proportion of sequence variation attributable to rare, polymorphic sites, we were concerned that SNP detection errors might bias our analysis. Systematic comparison of the results from 2 independent analysts identified 0.99% of calls as discrepant (452/45,505 genotypes): 67% of these were judged as false positive calls (301/452) in low quality (Phred score <20) data, and all discrepant calls were classified as missing data. Using an independent genotyping method, Taqman (9), we compared genotypes at 5 high frequency, polymorphic sites in 558 individuals to the genotypes called from sequence data and found 27 discrepant calls in 2,790 genotypes, with 10 confirmed Taqman heterozygotes, for a false negative heterozygote detection rate of 0.36%. Next, we reamplified and resequenced all heterozygous sites identified in <3 individuals (41 genotypes in 49 individuals) with different primer sets and confirmed genotypes at all of these sites. Finally, we examined base calls and sequence quality (Phred score) at 42 sites polymorphic in other cohorts but not in this cohort (45,780 genotypes). Of the 41,555 genotypes with high quality (Phred score >20) sequence, we found no rare alleles missed by chromatogram analysis (0%). We could not call the remaining 5,317 genotypes (11.6%) due to low quality chromatograms in those specific samples. These results suggest false positive and negative rates of less than 1%.
Linkage disequilibrium, haplotype estimation, recombination rate, and hot spot location determination
Linkage disequilibrium (LD) is a measure of the allelic correlation between two SNPs. Several LD statistics are available (10); D′ is the ratio of the observed LD to the strongest possible LD given the allele frequencies of the SNPs. |D′|=1 when there is no detectable recombination between SNPs. Haplotypes are patterns of alleles across multiple SNPs along a single chromosome. We used PHASE (v. 2.1) to infer haplotypes computationally from genotypes within each racial group (11, 12). To assess whether haplotypes of common variants (minor allele frequency (MAF) >5%) can predict genotype at low frequency SFTPB alleles, we used HAPLOVIEW (v. 3.31) (http://www.broad.mit.edu/mpg/haploview/) in aggressive mode to select a minimal set of tagSNPs such that all other SNPs were strongly correlated (r2 ≥ 0.8) with either a tagSNP or a haplotype of several tagSNPs (13). We used PHASE to estimate background recombination rate, determine hot spot location, and compute Bayes factors (BFs) as previously described (14) for either intragenic SNPs with MAF >5% or for HapMap SNPs (MAF >5%) within 50 kb of SFTPB (data release #21 as of July, 2006)(http://www.hapmap.org). BFs are likelihood ratios of the probability of the observed data assuming a recombination hotspot divided by the probability of the data assuming uniform recombination across the region. A BF of 10 suggests that the haplotype data at a genomic location are 10 times more likely to be consistent with the presence of hot spot than the absence of a hot spot, and a BF of >10 is substantive evidence for the presence of a recombination hot spot.
Molecular evolution
Discovery of genomic regions under selective pressure may help inform genetic association studies, because evolutionarily constrained sequences are presumably functional. We used 3 statistical strategies to screen SFTPB for selective pressure. To assess whether genetic variation in regions of SFTPB was consistent with neutral evolution, we used two statistical tests of observed sequence diversity against theoretical predictions for neutral sequence, Tajima's D (15) and Fu and Li's D* (16). Tajima's D, compares 2 descriptive statistics (theta and pi) for sequence diversity: theta (θ) is based on based on the number of chromosomes screened and the number of polymorphisms observed in SFTPB (17), while pi (π) is based upon the number of chromosomes screened and the average allele frequency of the polymorphisms identified (18, 19). We used SLIDER (http://genapps.uchicago.edu/slider/index.html) to calculate Tajima's D. Fu and Li's D* compares π against a third sequence diversity statistic derived from the number of singleton polymorphisms observed (SNPs with the rare allele observed only once in the data) (19).
We also characterized selection pressure by using the ratio of non-synonymous to synonymous substitution rates (dN/dS) calculated from the observed SNPs using SNAP (Synonymous/Non-synonymous Analysis Program) (http://www.hiv.lanl.gov/content/hiv-db/SNAP/WEBSNAP/SNAP.html) (20, 21). A dN/dS ratio >1 suggests more non-synonymous substitutions than expected under the neutral model and is evidence for positive selection, whereas a dN/dS ratio <1 is evidence for purifying selection against some amino acid replacement mutations.
The third statistic we used was the MacDonald-Kreitman test (22) which compares the within-species dN/dS ratio for polymorphism in our sample against the between-species ratio for fixed differences (23) (http://www.ebi.ac.uk/clustalw/).
Statistical methods and Human Studies Committee approval
We analyzed all data using Statistical Analysis System (v. 9.3.1)(SAS, Inc., Cary, N.C.). The Human Research Protection Office at the Washington University Medical Center and the Institutional Review Board at the Missouri DHSS reviewed and approved this study.
RESULTS
Genetic variant discovery
We were unable to screen 380 bp of intron 4 due to a highly polymorphic repeat region. In the remaining sequence, we found 86 polymorphic sites including 81 SNPs and 5 small in/dels (9.8 polymorphic sites per 1,000 basepairs of SFTPB reference sequence), with similar frequencies in the promoter (8 per 1,000 basepairs), introns (10 per 1,000 basepairs), and exons (12 per 1,000 basepairs)(χ2 analysis, P=0.7) (Table 1). The overall SNP density was 9.2/1,000 basepairs. The Phred scores within 10 base pairs of each polymorphic site (37 ± 6)(mean ± S.D.) were excellent, suggesting that sequence quality did not limit genetic variant discovery (Figure 1). The average number of polymorphic sites per individual was greater in African-Americans than other races (all P<.01) (Table 1). The race-specific, relative genotype frequencies at each polymorphic site did not differ significantly from Hardy-Weinberg prediction (all P>.05). The majority of variant sites in SFTPB is low frequency: 67 of 86 sites had MAF <5%. Potentially disruptive variants were also rare: 8 of 9 nonsynonomous variants and 6 of 7 intronic SNPs within 20 base pairs of an intron-exon junction were rare. To determine whether nonsynonymous SNPs might disrupt surfactant protein B function, we used 2 homology-based software tools, SIFT (Sorting Intolerant from Tolerant)(24) and PolyPhen (25). We found that 8 of 9 sites were not classified as intolerant or damaging. One site (genomic position 2558) in exon 5 that encodes either glycine or glutamic acid (G183E) was classified as probably damaging by Polyphen, but tolerated by SIFT, and is rare (MAF 0.1%). The lack of definitively damaging or intolerant SNPs in this large cohort suggests strong purifying selective pressure against rare variants that encode dysfunctional surfactant protein B, likely due to the critical role of the encoded protein in successful fetal-neonatal pulmonary transition (26). Despite a much larger cohort size evaluated (1,116 vs. 90 individuals from the Polymorphism Resource Discovery panel), these estimates are considerably lower than estimates of damaging exonic variants in 213 environmental genes (27).
Table 1.
SFTPB polymorphic sites by race in the Missouri cohort
| Race | Private Variants | Promoter | Intron | Intron/exon junction | Exon (S/NS) | Total | SNPs/individual |
|---|---|---|---|---|---|---|---|
| African-America (N=197) | 18 | 12 | 38 | 7 | 10 (4/6) | 60 | 6.4±2.9 |
| European-American (N=875) | 24 | 11 | 44 | 5 | 11 (4/7) | 66 | 3.9±2.1 |
| Hispanic (N=34) | 2 | 5 | 16 | 1 | 4 (1/3) | 25 | 4.4±2.4 |
| Asian (N=5) | 0 | 1 | 4 | 0 | 1 (0/1) | 6 | 2.8±0.5 |
| Unknown (N=5) | 0 | 4 | 9 | 0 | 3 (1/2) | 16 | 5.5±3.4 |
| Total Cohort (N=1,116) | 44 | 14 | 59 | 7 | 13 (4/9) | 86 | 4.3±2.4 |
Race: based on birth certificate; N: number of individuals in each race; Private variants: only seen in that race; Promoter: promoter region; Intron: intronic region; Intron/exon junction: within 20 bps of intron/exon junction; Exon (S/NS): Exonic region (synonymous/nonsynonymous); SNPs/individual: average ± SD – significant differences in SNPs/individual include African-American vs. European-American (P<0.001), African-American vs. Hispanic (P<0.001), and African-American vs. Asian (P<0.01); no differences in European-American vs. Hispanic (P=0.2), European-American vs. Asian (P=0.3), or Hispanic vs. Asian (P=0.2) (intron/exon junction variants are also counted in the “Intron” variants column). The low number of variants in the Asian and Unknown populations is attributable to the low number of Asian and Unknown individuals in this cohort.
To determine whether variants at intron-exon junctions might disrupt expression, we used a neural network application (http://www.fruitfly.org/seq_tools/splice-instrucs.html) trained to recognize potential human splice sites on the basis of a large training set of known human splice sites. We found that the only common intron-exon junction SNP (genomic position 4550, rs893159) was predicted to alter RNA splicing by creating a second acceptor site for exon 8. The score for a second acceptor site increased from 0.47 to 0.78 when the minor allele was substituted, while the score for the predicted exon 8 acceptor site is 0.65. This finding suggests that RNA splicing may be altered by this SNP.
To validate experimentally a published mathematical simulation of the number of haploid genomes required to detect SNPs with MAF greater than a given frequency (28), we performed 1,000 race-stratified sampling iterations for SFTPB (Table 2). Our data for SFTPB confirm the theoretical prediction based on the standard neutral model of population genetics, show that a cohort size of ≤ 48 haploid genomes will miss 11% to 18% of SNPs with frequencies of ≥1%, providing direct evidence of the influence of population history on estimates of cohort size necessary to detect rare SNPs.
Table 2.
Detection rate for SNPs with a given minimum allele frequency in SFTPB
| African-American N=197 | ||||||||
| n | 0.1%(60) | 0.5%(41) | 1% (31) | 5% (17) | 10% (12) | 20% (10) | 30% (2) | |
| 2 | 0.086 | 0.123 | 0.159 | 0.257 | 0.307 | 0.328 | 0.411 | |
| 4 | 0.158 | 0.227 | 0.293 | 0.469 | 0.553 | 0.598 | 0.743 | |
| 8 | 0.252 | 0.359 | 0.459 | 0.709 | 0.801 | 0.843 | 0.949 | |
| 16 | 0.343 | 0.484 | 0.611 | 0.884 | 0.949 | 0.972 | 0.999 | |
| 24 | 0.398 | 0.557 | 0.693 | 0.949 | 0.985 | 0.995 | >.999 | |
| 48 | 0.506 | 0.686 | 0.821 | 0.995 | 0.999 | >.999 | >.999 | |
| 96 | 0.637 | 0.819 | 0.93 | >.999 | >.999 | >.999 | >.999 | |
| 192 | 0.798 | 0.943 | 0.991 | >.999 | >.999 | >.999 | >.999 | |
| European-American N=875 | ||||||||
| n | 0.1%(34) | 0.5%(14) | 1% (12) | 5% (10) | 10% (7) | 20% (6) | 30% (5) | |
| 2 | 0.091 | 0.214 | 0.248 | 0.293 | 0.372 | 0.408 | 0.418 | |
| 4 | 0.162 | 0.379 | 0.439 | 0.519 | 0.655 | 0.718 | 0.738 | |
| 8 | 0.234 | 0.541 | 0.621 | 0.728 | 0.879 | 0.939 | 0.949 | |
| 16 | 0.291 | 0.653 | 0.747 | 0.862 | 0.966 | 0.997 | 0.999 | |
| 24 | 0.324 | 0.713 | 0.805 | 0.917 | 0.982 | >.999 | >.999 | |
| 48 | 0.389 | 0.798 | 0.887 | 0.982 | 0.998 | >.999 | >.999 | |
| 96 | 0.479 | 0.877 | 0.945 | 0.999 | >.999 | >.999 | >.999 | |
| 192 | 0.6 | 0.939 | 0.976 | >.999 | >.999 | >.999 | >.999 | |
The number within the parentheses indicates the number of variants with the specified minimum allele frequency; N= number of individuals; n=number of haploid genomes
Linkage disequilibrium
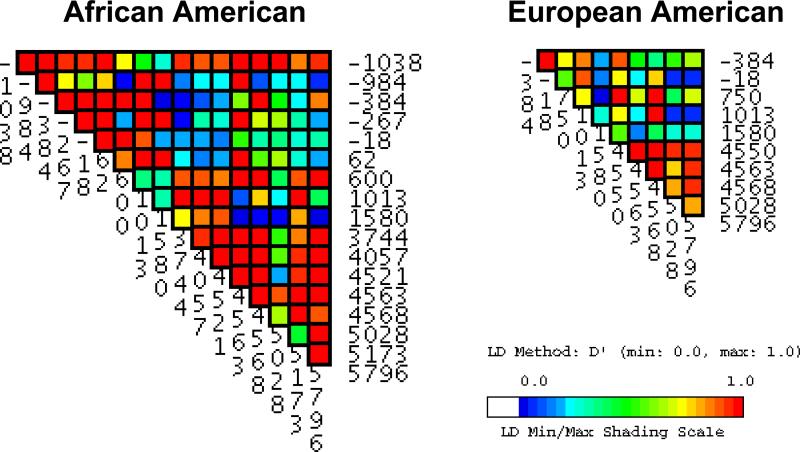
Statistical power of genetic association studies may be increased, and genotyping costs decreased by identifying highly correlated tagSNPs. Linkage disequilibrium (LD) is a statistical measure of allelic correlation between polymorphisms. Using common genotypes (MAF>5%), we detected weak LD across SFTPB despite its small genomic size (Figure 2). In view of the effect of cohort size on LD, we randomly selected European-American cohorts similar in size to the African-American cohort and found similar results (29, 30). Using the tagger function in HAPLOVIEW, we were unable to capture rare variants when using common markers as tagSNPs. Using the Genome Variation Server maintained by Seattle SNPs (http://gvs.gs.washington.edu/GVS), we found weak LD within SFTPB. Weak LD suggests that the genomic region that includes SFTPB spans a recombination hot spot (14).
Figure 2. VG2 plot of LD (D’) within SFTPB using common genotypes (MAF>5%) in African-American and European-American infants.
Weak LD is present in both populations across the entire gene.
Haplotype diversity, estimation of background recombination rate, and recombination hot spot determination
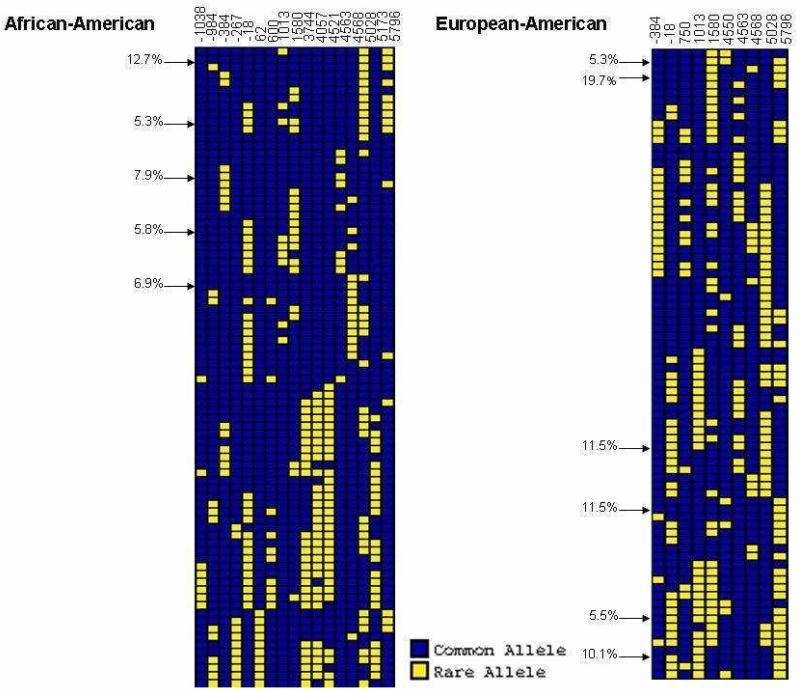
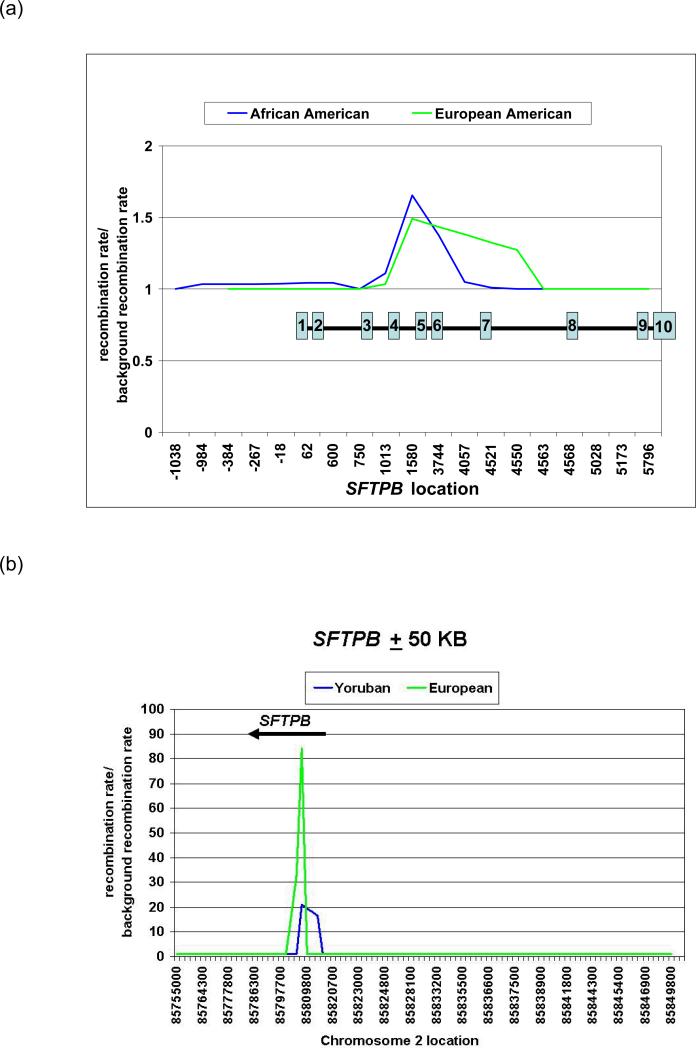
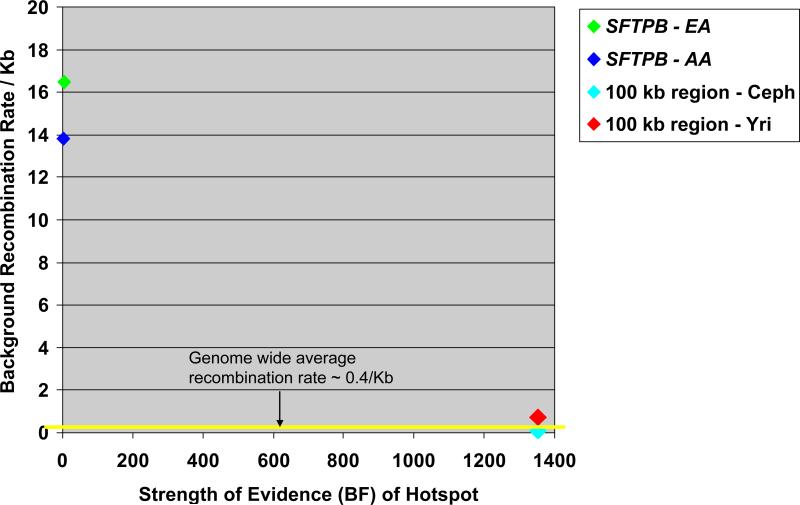
We used PHASE with common genotypes (MAF >5%) to infer haplotypes (Figure 3) and observed high haplotype diversity consistent with intragenic recombination. To determine whether SFTPB includes a recombination hot spot, we estimated recombination parameters into PHASE and calculated Bayes factors (BF), a measurement of the strength of the evidence for a recombination hot spot (14). In the resequencing data alone, the intragenic recombination rate over background (Figure 4a) and BF values (5.9 in European-American, 2.2 in African-American) did not suggest a recombination hot spot. However, when we calculated recombination rate and BFs for a 107 kk window flanking SFTPB in HapMap data, we found a 20 fold to 80 fold increase in recombination rate within SFTPB (Figure 4b), and BF values of 1353 in both populations. As suggested by comparison of BFs with background recombination rates in each of these cohorts (Figure 5), the high intragenic recombination rate was not detected in the resequencing data because the recombination hot spot spans most of the resequenced region.
Figure 3. VH1 plot of common SFTPB haplotypes in African-American and European-American infants.
Using 17 SNPs (African-American) and 10 SNPs (European-American), we estimated computationally 82 unique African-American haplotypes and 80 unique European-American haplotypes. Most haplotypes (59/82 African-American haplotypes and 59/80 European-American haplotypes) were rare (<1%). Arrows indicate haplotypes with frequencies >5%, and individual haplotype frequencies for common haplotypes are provided.
Figure 4. Changes in recombination rate vs. background recombination rate in the Missouri cohort within SFTPB (a) and in the HapMap Project Yoruban and European cohorts (http://www.hapmap.org) near (± 50 kb) SFTPB (b).
(a) Within SFTPB, little change in recombination rate is detectable; positions of translated exons shown in numbered blue boxes
(b) Near SFTPB, a 20 fold to 80 fold increase in recombination rate is present within SFTPB.
Figure 5. Strength of evidence of a recombination hot spot within SFTPB using the Missouri cohort (SFTPB genomic region) and the HapMap cohort.
(http://www.hapmap.org/) (100 kb region that includes SFTPB) EA – European American (Missouri cohort); AA – African-American (Missouri cohort); Yri – Yoruban population (HapMap Project); Ceph – European descent population (HapMap Project, data release #21 as of July, 2006)
Molecular evolution
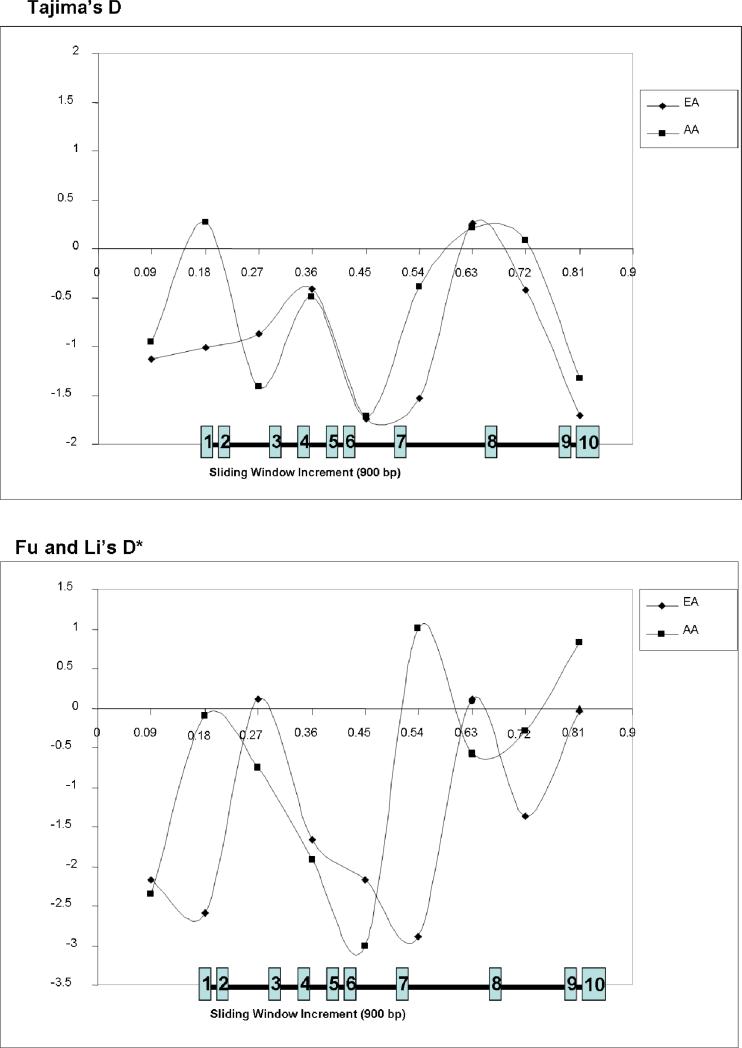
To test whether SFTPB variation is consistent with predictions from the neutral theory of molecular evolution, we used Tajima's D and Fu and Li's D* (Table 3). Both measures were consistently negative for both African-Americans and European-Americans, suggesting an excess of low frequency variation in SFTPB, although this trend was not significant. Using a sliding window approach (Figure 6) (19), we found that the genomic region that encodes mature surfactant protein B (exons 6 and 7) had the most negative values, consistent with negative selection against variation in these exons.
Table 3.
Nucleotide diversity and neutrality tests in European-Americans and African-Americans for coding and non-coding regions and for synonymous and non-synonymous SNPs
| Race | SNP | π(×10−4) | θ(×10−4) | Tajima's D | P | Fu & Li D* | P |
|---|---|---|---|---|---|---|---|
| EA | C | 0.9 | 1.4 | −0.66 | 0.51 | −3.68 | 0.0002 |
| NC | 3.7 | 5.3 | −0.75 | 0.45 | −3.63 | 0.0003 | |
| S | 0.01 | 0.2 | −0.79 | 0.43 | 0.40 | 0.689 | |
| NS | 1.2 | 1.3 | −0.13 | 0.90 | −3.50 | 0.0005 | |
| T | 4.1 | 6.6 | −1.0 | 0.32 | −5.99 | <0.001 | |
| AA | C | 1.7 | 2.7 | −0.83 | 0.41 | −1.87 | 0.062 |
| NC | 5.9 | 8.9 | −0.95 | 0.34 | −1.56 | 0.120 | |
| S | 0.9 | 1.0 | −0.19 | 0.85 | −0.54 | 0.587 | |
| NS | 1.2 | 2.5 | −1.03 | 0.30 | −1.99 | 0.047 | |
| T | 7.2 | 11.0 | −0.99 | 0.32 | −2.02 | 0.044 |
C=coding; NC=non-coding; S=synonymous; NS-non-synonymous; T=total; all P values estimated assuming standard normal distribution; EA=European-American; AA=African-American; Theta (θ) is a descriptive statistic for sequence diversity based on the number of chromosomes screened and the number of polymorphisms observed. Pi (π) is a descriptive statistic for sequence diversity based upon the number of chromosomes screened and the average allele frequency of the polymorphisms identified. Tajima's D is a test statistic that compares the difference between θ and π against theoretical expectations under an evolutionary model. Fu and Li's D* compares the difference between theta and the number of singleton SNPs observed against theoretical expectations under neutrality.
Figure 6. Comparison of Tajima's D and Fu and Li's D* across SFTPB for the Missouri cohort using a 900 bp sliding window.
EA – European-American infants; AA – African-American infants; positions of translated exons shown in numbered blue boxes
To evaluate conservation across species, we compared dN/dS in this cohort with SFTPB in Mus musculus (GenBank number: NM147779). The overall dN/dS ratio for this cohort was 2.0 (8 non-synonymous and 4 synonymous sites). In a human-mouse comparison, SNAP determined the dN/dS ratio to be 0.94 (2 non-synonymous and 2.12 synonymous) across these two species, consistent with neutral evolution over time. The MacDonald-Kreitman test was also consistent with neutral evolution (χ2 = 0.43, P-value = 0.51). These results suggest that although much of the variation in SFTPB is selectively neutral, the excess of low frequency variation near the exons containing mature SFTPB may be attributable to the presence of a modest number of mildly deleterious polymorphisms subject to negative selective pressure.
DISCUSSION
Because neonatal respiratory distress syndrome is unambiguously associated with rare, recessive SFTPB mutations and is observed when SFTPB expression is reduced by >75% (2-5), SFTPB is a candidate gene for neonatal respiratory distress syndrome. Previous studies using unrelated, case-control designs or family-based association tests with genotypes at high frequency polymorphic sites have suggested association between genotypes or haplotypes and neonatal respiratory distress (31-33). To inform studies of genetic regulation of SFTPB, we adapted production level, PCR-based sequencing technology for comprehensive genetic variant discovery (7). We found high SNP density (28, 34), weak LD, and, using data from the HapMap Project, strong evidence for a recombination hot spot within SFTPB. The coincidence of high SNP density, excess low frequency sites, and high recombination rate has been observed at other loci in Drosophila and humans (35-37), consistent with an elevated mutation rate within recombination hotspots. These characteristics suggest that use of common SFTPB haplotypes or tagSNPs will not capture statistically robust associations with disease causing alleles in unrelated, genetically diverse, case-control cohorts (38). Genetic bottlenecks in small populations will increase LD, but typically do so only for rare subsets of SNPs. LD between the higher frequency SNPs will not be substantially altered by bottlenecks in founder populations. Thus, at SFTPB, comprehensive resequencing in large case-control cohorts is advantageous for genetic association studies of neonatal respiratory distress syndrome, because the elevated mutation rate enhances the frequency of rare, deleterious mutations, while the high recombination rate makes LD between common SNPs too low for useful tagSNP selection.
In view of the lack of common, damaging exonic SNPs observed in SFTPB, association studies of neonatal respiratory distress syndrome will need to focus on regulatory variation. For example, our data using a neural network application trained to recognize potential human splice sites suggest that the intron-exon junction SNP at genomic position 4550 (rs893159) may alter RNA splicing, resulting in misprocessed or misdirected surfactant protein B, and disrupting surfactant function. Our results also suggest the value of mechanistic studies in the genetic pathogenesis of SFTPB mutations. A second SNP in intron 2 (SNP 1013, rs3024798) may affect recombination rates within SFTPB, because it disrupts a motif in intron 2 (CCTCCCT > CCTCCAT) that has been associated with recombination hotspot activity (39). Recombination rates correlate positively with mutation rates, so high recombination rate alleles may be more prone to the de novo SFTPB mutations seen in severe neonatal respiratory distress syndrome.
ACKNOWLEDGEMENTS
The authors thank members of the Seattle SNPs team (D. A. Nickerson, D. C. Crawford, M. J. Rieder, J. Sloan, and M. Eberle), R. H. Waterston, and H. R. Colten for helpful suggestions, and members of the Missouri DHSS (J. Eckstein, G. Land, M. Mosley, and J. Stockbauer) for collaboration.
Statement of financial support:
This work was supported by grants from the National Heart, Lung, and Blood Institute (RO1 HL 065174 to F.S.C., RO1 HL 065385 to A.H.), from the National Human Genome Research Institute (U54 HG 003079 to RKW), from the Children's Discovery Institute of St. Louis Children's Hospital (FSC and AH), and from the Saigh Foundation (FSC and AH).
ABBREVIATIONS
- SFTPB
surfactant protein B gene
- SFTPC
surfactant protein C gene
- SNP
single nucleotide polymorphism
- MAF
minor allele frequency
- LD
linkage disequilibrium
- in/del
insertion/deletion
Footnotes
Prior presentation of data:
These data have been presented in abstract form at the Pediatric Academic Societies Meeting (2005, 2006), at the NHLBI Program For Genomic Applications Meeting (2005), and at the Pulmonary Surfactant Meeting of the Federation of American Society of Experimental Biology (2006).
REFERENCES
- 1.Whitsett JA, Weaver TE. Hydrophobic surfactant proteins in lung function and disease. N Engl J Med. 2002;347:2141–2148. doi: 10.1056/NEJMra022387. [DOI] [PubMed] [Google Scholar]
- 2.Nogee LM, Garnier G, Dietz HC, Singer L, Murphy AM, deMello DE, Colten HR. A mutation in the surfactant protein B gene responsible for fatal neonatal respiratory disease in multiple kindreds. J Clin Invest. 1994;93:1860–1863. doi: 10.1172/JCI117173. [DOI] [PMC free article] [PubMed] [Google Scholar]
- 3.Cole FS, Hamvas A, Rubinstein P, King E, Trusgnich M, Nogee LM, deMello DE, Colten HR. Population-based estimates of surfactant protein B deficiency. Pediatrics. 2000;105:538–541. doi: 10.1542/peds.105.3.538. [DOI] [PubMed] [Google Scholar]
- 4.Melton KR, Nesslein LL, Ikegami M, Tichelaar JW, Clark JC, Whitsett JA, Weaver TE. SP-B deficiency causes respiratory failure in adult mice. Am J Physiol Lung Cell Mol Physiol. 2003;285:L543–549. doi: 10.1152/ajplung.00011.2003. [DOI] [PubMed] [Google Scholar]
- 5.Merrill JD, Ballard RA, Cnaan A, Hibbs AM, Godinez RI, Godinez MH, Truog WE, Ballard PL. Dysfunction of pulmonary surfactant in chronically ventilated premature infants. Pediatr Res. 2004;56:918–926. doi: 10.1203/01.PDR.0000145565.45490.D9. [DOI] [PubMed] [Google Scholar]
- 6.Hamvas A, Trusgnich MA, Brice H, Baumgartner J, Hong Y, Nogee LM, Cole FS. Population-based screening for rare mutations: high-throughput DNA extraction and molecular amplification from Guthrie cards. Pediatr Res. 2001;50:666–668. doi: 10.1203/00006450-200111000-00021. [DOI] [PubMed] [Google Scholar]
- 7.Wilson R, Ley TJ, Cole FS, Milbrandt JD, Clifton S, Fulton L, Fewell G, Minx P, Sun H, McLellan M, Pohl C, Mardis ER. Mutational profiling in the human genome. Cold Spring Harb Symp Quant Biol. 2003;68:23–29. doi: 10.1101/sqb.2003.68.23. [DOI] [PubMed] [Google Scholar]
- 8.Hamvas A, Wegner DJ, Trusgnich MA, Madden K, Heins H, Liu Y, Rice T, An P, Watkins-Torry J, Cole FS. Genetic variant characterization in intron 4 of the surfactant protein B gene. Hum Mutat. 2005;26:494–495. doi: 10.1002/humu.9378. [DOI] [PubMed] [Google Scholar]
- 9.Holland PM, Abramson RD, Watson R, Gelfand DH. Detection of specific polymerase chain reaction product by utilizing the 5′----3′ exonuclease activity of Thermus aquaticus DNA polymerase. Proc Natl Acad Sci U S A. 1991;88:7276–7280. doi: 10.1073/pnas.88.16.7276. [DOI] [PMC free article] [PubMed] [Google Scholar]
- 10.Devlin B, Risch N. A comparison of linkage disequilibrium measures for fine-scale mapping. Genomics. 1995;29:311–322. doi: 10.1006/geno.1995.9003. [DOI] [PubMed] [Google Scholar]
- 11.Stephens M, Smith NJ, Donnelly P. A new statistical method for haplotype reconstruction from population data. Am J Hum Genet. 2001;68:978–989. doi: 10.1086/319501. [DOI] [PMC free article] [PubMed] [Google Scholar]
- 12.Stephens M, Donnelly P. A comparison of bayesian methods for haplotype reconstruction from population genotype data. Am J Hum Genet. 2003;73:1162–1169. doi: 10.1086/379378. [DOI] [PMC free article] [PubMed] [Google Scholar]
- 13.Barrett JC, Fry B, Maller J, Daly MJ. Haploview: analysis and visualization of LD and haplotype maps. Bioinformatics. 2005;21:263–265. doi: 10.1093/bioinformatics/bth457. [DOI] [PubMed] [Google Scholar]
- 14.Crawford DC, Bhangale T, Li N, Hellenthal G, Rieder MJ, Nickerson DA, Stephens M. Evidence for substantial fine-scale variation in recombination rates across the human genome. Nat Genet. 2004;36:700–706. doi: 10.1038/ng1376. [DOI] [PubMed] [Google Scholar]
- 15.Tajima F. Statistical method for testing the neutral mutation hypothesis by DNA polymorphism. Genetics. 1989;123:585–595. doi: 10.1093/genetics/123.3.585. [DOI] [PMC free article] [PubMed] [Google Scholar]
- 16.Fu YX, Li WH. Statistical tests of neutrality of mutations. Genetics. 1993;133:693–709. doi: 10.1093/genetics/133.3.693. [DOI] [PMC free article] [PubMed] [Google Scholar]
- 17.Nei M, Li WH. Mathematical model for studying genetic variation in terms of restriction endonucleases. Proc Natl Acad Sci U S A. 1979;76:5269–5273. doi: 10.1073/pnas.76.10.5269. [DOI] [PMC free article] [PubMed] [Google Scholar]
- 18.Watterson GA. On the number of segregating sites in genetical models without recombination. Theor Popul Biol. 1975;7:256–276. doi: 10.1016/0040-5809(75)90020-9. [DOI] [PubMed] [Google Scholar]
- 19.Carlson CS, Thomas DJ, Eberle MA, Swanson JE, Livingston RJ, Rieder MJ, Nickerson DA. Genomic regions exhibiting positive selection identified from dense genotype data. Genome Res. 2005;15:1553–1565. doi: 10.1101/gr.4326505. [DOI] [PMC free article] [PubMed] [Google Scholar]
- 20.Nei M, Gojobori T. Simple methods for estimating the numbers of synonymous and nonsynonymous nucleotide substitutions. Mol Biol Evol. 1986;3:418–426. doi: 10.1093/oxfordjournals.molbev.a040410. [DOI] [PubMed] [Google Scholar]
- 21.Ota T, Nei M. Variance and covariances of the numbers of synonymous and nonsynonymous substitutions per site. Mol Biol Evol. 1994;11:613–619. doi: 10.1093/oxfordjournals.molbev.a040140. [DOI] [PubMed] [Google Scholar]
- 22.McDonald JH, Kreitman M. Adaptive protein evolution at the Adh locus in Drosophila. Nature. 1991;351:652–654. doi: 10.1038/351652a0. [DOI] [PubMed] [Google Scholar]
- 23.Tatusova TA, Madden TL. BLAST 2 Sequences, a new tool for comparing protein and nucleotide sequences. FEMS Microbiol Lett. 1999;174:247–250. doi: 10.1111/j.1574-6968.1999.tb13575.x. [DOI] [PubMed] [Google Scholar]
- 24.Ng PC, Henikoff S. SIFT: Predicting amino acid changes that affect protein function. Nucleic Acids Res. 2003;31:3812–3814. doi: 10.1093/nar/gkg509. [DOI] [PMC free article] [PubMed] [Google Scholar]
- 25.Ramensky V, Bork P, Sunyaev S. Human non-synonymous SNPs: server and survey. Nucleic Acids Res. 2002;30:3894–3900. doi: 10.1093/nar/gkf493. [DOI] [PMC free article] [PubMed] [Google Scholar]
- 26.Nogee LM. Alterations in SP-B and SP-C expression in neonatal lung disease. Annu Rev Physiol. 2004;66:601–623. doi: 10.1146/annurev.physiol.66.032102.134711. [DOI] [PubMed] [Google Scholar]
- 27.Livingston RJ, von Niederhausern A, Jegga AG, Crawford DC, Carlson CS, Rieder MJ, Gowrisankar S, Aronow BJ, Weiss RB, Nickerson DA. Pattern of sequence variation across 213 environmental response genes. Genome Res. 2004;14:1821–1831. doi: 10.1101/gr.2730004. [DOI] [PMC free article] [PubMed] [Google Scholar]
- 28.Kruglyak L, Nickerson DA. Variation is the spice of life. Nat Genet. 2001;27:234–236. doi: 10.1038/85776. [DOI] [PubMed] [Google Scholar]
- 29.Weiss KM, Clark AG. Linkage disequilibrium and the mapping of complex human traits. Trends Genet. 2002;18:19–24. doi: 10.1016/s0168-9525(01)02550-1. [DOI] [PubMed] [Google Scholar]
- 30.Palmer LJ, Cardon LR. Shaking the tree: mapping complex disease genes with linkage disequilibrium. Lancet. 2005;366:1223–1234. doi: 10.1016/S0140-6736(05)67485-5. [DOI] [PubMed] [Google Scholar]
- 31.Floros J, Fan R, Diangelo S, Guo X, Wert J, Luo J. Surfactant protein (SP) B associations and interactions with SP-A in white and black subjects with respiratory distress syndrome. Pediatr Int. 2001;43:567–576. doi: 10.1046/j.1442-200x.2001.01474.x. [DOI] [PMC free article] [PubMed] [Google Scholar]
- 32.Haataja R, Hallman M. Surfactant proteins as genetic determinants of multifactorial pulmonary diseases. Ann Med. 2002;34:324–333. doi: 10.1080/078538902320772089. [DOI] [PubMed] [Google Scholar]
- 33.Floros J, Thomas NJ, Liu W, Papagaroufalis C, Xanthou M, Pereira S, Fan R, Guo X, Diangelo S, Pavlovic J. Family-based association tests suggest linkage between surfactant protein B (SP-B) (and flanking region) and respiratory distress syndrome (RDS): SP-B haplotypes and alleles from SP-B-linked loci are risk factors for RDS. Pediatr Res. 2006;59:616–621. doi: 10.1203/01.pdr.0000203145.48585.2c. [DOI] [PubMed] [Google Scholar]
- 34.Zhao Z, Fu YX, Hewett-Emmett D, Boerwinkle E. Investigating single nucleotide polymorphism (SNP) density in the human genome and its implications for molecular evolution. Gene. 2003;312:207–213. doi: 10.1016/s0378-1119(03)00670-x. [DOI] [PubMed] [Google Scholar]
- 35.Begun DJ, Aquadro CF. Levels of naturally occurring DNA polymorphism correlate with recombination rates in D. melanogaster. Nature. 1992;356:519–520. doi: 10.1038/356519a0. [DOI] [PubMed] [Google Scholar]
- 36.Aquadro CF, Bauer DuMont V, Reed FA. Genome-wide variation in the human and fruitfly: a comparison. Curr Opin Genet Dev. 2001;11:627–634. doi: 10.1016/s0959-437x(00)00245-8. [DOI] [PubMed] [Google Scholar]
- 37.Lercher MJ, Hurst LD. Human SNP variability and mutation rate are higher in regions of high recombination. Trends Genet. 2002;18:337–340. doi: 10.1016/s0168-9525(02)02669-0. [DOI] [PubMed] [Google Scholar]
- 38.Carlson CS, Eberle MA, Rieder MJ, Smith JD, Kruglyak L, Nickerson DA. Additional SNPs and linkage-disequilibrium analyses are necessary for whole-genome association studies in humans. Nat Genet. 2003;33:518–521. doi: 10.1038/ng1128. [DOI] [PubMed] [Google Scholar]
- 39.Myers S, Bottolo L, Freeman C, McVean G, Donnelly P. A fine-scale map of recombination rates and hotspots across the human genome. Science. 2005;310:321–324. doi: 10.1126/science.1117196. [DOI] [PubMed] [Google Scholar]


