

Abstract
Codon usage bias is the nonrandom use of synonymous codons for the same amino acid. Most population genetic models of codon usage evolution assume that the population is at mutation–selection–drift equilibrium. Natural populations, however, frequently deviate from equilibrium, often because of recent demographic changes. Here, we construct a matrix model that includes the effects of a recent change in population size on estimates of selection on preferred vs. unpreferred codons. Our results suggest that patterns of synonymous polymorphisms affecting codon usage can be quite erratic after such a change; statistical methods that fail to take demographic effects into account can then give incorrect estimates of important parameters. We propose a new method that can accurately estimate both demographic and codon usage parameters. The method also provides a simple way of testing for the effects of covariates such as gene length and level of gene expression on the intensity of selection, which we apply to a large Drosophila melanogaster polymorphism data set. Our analyses of twofold degenerate codons reveal that (i) selection acts in favor of preferred codons, (ii) there is mutational bias in favor of unpreferred codons, (iii) shorter genes and genes with higher expression levels are under stronger selection, and (iv) there is little evidence for a recent change in population size in the Zimbabwe population of D. melanogaster.
CODONS specifying the same amino acid are called synonymous codons. These are often used nonrandomly, with some codons appearing more frequently than others. This biased usage of synonymous codons has been found in many organisms such as Drosophila, yeast, and bacteria (Ikemura 1985; Duret and Mouchiroud 1999; Hershberg and Petrov 2008). Conventionally, synonymous codons for a given amino acid are divided into two classes: preferred and unpreferred codons (Ikemura 1985; Akashi 1994; Duret and Mouchiroud 1999). Several observations indicate that codon usage is affected by natural selection. First, in species with codon usage bias, preferred codons generally correspond to the most abundant tRNA species (Ikemura 1981). Second, highly expressed genes usually have higher codon usage bias than genes with low expression (Sharp and Li 1986; Duret and Mouchiroud 1999; Hey and Kliman 2002). Third, the synonymous substitution rate of a gene has been shown to be negatively correlated with its degree of codon usage bias (Sharp and Li 1986; Bierne and Eyre-Walker 2006). The most commonly cited explanations of the apparent fitness differences between preferred and unpreferred codons are selection for translation efficiency, translational accuracy, and mRNA stability (Ikemura 1985; Eyre-Walker and Bulmer 1993; Akashi 1994; Drummond et al. 2005). Recently, it has been proposed that exon splicing also affects codon usage bias (Warnecke and Hurst 2007).
From a population genetics perspective, the extent of codon usage bias is ultimately a product of the joint effects of mutation, selection, genetic drift, recombination, and demographic history. The Li–Bulmer model of drift, selection, and reversible mutation between preferred and unpreferred codons at a site is the most widely used model (Li 1987; Bulmer 1991; McVean and Charlesworth 1999). Applications of this model generally assume that the population is at mutation–selection–drift equilibrium. However, empirical studies have suggested that changes in the strengths of various driving forces may not be unusual. For example, in Drosophila melanogaster, there is evidence that the population size (Li and Stephan 2006; Thornton and Andolfatto 2006; Keightley and Eyre-Walker 2007; Stephan and Li 2007), recombinational landscape (Takano-Shimizu 1999), and mutational process (Takano-Shimizu 2001; Kern and Begun 2005) may have changed significantly over the species' evolutionary history.
Such changes cause departures from equilibrium. Theoretical models show that it takes a very long time, proportional to the reciprocal of the mutation rate, for the population to approach a new equilibrium state (Tachida 2000; Comeron and Kreitman 2002). Before reaching equilibrium, the population often shows counterintuitive patterns of evolution (Eyre-Walker 1997; Takano-Shimizu 1999, 2001; Comeron and Kreitman 2002; Comeron and Guthrie 2005; Charlesworth and Eyre-Walker 2007). Despite these theoretical results, details of the patterns of polymorphism and substitution rates following a recent change in population size, and their effects on estimates of strength of selection, have not been determined.
The above findings point to the importance of incorporating nonequilibrium factors into the study of codon usage bias. To this end, we extend the Li–Bulmer model to allow population size to vary over time, by representing the evolutionary process by a transition matrix. By analyzing this matrix model, we show that a recent change in population size can result in erratic patterns of codon usage and that methods failing to take into account these demographic effects can give false estimates of the intensity of selection.
To solve these problems, we propose a new method, which does not require polarizing ancestral vs. derived states using outgroup data (cf. Cutter and Charlesworth 2006), but requires only knowledge of preferred vs. unpreferred states defined by patterns of codon usage. We use information on both polymorphic and fixed sites, which enables both mutational bias and the strength of selection to be estimated, in contrast to previous methods that use information on polymorphisms alone. Simulations indicate that this method can accurately estimate both demographic and codon usage parameters and can distinguish between selection and demography. We use the new method to analyze a large D. melanogaster polymorphism data set (Shapiro et al. 2007) and find evidence for natural selection on synonymous codons. We use our approach to show that genes with shorter coding sequences and higher levels of expression are under significantly stronger selection than longer genes with lower expression.
MATERIALS AND METHODS
Description of the model:
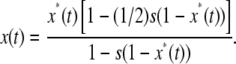
We consider a diploid Wright–Fisher population (Ewens 2004, p. 21), whose size in generation t is Nt. At an autosomal nucleotide site, two variants, A and a, can occur. Mutation is reversible: the per generation mutation rate from a to A is u, and the rate in the opposite direction is κu. The fitnesses of the three possible genotypes, AA, Aa, and aa are 1, 1 −  s, and 1 − s, respectively (the genic selection model). Denote the number of occurrences of allele A in generation t by X(t). If X(t) = i, and assuming that mutation precedes selection, the frequency of A after mutation is
 |
(1) |
After selection, this becomes
 |
(2) |
The transition probability for X(t) is thus
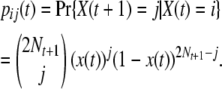 |
(3) |
In Equations 1–3, we have 0 ≤ i ≤ 2Nt and 0 ≤ j ≤ 2Nt+1.
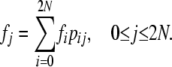
Let fj(t) = Pr(X(t) = j) be the probability that A is represented j times in the population at time t. This satisfies the relation
 |
(4) |
Standard Markov chain theory (Karlin and Taylor 1975) implies the recursion relationship
 |
(5) |
In an equilibrium population with constant size N, Equation 5 can be written as
 |
(6) |
Equation 6 is a system of linear equations subject to the requirement given in Equation 4.
Following the method used to calculate the frequency spectrum of polymorphic sites under the infinite-sites model (e.g., Equation 16 in McVean and Charlesworth 1999), we can decompose fj(t) into two subprocesses:
 |
(7) |
Here, fA,j(t) is the probability that the mutant allele A is currently represented j times in the population, having originated at a site fixed for a. We call these mutations “a → A polymorphic mutations.” The second subprocess involves mutations originating at sites fixed for A, such that the mutant allele a is currently represented 2Nt − j times in the population (i.e., A is represented j times); these are A → a polymorphic mutations. For the first subprocess, we have the following recursion formula
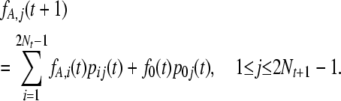 |
(8) |
The first term on the right describes the dynamics of sites that are polymorphic in the tth generation, and the second term describes new a → A polymorphic mutations. This formula is analogous to Equation 3 of Evans et al. (2007), which was derived under the infinite-sites model. A similar formula holds for the second subprocess. Equations 7 and 8 provide an alternative way of calculating the frequency spectrum of polymorphic sites, on the infinite-sites assumption that all new mutations arise at sites that are fixed for either A or a; but in fact they apply more generally. Some examples are given in supporting information, Figure S1. While the application of our model to data analysis does not depend critically on the infinite-sites assumption, this is likely to be a good approximation in practice and is valid for the simulations described in the first part of the results section.
From the two subprocesses, the proportion of polymorphic sites originating from sites previously fixed for a, Pa, is given by
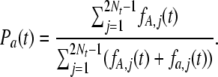 |
(9) |
The proportion of polymorphic sites that originated from sites previously fixed for A, PA, can be calculated similarly. Furthermore, we can calculate the rate at which a site currently fixed for a is replaced by a site fixed for A, denoted by raA(t):
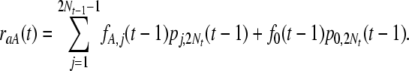 |
(10) |
Similarly, we can calculate the rate, rAa(t), at which a site currently fixed for A is replaced by a site fixed for a. Thus, the total substitution rate is
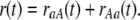 |
(11) |
In an equilibrium population, Equations 7–11 are independent of t.
Statistical methods:
In this section, we use the theory developed above to construct two new methods that are based on the frequencies of preferred vs. unpreferred variants at nucleotide sites and do not require the use of an outgroup to infer ancestral vs. derived states, extending the similar approach of Cutter and Charlesworth (2006). Let di be the number of sites at which allele A is represented i times in a sample of n alleles from a population. The frequency distribution for the sample, d, is a vector of all the di's (0 ≤ i ≤ n); this includes cases where the sample is fixed for either A or a.
We start with the simple case where the population is at equilibrium, denoted as L0. The population dynamics are determined by the parameters N, u, κ, and s. However, if all evolutionary forces are weak so that the diffusion approximation holds, the state of a sample from the population is described by the compound parameters θ = 4Nu and γ = 2Ns (Ewens 2004, Chap. 5). The distribution of the numbers of copies of A per site in the population can be calculated by solving Equation 6 numerically (see below). We write this distribution as f, which is a vector with 2N + 1 elements. The log-likelihood for the sample, d, is the
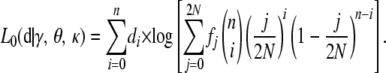 |
(12) |
In Equation 12, we have adopted the “conventional” assumption that sites behave independently of each other (Akashi and Schaeffer 1997; Eyre-Walker 1997; McVean and Vieira 1999; McVean and Charlesworth 2000; Maside et al. 2004; Cutter and Charlesworth 2006; Galtier et al. 2006). Although this assumption is unrealistic, it is mathematically tractable and seems to work fairly well in practice with relatively free recombination (e.g., with a local recombination rate >2 cM/Mb, K. Zeng, unpublished results; see also Williamson et al. 2005 and Boyko et al. 2008).
To model the effects of a change in population size, we assume that the population is originally at equilibrium with population size Nb. Its population size then changes instantly to Na and stays constant for t generations, at which point a sample is taken from the population. Hence, the model, denoted as L1, has five parameters: γb (= 2Nbs), θb (= 4Nbu), κ, g (= Na/Nb), and τ (= t/Na). The demographic model underlying L1, although somewhat unrealistic, is mathematically tractable and has been widely used (Williamson et al. 2005; Li and Stephan 2006; Keightley and Eyre-Walker 2007; Boyko et al. 2008).
Let the distribution of the numbers of A per site in the generation just before the change in population size be fb. Then the distribution in the tth generation after the change, fa(t) (a vector with 2Na + 1 elements), can be obtained by iterating Equation 5 with fb as the initial condition. The log-likelihood of the data is now
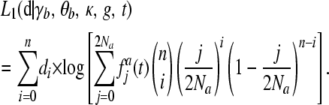 |
(13) |
Note that, when g = 1 and/or τ = ∞, the more complex model, L1(d | γb, θb, κ, g, t), reduces to the simpler model, L0(d | γ, θ, κ). Here, following Williamson et al. (2005), we use a chi-square test with 2 d.f. to distinguish these two models under the assumption that it will yield a conservative test.
Numerical computations:
We used standard numerical methods to solve the linear system given in Equation 6: an LU-decomposition procedure followed by one round of numerical improvement (Press et al. 1992). The adequacy of this numerical method was checked by comparing the results with those obtained by iterating Equation 5 (results not shown). To find the maximum-likelihood estimates (MLEs) of the parameters, we used the simplex algorithm (Press et al. 1992). Multiple start points were used to make sure that the global maximum was found. To save computer time, we used a relatively loose search criterion in the simulations, with a sparse grid of values and a relaxed convergence criterion.
When implementing the model, the size of the transition matrix has to be specified. As mentioned above, population dynamics in the diffusion limit are determined by the compound parameters θ and γ. Hence it is legitimate to “scale down” the population size to give a tractable size of matrix, preserving the θ- and γ-values for the true population size. This rescaling has been widely used in population genetics (McVean and Charlesworth 2000; Tachida 2000; Comeron and Kreitman 2002; Keightley and Eyre-Walker 2007; Kaiser and Charlesworth 2009). In our own experience, rescaling produced reasonable results even when N was set to 10 (see Table S1).
When computing the more complex model given in Equation 13, it was not feasible to use the simplex algorithm to examine the full domain of g [i.e., g  (0, ∞)], so we restricted the search to g
  (0.05, 20).
Simulation methods:
To generate a random sample of size n under the constant population size model (L0), we first solved Equation 6 numerically to obtain f. We then determined the population frequency of A, denoted as x, by sampling from f. Finally we obtained the number of copies of A in a sample of size n by drawing from a binomial distribution with parameters n and x. A similar procedure was used to generate random samples under the more complex model (L1).
Source of data:
We applied these methods to a large D. melanogaster polymorphism data set (Shapiro et al. 2007). The data, which were kindly provided by D. Turissini, contained alignments of 468 autosomal loci. A number of Zimbabwe and cosmopolitan lines were sampled. We used only the Zimbabwe lines in our analysis because of severe bottleneck effects in the other population that was sampled (Glinka et al. 2003; Haddrill et al. 2005; Li and Stephan 2006; Thornton and Andolfatto 2006). Among the Zimbabwe lines, we used only those showing the strongest evidence for reproductive isolation, the “strong Z lines.” This avoids the possibility that the Z lines with reduced reproductive isolation with the cosmopolitan lines might have been formed by secondary contact with the cosmopolitan lines; these gave an excess of intermediate-frequency variants in the frequency spectrum when these “weak” Z lines were included in the analysis (J. Shapiro and C-.I. Wu, personal communication).
To annotate the data, we downloaded version 5.11 of the D. melanogaster genome data from FlyBase (http://flybase.org/). We then used BLAT (version 34, with default parameters; http://genome-test.cse.ucsc.edu/∼kent/exe/linux/) to align the data to the reference genome. We excluded eight loci falling into putatively repetitive regions and one locus falling into a heterochromatic region. For the other loci, we used their genomic locations to obtain estimates of local recombination rate using a well-established method (Singh et al. 2005) (the data were available online from the Petrov laboratory at http://petrov.stanford.edu/cgi-bin/recombination-rates_updateR5.pl). To reduce the effect of linkage, we analyzed only loci locating in highly recombining regions, defined as regions with a local recombination rate strictly >2.3 cM/Mb (Singh et al. 2005). To avoid the complication of alternatively spliced genes (Iida and Akashi 2000), we retained only loci overlapping one annotated well-defined coding region (i.e., starting with a start codon, ending with a stop codon, and possessing no premature stop codon). We further excluded codons where mutations in the first position could change the status of the third codon position (e.g., from fourfold degenerate to twofold degenerate). Insertions and deletions were also removed. For the genes passing all the above filters, we extracted twofold degenerate codons and defined preferred/unpreferred codons as in Duret and Mouchiroud (1999). A summary of the data is given in Table 1.
TABLE 1.
Summary of the D. melanogaster polymorphism data
Total number of loci.
Mean sample size.
Total number of twofold degenerate sites.
Total number of polymorphic twofold degenerate sites.
Mean value of Watterson's estimator of (per site) population mutation rate (Watterson 1975). In the calculation, only twofold degenerate sites were used.
Mean nucleotide diversity. In the calculation, only twofold degenerate sites were used.
Mean Tajima's D statistic (Tajima 1989). In the calculation, only twofold degenerate sites were used.
RESULTS
Effects of a change in population size on patterns of codon usage evolution:
In this section, we assumed that the population size changed instantly from Nb to Na at time zero and stayed constant thereafter. Allele A was the preferred allele, but mutation was biased toward the unpreferred allele, a (i.e., κ > 1). First, we explored the effects of population expansion by assuming that the population size instantly increased 10-fold at time zero (i.e., Na = 10Nb; Figure 1). As reported previously (Takano-Shimizu 1999; Charlesworth and Eyre-Walker 2007), for a long period after the expansion (∼38Na generations in Figure 1A), the total substitution rate is higher than that before the expansion. This is due to a sharp increase in raA (the top curve in Figure 1A). Patterns of polymorphism are also complex (Figure 1B). For example, the frequency of polymorphisms arising from sites fixed for a (Pa) first increases and then gradually decreases to its new equilibrium level. This behavior of Pa is caused by the following dynamics. Just after the expansion, there are many more sites fixed for a in the population than at equilibrium under the new, larger population size. With the parameter values used in Figure 1, 68% of the sites are expected to be fixed for a before the expansion, whereas this number decreases to 12% under the new population size. Thus, immediately after the expansion, the chance of occurrence of an a → A mutation is higher than at equilibrium with the new population size. On the other hand, the population expansion changes the scaled selection coefficient from γb = 2Nbs = 0.3, the value before the change, to γa = 2Nas = 3, the value after the change. As a result, under the new population size, A → a polymorphic mutations become more deleterious and are more efficiently purged, whereas a → A polymorphic mutations become more advantageous and are more likely to escape stochastic loss and to segregate at an appreciable frequency. These nonequilibrium dynamics lead to the transient increase in Pa. However, as time elapses, the number of sites fixed for a gradually decreases, and Pa also slowly decreases to its new equilibrium value.
Figure 1.—

Patterns of substitution and polymorphism after a recent population size expansion. We assumed that a diploid population of size Nb was originally at equilibrium. At time zero the population size increased instantly 10-fold to Na and stayed constant thereafter. Allele A was assumed to be the preferred allele. The parameters used were γb = 2Nbs = 0.3, θb = 4Nbu = 0.002, and κ = 3. Time was measured in units of Na generations. (A) Patterns of substitution. We calculated three quantities: raA (the rate at which sites fixed for allele a were replaced by sites fixed for allele A; see Equation 10), rAa (the rate at which sites fixed for A were replaced by sites fixed for a), and r = raA + rAa, the total substitution rate. Shown are the ratios of the values of these quantities after the change in population size to their equilibrium values before the change. (B) Patterns of polymorphism. PA (or Pa) is the proportion of polymorphic sites originating from sites previously fixed for A (or a) (see Equation 9).
Another feature of Figure 1B is of interest: for ∼5Na generations Pa ≥ PA. This observation is striking because (i) PA = Pa = 50%, which occurs twice in Figure 1B when the two curves intersect, is a pattern expected under an equilibrium population with neutrality (McVean and Charlesworth 1999) and (ii) Pa > PA is expected under an equilibrium model when a is preferred (McVean and Charlesworth 1999), but here a was unpreferred. These results strongly suggest that using predictions made by equilibrium models of codon usage to interpret patterns of polymorphism observed in a nonequilibrium population may lead to very misleading conclusions.
Next, we examined the effects of a reduction in population size. In Figure 2, a 10-fold decrease was assumed (i.e., 10Na = Nb). Immediately after the reduction, the total substitution rate, r, is much higher than that before (Figure 2A), consistent with previous results (Takano-Shimizu 1999; Charlesworth and Eyre-Walker 2007). The increase in r is due to increases in both rAa and raA. Patterns of polymorphism also show interesting dynamics. Before reaching their new equilibrium values of 54 and 46%, respectively, the difference between PA and Pa increases temporarily (Figure 2B), mimicking an increase in selection pressure on synonymous codons, despite the fact that the selection pressure is greatly reduced due to the sharp decrease in population size. This increased difference between PA and Pa is caused by (i) a transient increase in the number of sites fixed for A (see Figure S2), which allows more A → a polymorphic mutations to occur, and (ii) a decrease in the total number of a → A mutations arising each generation. Interestingly, the transient increase in the number of sites fixed for A also results in a brief increase in rAa at ∼2Na generations after the contraction.
Figure 2.—

Patterns of substitution and polymorphism after a recent population size shrinkage. We assumed that a diploid population of size Nb was originally at equilibrium. At time zero the population size decreased instantly 10-fold to Na and stayed constant thereafter. Allele A was assumed to be the preferred allele. The parameters used were γb = 2, θb = 0.02, and κ = 3. Time was measured in units of Na generations. (A) Pattern of substitution. (B) Pattern of polymorphism. Definitions of the quantities raA, rAa, r, PA, and Pa are the same as those given in Figure 1.
In brief, the dynamics of codon usage can be rather complex following a recent change in population size. Patterns of polymorphism may imitate those expected under a weaker (Figure 1B) or a stronger (Figure 2B) selection pressure on synonymous codons. Further, these misleading patterns can persist for long periods, as the time required for the population to reach the new equilibrium state is typically very long (e.g., Figures 1 and 2).
The effects of a recent population size change on methods that assume equilibrium:
A number of methods have been proposed to quantify the selection pressure on synonymous codons using within-species polymorphism data (Akashi and Schaeffer 1997; Maside et al. 2004; Comeron and Guthrie 2005; Cutter and Charlesworth 2006). These methods assume that the population is at mutation–selection–drift equilibrium. However, given the results described above, knowing the performance of these methods in a nonequilibrium population is important. To this end, we used the method of Maside et al. (2004) as an example, due to its simplicity in calculation. This method relies on some well-established diffusion approximations (McVean and Charlesworth 1999). Our simulations suggest that when the population is at equilibrium and there is mutational bias, the method may give slightly biased estimates of γ, but this is apparent only when selection is very weak (see Figure S3).
In Figure 3, the same model and parameters used to obtain Figure 1 were used to generate random samples of size 15 with 10,000 codons at various time points after the population expansion. We used the Maside et al. (2004) method to analyze these samples. As shown by Figure 3A, the mean value of the maximum-likelihood estimate (mean MLE) of γ starts at a value ∼0.3, the true value before the expansion, and then goes down to a value of ∼−0.5; thereafter, the mean MLE increases monotonically toward the new equilibrium value of 3. Over this time period, the mean MLE of γ takes the value of zero twice, at ∼Na and ∼16Na generations after the expansion, respectively. These two special time points correspond to the two occasions when PA = Pa = 50% in Figure 1B. The power of the method to reject neutrality at a significance level of 5% is shown in Figure 3B. There are two dips in the power curve. Not surprisingly, these two significant reductions in power occur when the mean MLE of γ takes the value of zero. One feature of special note in Figure 3 is that, during the time between the two occasions when the mean MLE of γ is zero, the Maside et al. (2004) method has great power to reject neutral evolution for the data sets that we simulated. However, the γ-value that the method returns has, on average, a different sign from the true value. In other words, the preferred/unpreferred state estimated by the method is the reverse of the true situation. Further investigation suggests that the negative mean MLE was not caused by our incorporation of a strong mutational bias in the simulation (κ= 3), because the same pattern was observed when κ was set to one (results not shown).
Figure 3.—

Effects of a recent population size expansion on the Maside et al. (2004) method. The model and parameters used were the same as those used to generate Figure 1 (i.e., a 10-fold increase in population size, γb = 0.3, θb = 0.002, and κ = 3). At each time point after the expansion in population size, we randomly generated 500 samples. Each sample was composed of 15 sequences of 10,000 codons. We then used the Maside et al. (2004) method to analyze these samples and obtained a distribution of estimated γ. (A) The solid curve shows the mean value of the estimates of γ, and the shaded sleeve indicates where 95% of the probability mass of the distribution lies. (B) The power of the Maside et al. method to reject neutrality at a significance level of 5%. Note that the timescale is different in the two plots.
In agreement with the results shown in Figure 2B, there is a brief increase in the mean MLE of γ immediately after a reduction in population size (Figure 4), and thereafter the mean MLE decreases steadily toward the new equilibrium value of 0.2. The power of the Maside et al. method to reject neutrality in this case is a monotonically decreasing function of time (see Figure S4).
Figure 4.—

Effects of a recent population size reduction on the Maside et al. (2004) method. The model and parameters used were the same as those used to generate Figure 2 (i.e., a 10-fold decrease in population size, γb = 2, θb = 0.02, and κ = 3). At each time point after the reduction in population size, we randomly generated 500 samples. Each sample was composed of 15 sequences of 10,000 codons. We then used the Maside et al. method to analyze these samples and obtained a distribution of estimated γ. The solid curve shows the mean of the estimates of γ, and the shaded sleeve indicates where 95% of the probability mass of the distribution lies.
We also carried out simulations to examine effects of nonequilibrium evolution on the Akashi–Schaeffer method (Akashi and Schaeffer 1997; see Figure S8 and Figure S9) and the Cutter–Charlesworth method (Cutter and Charlesworth 2006; see Figure S10 and Figure S11). Both methods are affected. Interestingly, the Akashi–Schaeffer method overestimates the intensity of selection after a population size expansion and falsely infers the sign of γ after a population size reduction; these patterns are the reverse of those for the Maside et al. method. The Cutter–Charlesworth method has similar properties to the Maside et al. method.
Taken together, the results suggest that recent population size changes can cause methods that assume equilibrium to give misleading results. First, the estimated selection pressure on synonymous codons may be very different from the true value (Figures 3A and 4); second, neutrality may be falsely accepted (Figure 3B).
The performance of the new estimation methods:
To model the effects of a change in population size with the new methods described in materials and methods, we constructed two statistical models: L0 and L1. L0 assumes that the population is at equilibrium and has three parameters: γ, θ, and κ. L1 assumes that the population is originally at equilibrium with population size Nb. Then the population size changes instantly to Na and stays constant thereafter for t generations, at which point a sample is taken from the population. Hence, L1 has five parameters: γb (= 2Nbs), θb (= 4Nbu), κ, g (= Na/Nb), and τ (= t/Na).
In contrast to previous methods, which do not estimate mutational parameters (Akashi and Schaeffer 1997; Maside et al. 2004; Comeron and Guthrie 2005; Cutter and Charlesworth 2006), L0 simultaneously estimates mutational (θ and κ) and selection (γ) parameters. Simulation results show that L0 has high accuracy in estimating all the parameters (Table 2). However, similarly to the Maside et al. method, L0 is susceptible to violation of the equilibrium assumption (see Figure S5 and Figure S6). In this case, the behavior of L0 is rather similar to that of the Maside et al. method: following a recent population expansion the mean MLE of γ first decreases and then slowly increases to the new equilibrium value. The difference is that the mean MLE of γ returned by L0 takes a minimum value of ∼0.1 and never becomes negative. Estimates of κ and θ produced by L0 are also likely to be biased by recent demographic changes (see Figure S5 and Figure S6).
TABLE 2.
Performance of the L0 method in an equilibrium population
| θ | κ | γ | |
|---|---|---|---|
| Sample size = 15, no. of codons per sequence = 10,000 | |||
| Inputa | 0.01 | 1 | 0 |
| Mean MLEb | 0.01 | 1.02 | −0.0009 |
| Percentilesc | [0.008, 0.012] | [0.71, 1.45] | [−0.3772, 0.3488] |
| Inputa | 0.01 | 3 | 1 |
| Mean MLEb | 0.01 | 3.01 | 1.02 |
| Percentilesc | [0.008, 0.012] | [2.32, 4.10] | [0.72, 1.34] |
| Sample size = 25, no. of codons per sequence = 500 | |||
| Inputa | 0.01 | 3 | 2 |
| Mean MLEb | 0.01 | 3.53 | 1.98 |
| Percentilesc | [0.003, 0.019] | [1.01, 10.62] | [0.79, 3.36] |
For each combination of parameter values, we used the matrix model to generate 200 samples. These samples were analyzed using L0 (see Equation 12).
The parameter values used to generate random samples.
Mean value of the maximum-likelihood estimates (MLE).
Percentiles [2.5% and 97.5%] of the distributions of the MLEs.
The L1 method has two more parameters, τ and g, and requires the iteration of Equation 5. Hence, L1 is the most computationally intense method considered here. Again we did simulations to examine the properties of L1 (Table 3). The accuracy of L1 in estimating the parameters is generally quite high. Importantly, the method seems to have good power to reject a model with constant population size and to detect selection (Table 3). However, when only a relatively small amount of data is available, the accuracy and power of the L1 method are reduced (see the second set of results in Table 3). In this case, the model with a recent population size reduction seems to be particularly problematic: in the simulations, the simplex algorithm we used often failed to converge and returned unrealistic results. Interestingly, reducing the amount of data does not reduce the power of the method to detect selection if the population size is declining, whereas a limited amount of data does reduce the power to detect selection if the population size is increasing. This difference is probably caused by the fact that immediately after a reduction in population size, patterns of polymorphism can be very selection-like (i.e., PA and Pa are very different; e.g., Figure 2B), whereas after a population expansion patterns of polymorphism can be more neutral-like (i.e., PA and Pa are close to 50%; e.g., Figure 1B).
TABLE 3.
Performance of the L1 method in a nonequilibrium population
| θb | κ | γb | g | τ | Power1d (%) | Power2e (%) | |
|---|---|---|---|---|---|---|---|
| Sample size = 25, no. of codons per sequence = 25,000 | |||||||
| Inputa | 0.004 | 3 | 0.4 | 5 | 1 | ||
| Mean MLEb | 0.0042 | 3.06 | 0.41 | 5.41 | 0.94 | 100 | 100 |
| Percentilesc | [0.0023, 0.0077] | [2.61, 3.65] | [0.26, 0.59] | [3.10, 8.35] | [0.41, 1.32] | ||
| Inputa | 0.02 | 3 | 2 | 0.2 | 2 | ||
| Mean MLEb | 0.022 | 2.69 | 1.86 | 0.23 | 1.86 | 100 | 100 |
| Percentilesc | [0.015, 0.043] | [1.62, 4.57] | [1.30, 2.48] | [0.12, 0.32] | [0.68, 3.73] | ||
| Sample size = 6, no. of codons per sequence = 15,000 | |||||||
| Inputa | 0.004 | 3 | 0.4 | 5 | 1 | ||
| Mean MLEb | 0.0045 | 3.42 | 0.48 | 5.9 | 0.90 | 98 | 57 |
| Percentilesc | [0.0018, 0.0097] | [2.14, 6.23] | [0.06, 1.09] | [3.0, 9.2] | [0.06, 1.87] | ||
| Inputa | 0.02 | 3 | 2 | 0.2 | 2 | ||
| Mean MLEb | 0.027 | 3.05 | 1.9 | 0.21 | 2.37 | 82.1 | 100 |
| Percentilesc | [0.008, 0.095] | [1.41, 9.06] | [1.24, 3.31] | [0.08, 0.44] | [0.73, 5.75] | ||
In the simulations, we assumed that the population was originally at equilibrium with population size Nb. Then the population size changed instantly to Na and stayed constant thereafter for t generations, at which point random samples were taken. The parameters were γb (= 2Nbs), θb (= 4Nbu), κ, g (= Na/Nb), and τ (= t/Na). For each combination of parameter values, 100 replicate simulations were run.
The parameter values used to generate random samples.
Mean value of the maximum-likelihood estimates (MLE).
Percentiles [2.5% and 97.5%] of the distributions of the MLEs.
The power to reject a model with constant population size at a significance level of 5%.
The power to reject neutral evolution at a significance level of 5%.
Overall, the L1 method seems to have substantial power to disentangle selection from demography. This is a useful property because it has long been known that selection and demography, either acting separately or jointly, can leave very similar traces on polymorphism patterns, and distinguishing them has been a subject of active research (Simonsen et al. 1995; Nielsen et al. 2005; Williamson et al. 2005; Keightley and Eyre-Walker 2007; Zeng et al. 2007).
Applying the new methods to a D. melanogaster data set:
We used our new methods, L0 and L1, to analyze a large D. melanogaster polymorphism data set (Shapiro et al. 2007), summarized in Table 1 (see also materials and methods).
Initial analysis:
The results of the analyses are given in Table 4. Interestingly, the simple model, L0, seems to be sufficient to explain the data: there is essentially no increase in the log-likelihood (ln L) when the data were analyzed using L1. Further support for this conclusion comes from the fact that, under L1, the estimate of the time after expansion, τ, is very large, by which time the population has essentially reached a new equilibrium, and L1 reduces to L0. For this reason, we were unable to obtain a 95% confidence interval under L1. Furthermore, consistent with many previous reports (Petrov and Hartl 1999; McVean and Vieira 2001; Nielsen et al. 2007; Keightley et al. 2009), the mutational process is not symmetric, but is biased toward preferred-to-unpreferred changes [L0(κ = 1) vs. L0, χ2 = 4.6, d.f. = 1, P = 0.03]. In contrast, comparing L0 with the reduced model when the selection coefficient (s) was fixed at zero [i.e., L0(s = 0) vs. L0], we found strong evidence for recent selection on synonymous codons (χ2 = 19.7, d.f. = 1, P = 9.1 × 10⁻⁶). Using the estimated parameters, the L0 model can accurately predict the observed data (see Figure S7). In short, the above results suggest that a model with constant population size and selection acting on synonymous codons is a sufficient explanation of the data.
TABLE 4.
Analyzing the twofold degenerate codons using L0 and L1
| Estimates of parameters
|
|||||||
|---|---|---|---|---|---|---|---|
| Model | θb | κ | γb | g | τ | Log-likelihood | |
| L1 | MLE | 0.0040 | 1.67 | 0.50 | 2.1 | 780.2 | −11627.8 |
| L0 | MLE | 0.0083 | 1.63 | 1.03 | — | — | −11627.8 |
| 95% C.I.a | [0.0061, 0.0109] | [1.03, 2.54] | [0.57, 1.48] | — | — | ||
| L0(s = 0)b | MLE | 0.0144 | 0.60 | — | — | — | −11637.7 |
| L0(κ= 1)c | MLE | 0.0110 | — | 0.53 | — | — | −11630.1 |
Ninety-five percent confidence interval obtained by 250 bootstrap replicates.
The L0 model with s, the selection coefficient, fixed at zero.
The L0 model with κ, the mutational bias parameter, fixed at unity.
A more detailed analysis:
Although the L0 model seems to provide a rather good fit to the data, it is highly simplified in that it assumes a single selection coefficient and a single mutational bias parameter for all sites. It has been shown by other researchers that different genes can experience different levels of selection pressure, depending on factors such as gene expression level and length of coding region (Comeron and Kreitman 2002; Maside et al. 2004; Comeron and Guthrie 2005; Cutter and Charlesworth 2006), and that the mutational bias parameter can be different for different nucleotides (McVean and Vieira 1999; Petrov and Hartl 1999; Keightley et al. 2009). We therefore introduced additional parameters into the L0 model.
First, some of the preferred codons being analyzed differ from their corresponding unpreferred codons by a G to A change at the third codon position, while the rest differ by C to T. We thus extended the model so that each class of codons had its own set of parameters. A maximum-likelihood analysis suggests that this model fits the data much better than the original model (χ2 = 287.0, d.f. = 3, P < 10−20). The MLEs are  = 0.85,
  = 1.13,
  = 0.011,
  = 0.007,
  = 0.95, and
  = 2.26 (ln L = −11484.3). However, a model with a common selection coefficient for the two classes of codons fits the data almost equally well (χ2 = 0.34, d.f. = 1, P = 0.56); the MLEs and the log-likelihood under this model are
  = 1.03,
  = 0.010,
  = 0.008,
  = 1.13,
  = 2.04, and ln L = −11484.5. Thus, we assumed that there was no difference in selection coefficient between G/A or C/T ending codons in the following more elaborate analysis.
Another major determinant of codon usage is the level of gene expression (Duret and Mouchiroud 1999; Hey and Kliman 2002). To model this complication, we used data from the UniGene database (http://www.ncbi.nlm.nih.gov/unigene), employing the total number of expressed sequence tags (ESTs) for a gene as a rough measure of its level of expression (the data were kindly provided by B. Vicoso). We divided the genes into two equal-size groups: low-expression and high-expression genes. We allowed each of group of genes to have its own scaled selection coefficient, γlow and γhigh, respectively. By fitting the model to the data, we obtained the following MLEs:  = 0.82,
  = 1.25,
  = 0.010,
  = 0.008,
  = 1.14,
  = 2.03, and ln L = −11079.3. This new model further improves the fit to the data compared to L0(d | γ, θGA, θCT, κGA, κCT) (χ2 = 810.3, d.f. = 1, P < 10−20). In accordance with the previous reports, our results suggest that highly expressed genes are under stronger selection pressure than genes with low expression levels.
Finally, we considered the effects of coding region length. We divided low- and high-expression genes, respectively, into two equal-size classes: genes with short and long coding regions. We allowed each group of genes to have its own selection coefficient. The MLEs are  = 0.91,
  = 0.76,
  = 1.36,
  = 1.17,
  = 0.010,
  = 0.008,
  = 1.14,
  = 2.04, and ln L = −11068.6. The improvement in the fit to the data, compared to the model given in the previous paragraph, is also highly significant (χ2 = 21.3, d.f. = 2, P = 2.3 × 10⁻⁵). These results confirm the finding that genes with shorter coding regions tend to be under stronger selection pressure than those with longer coding regions (Comeron et al. 1999; Duret and Mouchiroud 1999; Comeron and Guthrie 2005).
DISCUSSION
The importance of considering nonequilibrium factors in the study of codon usage bias:
Population–genetic models of codon usage bias (Li 1987; Bulmer 1991; McVean and Charlesworth 1999) have mostly assumed that the population is at mutation–selection–drift equilibrium. As evidence for nonequilibrium situations in Drosophila species accumulates (Takano-Shimizu 1999, 2001; Kern and Begun 2005; Li and Stephan 2006; Thornton and Andolfatto 2006; Stephan and Li 2007), the study of nonequilibrium models has attracted more attention, and some unexpected results have emerged (Eyre-Walker 1997; Takano-Shimizu 1999, 2001; Comeron and Kreitman 2002; Comeron and Guthrie 2005; Charlesworth and Eyre-Walker 2007).
Our matrix model allows systematic studies of the patterns of polymorphism and substitution following a recent change in population size. We were able to confirm and extend the findings reported in the previous studies. Most importantly, we have carried out the first survey of the performance of statistical methods that assume equilibrium in a situation where such an assumption is violated. We can draw two conclusions. First, patterns of polymorphism can be very misleading after a recent change in population size. For example, they can become very neutral-like after a recent population expansion (Figure 1B). In contrast, after a recent population size reduction, patterns of polymorphism are likely to suggest a level of selection pressure higher than the true value (Figure 2B). Second, using statistical methods that assume equilibrium in a nonequilibrium population can result in erroneous inferences of the strength of selection (Figures 3 and 4; see also Figure S5, Figure S6, Figure S8, Figure S9, Figure S10, and Figure S11). These findings indicate that it is important to consider nonequilibrium factors in the study of codon usage bias.
Effects of weak selection on synonymous variants:
Contrary to a previous analysis of the same D. melanogaster data set (Keightley and Eyre-Walker 2007), we did not find any evidence for a recent population expansion in the Zimbabwe sample. The main difference between the studies is that synonymous sites were previously assumed to be neutral. However, as shown here, there is evidence for selection on these sites. According to standard population genetics theory, such a selection pressure can result in an excess of low-frequency variants (Ewens 2004, Chap. 5). It is likely that this excess of low-frequency variants was treated by the method of Keightley and Eyre-Walker as the signature of a recent population size expansion. Indeed, when these authors fitted the data using a model with selection on synonymous sites, the support for the expansion event disappeared (see p. 2260 in Keightley and Eyre-Walker 2007). Moreover, recent studies have shown that noncoding regions may be under selection as well (e.g., Andolfatto 2005). These findings suggest that treating certain types of markers as neutral standards can be a dubious procedure, which deserves careful investigation of its validity, whose violation may result in unreliable inferences.
Selection on synonymous codons in D. melanogaster:
By analyzing a large polymorphism data set (Shapiro et al. 2007), we found evidence for natural selection on synonymous codons in D. melanogaster (Table 4). Furthermore, we show that genes with shorter coding sequences and/or higher levels of expression are under stronger selection. These results are consistent with previous studies, which suggest that patterns of codon usage bias in D. melanogaster are compatible with the operation of selection (Kliman 1999; Hey and Kliman 2002; Carlini and Stephan 2003; Qin et al. 2004; Comeron and Guthrie 2005; Singh et al. 2007).
However, a number of studies have also found that selection on synonymous sites may have been substantially reduced in the D. melanogaster lineage (Akashi 1995, 1996; McVean and Vieira 1999, 2001; Nielsen et al. 2007). A common feature of these studies is that they used between-species divergence data and drew conclusions on the basis of the observation that D. melanogaster synonymous sites have fixed significantly more unpreferred alleles than preferred variants (the rates of fixation should be equal at equilibrium). Divergence data can tell us what has happened along the entire D. melanogaster lineage, but not when these events happened. To reconcile these findings with ours, we hypothesize that there may have been a reduction in population size in the D. melanogaster lineage a long time ago, which resulted in the rapid fixation of many unpreferred variants (e.g., Figure 2A). After this ancient reduction, the population size may have stayed relatively constant, and extant patterns of polymorphism may have come relatively close to the new equilibrium. Because our method does not use divergence data, it has little power to detect such an ancient event, so that the equilibrium model provides a good fit.
The difficulty is that, even if this hypothesis is correct, it is hard to estimate when the reduction in population size occurred, and our method may thus overestimate the current intensity of selection, depending on the time of the contraction event (see Figure S6). In addition, the potential influences of biased gene conversion (Marais et al. 2001, 2003; Kliman and Hey 2003; Marais 2003), changes in the recombinational landscape (Takano-Shimizu 1999), and recent changes in the mutational processes (Takano-Shimizu 2001; Kern and Begun 2005), as well as the effects of more complex demographic models (e.g., population structure and population bottlenecks), are not considered by our method. Therefore, although there is evidence for selection on synonymous sites, this result should be treated with caution.
Advantages and caveats:
The matrix model and the methods developed in this study have a number of advantages. First, the model is highly flexible. Although we focus on the effects of a sudden change in population size here, it is straightforward to modify the model so that it can be used to study effects of more complex demographic models (e.g., population bottlenecks, exponential growth), changes in selection coefficients, and changes in mutational parameters. Second, our methods allow the simultaneous estimation of selection and mutational parameters, in contrast to previous methods that rely only on polymorphic sites (Maside et al. 2004; Cutter and Charlesworth 2006). Third, the statistical methods we have proposed do not require the use of an outgroup sequence to infer ancestral vs. derived states, a process that is error prone and can lead to unreliable inferences.
There are also some caveats. First, as in most previous studies, we assume that sites are independent. This assumption is obviously unrealistic. Hill–Robertson effects among linked sites might make our methods unreliable (McVean and Charlesworth 2000; Comeron et al. 2008). Fortunately, recent simulation studies have suggested that methods assuming free recombination work surprisingly well in practice with relatively free recombination (e.g., with a local recombination rate >2 cM/Mb; K. Zeng, unpublished results; see also Williamson et al. 2005 and Boyko et al. 2008). By using data from highly recombining regions, our results should be robust to the violation of the free-recombination assumption. The second disadvantage of the matrix model is that it is computationally burdensome. In particular, the L1 model, which requires iterating Equation 5, can be very slow. This is a common problem confronting all studies using matrix models (e.g., Keightley and Eyre-Walker 2007). Despite these caveats, matrix models are flexible and easy to formulate, and their usefulness should not be underestimated.
A computer program implementing the methods described in this article is available from the corresponding author.
Acknowledgments
We thank Andrea Betancourt, Penny Haddrill, and Peter Keightley for helpful discussions and David Turissini for providing the Drosophila data set. We also thank Rasmus Nielsen, John Wakeley, and the anonymous reviewers for their insightful comments. We are very grateful to the Sun Yat-Sen University Computer Centre for providing computer time and to Hailiang Liu and Haijun Wen for technical support. This work has also made use of the resources provided by the Edinburgh Compute and Data Facility (ECDF) (http://www.ecdf.ed.ac.uk/). The ECDF is partially supported by the eScience Data Information and Knowledge Transformation initiative (http://www.edikt.org.uk). K.Z. was supported by a Royal Society International Incoming Fellowship. K.Z. also acknowledges support from a National Basic Research Program of China grant (2007CB815701) and a National Natural Science Foundation of China grant (30730008) to Professor Suhua Shi.
Supporting information is available online at http://www.genetics.org/cgi/content/full/genetics.109.101782/DC1.
References
- Akashi, H., 1994. Synonymous codon usage in Drosophila melanogaster: natural selection and translational accuracy. Genetics 136: 927–935. [DOI] [PMC free article] [PubMed] [Google Scholar]
- Akashi, H., 1995. Inferring weak selection from patterns of polymorphism and divergence at “silent” sites in Drosophila DNA. Genetics 139: 1067–1076. [DOI] [PMC free article] [PubMed] [Google Scholar]
- Akashi, H., 1996. Molecular evolution between Drosophila melanogaster and D. simulans: reduced codon bias, faster rates of amino acid substitution, and larger proteins in D. melanogaster. Genetics 144: 1297–1307. [DOI] [PMC free article] [PubMed] [Google Scholar]
- Akashi, H., and S. W. Schaeffer, 1997. Natural selection and the frequency distributions of “silent” DNA polymorphism in Drosophila. Genetics 146: 295–307. [DOI] [PMC free article] [PubMed] [Google Scholar]
- Andolfatto, P., 2005. Adaptive evolution of non-coding DNA in Drosophila. Nature 437: 1149–1152. [DOI] [PubMed] [Google Scholar]
- Bierne, N., and A. Eyre-Walker, 2006. Variation in synonymous codon use and DNA polymorphism within the Drosophila genome. J. Evol. Biol. 19: 1–11. [DOI] [PubMed] [Google Scholar]
- Boyko, A. R., S. H. Williamson, A. R. Indap, J. D. Degenhardt, R. D. Hernandez et al., 2008. Assessing the evolutionary impact of amino acid mutations in the human genome. PLoS Genet. 4: e1000083. [DOI] [PMC free article] [PubMed] [Google Scholar]
- Bulmer, M., 1991. The selection-mutation-drift theory of synonymous codon usage. Genetics 129: 897–907. [DOI] [PMC free article] [PubMed] [Google Scholar]
- Carlini, D. B., and W. Stephan, 2003. In vivo introduction of unpreferred synonymous codons into the Drosophila Adh gene results in reduced levels of ADH protein. Genetics 163: 239–243. [DOI] [PMC free article] [PubMed] [Google Scholar]
- Charlesworth, J., and A. Eyre-Walker, 2007. The other side of the nearly neutral theory, evidence of slightly advantageous back-mutations. Proc. Natl. Acad. Sci. USA 104: 16992–16997. [DOI] [PMC free article] [PubMed] [Google Scholar]
- Comeron, J. M., and T. B. Guthrie, 2005. Intragenic Hill-Robertson interference influences selection intensity on synonymous mutations in Drosophila. Mol. Biol. Evol. 22: 2519–2530. [DOI] [PubMed] [Google Scholar]
- Comeron, J. M., and M. Kreitman, 2002. Population, evolutionary and genomic consequences of interference selection. Genetics 161: 389–410. [DOI] [PMC free article] [PubMed] [Google Scholar]
- Comeron, J. M., M. Kreitman and M. Aguade, 1999. Natural selection on synonymous sites is correlated with gene length and recombination in Drosophila. Genetics 151: 239–249. [DOI] [PMC free article] [PubMed] [Google Scholar]
- Comeron, J. M., A. Williford and R. M. Kliman, 2008. The Hill-Robertson effect: evolutionary consequences of weak selection and linkage in finite populations. Heredity 100: 19–31. [DOI] [PubMed] [Google Scholar]
- Cutter, A. D., and B. Charlesworth, 2006. Selection intensity on preferred codons correlates with overall codon usage bias in Caenorhabditis remanei. Curr. Biol. 16: 2053–2057. [DOI] [PubMed] [Google Scholar]
- Drummond, D. A., J. D. Bloom, C. Adami, C. O. Wilke and F. H. Arnold, 2005. Why highly expressed proteins evolve slowly. Proc. Natl. Acad. Sci. USA 102: 14338–14343. [DOI] [PMC free article] [PubMed] [Google Scholar]
- Duret, L., and D. Mouchiroud, 1999. Expression pattern and, surprisingly, gene length shape codon usage in Caenorhabditis, Drosophila, and Arabidopsis. Proc. Natl. Acad. Sci. USA 96: 4482–4487. [DOI] [PMC free article] [PubMed] [Google Scholar]
- Evans, S. N., Y. Shvets and M. Slatkin, 2007. Non-equilibrium theory of the allele frequency spectrum. Theor. Popul. Biol. 71: 109–119. [DOI] [PubMed] [Google Scholar]
- Ewens, W. J., 2004. Mathematical Population Genetics. Springer-Verlag, Berlin.
- Eyre-Walker, A., 1997. Differentiating between selection and mutation bias. Genetics 147: 1983–1987. [DOI] [PMC free article] [PubMed] [Google Scholar]
- Eyre-Walker, A., and M. Bulmer, 1993. Reduced synonymous substitution rate at the start of enterobacterial genes. Nucleic Acids Res. 21: 4599–4603. [DOI] [PMC free article] [PubMed] [Google Scholar]
- Galtier, N., E. Bazin and N. Bierne, 2006. GC-biased segregation of noncoding polymorphisms in Drosophila. Genetics 172: 221–228. [DOI] [PMC free article] [PubMed] [Google Scholar]
- Glinka, S., L. Ometto, S. Mousset, W. Stephan and D. De Lorenzo, 2003. Demography and natural selection have shaped genetic variation in Drosophila melanogaster: a multi-locus approach. Genetics 165: 1269–1278. [DOI] [PMC free article] [PubMed] [Google Scholar]
- Haddrill, P. R., K. R. Thornton, B. Charlesworth and P. Andolfatto, 2005. Multilocus patterns of nucleotide variability and the demographic and selection history of Drosophila melanogaster populations. Genome Res. 15: 790–799. [DOI] [PMC free article] [PubMed] [Google Scholar]
- Hershberg, R., and D. A. Petrov, 2008. Selection on codon bias. Annu. Rev. Genet. 42: 287–299. [DOI] [PubMed] [Google Scholar]
- Hey, J., and R. M. Kliman, 2002. Interactions between natural selection, recombination and gene density in the genes of Drosophila. Genetics 160: 595–608. [DOI] [PMC free article] [PubMed] [Google Scholar]
- Iida, K., and H. Akashi, 2000. A test of translational selection at ‘silent’ sites in the human genome: base composition comparisons in alternatively spliced genes. Gene 261: 93–105. [DOI] [PubMed] [Google Scholar]
- Ikemura, T., 1981. Correlation between the abundance of Escherichia coli transfer RNAs and the occurrence of the respective codons in its protein genes: a proposal for a synonymous codon choice that is optimal for the E. coli translational system. J. Mol. Biol. 151: 389–409. [DOI] [PubMed] [Google Scholar]
- Ikemura, T., 1985. Codon usage and tRNA content in unicellular and multicellular organisms. Mol. Biol. Evol. 2: 13–34. [DOI] [PubMed] [Google Scholar]
- Kaiser, V. B., and B. Charlesworth, 2009. The effects of deleterious mutations on evolution in non-recombining genomes. Trends Genet. 25: 9–12. [DOI] [PubMed] [Google Scholar]
- Karlin, S., and H. Taylor, 1975. A First Course in Stochastic Processes. Academic Press, New York/London/San Diego.
- Keightley, P. D., and A. Eyre-Walker, 2007. Joint inference of the distribution of fitness effects of deleterious mutations and population demography based on nucleotide polymorphism frequencies. Genetics 177: 2251–2261. [DOI] [PMC free article] [PubMed] [Google Scholar]
- Keightley, P. D., U. Trivedi, M. Thomson, F. Oliver, S. Kumar et al., 2009. Analysis of the genome sequences of three Drosophila melanogaster spontaneous mutation accumulation lines. Genome Res. 19: 1195–1201. [DOI] [PMC free article] [PubMed] [Google Scholar]
- Kern, A. D., and D. J. Begun, 2005. Patterns of polymorphism and divergence from noncoding sequences of Drosophila melanogaster and D. simulans: evidence for nonequilibrium processes. Mol. Biol. Evol. 22: 51–62. [DOI] [PubMed] [Google Scholar]
- Kliman, R. M., 1999. Recent selection on synonymous codon usage in Drosophila. J. Mol. Evol. 49: 343–351. [DOI] [PubMed] [Google Scholar]
- Kliman, R. M., and J. Hey, 2003. Hill-Robertson interference in Drosophila melanogaster: reply to Marais, Mouchiroud and Duret. Genet. Res. 81: 89–90. [DOI] [PubMed] [Google Scholar]
- Li, H., and W. Stephan, 2006. Inferring the demographic history and rate of adaptive substitution in Drosophila. PLoS Genet. 2: e166. [DOI] [PMC free article] [PubMed] [Google Scholar]
- Li, W. H., 1987. Models of nearly neutral mutations with particular implications for nonrandom usage of synonymous codons. J. Mol. Evol. 24: 337–345. [DOI] [PubMed] [Google Scholar]
- Marais, G., 2003. Biased gene conversion: implications for genome and sex evolution. Trends Genet. 19: 330–338. [DOI] [PubMed] [Google Scholar]
- Marais, G., D. Mouchiroud and L. Duret, 2001. Does recombination improve selection on codon usage? Lessons from nematode and fly complete genomes. Proc. Natl. Acad. Sci. USA 98: 5688–5692. [DOI] [PMC free article] [PubMed] [Google Scholar]
- Marais, G., D. Mouchiroud and L. Duret, 2003. Neutral effect of recombination on base composition in Drosophila. Genet. Res. 81: 79–87. [DOI] [PubMed] [Google Scholar]
- Maside, X., A. W. Lee and B. Charlesworth, 2004. Selection on codon usage in Drosophila americana. Curr. Biol. 14: 150–154. [DOI] [PubMed] [Google Scholar]
- McVean, G. A., and B. Charlesworth, 2000. The effects of Hill-Robertson interference between weakly selected mutations on patterns of molecular evolution and variation. Genetics 155: 929–944. [DOI] [PMC free article] [PubMed] [Google Scholar]
- McVean, G. A., and J. Vieira, 1999. The evolution of codon preferences in Drosophila: a maximum-likelihood approach to parameter estimation and hypothesis testing. J. Mol. Evol. 49: 63–75. [DOI] [PubMed] [Google Scholar]
- McVean, G. A., and J. Vieira, 2001. Inferring parameters of mutation, selection and demography from patterns of synonymous site evolution in Drosophila. Genetics 157: 245–257. [DOI] [PMC free article] [PubMed] [Google Scholar]
- McVean, G. A. T., and B. Charlesworth, 1999. A population genetic model for the evolution of synonymous codon usage: patterns and predictions. Genet. Res. 74: 145–158. [Google Scholar]
- Nielsen, R., S. Williamson, Y. Kim, M. J. Hubisz, A. G. Clark et al., 2005. Genomic scans for selective sweeps using SNP data. Genome Res. 15: 1566–1575. [DOI] [PMC free article] [PubMed] [Google Scholar]
- Nielsen, R., V. L. Bauer DuMont, M. J. Hubisz and C. F. Aquadro, 2007. Maximum likelihood estimation of ancestral codon usage bias parameters in Drosophila. Mol. Biol. Evol. 24: 228–235. [DOI] [PubMed] [Google Scholar]
- Petrov, D. A., and D. L. Hartl, 1999. Patterns of nucleotide substitution in Drosophila and mammalian genomes. Proc. Natl. Acad. Sci. USA 96: 1475–1479. [DOI] [PMC free article] [PubMed] [Google Scholar]
- Press, W. H., S. A. Teukolsky, W. T. Vetterling and B. P. Flannery, 1992. Numerical Recipes in C: The Art of Scientific Computing. Cambridge University Press, Cambridge, UK.
- Qin, H., W. B. Wu, J. M. Comeron, M. Kreitman and W. H. Li, 2004. Intragenic spatial patterns of codon usage bias in prokaryotic and eukaryotic genomes. Genetics 168: 2245–2260. [DOI] [PMC free article] [PubMed] [Google Scholar]
- Shapiro, J. A., W. Huang, C. Zhang, M. J. Hubisz, J. Lu et al., 2007. Adaptive genic evolution in the Drosophila genomes. Proc. Natl. Acad. Sci. USA 104: 2271–2276. [DOI] [PMC free article] [PubMed] [Google Scholar]
- Sharp, P. M., and W. H. Li, 1986. An evolutionary perspective on synonymous codon usage in unicellular organisms. J. Mol. Evol. 24: 28–38. [DOI] [PubMed] [Google Scholar]
- Simonsen, K. L., G. A. Churchill and C. F. Aquadro, 1995. Properties of statistical tests of neutrality for DNA polymorphism data. Genetics 141: 413–429. [DOI] [PMC free article] [PubMed] [Google Scholar]
- Singh, N. D., P. F. Arndt and D. A. Petrov, 2005. Genomic heterogeneity of background substitutional patterns in Drosophila melanogaster. Genetics 169: 709–722. [DOI] [PMC free article] [PubMed] [Google Scholar]
- Singh, N. D., V. L. Bauer DuMont, M. J. Hubisz, R. Nielsen and C. F. Aquadro, 2007. Patterns of mutation and selection at synonymous sites in Drosophila. Mol. Biol. Evol. 24: 2687–2697. [DOI] [PubMed] [Google Scholar]
- Stephan, W., and H. Li, 2007. The recent demographic and adaptive history of Drosophila melanogaster. Heredity 98: 65–68. [DOI] [PubMed] [Google Scholar]
- Tachida, H., 2000. Molecular evolution in a multisite nearly neutral mutation model. J. Mol. Evol. 50: 69–81. [DOI] [PubMed] [Google Scholar]
- Tajima, F., 1989. Statistical method for testing the neutral mutation hypothesis by DNA polymorphism. Genetics 123: 585–595. [DOI] [PMC free article] [PubMed] [Google Scholar]
- Takano-Shimizu, T., 1999. Local recombination and mutation effects on molecular evolution in Drosophila. Genetics 153: 1285–1296. [DOI] [PMC free article] [PubMed] [Google Scholar]
- Takano-Shimizu, T., 2001. Local changes in GC/AT substitution biases and in crossover frequencies on Drosophila chromosomes. Mol. Biol. Evol. 18: 606–619. [DOI] [PubMed] [Google Scholar]
- Thornton, K., and P. Andolfatto, 2006. Approximate Bayesian inference reveals evidence for a recent, severe bottleneck in a Netherlands population of Drosophila melanogaster. Genetics 172: 1607–1619. [DOI] [PMC free article] [PubMed] [Google Scholar]
- Warnecke, T., and L. D. Hurst, 2007. Evidence for a trade-off between translational efficiency and splicing regulation in determining synonymous codon usage in Drosophila melanogaster. Mol. Biol. Evol. 24: 2755–2762. [DOI] [PubMed] [Google Scholar]
- Watterson, G. A., 1975. On the number of segregating sites in genetical models without recombination. Theor. Popul. Biol. 7: 256–276. [DOI] [PubMed] [Google Scholar]
- Williamson, S. H., R. Hernandez, A. Fledel-Alon, L. Zhu, R. Nielsen et al., 2005. Simultaneous inference of selection and population growth from patterns of variation in the human genome. Proc. Natl. Acad. Sci. USA 102: 7882–7887. [DOI] [PMC free article] [PubMed] [Google Scholar]
- Zeng, K., S. Shi and C. I. Wu, 2007. Compound tests for the detection of hitchhiking under positive selection. Mol. Biol. Evol. 24: 1898–1908. [DOI] [PubMed] [Google Scholar]