

Abstract
Central to the process of epithelial organogenesis is branching morphogenesis into tubules and ducts. In the kidney, this can be modeled by a very simple system consisting of isolated ureteric bud (UB) cells, which undergo branching morphogenesis in response to soluble factors present in the conditioned medium of a metanephric mesenchyme cell line. By employing a targeted screen to identify transcription factors involved early in the morphogenetic program leading to UB branching, we identified the mammalian ortholog of Timeless (mTim) as a potential immediate early gene (IEG) important in this process. In the embryo, mTim was found to be expressed in patterns very suggestive of a role in epithelial organogenesis with high levels of expression in the developing lung, liver, and kidney, as well as neuroepithelium. In the embryonic kidney, the expression of mTim was maximal in regions of active UB branching, and a shift from the large isoform of mTim to a smaller isoform occurred as the kidney developed. Selective down-regulation of mTim resulted in profound inhibition of embryonic kidney growth and UB morphogenesis in organ culture. A direct effect on the branching UB was supported by the observation that down-regulation of mTim in the isolated UB (cultured in the absence of mesenchyme) resulted in marked inhibition of morphogenesis, suggesting a key role for Tim in the epithelial cell morphogenetic pathway leading to the formation of branching tubules.
Diverse epithelial tissues including lung, liver, pancreas, kidney, prostate, and breast share the common structural feature of branching hollow tubes of epithelial cells constructed for the transport of various substances. The complex network of tubes arises through cyclic iterations of growth, budding, and branching of a founder epithelial tubular structure. The precise morphogenetic mechanisms controlling the growth, directionality, and timing of branching events have yet to be elucidated in most of these developing organs (1, 2).
The apparently universal ability of epithelial tissues to form branching tubular structures, typified by kidney collecting system development, suggests a morphogenetic program intrinsic to the epithelial cell itself. Nevertheless, the process is known to be controlled, or at least strongly modulated, by external stimuli such as growth factors and cell–cell interactions. At the other end of the morphogenetic program for arborization, a large number of distal effectors including extracellular matrix components, matrix modifying proteinases, and selective regulation of integrin function are thought to be important in establishing branching patterns (2). Although aspects of cell signaling have begun to be dissected in Drosophila, very little is known regarding early gene expression in the mammalian morphogenetic program.
The search for branch-promoting genes (as well as other effectors) involved in branching morphogenesis in vivo has been complicated by a milieu involving multiple cell types with the potential for cross-talk. A simple in vitro model has been described recently for branching morphogenesis in the context of kidney development that consists of two murine cell types that appear to interact unidirectionally solely through soluble factors (3). When exposed to conditioned medium (BSN-CM) from an e11 metanephric mesenchymal cell line (BSN), immortalized epithelial ureteric bud (UB) cells in three-dimensional (3D) extracellular matrix culture enter a program that begins with cellular process formation and culminates in the formation of branching multicellular tubular structures with lumens (3). This UB cell culture system appears to be directly relevant to in vivo kidney collecting system development because factor(s) present in the BSN-CM are essential in the only organ culture system that supports extensive branching tubulogenesis of isolated UB (5).
We hypothesized that transcripts found to be differentially expressed in “tubulogenic” vs. “nontubulogenic” conditions in the UB cell culture model would have a high likelihood of playing an important role in the program for UB branching. A recent cDNA array-based screen for differentially regulated transcripts during tubulogenesis revealed that several homeobox (HB) genes were overrepresented (4). Therefore, we sought to restrict the focus to HB-like transcription factors while at the same time maintaining a high likelihood of detecting novel sequences. We restricted our focus further to the initiation phase of in vitro tubulogenesis. Thus, a very early time point was chosen (6 h after stimulation), and cycloheximide (CHx) was included in the culture medium to inhibit protein synthesis (7).
Most methods that have been developed for the detection of differential gene expression, such as differential display PCR (ddPCR), serial analysis of gene expression, and subtractive hybridization, do not distinguish genomic subsets such as transcription factors. We previously have described a computer methodology for the analysis of genomic subsets and the construction of statistically designed ddPCR primers, a method referred to as codon-optimized differential display PCR (CODD) (6). Here, a genomic subset-selective variant of CODD-PCR was used because this methodology is capable of identifying novel sequences of genomic subsets in the detection of differentially expressed novel HB genes or transcription factors in the UB cells under conditions of tubulogenesis (Fig. 1B).
Figure 1.
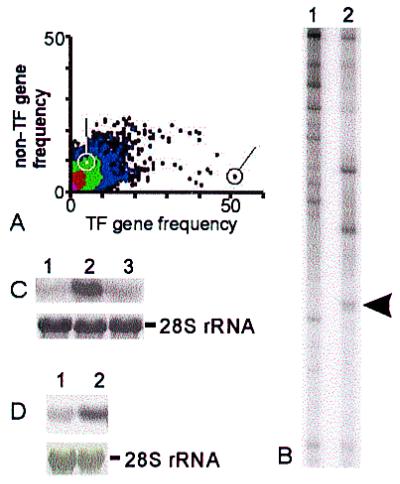
CODD-PCR and initial expression analysis. (A) Statistical design of differential display PCR primers. Gene frequency of 8-mer oligonucleotides in 103 homeobox and related mRNA sequences (x axis) vs. frequency in 4,347 nonhomeobox mRNA sequences (y axis). Relative gene frequencies of 8-mer ddPCR primer cores used for amplification shown for HB-selective (arrow) and human/mouse coding region-selective (circle) primers. Color code representing number of 8-mers at x–y intersection: black, 1; blue, 2–10; green, 11–100; red, 101–1,000; purple, >1,000. (B) Autoradiogram of ddPCR products separated on 6% denaturing polyacrylamide gel. Lanes: 1, no BSN-CM; 2, with BSN-CM. Bands representing up- as well as down-regulated sequences were subcloned (arrowheads) including the 122-bp fragment used in C (arrow). (C) Northern blot analysis of in vitro 3D UB cell culture model: probe is subcloned fragment from B. Lanes: 1, serum free; 2, BSN-CM; 3, 10% serum. (D) Northern blot analysis. UB cells in 3D culture treated with CHx as in B. Lanes 1 and 2, without and with BSN-CM, respectively.
The circadian clock gene Timeless (mTim, mammalian Timeless) thus was identified as a differentially expressed sequence in UB cells undergoing branching morphogenesis. In the embryonic mouse, mTim was shown to be highly expressed in a variety of epithelial tissues undergoing branching morphogenesis. Selective down-regulation of mTim RNA expression in cultured whole embryonic kidney explants showed a dramatic effect on kidney growth and branching of the UB. Selective down-regulation of mTim expression during culture of the isolated UB in the absence of mesenchyme likewise resulted in a profound inhibition of branching, indicating disruption of a program intrinsic to the branching bud. The pattern of embryonic expression and results found with selective down-regulation strongly suggest a role for mTim in epithelial morphogenesis and perhaps in branching per se.
Materials and Methods
3D Matrix Culture of UB Cells.
Culture of UB cells and stimulation by BSN-CM were performed as described previously (3). CHx (10 μg/ml) was included both to stabilize rare transcripts and to bias results toward early changes in transcription (7, 9). After 6 h, total RNA was prepared.
ddPCR: Primer Design.
Custom software (oddpcr 3, for Windows NT/98/95) was written in visual basic 5.0 (Microsoft) and used in the gene-frequency analysis of all oligomers of lengths 6–12 in a nonredundant database consisting of 103 murine HB-containing genes and 4,347 non-HB-related genes. The presence or absence (gene frequency) of oligomers in either HB-related transcription factors or the 4,347 non-HB genes were computed (Fig. 1A). Oligomers less than 8 nt (8-mer) long are found in approximately similar frequencies in divergent genomic subsets whereas oligomers of 10 or greater are vanishingly rare in most genes (data not shown).
To amplify novel transcripts, we coupled one fixed HB primer based on the most conserved region of the known mouse HB domains specifically with 8-mers, shown to be rare in known HB transcripts and yet very common in the database generally. Computer-simulated PCRs predicted those primers, which, when coupled with the fixed HB primer, yielded low numbers of amplicons, 100–600 bp, from the known HB genes. The 8-mers were extended with arbitrary tails to raise predicted annealing temperatures to >60°. The specific primers that amplified Timeless were HB primer, 5′-cttcatccgccggttctggaacca-3′, and non-HB primer, 5′-tggtgaccaagaag-3′.
Differential Display PCR: Amplification, Display, and Cloning.
Equal aliquots of cDNA were amplified by standard PCR technique and resolved on 6% denaturing polyacrylamide gels, and the bands were detected by autoradiography. Bands corresponding to products differentially expressed under conditions favoring tubulogenesis were excised, reamplified, subcloned, sequenced, and compared with available public databases (Fig. 8). cDNA clones corresponding to potentially novel transcription factors were used directly as probes in Northern and in situ hybridization expression analysis as described previously (10). Northern blots contained either 20 μg of total RNA per lane or 2 μg/lane poly(A)+ mRNA blots (CLONTECH). mTim 5′ and 3′ rapid amplification of cDNA ends (RACE) products were produced by using an adult mouse kidney lambda TriPlex library (CLONTECH). Independent clones were obtained from an adult mouse cDNA library (Life Technologies) by using the Gene Trapper system (Life Technologies).
Figure 8.
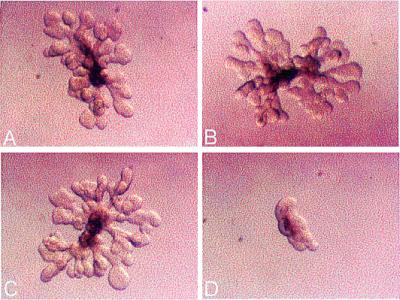
Antisense inhibition of rat Tim in isolated rat UB culture. (A) Control. (B) Missense ODN (1.5 μM; oligo M0). (C) Rat Tim sense ODN (1.5 μM; oligo S0). (D) Rat Tim antisense ODN (1.5 μM; oligo A0).
Antisense Oligodeoxynucleotide (ODN) Down-Regulation of mTim in Whole Cultured Embryonic Kidney and in the Isolated UB.
Whole embryonic kidneys were dissected from e13 rat embryos and cultured as described (5). Individual UBs were isolated from e13 kidney rudiments as described (5). Isolated UBs were cultured in Transwells (Falcon) with polycarbonate inserts layered with a mixture of type I collagen and Matrigel. Antisense and control ODN were added to the culture medium at a variety of concentrations, from 0.6 to 5.0 μM, for 3 days of culture. Experiments were performed in triplicate such that each experimental condition was represented by three separate kidneys. Kidneys were photographed directly by using a dissecting stereomicroscope and then stained with FITC-Dolichos Biflorus (DB) to highlight UB derivatives and fluorescent confocal images obtained. The number of terminal UB ampullae present in the images were counted by an observer blinded to the nature of the ODN treatment.
The following 24- to 25-mer ODN were used: A0, cacagttcatcatgtacaagtccat; Se0, atggacttgtacatgatgaactgtg; Sc0, acttttgatgcgtaaggataactgg; A1, aagggcgctacacgtggctagaag; Se1, cttctagccacgtgtagcgccctt; Sc1, gtaagcatgtaggacgcagcgcag; A2, ctccagaaggtttcctgccctgagc; and Sc2, tgatgagcatgctgattgctagata. The sequences correspond to the following positions on the rat Timeless sequence (GenBank accession no. AB019576): A0, 106; A1, 133 and incorporating a single base pair mismatch; and A2, 3320 and incorporating 2 bp mismatches. Missense ODN shared no homology with mammalian Tim or any other known mammalian sequence.
Multiplex PCR Quantification of rTim Using 18S rRNA Internal Controls.
The level of rat Tim (rTim) mRNA in whole embryonic kidneys was quantified relative to the level of 18S rRNA by using the Quantum 18S RNA Internal Standards kit (Ambion, Austin, TX). Primers for rat Timeless cDNA were: mr-time120f = 5′-gatgaactgtgaacttctagcc-3′ and mr-time561r = 5′-tgtcttcttcttgccgatcc-3′. The optimal ratio of competimer to 18S primer was found to be 17:3, and both rTim and 18S rRNA coamplified within a linear range between 32 and 38 amplification cycles. PCR was performed at 67°C annealing temperature with 1 min at 72°C extension time per cycle. PCRs incorporated [32P]dCTP, and the ethidium-stained bands were excised and quantified via scintillation counting.
Results
Identification of a Gene Product Differentially Expressed Under in Vitro Tubulogenesis Conditions.
Of 48 characterized, differentially expressed sequences, 39 were unique and represented 18 known genes and 21 novel sequences (data not shown). Of the novel amplicons, 11 had homology to transcription factors according to the blast family of programs, and a standalone implementation of blast-x preliminarily identified Hox-B9 as the best (albeit weak) match in the Mouse Unigene dataset for one 122-bp amplicon (Figs. 1B and 8). This amplicon was prioritized for cloning based on initial expression data (Fig. 1C) that confirmed the differential expression of the transcript in the UB/BSN cell culture model. Treatment of UB cells with BSN-CM in 3D culture resulted in up-regulation of a 4.4-kb transcript (Fig. 1C). A smaller, 2.4-kb transcript also was noted (see below). However, 10% serum, which sustains UB cell growth in 3D culture, did not significantly enhance the expression of the transcript, suggesting that specific, metanephric mesenchyme-derived factors (in BSN-CM), but not necessarily those that generally promote cell growth and viability, up-regulate its expression. The transcript also was up-regulated in 3D-cultured UB cells by BSN-CM in the presence of CHx, indicating that the candidate transcription factor behaves like an immediate early gene (IEG) (Fig. 1D) (7, 9, 11).
The Gene Product Is Developmentally Regulated During Kidney Organogenesis.
Cloning efforts included both 5′ and 3′ RACE reactions in an adult mouse testis library and independent screening of an adult mouse kidney library. A 761-bp 3′ RACE fragment initially was obtained and confirmed by sequence to overlap the predicted portion of the initial amplicon. Northern blots of whole mouse embryonic tissue probed with the 761-bp 3′-RACE fragment demonstrated a distinct peak in expression of the large transcript at e11, which was, notably, the time when both the UB and BSN cell lines were dissected from the embryonic kidney and is when branching morphogenesis of the UB begins in vivo (Fig. 2A).
Figure 2.

Survey of embryonic expression. (A) Whole mouse embryo [poly(A) RNA; CLONTECH] blot. Lanes: 1b, e7; 2, e11; 3, e15; 4, e17. Lane 1a is a dark exposure of lane 1b, more clearly demonstrating the presence of a 2.3-kb transcript. (B) In situ hybridization in e14.5 embryo with predominant expression in: 1, brain; 2, thymus; 3, lung; 4, liver; and 5, kidney. (C) In situ hybridization in e9.5 mouse embryo showing high levels of expression in: 1, neuroepithelium; 2, mandibular arch; 3, gut primordium; 4, liver primordium; and 5, intermediate mesoderm. Sense probes gave no detectable signal (data not shown).
In situ hybridization in embryonic mouse tissues revealed expression in e9.5 neural tissues, most notably in neural tube, and neural crest derivatives of the branchial arches. Expression also was seen at this time in the liver and gut primordia as well as the intermediate mesoderm (Fig. 2 C and D). At later times (e14–e16), expression was most strongly detected in branching epithelial tissues including kidney, liver, and lung, as well as thymus and brain (Fig. 2B). Closer examination of expression in embryonic kidney showed largely cortical expression in zones of active UB branching and nephrogenesis (Fig. 3 A and B). Transcripts were detected in both mesenchymal and UB-derived cells in this region (Fig. 3B). As in the embryo, both the UB and the mesenchymal BSN cell lines were shown to express both transcripts (Fig. 3C).
Figure 3.

Expression analysis in kidney by in situ hybridization. (A) e14.5 kidney. Transcript was expressed primarily in renal cortex. (B) Higher-magnification view of e14 kidney in situ hybridization. Dark-field photomicrograph of silver-grain signal has been falsely colored green and superimposed on the 7-μM hematoxylin-stained section. The transcript was detected in both UB and in condensing mesenchyme. Much less signal was detected in “loose” mesenchyme. Data shown are for 5′ probe specific for 4.4-kb isoform. No difference in expression pattern was noted for the 3′ dual-specificity probe (see Fig. 5 for details regarding probes). (C) Northern blot analysis demonstrating the presence of both large and small isoforms of Tim in UB cells (lane 1) and BSN cells (lane 2). (D) Northern blot analysis of total RNA in embryonic rat kidney. Lanes: 1, e13; 2, e15; 3, e17. Lane 4 is mouse kidney from adult multiple tissue Northern blot (Fig. 4).
Interestingly, the ratio of the two isoforms apparent on Northern analysis displayed developmental changes. In whole mouse embryo, the predominant transcript is 4.4 kb in apparent size, with a 2.4-kb transcript detectable on longer exposures (Fig. 2A). However, the majority of adult tissues predominantly express the smaller isoform (Fig. 4A). This ontogenic isoform switch also was apparent in embryonic kidney tissue in which both isoforms are expressed in the embryo whereas only the smaller isoform was detectable in the adult (Fig. 3D). In the adult mouse, Northern analysis indicated that the single tissue examined that abundantly and predominantly expressed the large isoform was testis (Fig. 4A). Interestingly, in situ hybridization revealed that the signal was largely, if not completely, localized to the basal layer of the seminiferous tubules (Fig. 4B).
Figure 4.
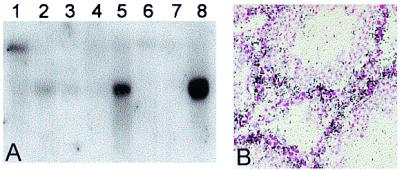
Expression in adult mouse tissues. (A) Northern blot analysis [poly(A)+ RNA; CLONTECH]. Lanes: 1, testis; 2, kidney; 3, skeletal muscle; 4, liver; 5, lung; 6, spleen; 7, brain; 8, heart. (B) In situ hybridization in adult mouse testis with 4.4-kb isoform-specific probe. Intense signal (black) was detected at developing spermatogonia in the basal layers of the seminiferous tubules.
Full-Length Cloning of Timeless and Identification of Its Small Transcript.
In a search for full-length clones in an adult mouse kidney library, 11 clones were identified, 4 of which were ≈2.3 kb long on insert analysis. During the process of cloning and characterization, other groups submitted sequences corresponding to the mammalian ortholog of the circadian clock gene mTim (refs. 12 and 13; accession no. AB019576, M. Okada, T. Shima, T. Matsuki, N. Okumura, Y. Isojima, K. Nagai, Y. Takayama, and K. Shimizu, unpublished data). Sequence analysis of our clone-A4 (GenBank accession no. AF126480) revealed that it corresponded to the 3′ 2,318 bp of the 4.4-kb mouse transcript (GenBank accession nos. AF098161 and AF071506) (Fig. 5A).
Figure 5.

mTim molecular analysis. (A) Location of probes used in these studies and overview of Tim/mTim-s sequence comparison. (B) Isoform-specific probes. Northern blot analysis with a probe predicted in this model (dual probe) to have dual specificity indeed detects both isoforms (lane 1) whereas a 5′-specific probe detected only the 4.4-kb isoform (lane 2). (C) Hydrophilicity database search using mTim-s as seed query (http://bioinformatics.weizmann.ac.il). The hydrophilicity profiles of mTim-s and WC-2 are highly similar. Yellow bars in A correspond to regions of >40% amino acid similarity between mTim-s and WC-2.
Several lines of evidence suggested that the 2.3-kb clone (mTim-s) represented a full-length, or nearly full-length, alternative transcript, including the presence of both 4.4- and 2.4-kb bands on Northern analysis (Figs. 1–4). In addition, a probe targeted to the mouse Tim sequence immediately 5′ to the predicted small isoform was specific for the large isoform whereas a probe targeted to the 3′ portion of mTim had dual specificity as predicted by the mTim-s sequence (Fig. 5 A and B). Moreover, the 4 largest of 11 isolated clones from the adult mouse kidney library were ≈2.3 kb in length. The predicted coding region, which terminates identically to the large isoform, corresponds to a 465-aa protein of approximately 50 kDa. In vitro transcription and translation of mTim-s from the pCMV Sport-2 plasmid revealed a major product at ≈48 kDa (data not shown). Although the differentially sized bands on Northern blot analysis produced by the two probes constrains the location of the alternative splice, the precise 5′ end, true initiation site, and sequence of residues in the small Tim protein remain to be defined.
Unlike many other clock-related proteins, the mTim amino acid sequence contains neither periodic acid nor basic helix–loop–helix domains and has no strong homologs in the GenBank database (12–14). Nevertheless, the nearest neighbor of mTim-s in terms of hydrophilicity is the Neurospora circadian protein WC-2 (Fig. 5C). Moreover, the hydrophilicity alignment of WC-2 with mTim largely overlaps the region corresponding to mTim-s, and the region of the mTim amino acid sequence corresponding to mTim-s contains extensive amino acid similarity (Fig. 5 A and C). This raises the intriguing possibility that mTim-s is a distant homolog of WC-2.
Selective Down-Regulation of Timeless Expression Inhibits Growth and UB Branching in Kidney Explants.
The widespread distribution of Timeless in embryonic epithelial tissues undergoing organogenesis suggested a direct developmental role for mTim. The initial formation of the metanephric kidney at e11 coincident with the highest level of expression of the 4.4-kb isoform of Tim in the mouse embryo (Fig. 2A) and the ontogenic switch from the large to small isoform in kidney (Fig. 3D), combined with the fact that we identified it as a differentially expressed gene product in an in vitro model for branching morphogenesis in the embryonic kidney, suggested that mTim may play a role in kidney development.
Antisense ODN technology has been used extensively to dissect molecular function in organ culture models of embryologic events (15–17). It is particularly useful in the case in which targeted molecules reside intracellularly, as is the case for transcription factors, where approaches such as the use of blocking antibodies are of little use. Nevertheless, conflicting results have been reported in the embryonic kidney and elsewhere (18, 19). We therefore constructed a large set of antisense and control ODN including a graded series of sequence mismatches for use in organ culture. In all, 8 separate ODN were used to treat 114 embryonic rat kidney (e13) rudiments in culture.
Antisense ODN targeting Tim consistently and profoundly disrupted the growth and pattern of branching morphogenesis normally observed in cultured kidney rudiments (Fig. 6 A–E). Control ODN with identical GC content (sense and missense) had an insignificant effect on the pattern of UB branching (Fig. 6 A–E). The effect was dose-dependent and observable at very low concentrations (Fig. 6 G and H). The effect was observed in ODN from two manufacturers by using both phosphorothioate and chimeric phosphorothioate-phosphate substitutions and representing three oligos targeting the 5′ as well as the 3′ end of the rat Tim sequence.
Figure 6.

Antisense inhibition of rat Tim in cultured whole embryonic kidney. (A–D) Whole e13 rat kidney explants were cultured for 3 days in control medium (A), 1.5 μM missense ODN (oligo M0) (B), 1.5 μM rat Tim sense ODN (oligo S0) (C), and 1.5 μM rat Tim antisense ODN (oligo A0) (D). (E) Summary of results, grouped by membership in control (C), antisense (A), sense (S), or missense (M) groups. The degree of branching morphogenesis of the developing UB was assessed by counting the number of terminal ampullae (the number of which doubles at each round of branching). (F) Summary of results incorporating sequence-mismatched oligos. The numbers on the horizontal axis indicate the number of mismatches. Missense and sense oligos (which are not predicted to bind the rat Tim sequence) may be viewed as having 10–11 matches predicted by chance alone and having roughly equal g, c, a, and t content. (G) Dose-response (μM) for antisense oligo A0. (H) Dose-response (μM) for antisense oligo A1.
Although antisense ODN were designed to interact with the target mRNA, sense and missense ODN also may interact with either the target or other mRNA. In this context, it is useful to more broadly consider the binding potential of the control ODN. First, potential control ODN with high-scoring matches to non-Tim RNA species in public databases were screened out by using custom software algorithms. Additionally, sense and missense ODN were evaluated for potential to bind anywhere along the Tim sequence, and the result was expressed as the number of mismatches; 0 mismatches indicated a perfect antisense oligo, and 10–11 mismatches being predicted by chance alone. It was found that, indeed, the sense and missense ODN were statistically unrelated to the antisense Tim sequence as they each contained 10–11 mismatches.
When all ODN, regardless of design intent, were considered strictly in terms of their potential to bind the rat Tim sequence, an impressive linear relationship emerged (Fig. 6F). The number of terminal ampullae present in cultured kidney rudiments displayed a remarkable inverse correlation with the number of mismatches incorporated into the ODN (Fig. 6F). A reduction in the number of ampullae indicates a reduction in the number of branching events in UB culture.
Multiplex PCR conditions were determined that allowed the comparison of rat Tim mRNA expression relative to the amount of 18S rRNA present in a sample (Fig. 7A) (20). The absolute level of ribosomal RNA species is remarkably invariant in many circumstances in contrast to many “control” mRNA species such as glyceraldehyde-3-phosphate dehydrogenase, actin, and ubiquitin (6, 21, 22). In the present experiments, treatment with a perfectly matched antisense ODN resulted in an 80% reduction in the amount of Tim RNA relative to sense-treated controls (Fig. 7A).
Figure 7.

Quantification of rat Timeless in ODN-treated embryonic kidneys. (A) Ethidium-agarose analysis of rat Tim and 18S rRNA amplification at 36 cycles. The 441-bp amplicon is from rat Tim, and the 324-bp amplicon is from 18S rRNA. Samples were from sense-treated kidneys (lane 1) or from antisense-treated kidneys (lane 2) as in Fig. 6. By scintillation counting of incorporated [32P]dCTP, Tim expression was inhibited by 80% in antisense-treated kidneys. (B) Differential-display PCRs from sense-treated (lanes S) and antisense-treated (lanes A) rat kidney cDNA. One sequence that was observed to decrease with antisense treatment (arrow) was subcloned and found to be Tim.
The expression of a large number of “control” mRNA may be surveyed by using the same differential display technique originally used to identify Tim. Nonspecific toxicity or problems with loading, reverse transcription, or amplification of samples presumably results in easily identifiable, apparent down-regulation of most mRNA species equally. We therefore amplified aliquots of cDNA obtained from sense- and antisense-treated kidney rudiments with the original ddPCR primer pair. The band patterns from the two samples were similar except for several up- as well as down-regulated sequences. Of 111 bands counted, 80 were unchanged, 19 decreased, and 12 increased. One dramatically down-regulated amplicon was found to be mTim (Fig. 7C). Thus, a gene product (mTim) that was shown by CODD-PCR to be selectively up-regulated in the UB cell culture model for branching morphogenesis was demonstrated, upon being selectively down-regulated in kidney organ culture (again by CODD-PCR by using the same primer set), to result in inhibition of UB branching morphogenesis, thereby “completing the experimental circle”.
Selective Down-Regulation of Timeless Expression Inhibits UB Branching in Isolated UB Culture.
Because UB branching morphogenesis depends on soluble factors derived from metanephric mesenchyme, and because mTim is found in both mesenchymal and UB cells, the marked effect of rat Tim down-regulation on UB morphology, in principle, could have been the result of either a direct effect on the UB or secondary to an effect in the mesenchyme. The recently developed method of isolated UB cultured in the absence of the mesenchyme offered the opportunity to examine the effect of Tim down-regulation in UB per se (5). The isolated UB were treated with either antisense or control ODN as in the whole kidney experiments. Antisense but not control ODN treatment dramatically inhibited growth and branching morphogenesis of the isolated UB, clearly implicating Tim in UB branching morphogenesis (Fig. 8). Together, these results indicate that Tim is a necessary component of the morphogenetic program leading to branching tubular structures in the UB.
Discussion
Direct as well as circumstantial evidence suggests that changes observed in the 3D tubulogenesis model are relevant to kidney development in vivo. Most notably, a factor(s) present in the BSN-CM is critical for the only organ culture system that supports extensive branching morphogenesis of the isolated UB (5). At the same time, the same BSN-CM is the only reported substance that will induce UB cells in 3D culture to form branching tubular structures with lumens (3). In addition, distinct patterns of gene expression are observed in the 3D tubulogenesis model that, in many cases, recapitulated previously described changes in gene expression during kidney development (4).
In these experiments we sought to identify novel transcription factors that were differentially expressed in the 3D tubulogenesis model. A variety of experimental variables were manipulated to increase the chance of success: choice of an early end point, inclusion of CHx, use of CODD-PCR technology, and statistical design of primers to favor novel transcription factors (Fig. 1). In the end, we identified a novel gene product, Timeless, that was not in our original database and was, in fact, novel at the time of isolation. The function of this gene product in mammals remains poorly understood.
One striking feature of our analysis was the high level of expression in embryonic epithelial tissues that develop through branching morphogenesis, such as kidney, lung, and liver (Fig. 2). In the kidney, mTim was found in zones of active branching and was accompanied by a developmental switch in isoform expression (Fig. 3). The function of the ontogenic switch remains unknown; however, a developmental role seems likely. These locations (kidney, lung, and liver) are the site of intense epithelial–mesenchymal interactions involving growth factor signaling and resulting in branching. Notably, we identified mTim in a similar context of soluble-factor stimulation of embryonic epithelial (UB) cells by mesenchymal (BSN) cells.
By virtue of demonstrated up-regulation in response to morphogenetic stimuli by soluble factors present in BSN-CM but not serum and a pattern of expression largely coinciding with organogenesis in epithelial tissues, it seemed reasonable to hypothesize that Tim is involved in the initial response of cells to mesenchymal soluble factors. Functional evidence of this link was provided by down-regulating Tim expression in the cultured embryonic kidney. This system has been used to define functional roles for morphogenetic molecules by using a variety of approaches including antisense ODN (15–17, 23). Nevertheless, differing results have been reported (18, 19). To ensure confidence in the present results, many antisense and control ODN were used, and 114 embryonic kidneys were analyzed. Antisense ODN, but not control ODN, reliably and significantly inhibited branching morphogenesis of the UB in cultured whole embryonic rat kidneys (Fig. 6). Similar results were obtained by using phosphorothioate and chimeric phosphorothioate-phosphate antisense ODN and also when targeting different regions of the mTim sequence. Furthermore, the ability of all tested ODN to inhibit UB branching correlated precisely with the binding potential of the ODN to Tim mRNA (Fig. 6). The marked changes in morphology induced by antisense ODN treatment were the result of selective down-regulation of Tim RNA as shown by quantitative multiplex PCR by using 18S rRNA internal controls as well as analysis of many mRNA species surveyed by CODD-PCR (Fig. 7).
The result of Tim down-regulation in whole kidney explants, in principle, was due either to an effect on mesenchymal cells or on the UB itself because Tim is expressed in both cell types of the embryonic kidney (Fig. 3). A morphologically comparable result was obtained in the isolated UB as with the whole embryonic kidney: antisense ODN treatment profoundly disrupted the course of UB branching morphogenesis (Fig. 8). The results do not rule out a Tim-dependent step in mesenchymal cells; however, it appears clear that there is, at the very least, a Tim-dependent morphogenetic pathway intrinsic to UB morphogenesis.
The precise role for mTim in this process remains to be defined. The core part of the program for the generation of an epithelial structure likely resides in the epithelial cell itself, although many soluble, cell surface, and extracellular matrix factors supply key modulatory stimuli and support a series of necessary links in a long chain of events (2). A disruption of any link might be expected to affect the final outcome of so highly specialized a structure as an epithelial tubule. Nevertheless, the pattern of mTim expression in the embryo, which is distinct from that in the adult in terms of organ specificity and isoform selection, taken together with the results of its selective down-regulation in embryonic organ culture models strongly suggest a role for Timeless in nephrogenesis and perhaps other epithelial organogenesis in which tubulogenesis and branching morphogenesis is central.
Genes that are induced in response to cell activation in the absence of new protein expression may be classified as immediate early genes (IEG). IEG represent a diverse group of proteins; canonical examples include fos, jun, jun-B, c-myc, and egr-1 (7, 24, 25). Many IEG are, or are part of, transcriptional activators. Among such IEG-like morphoregulatory transcription factors are several homeodomain and related proteins: Gnot1, goosecoid, and Oct-2, among others (26, 27).
Circadian rhythm proteins represent another context in which transcriptional activators are seen to behave as IEG. Genes with previous identities as IEG are induced in concert with circadian genes such as PER1 and PER2 in the central oscillator suprachiasmatic nuclei (20, 28, 29). More recently, clock proteins have been demonstrated to oscillate in mammalian peripheral tissues (30). The observation that some clock genes are inducible (in the presence of CHx) in a rat fibroblast serum shock model indicates that at least part of the peripheral circadian machinery is responsive to humoral factors (9).
Thus, some components of the circadian machinery behave like IEG and are coordinately up-regulated with known IEG in response to soluble factors. To the list of mammalian IEG we would add mTim. The present results also suggest differences in light entrainment in the suprachiasmatic nuclei as opposed to humoral factor entrainment in peripheral cells. Per proteins are robustly entrained by both stimuli whereas mTim is weakly, if at all, inducible by light in the mammalian suprachiasmatic nuclei but responds well to soluble factors in peripheral-type cells. By virtue of its lack of rhythmic expression, mTim has been proposed to play a merely facilitory, if any, role in the mammalian clock (31). It is quite possible that, in the evolutionary gulf between Drosophila and mammals, mTim (one or both isoforms) has taken on new and unexpected functions. This notion is supported by the fact that clock genes in general, and mTim in particular, display remarkable evolutionary divergence of sequence at the amino acid level. And, in evolutionary terms, all clock genes only recently have become common currency coincident with the rise of so-called “crown eukaryotes” (31). That this superkingdom corresponds roughly with multicellular organisms makes clock genes reasonable candidates for additional functions relevant to development. Consistent with a developmental role for genes involved in clock function or related to clock genes are the recent findings that the Caenorhabditis elegans heterochronic gene, lin-42, important in the worm developmental program, has high structural similarity to PER family members and also has a rhythmic expression pattern during development (32) and vrille, a transcription factor important for Drosophila development, is essential to a functional clock (33).
Our results suggest a key role for Tim in the response of the UB to growth factor-mediated morphogenetic stimuli. It is intriguing that the putative binding partners of mTim, the Per proteins, are members of the PAS–basic helix–loop–helix family of transcription factors, which includes the Drosophila genes trh and tgo. Both trh and tgo, along with the IEG blistered (mammalian ortholog of serum response factor), have been shown in genetic studies to direct the course of epithelial branching morphogenesis in the Drosophila tracheal system (1).
Acknowledgments
This work was supported by National Institute of Diabetes and Digestive and Kidney Diseases Grants DK-02392 (to R.O.S.) and DK-49517 and DK-54711 (to S.K.N.). K.T.B. is supported by a Scientist Development Award from the American Heart Association. M.P. was supported by the Deutsche Forschungsgemeinschaft.
Abbreviations
- CODD
codon optimized differential display
- IEG
immediate early gene
- BSN-CM
BSN-conditioned medium
- dd
differential display
- ODN
oligodeoxynucleotide
- CHx
cycloheximide
- UB
ureteric bud
- HB
homeobox
- 3D
three-dimensional
Footnotes
Data deposition: The sequence reported in this paper has been deposited in the GenBank database [accession no. AF126480 (small timeless; mtim-s)].
References
- 1.Metzger R J, Krasnow M A. Science. 1999;284:1635–1639. doi: 10.1126/science.284.5420.1635. [DOI] [PubMed] [Google Scholar]
- 2.Pohl M, Stuart R O, Sakurai H, Nigam S K. Annu Rev Physiol. 2000;62:595–620. doi: 10.1146/annurev.physiol.62.1.595. [DOI] [PubMed] [Google Scholar]
- 3.Sakurai H, Barros E J, Tsukamoto T, Barasch J, Nigam S K. Proc Natl Acad Sci USA. 1997;94:6279–6284. doi: 10.1073/pnas.94.12.6279. [DOI] [PMC free article] [PubMed] [Google Scholar]
- 4.Pavlova A, Stuart R O, Pohl M, Nigam S K. Am J Physiol. 1999;277:F650–F663. doi: 10.1152/ajprenal.1999.277.4.F650. [DOI] [PubMed] [Google Scholar]
- 5.Qiao J, Sakurai H, Nigam S K. Proc Natl Acad Sci USA. 1999;96:9330–9335. doi: 10.1073/pnas.96.13.7330. [DOI] [PMC free article] [PubMed] [Google Scholar]
- 6.Lopez-Nieto C E, Nigam S K. Nat Biotechnol. 1996;14:857–861. doi: 10.1038/nbt0796-857. [DOI] [PubMed] [Google Scholar]
- 7.Edwards D R, Mahadevan L C. EMBO J. 1992;11:2415–2424. doi: 10.1002/j.1460-2075.1992.tb05306.x. [DOI] [PMC free article] [PubMed] [Google Scholar]
- 8.Altschul S F, Madden T L, Schaffer A A, Zhang J, Zhang Z, Miller W, Lipman D J. Nucleic Acids Res. 1997;25:3389–3402. doi: 10.1093/nar/25.17.3389. [DOI] [PMC free article] [PubMed] [Google Scholar]
- 9.Mahadevan L C, Willis A C, Barratt M J. Cell. 1991;65:775–783. doi: 10.1016/0092-8674(91)90385-c. [DOI] [PubMed] [Google Scholar]
- 10.Pavlova A, Sakurai H, Leclercq B, Beier D R, Yu A S L, Nigam S K. Am J Physiol Renal Physiol. 2000;278:F635–F643. doi: 10.1152/ajprenal.2000.278.4.F635. [DOI] [PubMed] [Google Scholar]
- 11.Balsalobre A, Damiola F, Schibler U. Cell. 1998;93:929–937. doi: 10.1016/s0092-8674(00)81199-x. [DOI] [PubMed] [Google Scholar]
- 12.Sangoram A M, Saez L, Antoch M P, Gekakis N, Staknis D, Whiteley A, Fruechte E M, Vitaterna M H, Shimomura K, King D P, et al. Neuron. 1998;21:1101–1113. doi: 10.1016/s0896-6273(00)80627-3. [DOI] [PubMed] [Google Scholar]
- 13.Zylka M J, Shearman L P, Levine J D, Jin X, Weaver D R, Reppert S M. Neuron. 1998;21:1115–1122. doi: 10.1016/s0896-6273(00)80628-5. [DOI] [PubMed] [Google Scholar]
- 14.Koike N, Hida A, Numano R, Hirose M, Sakaki Y, Tei H. FEBS Lett. 1998;441:427–431. doi: 10.1016/s0014-5793(98)01597-x. [DOI] [PubMed] [Google Scholar]
- 15.Quaggin S E, Yeger H, Igarashi P. J Clin Invest. 1997;99:718–724. doi: 10.1172/JCI119216. [DOI] [PMC free article] [PubMed] [Google Scholar]
- 16.Rothenpieler U W, Dressler G R. Development. 1993;119:711–720. doi: 10.1242/dev.119.3.711. [DOI] [PubMed] [Google Scholar]
- 17.Kanwar Y S, Kumar A, Yang Q, Tian Y, Wada J, Kashihara N, Wallner E I. Proc Natl Acad Sci USA. 1999;96:11323–11328. doi: 10.1073/pnas.96.20.11323. [DOI] [PMC free article] [PubMed] [Google Scholar]
- 18.Durbeej M, Soderstrom S, Ebendal T, Birchmeier C, Ekblom P. Development. 1993;119:977–989. doi: 10.1242/dev.119.4.977. [DOI] [PubMed] [Google Scholar]
- 19.Sariola H, Saarma M, Sainio K, Arumae U, Palgi J, Vaahtokari A, Thesleff I, Karavanov A. Science. 1991;254:571–573. doi: 10.1126/science.1658930. [DOI] [PubMed] [Google Scholar]
- 20.Shigeyoshi Y, Taguchi K, Yamamoto S, Takekida S, Yan L, Tei H, Moriya T, Shibata S, Loros J J, Dunlap J C, et al. Cell. 1997;91:1043–1053. doi: 10.1016/s0092-8674(00)80494-8. [DOI] [PubMed] [Google Scholar]
- 21.Spanakis E. Nucleic Acids Res. 1993;21:3809–3819. doi: 10.1093/nar/21.16.3809. [DOI] [PMC free article] [PubMed] [Google Scholar]
- 22.Bhatia P, Taylor W R, Greenberg A H, Wright J A. Anal Biochem. 1994;216:223–226. doi: 10.1006/abio.1994.1028. [DOI] [PubMed] [Google Scholar]
- 23.Liu Z Z, Wada J, Alvares K, Kumar A, Wallner E I, Kanwar Y S. Kidney Int. 1993;44:1242–1250. doi: 10.1038/ki.1993.375. [DOI] [PubMed] [Google Scholar]
- 24.Lau L F, Nathans D. Proc Natl Acad Sci USA. 1987;84:1182–1186. doi: 10.1073/pnas.84.5.1182. [DOI] [PMC free article] [PubMed] [Google Scholar]
- 25.McMahon A P, Champion J E, McMahon J A, Sukhatme V P. Development. 1990;108:281–287. doi: 10.1242/dev.108.2.281. [DOI] [PubMed] [Google Scholar]
- 26.Kendall G, Brar-Rai A, Ensor E, Winter J, Wood J N, Latchman D S. J Neurosci Res. 1995;40:169–176. doi: 10.1002/jnr.490400205. [DOI] [PubMed] [Google Scholar]
- 27.Tadano T, Otani H, Taira M, Dawid I B. Dev Genet. 1993;14:204–211. doi: 10.1002/dvg.1020140307. [DOI] [PubMed] [Google Scholar]
- 28.Albrecht U, Sun Z S, Eichele G, Lee C C. Cell. 1997;91:1055–1064. doi: 10.1016/s0092-8674(00)80495-x. [DOI] [PubMed] [Google Scholar]
- 29.Morris M E, Viswanathan N, Kuhlman S, Davis F C, Weitz C J. Science. 1998;279:1544–1547. doi: 10.1126/science.279.5356.1544. [DOI] [PubMed] [Google Scholar]
- 30.Zylka M J, Shearman L P, Weaver D R, Reppert S M. Neuron. 1998;20:1103–1110. doi: 10.1016/s0896-6273(00)80492-4. [DOI] [PubMed] [Google Scholar]
- 31.Dunlap J C. Cell. 1999;96:271–290. doi: 10.1016/s0092-8674(00)80566-8. [DOI] [PubMed] [Google Scholar]
- 32.Jeon M, Gardner H F, Miller E A, Deshler J, Rougvie A E. Science. 1999;286:1141–1146. doi: 10.1126/science.286.5442.1141. [DOI] [PubMed] [Google Scholar]
- 33.Blau J, Young M W. Cell. 1999;99:661–671. doi: 10.1016/s0092-8674(00)81554-8. [DOI] [PubMed] [Google Scholar]