Abstract
We describe the use of H/D amide exchange and electrospray ionization mass spectrometry to study, in organic solvents, the pentadecapeptide gramicidin as a model for protein self association. In methanol-OD, all active H’s in the peptide exchange for D within 5 min, indicating a monomer/dimer equilibrium that is shifted towards the fast-exchanging monomer. H/D exchange in n-propanol-OD, however, showed a partially protected gramicidin that slowly converts to a second species that exchanges nearly all the active hydrogens, indicating EX1 kinetics for the H/D exchange. We propose that this behavior is the result of slower rate of unfolding in n-propanol compared to that in methanol. The rate constant for the unfolding of the dimer is the rate of disappearance of the partially protected species, and it agrees within a factor of two with a value reported in literature. The rate constant of dimer refolding can be determined from the ratio of the rate constant for unfolding and the affinity constant for the dimer, which we determined in an earlier study. The unfolding activation energy is 20 kcal mol-1, determined by performing the exchange experiments as a function of temperature. To study gramicidin in an even more hydrophobic medium than n-propanol, we measured its H/D exchange kinetics in a phospholipids vesicle and found a different H/D amide exchange behavior. Gramicidin is an unusual peptide dimer that can exhibit both EX1 and EX2 mechanisms for its H/D exchange, depending on the solvent.
Keywords: Gramicidin, n-propanol, vesicles, H/D exchange, EX1, EX2, ESI-Mass Spectrometry, mathematical modeling
Introduction
Gramicidin, a well-studied membrane peptide [1-3], self associates spontaneously in certain media. As a 15-residue membrane peptide with alternating L and D amino acids, it is hydrophobic and can serve as an antibiotic. Its hydrophobicity is revealed by its amino-acid sequence, HCO-L-Val1-Gly2-L-Ala3-D-Leu4-L-Ala5-D-Val6-L-Val7-D-Val8-L-Trp9-D-Leu10-L-Xxx11-D-Leu12-L-Trp13-D-Leu14-L-Trp15-NHCH2CH2OH where Xxx is Trp in gramicidin A (GA), Phe in gramicidin B (GB), and Tyr in gramicidin C (GC) [4]. For approximately 5% of the gramicidins, Val1 is replaced with Ile, and this form is normally referred to as IGA. The active state of all gramicidins is a non-covalently bound dimer that binds selectively Na+, K+, and other monovalent cations [3]. Its small size combined with its regular and stable dimeric structure have made it tractable for study in organic solvents and model membranes with 2D and 3D NMR, x-ray crystallography, and CD (for reviews, see [1-3]
Given its propensity to self associate, gramicidin presents an opportunity to implement a mass spectrometric approach to probe the mechanism of amide exchange in small hydrophobic peptides. Of the two mechanisms for exchange (EX1 and EX2), we expect that a small, self-associating peptide should exchange via the EX1 mechanism in a relatively hydrophobic medium; that is, its rate of refolding would be slower than the rate of amide exchange. EX1 exchange typically produces a bimodal distribution that represents the protected folded species and the completely exchanged species, which is formed as a result of unfolding [5]. With time, the protected species disappears, giving way to the completely exchanged species, and from the rate of disappearance of the protected species, one can calculate the rate of unfolding of the peptide [6, 7]. In contrast, when the rate of refolding is faster than the rate of amide exchange, an EX2 mechanism of exchange applies, and there is only one species in the exchange profile whose mass increases with time [8, 9]. A temperature study of an EX1 mechanism of exchange should afford the activation energy for unfolding of the dimer.
We also wished to test whether mass spectrometry can be utilized to compare gramicidin in solution and in vesicles. In the latter, gramicidin exists as a head-to-head, single-stranded dimer (known as the “channel” form) as opposed to a double-stranded helical dimer (“pore” form) in organic solvents [10, 11]. Encouraged by successes in similar studies on peptides in vesicles [12-15], we investigated H/D amide exchange of gramicidin held in a phospholipid vesicle.
Gramicidin is of broader interest than subject for mass spectrometry development because it is a model for self association of peptides and proteins. Protein-protein interactions are crucial for transport of electrons, signal transduction, and antigen-antibody interactions [16-18]. To identify self interactions and to determine their specificity, thermodynamics, and kinetics, smaller systems are of interest because they reproduce the structural, electronic and catalytic properties of larger systems. Moreover, they are more amenable to experimentation [19-21]. For example, trans-membrane peptides that mediate various biological activities can function as models for protein/protein interactions and self-association. The hydrophobic nature of melittin, alamethicin, and leucine zippers causes them to oligomerize in solution [22, 23], diminishing unfavorable interactions of non-polar residues with the solvent. Thus, they too are good models for investigating protein interactions.
We previously reported that the amount of self-assembled gramicidin dimer depends on the media in which it exists [24]. Following that work, we developed a mathematical model for calculating affinity constants from the self-titration of gramicidin [25]. We now extend those studies by combining H/D amide exchange [8, 9, 26, 27] and mass spectrometry to probe the properties and dynamics of the gramicidin dimer. The kinetics of exchange should be a test of structure because they reveal the folding and H-bonding status of the peptide or protein in a complex [8, 27]. Moreover, a small peptide that shows both EX1 and EX2 mechanisms of exchange is unusual, and the use of mass spectrometry to probe this behavior is of interest.
Materials and Methods
Gramicidin A was purchased from ICN Biochemicals (Costa Mesa, CA) and used without further purification. The solvents methanol, methanol-OD and n-propanol were purchased from Sigma-Aldrich (Milwaukee, WI). n-Propanol-OD was purchased from Cambridge Isotope Laboratories (Andover, MA). Dimyristoyl phosphotidyl choline (DMPC) was from Avanti Polar Lipids (Alabaster, AL).
Mass spectra were acquired by electrospray ionization from organic solvents by using a Micromass-Q-Tof-Ultima (Micromass, Manchester, UK), consisting of a quadrupole (Q) mass analyzer, a quadrupole collision cell, and a second-stage time-of-flight (TOF) analyzer, operated in the positive-ion mode. The solvent for ESI was that in which gramicidin had been incubated prior to the mass spectrometry experiment. To generate sodium-bound gramicidin ions, the organic solvent was saturated with the sodium salt, as described in [24]. The solution was diluted in the deuterated solvent and exchange-in was followed as a function of time. The ESI conditions were optimized to give the highest sensitivity detection of the dimer in the gas phase. The needle voltage was set to 3 kV, and the cone voltage was 90 V. The temperature of the source block and for desolvation was 90 °C. The flow rate was 10 uL/min. All parameters (e.g., aperture to the TOF, transport voltage, offset voltages) were optimized to achieve maximum signal and a mass resolving power of 10,000 (full width at half maximum).
The mass spectra on the vesicle suspension were acquired in the linear ion trap portion of a Thermo Finnigan LTQ-FT (San Jose, CA), operated in the positive-ion mode. The ESI conditions were optimized for the highest sensitivity detection of the (M + 2Na)2+ by using the autotune function on the LTQ. The spray and the capillary voltages were set to 5 kV and 46 V, respectively, and the capillary temperature was 200 °C, and a flow rate of 5 μL/min was used.
The vesicles were synthesized using the methods described in [28] to give presumably gramicidin in the channel conformation. Gramicidin (1 mg) and dimyristoyl phosphotidyl choline (DMPC) (1:8 molar ratio) were dissolved in 1 mL of trifluoroethanol (TFE) followed by evaporation of the solvent for 24 h. The dried mixture was vortexed with 1 mL of 10 mM NH4OAc containing 0.1 mM NaI for ~ 1 h. The suspension was then extruded through a 100 nm filter, using an Avanti Extruder (Avanti Polar Lipids, Alabaster, AL), for 15-cycles to obtain a symmetric distribution of large unilamellar vesicles (LUVET). Both hydration and extrusion were performed at a temperature (25 °C) higher than the gel-to-liquid phase transition temperature of the phospholipid (DMPC, 23 °C).
The vesicles were examined for symmetry and distribution using dynamic light scattering (DLS) to reveal hydrodynamic diameter distributions. A Brookhaven Instruments Co. (Holtsville, NY) DLS system consisting of a model BI-200SM goniometer, a model EMI-9865 photomultiplier, and a model 95-2 Ar ion laser (Lexel Corp., Palo Alto, CA) operated at 514.5 nm was employed. All measurements were made at 20 ± 1 °C. Scattered light was collected at scattering angle 90°. The system’s digital correlator was operated with 522 channels, ratio channel spacing, initial and final delay settings between 1.4 μs and 10 ms, respectively, and duration of 10 min. A photomultiplier aperture of 200 or 400 μm was used, and the incident laser intensity was adjusted to obtain a photon-counting rate of 200 to 300 Kcps. Only measurements for which the measured and calculated intensity autocorrelation function agreed to within 0.1% were used to calculate hydrodynamic diameters. Calculations of the hydrodynamic diameter distribution from measured intensity autocorrelation functions were performed with the ISDA software package (Brookhaven Instruments Co., Holtsville, NY), which employed single exponential fitting, cumulants analysis, and non-negatively constrained least squares (NNLS), and continuous regularization (CONTIN) analysis routines. The reported hydrodynamic diameter distribution averages are mean values of a minimum of three determinations.
H/D exchange
H/D exchange in organic solvents was started by diluting a concentrated solution (2.5 mM) of gramicidin in protiated solvent to 50 μM with deuterated solvent. The kinetics of exchange was then followed by injecting the deuterated sample into the mass spectrometer. The exchange was not quenched by decreasing the pH as quenching results in dimer dissociation. The deuterium isotope distribution of the dimer was obtained by removing the C-13 and N-15 distribution from the observed distribution and studied as a function of time.
For experiments in vesicles, amide exchange was started by diluting the vesicle suspension into deuterated ammonium acetate. After various times of exchange, the exchange was quenched by diluting by 5 fold in an ice-cold acetonitrile/water/FA = 49/50/1 to a final gramicidin concentration of 10 μM, and the solution was injected into the mass spectrometer. Quenching the exchange caused dissociation of the dimer, but it was necessary to liberate it from the bilayer and to measure its D distribution. The effectiveness of the quench solution was tested by quenching a completely exchanged gramicidin solution (obtained by performing the forward exchange for ~ one week) and measuring the number of deuteriums back exchanged as a function of time. Three to four deuteria back exchanged with hydrogens after 1 min of quench, increasing to ~ 6 after 6 min (based on the centroid of the distribution). Those deuteriums in gramicidin that back exchanged may be the two terminal active ones, that are expected to be fast, and the four side chain hydrogens. The time required from quench to obtaining a product-ion spectrum took less than 4 min and, thus, back exchange of amide hydrogens was not a serious issue.
Mathematical modeling
Information about protection of amide sites from the kinetics of deuterium exchange was extracted from the raw spectral profiles in two steps at each time point during the exchange. The first step involved peak finding and peak-area calculation. The pattern of peaks, one peak per Dalton starting at the monoisotopic mass, was found in the spectrum at each time point. The beginning and end of each peak interval was marked, and the spectral intensities between the marks were summed to give the total area of a “peak.” The mass centroid of the intensities between the marks was computed to check whether the peak pattern finding was working properly. The ordered list of peak areas, starting with the area for the peak at the monoisotopic mass, gave the overall isotopic distribution for the second step.
The method used for the second step depended on whether a deuterium distribution was sought or quantitation of population components was to be done. The calculation of the discrete deuterium distribution (hereafter referred to as D), displayed later in Figures 3 and 4 made use of a mixture model based on two components. D, which was incorporated into the isotopic distribution of the first of the two components, was used to model the deuteration behavior of the homo dimer of the gramicidin A (GA/GA) component. The second component was required because there was overlap of peaks from the homo dimer and a hetero dimer of isoleucine-gramicidin A and gramicidin A (IGA/GA) (14 u higher). The mass separation of 14 u was insufficient to prevent overlap of the partially protected form of IGA/GA with the more highly deuterated form of the homo dimer, GA/GA, which was formed at long exchange times. The dynamics of unfolding and deuteration of the hetero dimer were assumed to be the same as for the homo dimer, a reasonable assumption given that only one amino acid at the N-terminus of the monomers is different. As a result, D of GA/GA was use to model D of IGA/GA (the hetero dimer). For each of the two components of the mixture, the isotopic distribution was constructed as the discrete convolution [29] of the theoretical natural isotopic distribution for that component (either the homo dimer or the hetero dimer) and the postulated D. The theoretical natural isotopic distributions were used in this calculation because the experimental distributions could not always be obtained reliably owing to counting noise.
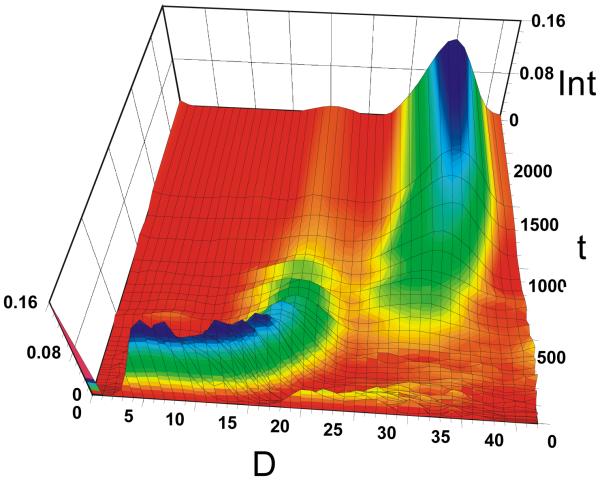
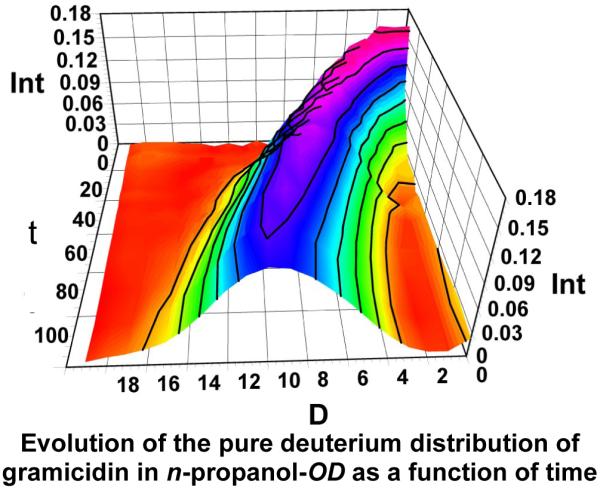
Figure 3.
3D plot of the evolution of D-distribution as a function of time for 2 h following mixing in n-propanol-OD. Removing the native C-13 isotope distribution from the data at all the time points reveals an envelope that represents the deuterium distribution. Int is signal intensity, D is the number of deuteria taken up by the dimer, and t is the time of exchange in min.
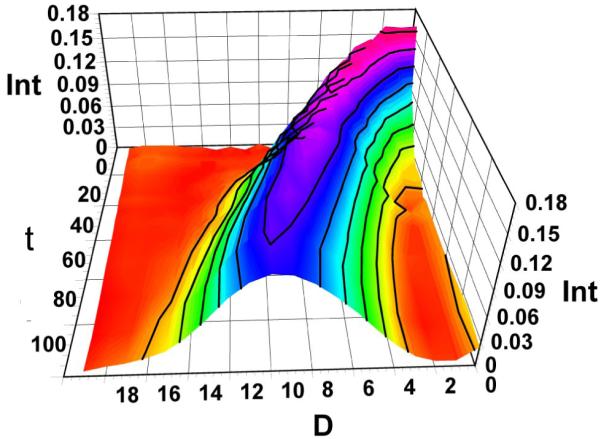
Figure 4.
Three-dimensional view of the time-dependent evolution of the D-distribution for HDX of (GA2 + 3Na)3+ in n-propanol-OD. The plot shows the evolution of a second-species at long times. Int is signal intensity, D is the number of deuteria taken up by the dimer, and t of exchange is time in minutes. The low intensity distributions at approximately 20 D’s at t = 0 may represent an impurity.
A nonlinear least squares search was used to obtain D. For each trial of the search, the coordinates of D were postulated by the search algorithm in their role as search parameters. The isotopic distributions of the homo and hetero dimers were calculated from this. The hetero dimer isotopic distribution was weighted by a postulated factor (a searched parameter) and then added to the homo dimer distribution to obtain an over all distribution that was compared to the order list of peak areas. The coordinates of D were constrained to be non-negative.
When step 2 was used for quantitation to obtain the fraction of species 1 as shown in Figure 5 from the list of peak areas obtained in step one, it made use of a mixture model based on four components. This version of step 2 differs from the version to calculate D in that the hydrogen-deuterium distributions are constrained to a relatively narrow class of shapes. Two distributions were required to model the behavior of the homo dimer (GA/GA), one represented a population component that exchanged slowly over time, and the second was of a population component corresponding to rapid exchange. Two other distributions were required to model the behavior of the hetero dimer; again, one representing a slow- and the other a fast-exchanging population.
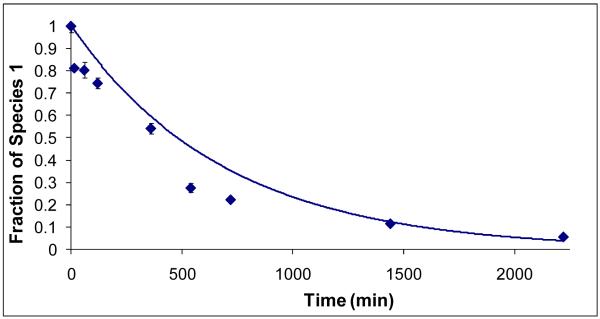
Figure 5.
Disappearance of the partially protected species, representing unfolding of the dimer. The points are the experimental data, and the curve is the first order kinetic fit to the data.
For each of the four components of the mixture, the distribution was constructed as the discrete convolution [29] of the theoretical natural isotopic distribution for that component (either the homo or the hetero dimer) and a postulated hydrogen-deuterium distribution (as before, the dynamics of unfolding and deuteration of the hetero dimer were assumed to be the same as for the homo dimer). As a consequence, there are only two postulated hydrogen-deuterium distributions that contribute to the isotopic distributions of the four components; one for the slow- and one for the fast-exchanging component. Each of the two postulated hydrogen-deuterium distributions was weighted by fit variables. These two fit variables were used for quantitation of the slow- and fast-exchanging components.
Three stages of nonlinear least squares searches were used to obtain weights for the two hydrogen-deuterium distributions. In each search, the weighted superposition of the four component isotope distributions was fitted to the list of peak areas obtained in step one. Each stage employed a model from a hierarchy of models [30, 31] that increased in detail, moving from the simplest to the most detailed. This strategy improved search efficiency, avoided false minima, and minimized the effect of different search starting values. In each trial of the three stages, each of the four component distributions was constructed by convolving the appropriate theoretical natural isotopic distribution with the appropriate model of a hydrogen-deuterium distribution. The first stage model placed the active hydrogens into one group where each had the same probability of deuteration, and resulting in a binomial distribution. This search was started with a probability of deuteration calculated from formula based on an approximate interpretation of the list of peak areas. The second-stage model divided the active hydrogens into three groups; the active hydrogens of each group were assumed to have the same probability of exchanging for a deuterium. Each group produced a binomial distribution, and these were convolved to give an overall hydrogen-deuterium distribution for the active sites in all three groups. This search was started with the site deuteration probability of each group set to the result of the first stage. For the third and the final stage model, each active hydrogen was modeled with a separate probability of deuteration. The hydrogen-deuterium distributions for the active hydrogens were then convolved to give the overall hydrogen-deuterium distribution for all the active sites. The start value for the probability of deuteration at each site was set to the resulting value for the group to which the site belonged in the second stage.
These calculations were performed in Mathcad 2001 (MathSoft, Inc., Cambridge, MA).
Results and Discussion
We reported previously that the homo dimer of gramicidin can be introduced by ESI into the gas phase of a mass spectrometer and that its dimerization depends on the dielectric constant of the solvent and the nature of the metal ion used in dimer binding [24]. In a sequel paper, we modeled the data for a self-titration of gramicidin to obtain the affinity constant for the dimerization and found that it agreed well with the literature values [25]. Here we show that mass spectrometry, H/D exchange (HDX), and mathematical modeling can be utilized to investigate the dynamics of the dimer in simple alcohol solvents and vesicles.
H/D exchange in methanol
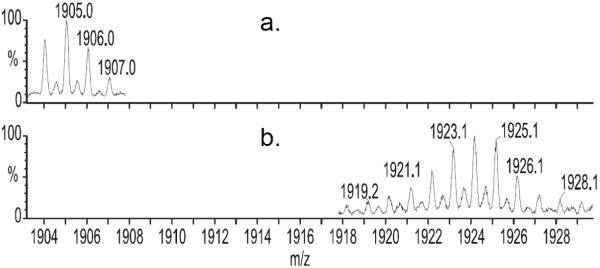
We initiated HDX by diluting a solution of gramicidin in methanol with methanol-OD and followed the uptake of deuterium by injecting aliquots of the exchanging solution into the mass spectrometer. We chose not to quench the HDX to preserve the dimer in the gas phase. The mass spectrum in pure methanol (Figure 1a) and at one time point during exchange (Figure 1b) show that rapid exchange of active hydrogens occurs as can be seen by comparing the isotope distribution. The mass resolving power of the Q-Tof mass spectrometer is sufficient (~ 10,000, FWHM) to distinguish the singly charged monomer and the doubly charged dimer because the dimer appears, in part, at half m/z values. Considering the m/z of the isotope distribution centroid, we see that ~90% of all the active hydrogens (21 per monomer, 42 per dimer) of gramicidin are exchanged for deuteriums within ~ 5 min. The dimer, which is represented by the smaller peaks at half m/z, is also ~ 90% exchanged, taking up twice the number of deuteriums as the monomer. The number of peaks in the dimer distribution is approximately twice that of the monomer, which is expected because the dimer has twice as many active hydrogens.
Figure 1.
Mass spectral region showing (M + Na)+ and (M2 + 2Na)2+ of gramicidin A in methanol before (a.) and after (b.) 5 min of exchange in methanol-OD. The data, acquired ~ 5 min after mixing, show nearly complete exchange of the amide hydrogens in the molecule.
The exchange phenomena can be explained by considering that the equilibrium in solution is represented by equation 1,
| (1) |
where M is the monomer and D the dimer. In methanol, the equilibrium is shifted towards the monomer. Assuming rapid H/D exchange of the monomer, we would expect that the dimer in a few cycles of dissociating-reassociating would exchange twice as many active hydrogens as the monomer, and this was observed.
H/D exchange in n-propanol
To study the dimer under conditions that are stabilizing, we chose n-propanol because the dimer is the predominant species in this solvent [24, 32]. The ESI spectrum of gramicidin from n-propanol, generated using the conditions described in the Methods section, shows three distinct regions: a doubly charged monomer, a doubly charged dimer and a triply charged dimer [24]. We use trace amounts of Na+ to charge the gramicidin molecule in our “native spray” from propanol. Adding an acid to form H+ adducts disrupts the dimer, defeating our goal of using propanol as solvent to observe the gramicidin dimer in the gas phase.
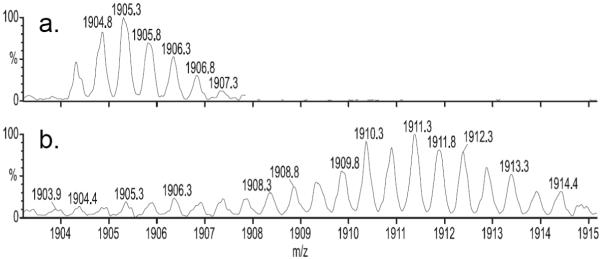
The (M2 + 2Na)2+ region of the ESI mass spectrum in n-propanol-OH contains peaks representing mainly the dimer (Figure 2a), with little interference from peaks representing the singly charged monomer [24]. This allowed us to follow the H/D exchange of the dimer in n-propanol-OD in a similar way to that in methanol-OD. After 1 h of exchange (Figure 2b), the center of the isotopic distribution for the (M2 + 2Na)2+ had shifted, revealing that only 12 of a possible 42 active H’s had exchanged. The dimer in n-propanol is more protected (has more H bonds) than that in methanol. The deuterium distribution also broadens with time as would be expected from fluctuation effects (Figure 3).
Figure 2.
(M2 + 2Na)2+ region of gramicidin A exchanging in propanol before (a.) and after (b.) 1 h of mixing in n-propanol-OD. The data show the uptake of ~ 12 D’s out of a possible 42 in the dimer.
After approximately 3 h of exchange in n-propanol, the isotope distribution of a protected dimer began to disappear and was replaced by those for a second dimer that had undergone nearly complete exchange (Figure 4). The result was an overlap of the completely exchanged isotope/deuterium distribution for homo dimer of gramicidin A with the protected distribution of hetero dimer of isoleucine-gramicidin A and gramicidin A. This overlap could not be avoided because commercial gramicidin A, although 90% pure, contains a small amount of isoleucine gramicidin A. We had two choices; either we could purify the gramicidin sample, which is expected to be difficult, or accommodate the overlap with mathematical modeling. We were able to do the latter by accounting for the contribution to the isotope profile at any time from the hetero dimer and follow the behavior of the homo dimer alone by extracting the appropriate distribution. This was accomplished using the algorithm described in the Materials and Methods section.
Obtaining the D distribution
The distribution of peaks in Figure 2b represents both the ions containing natural isotopic abundances and those enriched with deuterium. During HDX of gramicidin, the distribution of isotope peaks broadens relative to the natural isotopic distribution owing to the incorporation of deuterium. The width of the distribution, in addition to its center m/z, is structurally informative; a broader distribution implies more conformational flexibility or an increased number of conformations in solution [33, 34]. To understand the extent of broadening owing to exchange of gramicidin A alone, we removed both the contribution of the hetero dimer and the theoretical natural isotope distribution from the measured distribution to obtain the deuterium distribution only (called D; see Materials and Methods section for details).
Exchange at long times
After approximately 3 h of exchange in n-propanol-OD, the new, fully exchanged species had appeared. This is seen in Figure 4, a 3D plot of the D distribution of the triply charged dimer as a function of time. The doubly charged dimer follows a similar pattern. The deuterium uptake near t = 0 represents the first time point we could obtain. As t increases, deuterium uptake increases to nearly 18. We did not try to identify the sites by MS/MS given that the probability of scrambling is high. The species showing the smaller D uptake clearly gives way to the new dimeric species that undergoes nearly complete HDX of active hydrogens. The unfolding of the dimer is much slower in n-propanol than in methanol.
The appearance a second distribution provides the opportunity to calculate thermodynamic and kinetic properties of the dimer. In n-propanol, the slower association of monomer to reform dimer allows us to observe this species. Once a monomer is formed, however, it undergoes rapid HDX and then reassociates to a dimer that has all of its active hydrogens replaced by deuteria.
Calculation of rate constants
The time-dependent integrated signal intensities of the two D distributions (Figure 5) can be accommodated by using a first-order reaction kinetic model. The rate constant for the disappearance of the protected species is that for unfolding (dissociation) of the dimer; its value is 4.0 ± 0.8 × 10⁻⁵ s-1. This value compares well with a literature value of 8 × 10⁻⁵ s-1, which was obtained by using HPLC and fluorescence [32]. The agreement demonstrates the utility of mass spectrometry and HDX for determining the rate constant for unfolding of dimer of this type.
We reported previously [25] the affinity constant for dimerization by conducting a “self titration” of gramicidin in n-propanol and modeling its appearance. Using that affinity constant (5 × 10⁴), which also agrees well with a literature value, we calculated the rate constant for refolding (association) to be 2 s-1 M-1. For this approach to be valid, the assumption that the complex undergoes exchange via an EX1 mechanism must be satisfied. Proteins typically undergo exchange via an EX2 mechanism, and methods like PLIMSTEX and SUPREX were developed for calculating affinity constants in these cases [35]. If the EX1 mechanism of exchange does not apply, it can be sometimes induced in proteins by varying pH and temperature or by adding denaturant [6, 36]. For gramicidin in n-propanol, the rate of exchange is clearly faster than the rate of refolding, as is the requirement for an EX1 mechanism.
Calculation of Ea (exchange as a function of temperature)
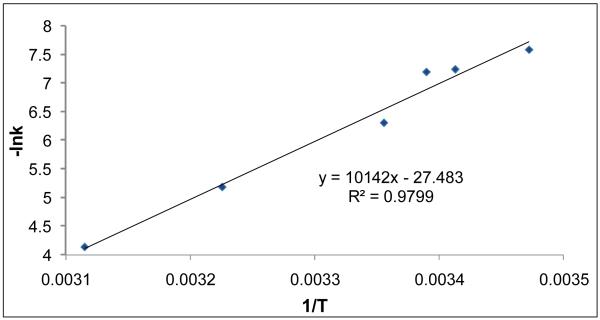
We performed H/D amide exchange of gramicidin in n-propanol at different temperatures. Using data similar to that shown in Figure 5, we measured the rate constant for unfolding as a function of temperature (Table 1). The rate constant increased with temperature, as expected, and when plotted vs. 1/T as required for an Arrhenius plot, we obtained a straight line, affording an activation energy (Ea) of 20 kcal mol-1 (Figure 6) and an entropy of -1.4 × 10⁻² kcal/K mol for the unfolding or dissociation of the dimer (see http://home.fuse.net/clymer/arr/ for description of calculation).
Table 1.
Value of the rate constant for the unfolding of the dimer, calculated, at various temperatures
| Temperature (K) | Rate constant for unfolding of the dimer, kr (min-1) |
|---|---|
| 288 | 0.00051 |
| 293 | 0.00072 |
| 295 | 0.00075 |
| 298 | 0.0018 |
| 310 | 0.0056 |
| 321 | 0.016 |
Figure 6.
Temperature dependence of the rate constant for the dimer dissociation of gramicidin in n-propanol-OD. The points are the experimental data, and the line is the linear-regression fit obtained using Microsoft Excel.
To our knowledge, the activation energy for the unfolding of gramicidin in organic solvents is not known. A value of Ea for dissociation of gramicidin dimers in vesicles, however, is 17 kcal/mol [37], which is comparable to the value we obtained.
Characterization of gramicidin in vesicles
Given that gramicidin is a membrane peptide, we chose to study also its folding dynamics in a model membrane by using HDX kinetics. We made vesicles of gramicidin and DMPC (as described in the Methods section), a medium in which gramicidin exists in a channel state, as established previously [28]. We first confirmed the size distribution of the vesicles by DLS, which showed that the mean diameter of the unimodal distribution was 101 ± 1, with a polydispersity of 0.133 ± 0.006, indicating that the vesicles exist in a narrow distribution.
We then electrosprayed the suspension of vesicles in ammonium acetate (containing 0.1 mM NaI and gramicidin) and observed a low abundance (M + Na)+ of gramicidin in the mass spectrum, which was dominated by peaks from dimyristoyl phosphotidyl choline (DMPC). This is not surprising because the concentration of DMPC and its hydrophobicity are considerably greater than those of gramicidin. This observation is similar to that made for trans membrane peptides by Heck et al. [13]. We were unable to see the dimer of gramicidin, however, in the mass spectrum because the experiment required a low pH quench as well as high temperature and high voltage ESI conditions to break apart the vesicles. The HDX behavior should still reflect the conformation of the gramicidin dimer in solution, although the dimer is not seen in the gas phase of the mass spectrometer.
Gramicidin follows an EX2 mechanism of exchange in vesicles. We found that gramicidin exchanges 9 out of a total of 21 active hydrogens in 45 min, indicating that embedding it in the phospholipid protects gramicidin from HDX (see Figure in Supplemental Information-Figure 7). After 24 hrs, the exchange reached a steady state, and the center of the distribution indicated an uptake of ~10 D’s, and the width of the distribution narrowed. The different protection may indicate that a different structure of gramicidin exists in vesicles or that the phospholipid restricts solvent accessibility to the peptide. We can, however, conclude that the overall protection patterns of gramicidin in vesicles are different than those for the peptide in organic solvents.
Conclusion
The rapid rate of HDX of gramicidin in methanol is consistent with an EX2 mechanism of exchange. The exchange in n-propanol, however, shows the evolution of two D distributions, one representing a protected dimer that disappears and is replaced with another that undergoes nearly complete HDX. This behavior is in accord with mixed EX2 and EX1 mechanisms of exchange, an observation usually reserved for a few proteins under non-physiological conditions and not for peptides. The rate constant for the disappearance of the partially protected species can be viewed as that for dissociation or unfolding of gramicidin dimer. The activation energy for the unfolding is 20 kcal/mol, in reasonable agreement with a literature value, showing the validity of this mass spectrometry approach. HDX in vesicles is clearly different than that in n-propanol, suggesting different structures for the dimer in the two media.
Membrane peptides/proteins often self associate so that they can carry out their functions. It may be that this mass spectrometric approach will be of utility in studying the structural dynamics and other aspects of self-association. The approach may also be useful for analysis of other membrane peptides and proteins, which are difficult to handle by many analytical approaches owing to their low solubility and tendency to aggregate [17, 38].
Supplementary Material
Acknowledgments
We thank Dr. Edward Remsen and Prof. Karen Wooley for the use of their light scattering instrument. We thank the National Center for Research Resources (NCRR) of the National Institutes of Health (NIH) for financial support (Grant No. 2P41RR000954).
Footnotes
Publisher's Disclaimer: This is a PDF file of an unedited manuscript that has been accepted for publication. As a service to our customers we are providing this early version of the manuscript. The manuscript will undergo copyediting, typesetting, and review of the resulting proof before it is published in its final citable form. Please note that during the production process errors may be discovered which could affect the content, and all legal disclaimers that apply to the journal pertain.
References
- 1.Busath DD. The use of physical methods in determining gramicidin channel structure and function. Annual Review of Physiology. 1993;55:473–501. doi: 10.1146/annurev.ph.55.030193.002353. [DOI] [PubMed] [Google Scholar]
- 2.Doyle DA, Wallace BA. The dynamic nature of gramicidin. Biomembranes. 1996;6:327–359. [Google Scholar]
- 3.Wallace BA. Recent advances in the high resolution structures of bacterial channels: gramicidin A. Journal of Structural Biology. 1998;121(2):123–141. doi: 10.1006/jsbi.1997.3948. [DOI] [PubMed] [Google Scholar]
- 4.Sarges R, Witkop B, Gramicidin AV. The structure of valine- and isoleucine-gramicidin A. J. Am. Chem. Soc. 1965;87(9):2011–2020. doi: 10.1021/ja01087a027. [DOI] [PubMed] [Google Scholar]
- 5.Ferraro DM, Robertson AD. EX1 Hydrogen Exchange and Protein Folding. Biochemistry. 2004;43(3):587–594. doi: 10.1021/bi035943y. [DOI] [PubMed] [Google Scholar]
- 6.Deng Y, Smith DL. Identification of Unfolding Domains in Large Proteins by Their Unfolding Rates. Biochemistry. 1998;37(18):6256–6262. doi: 10.1021/bi972711o. [DOI] [PubMed] [Google Scholar]
- 7.Yi Q, Baker D. Direct evidence for a two-state protein unfolding transition from hydrogen-deuterium exchange, mass spectrometry, and NMR. Protein Science. 1996;5(6):1060–1066. doi: 10.1002/pro.5560050608. [DOI] [PMC free article] [PubMed] [Google Scholar]
- 8.Engen JR, Smith DL. Investigating protein structure and dynamics by hydrogen exchange MS. Analytical Chemistry. 2001;73(9):256A–265A. doi: 10.1021/ac012452f. [DOI] [PubMed] [Google Scholar]
- 9.Kaltashov IA, Eyles SJ. Crossing the phase boundary to study protein dynamics and function: combination of amide hydrogen exchange in solution and ion fragmentation in the gas phase. Journal of Mass Spectrometry. 2002;37(6):557–565. doi: 10.1002/jms.338. [DOI] [PubMed] [Google Scholar]
- 10.Urry DW. The gramicidin A transmembrane channel: a proposed pi(L,D) helix. Proc Natl Acad Sci U S A. 1971;68(3):672–676. doi: 10.1073/pnas.68.3.672. [DOI] [PMC free article] [PubMed] [Google Scholar]
- 11.Veatch WR, Fossel ET, Blout ER. The conformation of gramicidin A. Biochemistry. 1974;13(26):5249–5256. doi: 10.1021/bi00723a001. [DOI] [PubMed] [Google Scholar]
- 12.Akashi S, Takio K. Structure of melittin bound to phospholipid micelles studied using hydrogen-deuterium exchange and electrospray ionization Fourier transform ion cyclotron resonance mass spectrometry. Journal of the American Society for Mass Spectrometry. 2001;12(12):7. doi: 10.1016/S1044-0305(01)00314-2. [DOI] [PubMed] [Google Scholar]
- 13.Demmers JA, Haverkamp J, Heck AJ, Koeppe RE, 2nd, Killian JA. Electrospray ionization mass spectrometry as a tool to analyze hydrogen/deuterium exchange kinetics of transmembrane peptides in lipid bilayers. Proceedings of the National Academy of Sciences of The United States of America. 2000;97(7):3189–3194. doi: 10.1073/pnas.050444797. [DOI] [PMC free article] [PubMed] [Google Scholar]
- 14.Demmers JAA, van Duijn E, Haverkamp J, Greathouse DV, Koeppe RE, 2nd, Heck AJR, Killian JA. Interfacial Positioning and Stability of Transmembrane Peptides in Lipid Bilayers Studied by Combining Hydrogen/Deuterium Exchange and Mass Spectrometry. The Journal of Biological Chemistry. 2001;276(37):8. doi: 10.1074/jbc.M101401200. [DOI] [PubMed] [Google Scholar]
- 15.Hansen RKB, William R, Skelton Paul C, Arkin Isaiah T. Hydrogen/deuterium exchange of hydrophobic peptides in model membranes by electrospray ionization mass spectrometry. Journal of the American Society for Mass Spectrometry. 2002;13(12):12. doi: 10.1016/S1044-0305(02)00702-X. [DOI] [PubMed] [Google Scholar]
- 16.Sidhu SS, Fairbrother WJ, Deshayes K. Exploring protein-protein interactions with phage display. ChemBioChem. 2003;4(1):14–25. doi: 10.1002/cbic.200390008. [DOI] [PubMed] [Google Scholar]
- 17.Veenhoff LM, Heuberger EHML, Poolman B. Quaternary structure and function of transport proteins. Trends in Biochemical Sciences. 2002;27(5):242–249. doi: 10.1016/s0968-0004(02)02077-7. [DOI] [PubMed] [Google Scholar]
- 18.Veselovsky AV, Ivanov YD, Ivanov AS, Archakov AI, Lewi P, Janssen P. Protein-protein interactions: mechanisms and modification by drugs. Journal of Molecular Recognition. 2002;15(6):405–422. doi: 10.1002/jmr.597. [DOI] [PubMed] [Google Scholar]
- 19.Barone G, Giancola C. Peptide-peptide interactions in water and concentrated urea solutions. Pure and Applied Chemistry. 1990;62(1):57–68. [Google Scholar]
- 20.Liu D, Huang Z. Synthetic peptides and non-peptidic molecules as probes of structure and function of Bcl-2 family proteins and modulators of apoptosis. Apoptosis. 2001;6(6):453–462. doi: 10.1023/a:1012481406064. [DOI] [PubMed] [Google Scholar]
- 21.Xing G, DeRose VJ. Designing metal-peptide models for protein structure and function. Current Opinion in Chemical Biology. 2001;5(2):196–200. doi: 10.1016/s1367-5931(00)00190-3. [DOI] [PubMed] [Google Scholar]
- 22.Bechinger B. Structure and functions of channel-forming peptides: magainins, cecropins, melittin and alamethicin. Journal of Membrane Biology. 1997;156(3):197–211. doi: 10.1007/s002329900201. [DOI] [PubMed] [Google Scholar]
- 23.Kaiser ET, Kezdy FJ. Peptides with affinity for membranes. Annual Review of Biophysics and Biophysical Chemistry. 1987;16:561–581. doi: 10.1146/annurev.bb.16.060187.003021. [DOI] [PubMed] [Google Scholar]
- 24.Chitta R,K, Gross M,L. Electrospray ionization-mass spectrometry and tandem mass spectrometry reveal self-association and metal-ion binding of hydrophobic peptides: a study of the gramicidin dimer. Biophysical journal. 2004;86(1):473–479. doi: 10.1016/S0006-3495(04)74125-9. [DOI] [PMC free article] [PubMed] [Google Scholar]
- 25.Chitta RK, Rempel DL, Gross ML. Determination of Affinity Constants and Response Factors of the Noncovalent Dimer of Gramicidin by Electrospray Ionization Mass Spectrometry and Mathematical Modeling. Journal of the American Society for Mass Spectrometry. 2005;16(7):8. doi: 10.1016/j.jasms.2005.04.001. [DOI] [PubMed] [Google Scholar]
- 26.Ehring H. Hydrogen Exchange/Electrospray Ionization Mass Spectrometry Studies of Structural Features of Proteins and Protein/Protein Interactions. Analytical Biochemistry. 1999;267(2):252–259. doi: 10.1006/abio.1998.3000. [DOI] [PubMed] [Google Scholar]
- 27.Smith DL. Local structure and dynamics in proteins characterized by hydrogen exchange and mass spectrometry. Biochemistry. 1998;63(3):285–293. [PubMed] [Google Scholar]
- 28.LoGrasso PV, Moll F, III, Cross TA. Solvent history dependence of gramicidin A conformations in hydrated lipid bilayers. Biophysical Journal. 1988;54(2):259–267. doi: 10.1016/S0006-3495(88)82955-2. [DOI] [PMC free article] [PubMed] [Google Scholar]
- 29.Rockwood AL, Kushnir MM, Nelson GJ. Dissociation of individual isotopic peaks: predicting isotopic distributions of product ions in MSn. Journal of the American Society for Mass Spectrometry. 2003;14(4):12. doi: 10.1016/S1044-0305(03)00062-X. [DOI] [PubMed] [Google Scholar]
- 30.Birnbaum DT, Dodd SW, Saxberg BEH, Varshavsky AD, Beals JM. Hierarchical Modeling of Phenolic Ligand Binding to 2Zn-Insulin Hexamers. Biochemistry. 1996;35(17):13. doi: 10.1021/bi9600557. [DOI] [PubMed] [Google Scholar]
- 31.Knuth KH, Hajian AR. Hierarchies of Models: Toward Understanding Planetary Nebulae. American Institute of Physics Conference Proceedings. 2003;659(1):12. [Google Scholar]
- 32.Braco L, Bano C, Chillaron F, Abad C. Dimer-monomer conformational equilibrium of gramicidin A in 1-alkanols as studied by H.P.L.C. and fluorescence spectroscopy. International Journal of Biological Macromolecules. 1988;10(6):343–348. [Google Scholar]
- 33.Chung EW, Nettleton EJ, Morgan CJ, Grob M, Miranker A, Radford SE, Dobson CM, Robinson CV. Hydrogen exchange properties of proteins in native and denatured states monitored by mass spectrometry and NMR. Protein Science. 1997;6(6):1316–1324. doi: 10.1002/pro.5560060620. [DOI] [PMC free article] [PubMed] [Google Scholar]
- 34.Miranker A, Robinson CV, Radford SE, Aplin RT, Dobson CM. Detection of transient protein folding populations by mass spectrometry. Science (Washington, DC, United States) 1993;262(5135):896–900. doi: 10.1126/science.8235611. [DOI] [PubMed] [Google Scholar]
- 35.Breuker K. New mass spectrometric methods for the quantification of protein-ligand binding in solution. Angewandte Chemie, International Edition. 2004;43(1):22–25. doi: 10.1002/anie.200301695. [DOI] [PubMed] [Google Scholar]
- 36.Swint-Kruse L, Robertson AD. Temperature and pH dependences of hydrogen exchange and global stability for ovomucoid third domain. Biochemistry. 1996;35(1):171–180. doi: 10.1021/bi9517603. [DOI] [PubMed] [Google Scholar]
- 37.Bamberg E, Laeuger P. Temperature dependent properties of gramicidin A channels. Biochimica et Biophysica Acta. 1974;367(2):127–133. doi: 10.1016/0005-2736(74)90037-6. [DOI] [PubMed] [Google Scholar]
- 38.Grasberger B, Minton AP, DeLisi C, Metzger H. Interaction between proteins localized in membranes. Proceedings of the National Academy of Sciences of the United States of America. 1986;83(17):6258–6262. doi: 10.1073/pnas.83.17.6258. [DOI] [PMC free article] [PubMed] [Google Scholar]
Associated Data
This section collects any data citations, data availability statements, or supplementary materials included in this article.


