Abstract
The interaction of the signal-recognition particle (SRP) with its receptor (SR) mediates co-translational protein targeting to the membrane. SRP and SR interact via their homologous core GTPase domains and N-terminal four-helix bundles (N domains). SRP–SR complex formation is slow unless catalyzed by SRP’s essential RNA component. We show that truncation of the first helix of the N domain (helix N1) of both proteins dramatically accelerates their interaction. SRP and SR with helix N1 truncations interact at nearly the RNA-catalyzed rate in the absence of RNA. NMR spectroscopy and analysis of GTPase activity show that helix N1 truncation in SR mimics the conformational switch caused by complex formation. These results demonstrate that the N-terminal helices of SRP and SR are autoinhibitory for complex formation in the absence of SRP RNA, suggesting a mechanism for RNA-mediated coordination of the SRP–SR interaction.
Compartmentalization of cells requires protein targeting into and across membranes. The SRP captures signal sequence–containing nascent chains on the ribosome, associates with its membrane-bound receptor SR, and transfers the ribosome nascent chain complex to the translocation apparatus in the endoplasmic reticulum in eukaryotes or in the plasma membrane in bacteria1,2. Both SRP and SR have related GTPase domains that are an integral part of the targeting cycle. In their GTP-bound form, SRP and SR form a complex that dissociates upon GTP hydrolysis3,4.
Whereas its mammalian homolog is a complex of six proteins and one RNA molecule (7S RNA), in Escherichia coli, SRP comprises a smaller RNA molecule (4.5S RNA) and a single, essential protein, Ffh5–7. Ffh is homologous to mammalian SRP54, the central SRP component that binds to signal sequences as they emerge from the ribosome. The SR, termed FtsY in E. coli, is also streamlined from two proteins in mammals to a single, essential protein6,8. Thus, E. coli contains the core, universally conserved elements of the targeting machinery, which remarkably can complement the more complex eukaryotic machinery in in vitro assays9,10.
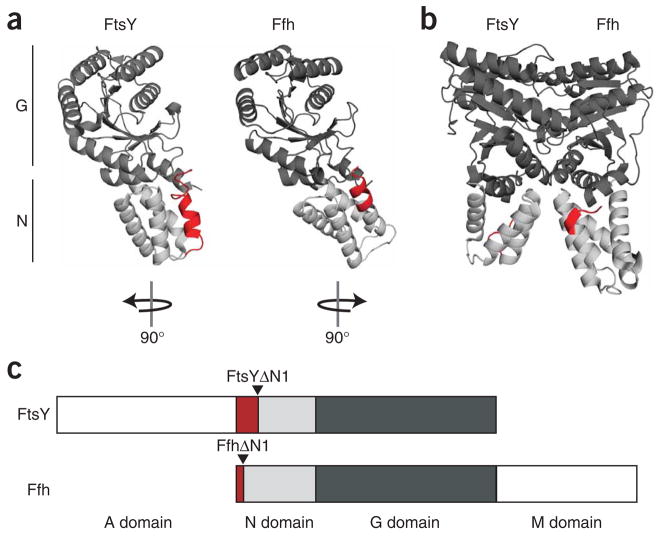
Ffh and FtsY share structurally and functionally related N-terminal four-helix bundles (N domains) and Ras-like GTPase domains (G domains; Fig. 1a)11,12. Formation of Ffh–FtsY complexes occurs via extensive contact between these domains (Fig. 1b)13,14. Additionally, Ffh contains a C-terminal methionine-rich (M) domain, which binds 4.5S RNA and provides the signal-sequence binding site (Fig. 1c)15–17. FtsY contains an N-terminal acidic (A) domain, which is weakly evolutionarily conserved and is implicated in membrane binding (Fig. 1c)10,18,19.
Figure 1.
Structural and schematic representations of the FtsY and Ffh constructs used in this study. (a) Left, ribbon representation of the crystal structure of E. coli FtsY (a subset (residues 204–495) of PDB 2QY9 is shown). FtsYΔN1 begins at residue 221; residues up to 220 are red. Right, ribbon representation of the crystal structure of the T. aquaticus Ffh NG domain (residues 1–298, PDB 2FFH) with amino acids 1–8, truncated in FfhΔN1, in red. The G domains are dark gray and the N domains are light gray. The orientation of the individual proteins in relation to their position in the structure of the Ffh–FtsY complex (b) is indicated. (c) Domain map of FtsY and Ffh with positions of truncations indicated by arrows. The color scheme is the same as in a and b.
SRPs from all studied species (excepting only chloroplast SRP in higher plants) contain an RNA subunit, and in E. coli 4.5S RNA is essential for survival20–22. The 4.5S RNA catalyzes the interaction of Ffh and FtsY—increasing the rate of complex formation by more than two orders of magnitude3,23. In addition, 4.5S RNA enhances the maximal rate of GTP hydrolysis from the Ffh–FtsY complex3. Previous work suggested that the activity of 4.5S RNA may be linked to the signal-peptide binding state of Ffh—effectively coordinating the interaction of Ffh and FtsY with cargo recruitment by SRP15,24. It remains unclear, mechanistically, why Ffh and FtsY require stimulation by 4.5S RNA to bind efficiently.
Here we investigate the structural elements of Ffh and FtsY that control the kinetics of their interaction. The N domains of both Ffh and FtsY are four-helix bundles, and in all crystal forms of the individual proteins the N-terminal–most helix (N1) is present (Supplementary Fig. 1 online)11,12,16,25. In contrast, structures of the Ffh–FtsY complex always lack helix N1 of the N domain of FtsY and show an unstructured or repositioned helix N1 of Ffh13,14,26,27. Indeed, FtsY helix N1 was found to be proteolyzed during the crystallization process13,14, and deliberate amputation of FtsY helix N1 both enhanced complex formation and facilitated crystallization of the complex28. Furthermore, helix N1 of the chloroplast FtsY is important for its rapid binding to the chloroplast homolog of Ffh29. Given these hints that helix N1, like 4.5S RNA, affects the rate of Ffh–FtsY complex formation, we set out to investigate this structural element with the goal of clarifying the mechanism of kinetic control of the Ffh–FtsY interaction.
RESULTS
Acceleration of Ffh–FtsY binding in the absence of RNA
To explore whether helix N1 regulates the Ffh–FtsY interaction, we N-terminally truncated E. coli FtsY and Ffh. We compared FtsYΔN1, which lacks the A domain and first helix of the N domain (Fig. 1a, deleted region in red), to FtsY lacking the first 46 amino acids of the A domain. This 46-amino-acid truncation variant is functionally equivalent to full-length FtsY in in vitro studies3,10,23; we use it as our wild-type reference and refer to it as FtsY. Similarly, we removed the eight most N-terminal amino acids of helix N1 from Ffh, creating FfhΔN1 (Fig. 1a, deleted region in red). We partially truncated Ffh helix N1 because Ffh lacking the entire N-terminal helix is poorly soluble, and the two truncated proteins showed indistinguishable binding kinetics with FtsY (Supplementary Fig. 2 online).
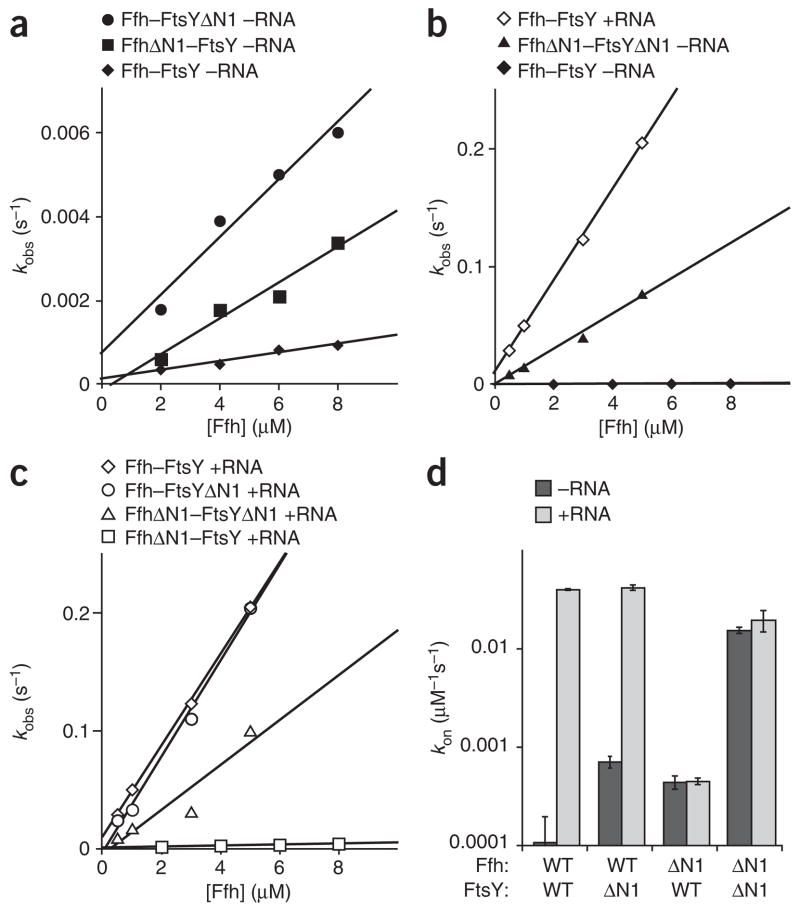
With these tools in hand, we compared the rates of Ffh–FtsY complex formation between wild-type and truncated forms of Ffh and FtsY in the absence of SRP RNA (Fig. 2a). To do this, we monitored the change in FtsY tryptophan fluorescence, which reports complex formation23,30. In the absence of 4.5S RNA, FtsYΔN1 showed a seven-fold enhanced association rate constant compared to wild-type FtsY (Fig. 2a, compare circles and diamonds, and Table 1). Similarly, FfhΔN1 formed a complex with FtsY about four-fold faster than its wild-type counterpart (Fig. 2a, compare squares and diamonds, and Table 1). Furthermore, when we combined the rapid binding mutants FtsYΔN1 and FfhΔN1, the association rate constant was enhanced roughly 150-fold compared to the wild-type proteins (Fig. 2b, compare solid triangles and diamonds, and Table 1). These experiments were performed in the absence of 4.5S RNA; yet, the rate observed with the two truncated proteins approached the RNA-stimulated association rate of Ffh and FtsY to within a factor of three (Fig. 2b, compare solid triangles and open diamonds, and Table 1) indicating that the rate enhancement afforded by 4.5S RNA is quantitatively mimicked by removal of the N1 helices from both FtsYand Ffh. Thus, in the absence of 4.5S RNA, the N-terminal helices of the N domains of Ffh and FtsY are autoinhibitory for Ffh–FtsY complex formation.
Figure 2.
The N-terminal helices of Ffh and FtsY inhibit Ffh–FtsY association in the absence of 4.5S RNA. (a) Truncation of helix N1 increases the rate of Ffh–FtsY association in the absence of 4.5S RNA. Observed binding rates are plotted as a function of Ffh concentration for Ffh–FtsYΔN1 without RNA (−RNA) (●), FfhΔN1–FtsY −RNA (■) and Ffh-FtsY −RNA (◆). Lines are fits to the equation kobs = kon[Ffh] + koff in a, b and c, and wild-type (WT) references are included in multiple figures for comparison. (b) The FfhΔN1–FtsYΔN1 complex forms nearly as rapidly in the absence of 4.5S RNA as the Ffh–FtsY complex forms in the presence of 4.5S RNA. Observed binding rates are plotted as a function of Ffh concentration for Ffh–FtsY +RNA (◇), FfhΔN1–FtsYΔN1 −RNA (▲) and Ffh-FtsY −RNA (◆). (c) Binding of FfhΔN1 and FtsYΔN1 in the presence of 4.5S RNA. Observed binding rates are plotted as a function of Ffh concentration for Ffh–FtsY +RNA (◇), Ffh–FtsYΔN1 +RNA (○), FfhΔN1–FtsYΔN1 +RNA (△) and FfhΔN1–FtsY +RNA (□). (d) Summary of binding rates. On rates for each Ffh–FtsY pair are plotted in the presence and absence of 4.5S RNA. Note the log scale. Error bars represent the standard error of the linear fit to the equation kobs = kon[Ffh] + koff.
Table 1.
Association and dissociation rate constants for wild-type and truncated Ffh and FtsY
| kon (M−1s−1) | koff (10−6s−1) | Kd (nM) | ||||||
|---|---|---|---|---|---|---|---|---|
| 4.5S RNA: | − | + | − | + | − | + | ||
| Ffh | FtsY | |||||||
| WT | WT | 104 ± 16 | 38800 ± 730 | 8.60 ± 0.16 | 2650 ± 150 | 82.7 ± 13 | 68.4 ± 4.2 | |
| WT | ΔN1 | 685 ± 93 | 40500 ± 2500 | 5.47 ± 0.14 | 605 ± 77 | 7.98 ± 1.1 | 14.9 ± 2.1 | |
| ΔN1 | WT | 426 ± 66 | 435 ± 33 | 3.01 ± 0.15 | 6.14 ± 0.3 | 7.06 ± 1.1 | 14.1 ± 1.3 | |
| ΔN1 | ΔN1 | 14900 ± 1100 | 19000 ± 4700 | 5.38 ± 0.16 | 12.2 ± 0.3 | 0.361 ± 0.028 | 0.639 ± 0.16 | |
Ffh truncation blocks RNA stimulation of Ffh–FtsY binding
If 4.5S RNA acts by relieving inhibition of complex formation caused by helix N1, then helix N1 truncation would enhance complex formation only in the absence of 4.5S RNA. However, if 4.5S RNA speeds complex formation by another mechanism, truncation of the N1 helices would enhance complex formation with and without 4.5S RNA. We therefore measured the binding rate of the truncated forms of Ffh and FtsY in the presence of 4.5S RNA. Unlike our results in the absence of 4.5S RNA, in its presence FtsYΔN1 and wild-type FtsY associated with Ffh at similar, rapid rates (Fig. 2c, compare circles to diamonds, and Table 1). Thus, truncation of helix N1 of FtsYenhances the rate of Ffh–FtsY complex formation selectively in the absence of 4.5S RNA and has no effect in its presence.
Unexpectedly, 4.5S RNA did not stimulate FfhΔN1–FtsY complex formation (Fig. 2c, compare open squares and open diamonds, and Fig. 2d). Similarly, the rate of FfhΔN1–FtsYΔN1 complex formation was unaffected by the presence of 4.5S RNA. Several reports show that the isolated M domain and full-length Ffh bind 4.5S RNA with similar affinity, excluding the possibility that FfhΔN1 no longer binds 4.5S RNA15,31. Thus, deletion of helix N1 not only failed to further accelerate complex formation in the presence of 4.5S RNA, but also abolished the stimulatory effect of the RNA.
Taken together, these results (summarized in Fig. 2d) show that the N1 helices of Ffh and FtsY jointly inhibit Ffh–FtsY complex formation in the absence of 4.5S RNA. Thus, 4.5S RNA may enhance Ffh–FtsY complex formation by lowering the kinetic barrier imposed by the N1 helices in Ffh and FtsY.
Truncation of N1 helices enhances complex stability
4.5S RNA stimulates binding of Ffh and FtsY by a catalytic mechanism—increasing both the association and dissociation rates23. Because truncation of helix N1 from both Ffh and FtsY led to an association rate constant as rapid as that observed in the presence of 4.5S RNA, we investigated whether the rates of complex dissociation would also be affected. To measure the rates of Ffh–FtsY complex dissociation, we allowed complexes to form in the presence of the nonhydrolyzable GTP analog GppNHp. We then added an excess of GDP to trap dissociated proteins and followed the change in tryptophan fluorescence over time.
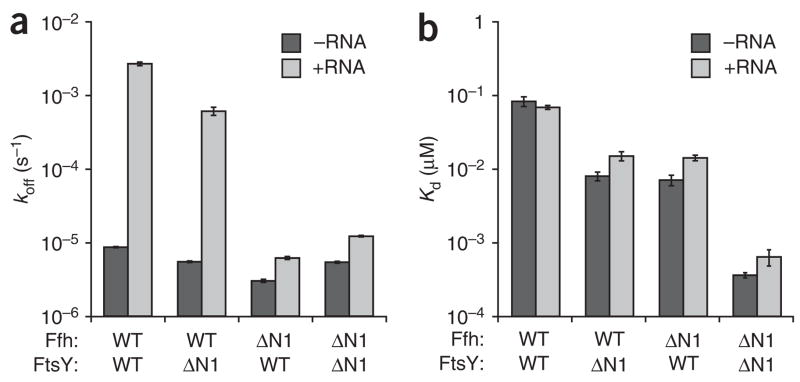
As summarized in Figure 3a and Table 1, the dissociation rates of Ffh and FtsY in the absence of 4.5S RNA are virtually unaffected by removal of the N1 helices. By contrast, in the presence of 4.5S RNA, the Ffh–FtsY complex dissociation rates decrease as the N1 helices are removed. The Ffh–FtsYΔN1 complex dissociates approximately five-fold slower than the complex of the full-length proteins. Consistent with 4.5S RNA having no effect on the association rate of the FfhΔN1–FtsY complex, the dissociation rates for this complex are approximately equal with and without 4.5S RNA. Finally, the FfhΔN1–FtsYΔN1 complex, which forms in the absence of 4.5S RNA at nearly the RNA-stimulated, wild-type rate, dissociated at a rate that was largely unaffected by 4.5S RNA.
Figure 3.
The N-terminal helices of Ffh and FtsY stimulate Ffh–FtsY complex dissociation in the presence of 4.5S RNA. (a) Bar graphs representing the dissociation rate constants (koff) for disassembly of the Ffh–FtsY complex −RNA (dark gray) and +RNA (light gray). The koffs were measured by forming complexes in the presence of GppNHp and trapping dissociated proteins with GDP. Data were fit to a single-exponential equation, and error bars represent the standard error of the fit. (b) Plot of equilibrium dissociation constants, ± RNA. Kd values were calculated by the equation Kd = koff/kon. Note the log scale axes. WT, wild type.
Notably, the decreases in dissociation rates caused by truncation of helix N1 almost precisely balances the increases in association rates that we observed in Figure 1, such that the calculated Kd values of each complex (Kd = koff/kon) are similar in the absence or presence of 4.5S RNA (Fig. 3b and Table 1). Because the on rates of the truncated proteins are increased in the absence of 4.5S RNA, it follows that the Kd’s of the complexes change correspondingly: whereas the wild-type Ffh–FtsY complex has a Kd of 83 ± 12 nM, the complexes in which the N1 helix is deleted from one protein bind ten-fold more tightly, with Kd’s of 8 ± 1 nM for Ffh–FtsYΔN1 and 7 ± 1 nM for FfhΔN1–FtsY. The complex composed of both truncated proteins is around 250-fold tighter, with a Kd of 0.36 ± 0.03 nM. Thus, deletion of the N1 helices thermodynamically stabilizes Ffh–FtsY complexes. It is important to note, however, that for each combination of the N1 helix–truncated mutants, the principle that 4.5S RNA functions catalytically, that is, changing the kinetics but not the equilibrium of Ffh–FtsY interactions (which we previously documented for the wild-type proteins23), is not violated. In summary, these results demonstrate that the N1 helices of Ffh and FtsY inhibit association exclusively in the absence of 4.5S RNA and promote dissociation exclusively in the presence of 4.5S RNA.
Helix N1 truncation enhances basal GTP hydrolysis
Both Ffh and FtsY are GTPases, and the GTPase cycles of the proteins are intimately linked to their association and dissociation. In the absence of Ffh, FtsY hydrolyzes GTP at a low, basal rate. Upon association, the GTPase activity of both Ffh and FtsY is accelerated over their respective basal levels, and this is referred to as the ‘stimulated’ GTPase activity of the complex. In contrast to other GTPases, Ffh and FtsY each contain all of their catalytic residues, and GTPase stimulation is due to induced conformational changes in each protein upon complex formation13,14. We therefore hypothesized that FtsYΔN1, which binds more rapidly to Ffh in the absence of 4.5S RNA, might show enhanced basal GTPase activity if it assumes a conformation that is more like the Ffh-bound state.
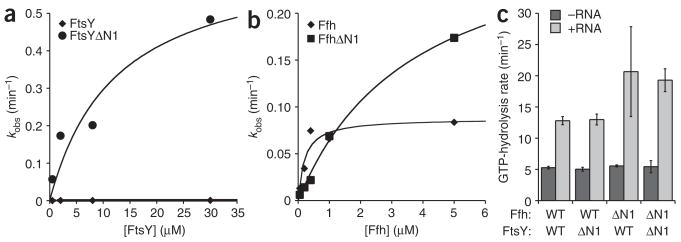
Indeed, we found that the basal GTPase activity of FtsYΔN1 was markedly increased compared to FtsY (Fig. 4a). The maximal GTP hydrolysis rate (kcat) for wild-type FtsY was 0.0098 min−1, in good agreement with previous data3, whereas the kcat for FtsYΔN1 was nearly 100-fold faster (0.66 min−1). Despite the dramatic increase in kcat, the Kd of FtsYΔN1 for nucleotide (equal to the Km of the GTPase reaction) did not differ substantially from that of wild-type FtsY, demonstrating that only the hydrolysis step and not substrate binding is affected by truncation of the N terminus of FtsY. Thus, FtsYΔN1 may assume an ‘Ffh-bound’ conformation in the absence of Ffh.
Figure 4.
The N-terminal helix of FtsY represses its basal GTPase activity. (a) Plot of observed rates from single-turnover GTPase assays measuring GTP-hydrolysis rate as a function of FtsY (◆) or FtsYΔN1 (●) concentration. A fit of the data to the equation kobs = kcat[FtsY]/(KM + [FtsY]) gave kcat of 0.00979 ± 0.0028 min−1 for FtsY and 0.662 ± 0.24 min−1 for FtsYΔN1. (b) Single-turnover GTPase assays were performed for Ffh (◆) or FfhΔN1 (■) as a function of increasing concentrations of Ffh. A fit of the data to the equation kobs = kcat[Ffh]/(KM + [Ffh]) gave kcat of 0.0876 ± 0.012 min−1 for Ffh and 0.305 ± 0.031 min−1 for FfhΔN1. (c) Plot of stimulated GTP-hydrolysis rates for Ffh–FtsY complexes +RNA (light gray) or −RNA (dark gray). Rates were measured as pulse chase experiments as described in Methods. Error bars are standard errors of the fit to a single-exponential equation.
Ffh has a higher basal GTP hydrolysis rate than FtsY, and its enhancement upon forming a complex is less pronounced. Furthermore, the active site of Ffh requires an interaction with FtsY to be fully activated32. Consistent with these differences and in contrast to FtsYΔN1, the basal GTPase activity of FfhΔN1 was only marginally increased over that of the wild-type control (Fig. 4b, three-fold increase compared to Ffh).
In summary, truncation of helix N1 of FtsY but not Ffh dramatically increases FtsY’s basal GTP hydrolysis rate, suggesting that helix N1 prevents FtsY from assuming an ‘Ffh-bound’, activated conformation in the absence of Ffh.
Truncations do not affect stimulated GTPase activity
Upon association, the GTPase activity of both Ffh and FtsY is stimulated and drives the disassembly of the Ffh–FtsY complex. In addition to stimulating the rate of interaction between Ffh and FtsY, 4.5S RNA also enhances the rate of stimulated GTP hydrolysis by the Ffh–FtsY complex several fold3. We therefore asked whether truncation of helix N1 of Ffh and FtsY affects the ability of 4.5S RNA to accelerate the stimulated GTPase activity of the complex.
Because the maximal rate of stimulated GTP hydrolysis is the same as the GTP hydrolysis–driven rate for disassembly of the GTPFfh–FtsYGTP complex3, we measured disassembly of the GTPFfh–FtsYGTP complex for truncation variants. For all combinations of wild-type and truncated Ffh and FtsY, 4.5S RNA stimulated the GTPase activity to a similar extent (Fig. 4c). Additionally, the rates of GTP hydrolysis by Ffh–FtsY complexes and complexes of the truncation variants were similar in the absence of 4.5S RNA (Fig. 4c). This demonstrates that the kinetically different routes of assembly specified by N1 helix truncations do not affect the catalytic core of Ffh–FtsY complexes. Furthermore, although helix N1 of Ffh is required for 4.5S RNA to accelerate complex formation, 4.5S RNA still accelerates the GTPase activity of the FfhΔN1–FtsYand FfhΔN1–FtsYΔN1 complexes.
FtsYΔN1 assumes an Ffh-bound conformation
To further probe the conformational changes of FtsY upon truncation of helix N1 and during complex formation, we analyzed FtsY either containing or lacking helix N1 by NMR. Because the Ffh–FtsY complex is larger than 80 kDa, we selectively labeled the ultimate methyl groups of isoleucine, leucine and valine residues with 13C and recorded two-dimensional HSQC spectra of the proteins. This selective labeling scheme is particularly useful for obtaining NMR spectra of large proteins and protein complexes33. We then compared HSQC spectra of FtsY variants to determine how the structure of FtsY is altered by truncation of helix N1. For this study, we compared FtsYΔN1 to FtsY204, which starts at residue 204 and includes helix N1. Like FtsY, FtsY204 binds slowly to Ffh in the absence of 4.5S RNA (Supplementary Fig. 3a online). Furthermore, the basal GTPase activity of FtsY204 is substantially slower than that of FtsYΔN1 (Supplementary Fig. 3b). Therefore, FtsY204 can be used as a minimal construct to probe the effects of helix N1 on FtsY structure.
In the absence of nucleotide, the spectra of FtsY204 and FtsYΔN1 share a vast majority of cross peaks (Supplementary Fig. 3c). As expected, several of the peaks arising from helix N1 were missing from the FtsYΔN1 spectrum (there are two leucines and one isoleucine between residues 204 and 221). In addition, a few peaks had shifted, indicating that some residues were in different chemical environments in the different FtsY forms (Supplementary Fig. 3c). Addition of GppNHp to FtsYΔN1 shifted numerous cross peaks, whereas addition of GppNHp to FtsY204 led to virtually no change in the spectrum (Supplementary Fig. 4a,b online). The difference in the GppNHp spectra of FtsY204 and FtsYΔN1 is not accounted for by differences in affinity for nucleotide, because truncation of helix N1 results in only a modest decrease in affinity of FtsY for GppNHp (FtsY204 Kd = 2.6 ± 0.3 μM and FtsYΔN1 Kd = 22 ± 8 μM; Supplementary Fig. 4c). Additionally, one resonance in the FtsY204 spectrum was broadened and resulted in formation of a new cross peak upon the addition of GppNHp, consistent with nucleotide being bound to the protein (Supplementary Fig. 4a,d).
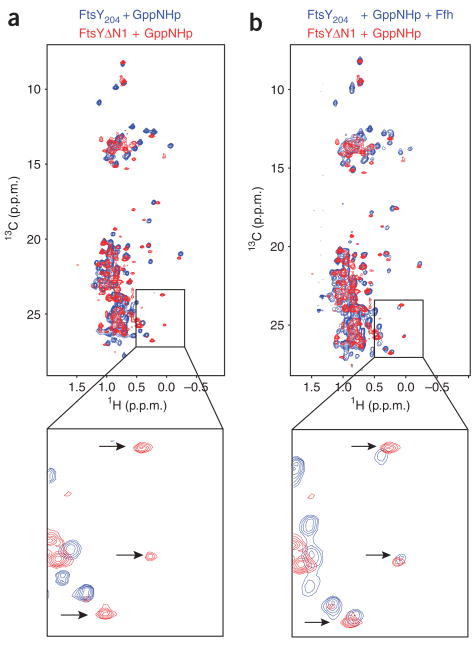
Notably, many of the cross peaks that appeared when nucleotide was added to FtsYΔN1 are matched by peaks in the GppNHpFtsY204–FfhGppNHp complex spectrum (Fig. 5). This similarity between the FtsYΔN1GppNHp spectrum and the GppNHpFtsY204–FfhGppNHp spectrum indicates that, in the presence of nucleotide, FtsYΔN1 adopts a conformation similar to the Ffh bound FtsY. These results are consistent with the enhanced basal GTPase activity observed for FtsYΔN1, indicating that it assumes an active conformation in the absence of Ffh.
Figure 5.
FtsYΔN1 assumes an ‘Ffh-bound’ conformation in the presence of GppNHp. NMR spectra of 13C methyl Ile-Leu-Val–labeled FtsY204 and FtsYΔN1 are overlayed. FtsYΔN1 + GppNHp is shown in red as a reference. FtsY204 + GppNHp (a) and FtsY204 + GppNHp + Ffh (b) are shown in blue. Insets, magnifications of a region of the spectra shown above. Notice that several peaks that are unmatched in a have partners in b (a subset of these peaks from a particularly well-resolved region of the spectrum is marked with arrows).
Helix N1 of FtsY is expelled upon binding Ffh
Thus far, our results show that helix N1 impedes FtsY’s basal GTPase activity and slows complex formation with Ffh. This suggests that rearrangement of helix N1 is required for association with Ffh. By this model, helix N1 might keep FtsY in a conformation unfavorable for complex formation. To associate, FtsY would be forced into a favorable conformation, repositioning the helix in the process. Movement of the helix by complex formation, similarly to its deletion, could partially account for the stimulatory effect of Ffh on FtsY GTPase activity.
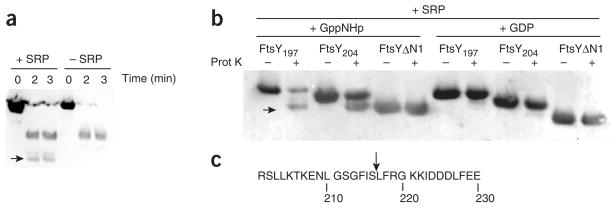
To gain direct evidence for such a conformational change, we used limited proteolysis to probe the structural changes that take place in FtsY helix N1 upon complex formation with Ffh. We found that, when bound to Ffh, a new site in FtsY becomes accessible to protease cleavage, resulting in an additional low molecular weight band (Fig. 6a, arrow). This additional cleavage site is dependent upon both Ffh and nucleotide. The truncation variants FtsY197, FtsY204 and FtsYΔN1 allow finer mapping, and suggest that cleavage occurs at the N terminus of FtsY, after position 204 and before position 221, where FtsYΔN1 is truncated (Fig. 6b). N-terminal sequencing revealed that cleavage occurred between Ser216 and Leu217 (Fig. 6c), similarly to what was observed when Thermus aquaticus FtsY was subjected to limited proteolysis in the presence of Ffh28, demonstrating the conservation of this conformational rearrangement.
Figure 6.
Binding of Ffh to FtsY exposes the N-terminal helix of FtsY. (a) Western blot showing limited proteolysis of FtsY either alone or in complex with SRP (Ffh + 4.5S RNA). A low-molecular-weight band marked with an arrow appears specifically when SRP is bound. (b) Western blots showing fine mapping of the location of the cleavage site in FtsY. Truncation variants of FtsY were subjected to limited proteolysis in the presence of SRP with either GppNHp (allowing complex formation) or GDP (preventing complex formation). The low-molecular-weight band is indicated by an arrow. (c) Proteolysis of FtsY takes place between residues Ser116 and Leu117. The sequence of the N-terminal helix of the FtsY NG domain is shown with an arrow marking the cleavage site as determined by N-terminal sequencing.
DISCUSSION
Ribosomes translating proteins destined for insertion into the membrane must be efficiently and rapidly delivered to the translocon. Efficient delivery requires precise control of the interaction of SRP with its receptor by the combined action of their GTPase cycles and SRP RNA. In this study, we describe a conformational switch that inhibits the interaction of the SRP with its receptor in the absence of SRP RNA stimulation. Furthermore, we show that this mechanism of inhibition is intimately linked to the catalytic effect of SRP RNA on the SRP–SR interaction.
A conformational switch regulates Ffh–FtsY interaction
Our results demonstrate that the N1 helices of Ffh and FtsY slow Ffh–FtsY association in the absence of 4.5S RNA. Combining these results with previous observations about the differences between the structures of the proteins individually and in complex, we suggest an explanation of how the helices exert their inhibitory effects13,14,28,34,35.
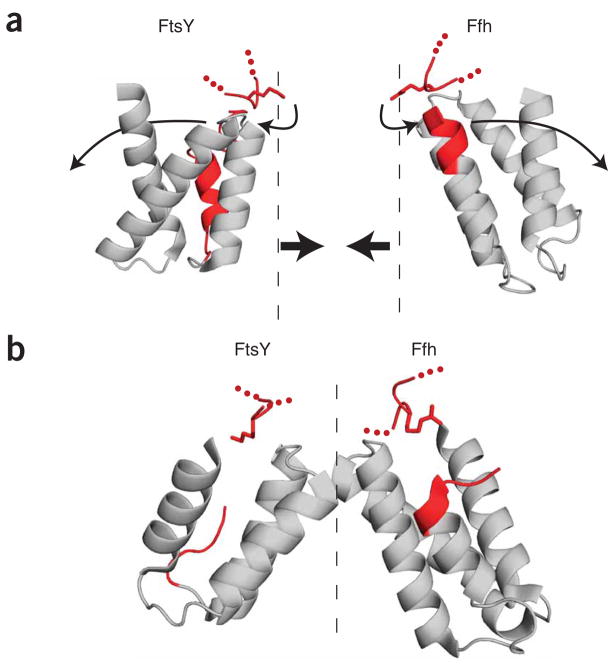
Notably, in all of the unbound structures of Ffh and FtsY, evolutionarily conserved basic amino acids (Ffh-Arg255 and FtsY-Lys453) point into the dimerization interface (Fig. 7a, shown in red). In all of the complex structures, Ffh-Arg255 and FtsY-Lys453 have rotated approximately 140° to hydrogen-bond to the most C-terminal helix of the NG domain. This movement places Ffh-Arg255, FtsY-Lys453 and the C-terminal helices into the positions that formerly were occupied by the N1 helices in the respective proteins (Fig. 7b). The conjecture that this conformational rearrangement is linked to displacement of the N1 helices is further supported by a GDP-bound structure of T. aquaticus FtsY with helix N1 removed34. In this structure, the homologous residue to Lys453 (T. aquaticus residue Lys262) is rotated to a position that is in between the Ffh-bound and Ffh-unbound states.
Figure 7.
Model for Ffh–FtsY structural rearrangement upon complex formation. (a) Ribbon representations of FtsY and Ffh in unbound form (PDB 2QY9 and PDB 2FFH, respectively). Helix N1 of both proteins is shown in red. Note that, in the unbound form, residue Lys453 of FtsY and residue Arg255 of Ffh (both shown in stick form in red) protrude into the dimerization interface, conceptually represented by a dashed line. (b) Ribbon representation of the Ffh–FtsY complex (PDB 1OKK). In the bound form, Lys453 of FtsY and Arg255 of Ffh move away from the interface, into the space formerly occupied by helix N1.
The importance of these rearrangements to the conformational switch described in this study is underscored by mutational analyses of Ffh and FtsY. Mutations of Ffh-Arg255 and FtsY-Lys453 inhibit complex formation, demonstrating that the contacts made by these residues are required to form a stable complex14,36. Mutation of the absolutely conserved glycine residues (Ffh-Gly257 and FtsY-Gly455) that are adjacent to Ffh-Arg255 and FtsY-Lys453 also affect complex formation, demonstrating that conformational flexibility in this region is crucial for binding (data not shown and refs. 36,37). In the complex structure, only the first six amino acids of helix N1 clash with Arg255 or Lys453 and the C-terminal helices, consistent with our results that truncation of only the first eight amino acids of Ffh mimic truncation of the entire helix (Supplementary Fig. 2). Finally, the interaction of Ffh-Arg255 and FtsY-Lys453 with the C-terminal helices of the NG domains brings residues on that helix into contact with the GTPase cores of Ffh and FtsY, explaining the link between truncation of helix N1 and the increased basal GTPase activity of FtsY (and, more modestly, of Ffh).
A physical model describing the mechanism of SRP RNA catalysis
The mechanism by which SRP RNA catalyzes the interaction of SRP and SR is a mystery. The results presented here provide a thermodynamic framework that suggests a physical model for the mechanism of SRP RNA catalysis (summarized in Fig. 8).
Figure 8.
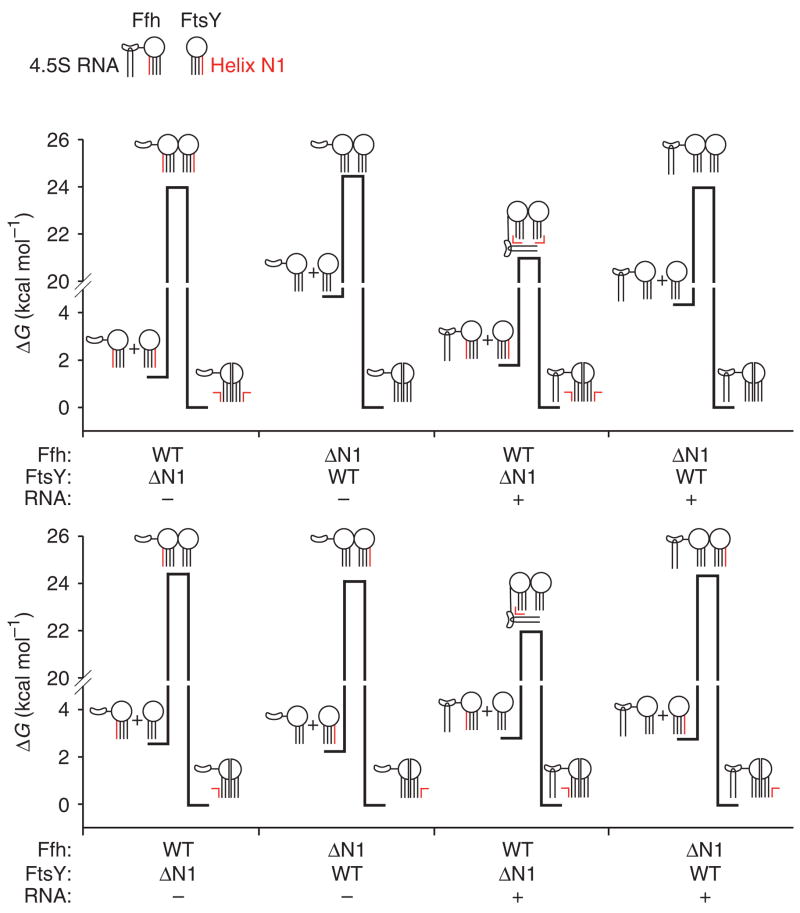
Thermodynamic model describing the mechanism of SRP RNA control of the interaction of the SRP and SR. Free-energy diagrams for interaction of Ffh and FtsY wild type (WT) and N-terminal truncation variants with and without 4.5S RNA. The free energy of activation is calculated from the observed association and dissociation rate constants (k) using the equation ΔG‡ = −RT ln(hk/kBT), where h is Planck’s constant, kB is the Boltzmann constant, T is the absolute temperature and R is the universal gas constant. For forward reactions, a standard state of 1 μM was used to calculate free-energy changes. Cartoons depict Ffh and FtsY with circles representing the GTPase domain and lines representing the N-terminal four-helix bundle. The N1 helices are shown in red. Ffh additionally is shown with the M domain and the 4.5S RNA (hairpin). 4.5S RNA is shown interacting with helix N1 of Ffh and FtsY in the transition-state complex in a manner that is dependent on helix N1 of Ffh.
In the absence of SRP RNA, the energy to reach the transition state for complex formation is high owing to the requirement to move helix N1. Truncation of helix N1 from both Ffh and FtsY reduces the energy required to reach the transition state for complex formation by 2.9 kcal mol−1 but has virtually no effect on the dissociation reaction, suggesting that helix N1 truncation destabilizes the ground state of the unbound proteins, although the energetic state of the complex does not change. Similar to helix N1 truncations, SRP RNA reduces the energy barrier for the association reaction by approximately 3.5 kcal mol−1. SRP RNA reduces the energy of the dissociation reaction by a similar amount, suggesting that it stabilizes the transition state. We therefore hypothesize that SRP RNA moves the N1 helices of both Ffh and FtsY in the transition state, which lowers the energy barrier to complex formation. A schematic representation of how each of the truncations affects the thermodynamics of the Ffh–FtsY interaction is presented in Figure 8.
The N1 helices of both Ffh and FtsY are autoinhibitory for complex formation, but only helix N1 of Ffh is required for the stimulatory effect of SRP RNA. This demonstrates a link between the conformational switch described above and the mechanism of SRP RNA catalysis. We hypothesize that SRP RNA moves Ffh helix N1 to a conformation favorable for complex formation with FtsY. Currently, we cannot distinguish whether this occurs through a direct interaction or through an allosteric mechanism. Our results also demonstrate that helix N1 of FtsY must move for complex formation. This connection between SRP RNA and the conformation of FtsY is supported by previous results showing that the M domain of Ffh (to which SRP RNA binds) can be cross-linked to the N terminus of FtsY38. Taken together, these observations suggest that the SRP RNA interacts with Ffh helix N1 and FtsY helix N1 in the transition state to stabilize a conformation favorable to interaction.
Implications of the conformational switch for protein targeting
The conformational switch regulating the Ffh–FtsY interaction has important implications for the mechanism of co-translational protein targeting. Structural studies of the SRP RNA in complex with Ffh, as well as mutational analysis of Ffh, suggest that the activity of the SRP RNA is controlled by the signal-sequence binding state of Ffh15,24. Such a link suggests that the conformational switch described here may constitute the heart of the mechanism by which the interaction of the SRP and SR is coordinated with signal-sequence binding. Furthermore, recent studies have implicated helix N1 of FtsY in association of FtsY with the membrane and transfer of the ribosome from Ffh to the translocon39,40. Given our result that helix N1 of FtsY is exposed by formation of the Ffh–FtsY complex, exposure of helix N1 may coordinate complex formation with membrane association, and the exposed helix N1 may directly stimulate the transfer of the nascent chain to the translocon. Thus, our results provide a conceptual framework for how the stepwise coordination of the SRP-mediated protein-targeting reaction could be achieved.
METHODS
Reagents
We created plasmids for expression and purification of native E. coli FtsY variants containing residues 197–497, 204–497 and 221–497, and E. coli Ffh containing residues 9–454 and 21–494, by PCR amplifying the correct sequence with primers that added NdeI and BamHI sites to the 5′ and 3′ ends, respectively, of the sequence. These PCR products were cut and ligated into the Nde1 and BamHI sites of pET41a (Novagen).
We purified Ffh, 4.5S RNA and FfhΔN1 as previously described3. FtsY variants were expressed in BL21 DE3 cells and induced with 0.4 mM IPTG for 4 h. Cell pellets were resuspended in 200 mM NaCl, 50 mM Tris, pH 8 and 2 mM DTT, and lysed with a microfluidizer. After clearing the lysate, a 45–55% saturation (FtsY197 and FtsY204) or a 55–65% saturation (FtsYΔN1) (NH4)2SO4 cut was taken. Protein was resuspended and desalted to 75 mM NaCl, 50 mM Tris, pH 8, 2 mM DTT. Desalted protein was applied to a MonoQ column (GE Healthcare), washed, and eluted to 350 mM NaCl over six column volumes. Peak fractions were applied to a hydroxyapetite column equilibrated with 200 mM KCl, 50 mM Tris, pH 8, and 2 mM DTT, washed, and eluted over three column volumes to 200 mM potassium phosphate, pH 8, 200 mM KCl, 2 mM DTT. Peak fractions were pooled and applied to a Superdex 200 gel-filtration column (GE Healthcare) equilibrated in 50 mM Tris, pH 8, 200 mM NaCl, 2 mM DTT and 5% (v/v) glycerol. Peak fractions were pooled and stored at −80 °C. In all cases, proteins were purified to >95% purity.
Fluorescence binding assays
We carried out fluorescence binding assays as described3. In all cases, assays were performed at 23 °C in 50 mM HEPES, pH 7.5, 150 mM potassium acetate, 2 mM magnesium acetate, 0.01% (w/v) Nikkol detergent, 2 mM DTT and 100 μM GppNHp. Data were collected on a stopped-flow fluorimeter for fast association rates (KinTek) or a SLM 8100 fluorimeter for slow association with an excitation wavelength of 290 nM and an emission wavelength of 340 nM. For on rates, data were fit to a single-exponential function, and observed rate constants were plotted as a function of concentration. Rate constants were calculated using the equation kobs = kon[Ffh] + koff.
We calculated off rates by preforming complexes of 2 μM of each Ffh (± 4.5S RNA) and FtsY with 100 μM GppNHp and then trapping dissociated complexes by mixing with 4 mM GDP-Mg2+. Curves were fit to a single-exponential function.
GTP hydrolysis–driven dissociation was measured in a similar manner to off-rate measurements using a pulse chase experiment. Complexes were formed in the presence of GTP and were then rapidly mixed with 4 mM GDP-Mg2+. Dissociation of the GTPFfh–FtsYGTP complex was measured by monitoring the decrease in tryptophan fluorescence as the complex dissociates.
GTPase assays
We carried out GTPase assays as described3 with slight modifications. To calculate the basal GTPase activities, trace amounts of γ32P-GTP were added to varying concentrations of protein, and reactions were followed to completion. The data were fit to a single-exponential equation to calculate the kobs. Observed rate constants were plotted as a function of concentration of protein and fit to the equation kobs = kcat[protein]/(KM+[protein]). To ensure that changes in basal GTP hydrolysis were not due to contaminating GTPases, we compared the Km for the GTP-hydrolysis reaction to the inhibition constant (Ki) calculated by inhibiting the reaction with GppNHp. In all cases, the Ki was measured to be within two-fold of the KM (data not shown).
Nuclear magnetic resonance
We purified proteins for NMR as described above with several modifications. Proteins were expressed in M9 minimal media made with D2O. At 30 min before induction of protein expression, γ-13C labeled α-ketoacid precursors to isoleucine, leucine and valine were added41,42. All data were collected on either a 600 MHz Varian Inova spectrometer or an 800 MHz Bruker Avance spectrometer outfitted with cryogenic probes. 13C gradient enhanced HSQC experiments were performed in 20 mM NaPO4, pH 7, 250 mM NaCl, 2 mM DTT and 2 mM MgCl2. Spectra of FtsYΔN1 were taken with 300 μM protein with or without 2 mM GppNHp-Mg2+. Spectra of FtsY204 were taken with 800 μM protein with or without 2 mM GppNHp-Mg2+ and equimolar Ffh.
Partial proteolysis and N-terminal sequencing
For partial proteolysis assays, 1 μM FtsY variants and 1.5 μM Ffh–4.5S RNA were assembled in assay buffer with 100 μM GppNHp or GDP for 10 min at 25 °C. Proteinase K was added to 2 ng μl−1 and the reaction was stopped at the appropriate time by adding the sample to a final concentration of 5% (w/v) ice-cold trichloroacetic acid (TCA). Samples were precipitated, washed with ice-cold acetone, resolved by SDS-PAGE, transferred to PVDF membranes, and detected by western blot using polyclonal antibody against FtsY. N-terminal sequencing was obtained from the Stanford Protein and Nucleic Acid (PAN) facility.
Supplementary Material
Acknowledgments
The authors would like to thank C. Guthrie, P. Egea and members of the Walter laboratory for insightful comments and careful reading of the manuscript. This work was supported by funding to P.W. from the US National Institutes of Health and the Howard Hughes Medical Institute. The Jane Coffin Childs Memorial Fund supports S.B.N. N.B. was supported by a predoctoral fellowship from the US National Science Foundation. J.D.G. and S.N.F. were supported by the Sandler Family Foundation for Basic Sciences. S.N.F. was supported in part by the Achievement Awards for College Scientists (ARCS) Foundation.
Footnotes
Note: Supplementary information is available on the Nature Structural & Molecular Biology website.
AUTHOR CONTRIBUTIONS
S.B.N. and N.B. prepared reagents and performed Ffh–FtsY association and dissociation assays; N.B. carried out GTPase experiments; N.B., S.N.F. and J.D.G. designed, executed and interpreted the NMR experiments; S.B.N. performed partial proteolysis assays; S.B.N., N.B. and P.W. wrote the article.
Reprints and permissions information is available online at http://npg.nature.com/reprintsandpermissions/
References
- 1.Egea PF, Stroud RM, Walter P. Targeting proteins to membranes: structure of the signal recognition particle. Curr Opin Struct Biol. 2005;15:213–220. doi: 10.1016/j.sbi.2005.03.007. [DOI] [PubMed] [Google Scholar]
- 2.Keenan RJ, Freymann DM, Stroud RM, Walter P. The signal recognition particle. Annu Rev Biochem. 2001;70:755–775. doi: 10.1146/annurev.biochem.70.1.755. [DOI] [PubMed] [Google Scholar]
- 3.Peluso P, Shan SO, Nock S, Herschlag D, Walter P. Role of SRP RNA in the GTPase cycles of Ffh and FtsY. Biochemistry. 2001;40:15224–15233. doi: 10.1021/bi011639y. [DOI] [PubMed] [Google Scholar]
- 4.Miller JD, Wilhelm H, Gierasch L, Gilmore R, Walter P. GTP binding and hydrolysis by the signal recognition particle during initiation of protein translocation. Nature. 1993;366:351–354. doi: 10.1038/366351a0. [DOI] [PubMed] [Google Scholar]
- 5.Poritz MA, et al. An E. coli ribonucleoprotein containing 4.5S RNA resembles mammalian signal recognition particle. Science. 1990;250:1111–1117. doi: 10.1126/science.1701272. [DOI] [PubMed] [Google Scholar]
- 6.Miller JD, Bernstein HD, Walter P. Interaction of E. coli Ffh/4.5S ribonucleo-protein and FtsY mimics that of mammalian signal recognition particle and its receptor. Nature. 1994;367:657–659. doi: 10.1038/367657a0. [DOI] [PubMed] [Google Scholar]
- 7.Phillips GJ, Silhavy TJ. The E. coli ffh gene is necessary for viability and efficient protein export. Nature. 1992;359:744–746. doi: 10.1038/359744a0. [DOI] [PubMed] [Google Scholar]
- 8.Eitan A, Bibi E. The core Escherichia coli signal recognition particle receptor contains only the N and G domains of FtsY. J Bacteriol. 2004;186:2492–2494. doi: 10.1128/JB.186.8.2492-2494.2004. [DOI] [PMC free article] [PubMed] [Google Scholar]
- 9.Bernstein HD, Zopf D, Freymann DM, Walter P. Functional substitution of the signal recognition particle 54-kDa subunit by its Escherichia coli homolog. Proc Natl Acad Sci USA. 1993;90:5229–5233. doi: 10.1073/pnas.90.11.5229. [DOI] [PMC free article] [PubMed] [Google Scholar]
- 10.Powers T, Walter P. Co-translational protein targeting catalyzed by the Escherichia coli signal recognition particle and its receptor. EMBO J. 1997;16:4880–4886. doi: 10.1093/emboj/16.16.4880. [DOI] [PMC free article] [PubMed] [Google Scholar]
- 11.Montoya G, Svensson C, Luirink J, Sinning I. Crystal structure of the NG domain from the signal-recognition particle receptor FtsY. Nature. 1997;385:365–368. doi: 10.1038/385365a0. [DOI] [PubMed] [Google Scholar]
- 12.Freymann DM, Keenan RJ, Stroud RM, Walter P. Structure of the conserved GTPase domain of the signal recognition particle. Nature. 1997;385:361–364. doi: 10.1038/385361a0. [DOI] [PubMed] [Google Scholar]
- 13.Focia PJ, Shepotinovskaya IV, Seidler JA, Freymann DM. Heterodimeric GTPase core of the SRP targeting complex. Science. 2004;303:373–377. doi: 10.1126/science.1090827. [DOI] [PMC free article] [PubMed] [Google Scholar]
- 14.Egea PF, et al. Substrate twinning activates the signal recognition particle and its receptor. Nature. 2004;427:215–221. doi: 10.1038/nature02250. [DOI] [PubMed] [Google Scholar]
- 15.Batey RT, Rambo RP, Lucast L, Rha B, Doudna JA. Crystal structure of the ribonucleoprotein core of the signal recognition particle. Science. 2000;287:1232–1239. doi: 10.1126/science.287.5456.1232. [DOI] [PubMed] [Google Scholar]
- 16.Keenan RJ, Freymann DM, Walter P, Stroud RM. Crystal structure of the signal sequence binding subunit of the signal recognition particle. Cell. 1998;94:181–191. doi: 10.1016/s0092-8674(00)81418-x. [DOI] [PubMed] [Google Scholar]
- 17.Zopf D, Bernstein HD, Johnson AE, Walter P. The methionine-rich domain of the 54 kD protein subunit of the signal recognition particle contains an RNA binding site and can be crosslinked to a signal sequence. EMBO J. 1990;9:4511–4517. doi: 10.1002/j.1460-2075.1990.tb07902.x. [DOI] [PMC free article] [PubMed] [Google Scholar]
- 18.de Leeuw E, et al. Membrane association of FtsY, the E. coli SRP receptor. FEBS Lett. 1997;416:225–229. doi: 10.1016/s0014-5793(97)01238-6. [DOI] [PubMed] [Google Scholar]
- 19.Angelini S, Boy D, Schiltz E, Koch HG. Membrane binding of the bacterial signal recognition particle receptor involves two distinct binding sites. J Cell Biol. 2006;174:715–724. doi: 10.1083/jcb.200606093. [DOI] [PMC free article] [PubMed] [Google Scholar]
- 20.Regalia M, Rosenblad MA, Samuelsson T. Prediction of signal recognition particle RNA genes. Nucleic Acids Res. 2002;30:3368–3377. doi: 10.1093/nar/gkf468. [DOI] [PMC free article] [PubMed] [Google Scholar]
- 21.Rosenblad MA, Samuelsson T. Identification of chloroplast signal recognition particle RNA genes. Plant Cell Physiol. 2004;45:1633–1639. doi: 10.1093/pcp/pch185. [DOI] [PubMed] [Google Scholar]
- 22.Brown S, Fournier MJ. The 4.5 S RNA gene of Escherichia coli is essential for cell growth. J Mol Biol. 1984;178:533–550. doi: 10.1016/0022-2836(84)90237-7. [DOI] [PubMed] [Google Scholar]
- 23.Peluso P, et al. Role of 4.5S RNA in assembly of the bacterial signal recognition particle with its receptor. Science. 2000;288:1640–1643. doi: 10.1126/science.288.5471.1640. [DOI] [PubMed] [Google Scholar]
- 24.Bradshaw N, Walter P. The signal recognition particle (SRP) RNA links conformational changes in the SRP to protein targeting. Mol Biol Cell. 2007;18:2728–2734. doi: 10.1091/mbc.E07-02-0117. [DOI] [PMC free article] [PubMed] [Google Scholar]
- 25.Reyes CL, Rutenber E, Walter P, Stroud RM. X-ray structures of the signal recognition particle receptor reveal targeting cycle intermediates. PLoS ONE. 2007;2:e607. doi: 10.1371/journal.pone.0000607. [DOI] [PMC free article] [PubMed] [Google Scholar]
- 26.Gawronski-Salerno J, Freymann DM. Structure of the GMPPNP-stabilized NG domain complex of the SRP GTPases Ffh and FtsY. J Struct Biol. 2006;158:122–128. doi: 10.1016/j.jsb.2006.10.025. [DOI] [PMC free article] [PubMed] [Google Scholar]
- 27.Focia PJ, Gawronski-Salerno J, Coon JSV, Freymann DM. Structure of a GDP:AlF4 complex of the SRP GTPases Ffh and FtsY, and identification of a peripheral nucleotide interaction site. J Mol Biol. 2006;360:631–643. doi: 10.1016/j.jmb.2006.05.031. [DOI] [PMC free article] [PubMed] [Google Scholar]
- 28.Shepotinovskaya IV, Freymann DM. Conformational change of the N domain on formation of the complex between the GTPase domains of Thermus aquaticus Ffh and FtsY. Biochim Biophys Acta. 2002;1597:107–114. doi: 10.1016/s0167-4838(02)00287-x. [DOI] [PMC free article] [PubMed] [Google Scholar]
- 29.Chandrasekar S, Chartron J, Jaru-Ampornpan P, Shan SO. Structure of the chloroplast signal recognition particle (SRP) receptor: domain arrangement modulates SRP-receptor interaction. J Mol Biol. 2008;375:425–436. doi: 10.1016/j.jmb.2007.09.061. [DOI] [PubMed] [Google Scholar]
- 30.Jagath JR, Rodnina MV, Wintermeyer W. Conformational changes in the bacterial SRP receptor FtsY upon binding of guanine nucleotides and SRP. J Mol Biol. 2000;295:745–753. doi: 10.1006/jmbi.1999.3427. [DOI] [PubMed] [Google Scholar]
- 31.Schmitz U, et al. NMR studies of the most conserved RNA domain of the mammalian signal recognition particle (SRP) RNA. 1996;2:1213–1227. [PMC free article] [PubMed] [Google Scholar]
- 32.Shan SO, Walter P. Molecular crosstalk between the nucleotide specificity determinant of the SRP GTPase and the SRP receptor. Biochemistry. 2005;44:6214–6222. doi: 10.1021/bi0500980. [DOI] [PubMed] [Google Scholar]
- 33.Sprangers R, Kay LE. Quantitative dynamics and binding studies of the 20S proteasome by NMR. Nature. 2007;445:618–622. doi: 10.1038/nature05512. [DOI] [PubMed] [Google Scholar]
- 34.Gawronski-Salerno J, Coon JSV, Focia PJ, Freymann DM. X-ray structure of the T. aquaticus FtsY:GDP complex suggests functional roles for the C-terminal helix of the SRP GTPases. Proteins. 2007;66:984–995. doi: 10.1002/prot.21200. [DOI] [PMC free article] [PubMed] [Google Scholar]
- 35.Gariani T, Samuelsson T, Sauer-Eriksson AE. Conformational variability of the GTPase domain of the signal recognition particle receptor FtsY. J Struct Biol. 2006;153:85–96. doi: 10.1016/j.jsb.2005.10.003. [DOI] [PubMed] [Google Scholar]
- 36.Shan SO, Stroud RM, Walter P. Mechanism of association and reciprocal activation of two GTPases. PLoS Biol. 2004;2:e320. doi: 10.1371/journal.pbio.0020320. [DOI] [PMC free article] [PubMed] [Google Scholar]
- 37.Lu Y, et al. Evidence for a novel GTPase priming step in the SRP protein targeting pathway. EMBO J. 2001;20:6724–6734. doi: 10.1093/emboj/20.23.6724. [DOI] [PMC free article] [PubMed] [Google Scholar]
- 38.Chu F, et al. Unraveling the interface of signal recognition particle and its receptor by using chemical cross-linking and tandem mass spectrometry. Proc Natl Acad Sci USA. 2004;101:16454–16459. doi: 10.1073/pnas.0407456101. [DOI] [PMC free article] [PubMed] [Google Scholar]
- 39.Parlitz R, et al. Escherichia coli signal recognition particle receptor FtsY contains an essential and autonomous membrane-binding amphipathic helix. J Biol Chem. 2007;282:32176–32184. doi: 10.1074/jbc.M705430200. [DOI] [PubMed] [Google Scholar]
- 40.Bahari L, et al. Membrane targeting of ribosomes and their release require distinct and separable functions of FtsY. J Biol Chem. 2007;282:32168–32175. doi: 10.1074/jbc.M705429200. [DOI] [PubMed] [Google Scholar]
- 41.Gross JD, Gelev VM, Wagner G. A sensitive and robust method for obtaining intermolecular NOEs between side chains in large protein complexes. J Biomol NMR. 2003;25:235–242. doi: 10.1023/a:1022890112109. [DOI] [PubMed] [Google Scholar]
- 42.Goto NK, Gardner KH, Mueller GA, Willis RC, Kay LE. A robust and cost-effective method for the production of Val, Leu, Ile (delta 1) methyl-protonated 15N-, 13C-, 2H-labeled proteins. J Biomol NMR. 1999;13:369–374. doi: 10.1023/a:1008393201236. [DOI] [PubMed] [Google Scholar]
Associated Data
This section collects any data citations, data availability statements, or supplementary materials included in this article.


