

Abstract
We use electrospray ionization mass spectrometry to quantify >100 phospholipid (PL) components in detergent-resistant membrane (DRM) domains that are related to ordered membrane compartments commonly known as lipid rafts. We previously compared PL compositions of DRMs with plasma membrane vesicles and whole cell lipid extracts from RBL mast cells, and we made the initial observation that antigen stimulation of IgE receptors (FcεRI) causes a significant change in the PL composition of DRMs (Fridriksson, et al., Biochemistry 38: 8056, 1999). We now characterize the signaling requirements and time course for this change, which is manifested as an increase in the recovery of polyunsaturated PL in DRM, particularly in phosphatidylinositol species. We find that this change is largely independent of tyrosine phosphorylation, stimulated by engagement of FcεRI, and can be activated by Ca2+ ionophore independent of antigen stimulation. Unexpectedly, we found that inhibitors of actin polymerization (cytochalasin D, latrunculin A) cause a similar, but more rapid, change in the PL composition of DRMs in the absence of FcεRI activation, indicating that perturbations in the actin cytoskeleton affect the organization of plasma membrane domains. Consistent with this interpretation, a membrane-permeable stabilizer of F-actin, jasplakinolide, prevents antigen-stimulated changes in DRM PL composition. These results are confirmed by a detailed analysis of multiple experiments, showing that receptor and cytochalasin D-stimulated changes in DRM lipid composition follow first-order kinetics. Analysis in terms of the number of double bonds in the fatty acid chains is valid for total PL of the major head groups and for head groups individually. In this manner we show that, on average, concentrations of saturated or monounsaturated PL decrease in the DRM, whereas concentrations of PL with two or more double bonds (polyunsaturated PL) increase due to cytoskeletal perturbation. We find that these changes are independent of fatty acid chain length. Our mass spectrometric analyses provide a detailed accounting of receptor-activated alterations in the plasma membrane that are regulated by the actin cytoskeleton.
Keywords: Mast cells, lipid rafts, electrospray ionization mass spectrometry, membrane lipid composition
Functional roles for lipid heterogeneity and lipid-based membrane domains in cellular processes have received increasing attention during the past decade (1, 2). Central to this topic are regions of the plasma membrane containing lipids with liquid ordered (Lo)-like phase behavior, commonly called lipid rafts (2, 3). Originally identified as a subset of plasma membrane lipids and proteins that are not solubilized by mild detergents such as Triton X-100 (4–6), these membrane domains have been implicated in a variety of cellular functions, including receptor signaling, vesicle trafficking to and from the plasma membrane, and host-pathogen interactions (7–9). Studies on model membranes show that membrane domains composed predominately of cholesterol and sphingomyelin or saturated phosphoglycerolipids are in an Lo phase that is sufficient to confer detergent resistance and segregation from liquid disordered (Ld) regions of lipid bilayers (2). However, because lipid rafts in cells have variable lipid and protein composition, are dynamic, and are difficult to detect by optical microscopy or other non-destructive methods, their true nature and even their existence in live cells has been a subject of controversy (10, 11) and continues to be evaluated with the development of new approaches (12, 13).
Although use of detergent resistance as an indicator for lipid rafts in cells requires careful interpretation, this property continues to serve as a valuable correlative tool (13). A complementary approach frequently used to visualize coalesced lipid rafts in live cells is to crosslink certain receptors or lipid raft components under conditions that result in large-scale co-clustering of other raft components (14–17). Results from these fluorescence imaging experiments are generally consistent with predictions from detergent-dependent membrane fractionation (8, 12), and, used together with biological assays, they support the relevance of this biochemical approach to the functional characterization of lipid rafts and associated components. In mast cells, crosslinking of the high affinity IgE receptor, FcεRI, causes its stable association with lipid rafts as assessed by cell lysis with low concentrations of detergent (e.g., 0.05% Triton X-100) and sucrose gradient fractionation. This association is highly correlated with the initiation of cell signaling mediated by native FcεRI (18) or chimeric, single-chain IgE receptors (19).
Under experimental conditions that show co-redistribution of lipid raft components at the cell surface, F-actin is commonly found to co-localize with raft domains by fluorescence microscopy imaging, suggesting a structural relationship between lipid rafts and the cortical cytoskeleton (20–22). Consistent with this observation, alteration of cholesterol content that inhibits initiation of IgE receptor signaling (16) can also perturb plasma membrane-cytoskeletal interactions (23). Results in the present study provide new evidence from mass spectrometry for significant coupling between lipid rafts and the actin cytoskeleton.
In a previous study (24), we used Fourier transform mass spectrometry (FTMS) with electrospray ionization (ESI/MS) to characterize the phospholipid (PL) composition of plasma membranes and detergent resistant membranes (DRMs) isolated from RBL mast cells. The unusual FTMS capabilities of resolving power and sensitivity identified unique molecular masses of nearly 100 components, including a number of new species, while mass isolation and dissociation of individual molecular ions provided fragment masses for reliable molecular characterization (24). We showed that both of these membrane preparations are enriched in sphingomyelin and phosphoglycerolipids with saturated or monounsaturated acyl chains, compared to phosphoglycerolipids with polyunsaturated acyl chains. However, the DRM preparations have significantly higher percentages of sphingomyelin and saturated acyl chains, as expected for Lo domains. In contrast, PLs extracted from the whole cells are highly enriched in polyunsaturated species. We discovered that stimulation of RBL cells via FcεRI causes a substantial increase in the ratio of polyunsaturated to saturated plus monounsaturated PLs (P/S+M) recovered in DRMs. The structural and functional basis for this stimulated change was intriguing but unclear. In the present study, we collect and analyze extensive mass spectrometry data to characterize this DRM lipid compositional change and its temporal trend, and we find that this change follows first-order kinetics and depends on stimulated changes in the actin cytoskeleton. Our results point to sensitive, dynamic regulation of lipid rafts by the actin cytoskeleton that is modulated during receptor-mediated cell activation.
MATERIALS AND METHODS
Cell Stimulation, DRM Vesicle Isolation, and Lipid Extraction
Methods used are similar to those described by Fridriksson et al. (24), with some modifications. RBL-2H3 cells (25) were sensitized overnight with a 2–5 molar excess over FcεRI of purified anti-DNP IgE (26). Cells were harvested, washed twice with buffered saline solution (BSS: 135 mM NaCl, 5 mM KCl, 1 mM MgCl2, 1.8 mM CaCl2, 5.6 mM glucose, 20 mM HEPES, pH 7.4, 1 mg/ml BSA) and resuspended at 8 × 10⁶ cells/mL. Cells were stimulated with multivalent DNP-BSA (2–5 μg/ml) for 2 to 30 min at 37°C. For some experiments, the Src family tyrosine kinase inhibitor PP1 (BioMol, Plymouth Meeting, PA) was added at 4 μM, 2 min prior to antigen stimulation. For other experiments, jasplakinolide (Invitrogen/Molecular Probes, Eugene, OR) was added at 3 μM for 1 hour at 37°C prior to antigen stimulation. Alternatively, cells were stimulated with 0.9 μM A23187 (Calbiochem, San Diego, CA) for 5 or 15 min, or treated with 0.2–2μM cytochalasin D (Sigma Chemical Co, St. Louis, MO) or 0.2 μM latrunculin A (Invitrogen/Molecular Probes) for 1, 2 or 10 min, all at 37°C.
Following stimulation, cells were lysed by mixing 1:1 with 2x ice-cold lysis buffer (20 mM Tris-HCl, 100 mM NaCl, 2 mM sodium orthovanadate, 60 mM sodium pyrophosphate, 20 mM sodium glycerophosphate, 0.04 U/ml aprotinin, 0.02% sodium azide) containing 0.09% Triton X-100 and 2 mM 4-(2-aminoethyl)benzenesulfonyl fluoride hydrochloride (AEBSF) (Sigma). After 10 min at 4°C, 3.6 pmoles of 1,2-di-nonadecanoyl-sn-glycero-3-phosphatidylcholine (Avanti; PC 38:0) was added as an exogenous lipid standard (accounts for 1–2 Mol% of total lipids detected). Then 10 ml of this cell lysate was mixed 1:1 with 80% sucrose (w/v) in HEPES/saline buffer (25 mM HEPES, 150 mM NaCl and 2 mM EDTA, pH 7.5). These lysates were placed in centrifuge tubes, then 5 ml of 35% sucrose and 5 ml of 5% sucrose in HEPES/saline buffer were carefully layered on top of the 40% sucrose solution containing the cell lysates. Gradients were centrifuged at 100,000 ×g for 15–18 hr at 4°C using a Beckman SW-28 rotor in a Sorvall Discovery 100S ultracentrifuge.
After centrifugation, two opaque bands were visible, and the upper band (3 mL), previously identified as containing the DRMs (24), was collected from the interface of the 5% and 35% layers. The contents were diluted with 15 mL phosphate buffered saline (PBS) containing 1 mM EDTA and centrifuged at 300,000 ×g for 30 min at 4°C in a Beckman Ti60 rotor. Pellets were resuspended in 400 μl PBS-EDTA, and lipids were extracted using a modified Bligh-Dyer method (27): the suspended pellets were each mixed with 1.5 mL chloroform/methanol at a 1:2 ratio and vortexed, then 0.5 mL of chloroform was added, and samples were vortexed again. Finally, 0.5 mL of 2N HCl was added, and samples were vortexed and then centrifuged at 2000 ×g for 5 min to achieve phase separation. The lower (chloroform) layer was collected and used for ESI/MS analysis. To determine plasmalogen content of DRMs, pellets were resuspended in 400 μl of 50 mM LiCl, pH 6. 50 mM LiCl was also used in place of 2 N HCL in the extraction process (28).
To determine the percentage of cellular PL recovered in DRMs, 2 × 10⁶ cells in BSS were pelleted, resuspended in 400 μl PBS-EDTA and PL were extracted as described for DRMs. For organic phosphate analysis to quantify PL concentrations, extracted PL in chloroform from either DRMs (200 μl) or cells (1 ml) was treated as described previously (58), and the amount of organic phosphate was used as a measure of PL recovered. Comparison of PL recovered per cell equivalent of extracted DRMs and cells permits calculation of the % of PL recovered in DRMs.
Tyrosine Phosphorylation Assay
RBL-2H3 cells were sensitized overnight with IgE as above, harvested and washed twice with BSS, and then resuspended at 2 × 10⁶ cells/ml. Cells were then stimulated with DNP-BSA (0.8 μg/ml) in the presence or absence of 4 μM PP1 at 37°C for times indicated. Samples were quenched by addition of 5x sample buffer (50% glycerol, 0.25 M Tris, pH 6.8), 5% (w/v) SDS, 0.05% (w.v) bromophenol blue) and boiling for 5 min. Samples were electrophoresed and detected by western blotting with 4G10 anti-phosphotyrosine (19).
Cholesterol Content Assay
Free cholesterol in DRMs was assayed using the Amplex Red Cholesterol Assay Kit (Invitrogen/Molecular Probes) following kit instructions, except that cholesterol esterase was omitted from the DRM samples. Following specified incubations, samples were placed on ice, and sample fluorescence was measured with an SLM 8000C spectrofluorometer. We found that 10 μl aliquots of pelleted, resuspended DRMs contain cholesterol values in the linear region of the standard curve.
Quantitative Analysis of Phospholipids Using Electrospray Ionization Mass Spectrometry (ESI/MS)
Spectra were acquired on a modified 6T Finnigan FTMS instrument (Finnigan, Madison, WI) equipped with an electrospray ion source, as described previously (29). Prior to nanospraying, lipid extracts prepared as described above were diluted 10-fold in 49:49:2 (v/v/v) methanol:chloroform:acetic acid for the positive ion mode and 10-fold in 1:1 (v/v) methanol:chloroform for the negative ion mode (30, 31). Typically, less than 2 × 10⁵ cell equivalents of the lipid extract (<6 nmol of phospholipid) were needed to obtain complete positive and negative mode spectra. For determination of plasmalogen species in the extract, LiOH was added to a final concentration of 2mM prior to the analyses; in the positive ion spectra the lipid species were observed as Li adducts (+ 6 Da). For each sample, four separate aliquots were measured and mol % values (± standard deviation) were determined for each species.
Relative instrument responses (peak intensity per mole of analyte) were determined using a standard mixture of phosphatidylcholine (PC): phosphatidylethanolamine (PE): sphingomyelin (SM): phosphatidylinositol (PI): phosphatidylglycerol (PG): phosphatidylserine (PS): phosphatidic acid (PA) at equimolar ratios for both the positive ion mode and the negative ion mode (24). Variation of instrument response per mole with acyl chain length and degree of unsaturation was not evaluated, but it is far less than that with headgroups at the low concentration used here (32). Any such variation will not affect the change of mol% values with experimental parameters on a relative basis. As previously established (33), below 100 μmol total lipids, there are no aggregated ions, and the ion counts are proportional to lipid concentrations in these limits. The detailed ESI/MS data were tabulated as mol% for each PL head group in terms of acyl chain length (number of carbon atoms) and number of double bonds (see Table 1). For kinetic analyses these values are summed for both acyl chains of PC, PE, PS, PI, PG, PA or for the single acyl chain of SM. The mol% data were compiled for samples taken at multiple time points after initiation of a specified treatment. Table 1 and Figures 3 and 5 show representative data from a single experiment. Figures 1, 2, and 4 show data from multiple experiments averaged together.
TABLE 1.
Normalized mol % of PL in DRMs isolated from cells before and at specified times after DNP-BSA stimulation.
| PC (M+H)+ | SM (M+H)+ | PE (M+H)+ | PS (M−H)− | PI (M−H)− | PG (M−H)− | PA (M−H)− | ||||||||||||||||||||||
|---|---|---|---|---|---|---|---|---|---|---|---|---|---|---|---|---|---|---|---|---|---|---|---|---|---|---|---|---|
| Lipid | 0a | 2 | 5 | 10 | 0 | 2 | 5 | 10 | 0 | 2 | 5 | 10 | 0 | 2 | 5 | 10 | 0 | 2 | 5 | 10 | 0 | 2 | 5 | 10 | 0 | 2 | 5 | 10 |
| 32:0 b | 1.2 | 0.6 | 0.6 | 0.4 | 0.01 | 0.02 | 0.02 | 0.01 | ||||||||||||||||||||
| 34:0 | 1.2 | 0.9 | 0.7 | 0.5 | 1.7 | 0.9 | 1.0 | 0.8 | 0.1 | 0.1 | 0.2 | 0.2 | 0.2 | 0.4 | 0.3 | 0.4 | 0.05 | 0.07 | 0.07 | 0.09 | ||||||||
| 36:0 | 0.4 | 0.3 | 0.2 | 0.2 | 1.8 | 1.2 | 1.2 | 0.8 | 0.8 | 0.7 | 0.6 | 0.6 | 0.9 | 0.6 | 1.3 | 1.1 | 0.04 | 0.03 | 0.06 | 0.05 | 0.02 | 0.04 | 0.03 | 0.04 | ||||
| 40:0 | 0.7 | 0.6 | 0.5 | 0.9 | ||||||||||||||||||||||||
| 16:0 | 3.6 | 4.0 | 3.4 | 1.8 | ||||||||||||||||||||||||
| 18:0 | 5.3 | 4.0 | 3.4 | 2.0 | ||||||||||||||||||||||||
| 24:0 | 8.7 | 7.4 | 5.6 | 3.2 | ||||||||||||||||||||||||
| sum S | 2.8 | 1.8 | 1.5 | 1.1 | 17.7 | 15.3 | 12.4 | 7.1 | 4.2 | 2.8 | 2.7 | 2.6 | 0.9 | 0.9 | 0.8 | 0.8 | 1.1 | 0.9 | 1.5 | 1.5 | 0.09 | 0.11 | 0.14 | 0.15 | 0.02 | 0.04 | 0.03 | 0.04 |
| SD | 0.3 | 0.2 | 0.2 | 0.3 | 0.7 | 2.2 | 1.7 | 0.7 | 1.2 | 0.4 | 0.3 | 0.6 | 0.0 | 0.2 | 0.3 | 0.1 | 0.0 | 0.2 | 0.8 | 0.5 | 0.02 | 0.03 | 0.05 | 0.02 | 0.00 | 0.01 | 0.01 | 0.03 |
| 32:1 | 1.0 | 0.6 | 0.6 | 0.4 | 0.01 | 0.01 | 0.01 | 0.02 | 0.02 | 0.04 | ||||||||||||||||||
| 34:1 | 4.7 | 3.9 | 3.1 | 2.1 | 1.1 | 0.8 | 0.8 | 0.8 | 0.5 | 0.8 | 0.6 | 0.8 | 0.7 | 1.3 | 1.1 | 1.8 | 0.25 | 0.41 | 0.34 | 0.50 | 0.05 | 0.10 | ||||||
| 36:1 | 2.8 | 2.2 | 1.6 | 1.4 | 4.3 | 3.1 | 3.2 | 2.0 | 5.6 | 4.9 | 3.8 | 3.6 | 4.3 | 2.3 | 4.2 | 3.8 | 0.09 | 0.14 | 0.19 | 0.18 | 0.18 | 0.28 | 0.17 | 0.34 | ||||
| 38:1 | 2.8 | 2.6 | 2.3 | 1.7 | 0.7 | 1.1 | 0.8 | 1.2 | 0.2 | 0.3 | 0.4 | 0.4 | ||||||||||||||||
| 24:1 | 6.1 | 5.5 | 4.4 | 2.7 | ||||||||||||||||||||||||
| sum M | 8.4 | 6.7 | 5.3 | 3.9 | 6.1 | 5.5 | 4.4 | 2.7 | 8.2 | 6.5 | 6.3 | 4.5 | 6.8 | 6.8 | 5.1 | 5.6 | 5.2 | 3.9 | 5.7 | 6.0 | 0.3 | 0.6 | 0.5 | 0.7 | 0.2 | 0.4 | 0.2 | 0.3 |
| SD | 1.4 | 0.7 | 0.8 | 0.8 | 0.6 | 0.6 | 0.8 | 0.5 | 0.8 | 1.3 | 0.9 | 1.4 | 0.3 | 1.8 | 2.0 | 1.0 | 0.8 | 0.8 | 1.3 | 2.0 | 0.1 | 0.2 | 0.3 | 0.2 | 0.1 | 0.1 | 0.1 | 0.2 |
| sum S+M | 11.2 | 8.6 | 6.9 | 5.0 | 23.8 | 20.9 | 16.8 | 9.8 | 12.3 | 9.3 | 9.1 | 7.0 | 7.7 | 7.7 | 5.9 | 6.4 | 6.4 | 4.9 | 7.2 | 7.5 | 0.4 | 0.7 | 0.7 | 0.9 | 0.3 | 0.5 | 0.2 | 0.4 |
| SD | 1.4 | 0.9 | 1.0 | 1.1 | 0.5 | 2.8 | 2.5 | 0.2 | 0.8 | 1.7 | 1.2 | 1.8 | 0.3 | 1.9 | 2.3 | 1.1 | 0.8 | 0.9 | 2.1 | 2.4 | 0.1 | 0.2 | 0.3 | 0.2 | 0.1 | 0.1 | 0.1 | 0.3 |
| 32:2 | 0.1 | 0.1 | 0.1 | 0.1 | 0.02 | 0.05 | 0.02 | 0.02 | ||||||||||||||||||||
| 32:3 | 0.3 | 0.5 | 0.6 | 0.6 | ||||||||||||||||||||||||
| 34:2 | 0.5 | 0.5 | 0.4 | 0.3 | 0.1 | 0.2 | 0.2 | 0.2 | 0.1 | 0.2 | 0.2 | 0.3 | 0.16 | 0.15 | 0.15 | 0.02 | 0.12 | 0.02 | 0.05 | |||||||||
| 34:3 | 0.4 | 0.7 | 0.8 | 0.9 | 0.1 | 0.1 | 0.2 | 0.2 | ||||||||||||||||||||
| 34:4 | 0.4 | 0.6 | 0.7 | 0.8 | 0.1 | 0.1 | 0.1 | 0.1 | ||||||||||||||||||||
| 34:5 | 0.2 | 0.2 | 0.2 | 0.2 | 0.1 | 0.2 | 0.2 | 0.3 | ||||||||||||||||||||
| 34:6 | 0.2 | 0.4 | 0.4 | 0.5 | ||||||||||||||||||||||||
| 36:2 | 1.7 | 1.5 | 1.0 | 1.0 | 0.9 | 1.1 | 0.6 | 0.4 | 0.6 | 0.6 | 0.5 | 0.5 | 1.9 | 1.0 | 1.8 | 1.8 | 0.05 | 0.09 | 0.11 | 0.11 | ||||||||
| 36:3 | 0.7 | 0.9 | 1.0 | 1.3 | 0.7 | 1.1 | 1.2 | 1.4 | 0.1 | 0.1 | 0.1 | 0.1 | ||||||||||||||||
| 36:4 | 1.7 | 3.0 | 3.2 | 4.5 | 0.6 | 0.7 | 0.8 | 1.0 | 0.2 | 0.2 | 0.2 | 0.2 | ||||||||||||||||
| 36:5 | 0.2 | 0.3 | 0.3 | 0.4 | 0.1 | 0.1 | 0.1 | 0.1 | ||||||||||||||||||||
| 38:2 | 1.0 | 0.9 | 0.8 | 0.8 | 0.6 | 1.0 | 0.6 | 0.9 | 0.9 | 0.9 | 1.4 | 1.5 | ||||||||||||||||
| 38:3 | 1.0 | 1.3 | 1.6 | 1.7 | 0.5 | 0.6 | 0.3 | 0.5 | 1.8 | 1.7 | 2.5 | 2.8 | ||||||||||||||||
| 38:4 | 1.0 | 1.4 | 1.6 | 2.1 | 1.9 | 2.9 | 3.5 | 4.6 | 0.2 | 0.3 | 0.2 | 0.2 | 2.3 | 2.6 | 3.1 | 3.4 | 0.03 | 0.06 | 0.04 | 0.06 | ||||||||
| 38:5 | 0.7 | 0.9 | 0.9 | 1.4 | 1.2 | 1.0 | 1.5 | 1.0 | 0.1 | 0.1 | 0.1 | 0.1 | 0.3 | 0.2 | 0.4 | 0.3 | 0.08 | 0.07 | 0.07 | 0.07 | ||||||||
| 38:6 | 0.2 | 0.2 | 0.2 | 0.3 | 0.00 | 0.02 | 0.03 | 0.02 | ||||||||||||||||||||
| 40:3 | 1.6 | 0.7 | 0.8 | 1.4 | 0.07 | 0.22 | 0.08 | 0.10 | ||||||||||||||||||||
| 40:4 | 0.2 | 0.3 | 0.4 | 0.4 | 1.5 | 1.8 | 2.4 | 3.1 | 0.6 | 1.1 | 1.0 | 1.7 | 0.02 | 0.05 | 0.04 | 0.06 | ||||||||||||
| 40:5 | 0.2 | 0.3 | 0.5 | 0.4 | 0.9 | 1.0 | 0.9 | 1.3 | 1.0 | 1.5 | 1.5 | 2.7 | 0.05 | 0.09 | 0.09 | 0.14 | ||||||||||||
| 40:6 | 0.1 | 0.2 | 0.2 | 0.2 | 0.3 | 0.5 | 0.4 | 0.5 | 0.9 | 1.6 | 1.7 | 2.8 | 0.06 | 0.12 | 0.11 | 0.17 | ||||||||||||
| 40:7 | 0.2 | 0.3 | 0.6 | 0.3 | 0.12 | 0.21 | 0.20 | 0.34 | ||||||||||||||||||||
| 40:8 | 0.2 | 0.3 | 0.4 | 0.3 | ||||||||||||||||||||||||
| 42:5 | 0.04 | 0.08 | 0.09 | 0.08 | ||||||||||||||||||||||||
| 42:6 | 0.07 | 0.21 | 0.15 | 0.23 | ||||||||||||||||||||||||
| 42:7 | 0.07 | 0.13 | 0.08 | 0.13 | ||||||||||||||||||||||||
| 18:2 | 0.4 | 0.5 | 0.7 | 0.7 | ||||||||||||||||||||||||
| 18:3 | 1.2 | 1.7 | 2.5 | 2.5 | ||||||||||||||||||||||||
| 20:2 | 0.7 | 1.0 | 1.3 | 1.5 | ||||||||||||||||||||||||
| 20:3 | 1.5 | 2.3 | 3.4 | 3.5 | ||||||||||||||||||||||||
| Sum P | 8.7 | 11.6 | 12.0 | 14.7 | 3.8 | 5.5 | 8.0 | 8.2 | 11.3 | 12.5 | 14.1 | 16.7 | 3.7 | 5.2 | 4.7 | 4.8 | 9.7 | 10.8 | 13.5 | 17.3 | 0.7 | 1.5 | 1.2 | 1.7 | 0.0 | 0.2 | 0.0 | 0.1 |
| SD | 1.7 | 1.5 | 1.7 | 1.4 | 0.9 | 2.1 | 1.4 | 2.4 | 2.9 | 0.9 | 1.2 | 2.2 | 0.4 | 1.3 | 0.6 | 0.5 | 1.5 | 2.1 | 2.1 | 2.0 | 0.1 | 0.3 | 0.2 | 0.3 | 0.0 | 0.0 | 0.0 | 0.1 |
| Total | 19.9 | 20.2 | 18.9 | 19.7 | 27.6 | 26.4 | 24.8 | 18.0 | 23.6 | 21.8 | 23.1 | 23.7 | 11.5 | 12.8 | 10.6 | 11.2 | 16.0 | 15.7 | 20.7 | 24.9 | 1.1 | 2.2 | 1.9 | 2.5 | 0.3 | 0.6 | 0.2 | 0.5 |
| SD | 2.7 | 2.3 | 2.7 | 2.1 | 1.0 | 3.6 | 3.5 | 2.6 | 3.3 | 2.0 | 2.4 | 2.7 | 0.4 | 3.2 | 2.4 | 0.6 | 2.1 | 2.8 | 3.9 | 4.4 | 0.1 | 0.3 | 0.5 | 0.4 | 0.1 | 0.1 | 0.1 | 0.3 |
Minutes stimulated with antigen;
xx:y = total number of carbon atoms in the fatty acid chains: number of double bonds. Standard deviations (SD) are shown for the sums within each group. The data are averages over four measurements from a single representative experiment. Sum S, Sum M, and Sum P are the sums of the saturated (S, db0), monounsaturated (M, db1), and polyunsaturated (P, db2 – db4+) phospholipids (PL), respectively, where the degree of saturation refers to the number of double bonds in the the fatty acid chains. The total PL composition for each time point is 100%.
FIGURE 3.

Representative data (Table 1) plotted as Mol% of DRM phospholipids that contain 0, 1, 2, 3, and ≥ 4 double bonds (db0, db1, db2, db3, and db4+, respectively) in the acyl chains versus antigen stimulation time for each head group and summed over head groups. Data points corresponding to each of db0, db1, db2, db3, db4+ are fitted with a linear function corresponding to first-order kinetics at short times (Eqn 2). Values of ks =(Cf−Ci)ka (units of Mol%/min) are listed with each fitted curve. Error bars show the standard deviations from representative data in Table 1.
FIGURE 5.
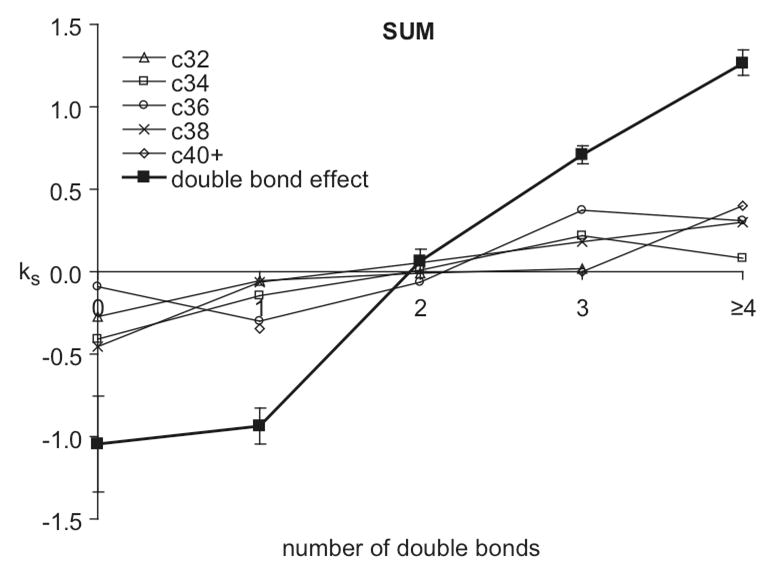
Representative data (Table 1) evaluated for cells stimulated with DNP-BSA and dependence of DRM phospholipid compositional changes on total acyl chain length. Values of ks = (Cf−Ci)ka (Eqn 2; units of Mol%/min) versus number of double bonds are shown for separate chain lengths corresponding to 32, 34, 36, 38, and ≥ 40 carbons in both acyl chains (c32, c34, c36, c38, c40+, respectively, summed over seven head groups). The solid squares and dark line correspond to ks values versus number of double bonds summed over all head groups (double bond effect; duplicated from the upper left panel of Figure 4)
FIGURE 1.


Mol % of phospholipids (PL) in DRMs that contain 0, 1, 2, 3, and ≥ 4 double bonds (db0, db1, db2, db3, db4+, respectively) in the acyl chains versus (A) DNP-BSA antigen stimulation time (average of eight independent experiments) or (B) cytochalasin D stimulation time (average of four independent experiments) for each head group summed over head groups. Data points corresponding to specified number of double bonds (each of db0, db1, db2, db3, db4+) are fitted with an exponential decay corresponding to first-order kinetics (Eqn 1). Values of km = nk (units of min−1) are listed with each fitted curve. Errors bars show standard deviations from ≥ 4 separate experiments (0 and 10 min), or range of values from two separate experiments (2, 5, and 20 min). Data points with no error bars represent a single experiment (1 and 30 min). (C) The km values (units of min−1) from Figures 1A and 1B versus the number of double bonds for each head group for DNP-BSA stimulation (squares, left ordinate) compared with cytochalasin D treatment (circles, right ordinate).
FIGURE 2.

Ratio of polyunsaturated (P, db2 – db4+) phospholipids to the sum of saturated (S, db0) and monounsaturated (M, db1) phospholipids (i.e., P/(S+M)) for the time course of stimulation by 5μg/ml DNP-BSA at 37°C (squares, average of eight independent experiments) and 18 °C (triangles), in the presence of 3 mM Jasplakinolide (white circles, average of two independent experiments), 4 μM PP1 (cross, average of two independent experiments), or absence of media Ca2+ (white diamonds), or by 2 μM cytochalasin D (circles, average of four independent experiments), 0.9 μM Ca2+ ionophore A23187 (diamonds). This ratio, P/(S+M), is also shown for DRMs from unstimulated cells incubated for 20 min at 37°C prior to DRM preparation (white squares). Error bars show standard deviations from ≥ 4 separate experiments or range from two separate experiments for each time point. Data points with no error bars represent only single experiment with that time point.
FIGURE 4.

Values of ks = (Cf−Ci)ka (Eqn 2; units of Mol%/min) versus number of double bonds in phospholipid fatty acid chains for DNP-BSA stimulation (average of five independent experiments, error bars show standard deviation) compared with antigen stimulation in the presence of PP1, Jasplakinolide, Ca2+-free media (same treatments and number of experiments as in Figure 2).
Kinetic Analysis of PL changes
For systematic analysis over multiple samples and experiments with different treatments, the PL composition data are compared in terms of headgroups, the total number of double bonds in the acyl chains (db0, db1, db2, db3, and db4+), and acyl chain length. A simple evaluation of time dependent changes monitors acyl chain saturation and represents the mol% abundance data as the lumped ratio P/(S+M), where P corresponds to polyunsaturated (db2, db3, and db4+) acyl chains, S corresponds to saturated (db0) acyl chains, and M corresponds to mono-unsaturated (db1) acyl chains (see Figure 2).
For a comprehensive analysis of compositional changes with time, the mol% values are evaluated with a first-order kinetic model. Useful parameters for comparison are the value of the first order rate constant k together with the direction and magnitude of the concentration change. We consider a species with concentration C(t) that may increase or decrease with time after stimulation; Ci corresponds to the initial (pre-stimulation) concentration and Cf corresponds to the final concentration that stabilizes after stimulation.
| (1) |
For species with decreasing concentration, [Ci − Cf] > 0, and for species with increasing concentration, [Ci − Cf] < 0. The direction of the change is given by the value n = [Cf − Ci]/|Cf − Ci| Because of the absolute value in the denominator, n = −1 for species that decrease in concentration, and n= +1 for species that decrease in concentration. The lumped term km = nk represents the value of the rate constant and the direction of concentration change.
For sufficiently short times, as compared to the time course of the concentration change, the exponential in Eqn 1 can be replaced by a truncated Taylor series, exp(−kt) ≃ 1 − kt, yielding a linear expression for C(t) vs t and an approximate first order rate constant ka:
| (2) |
Note that the slope in this linear approximation, ks = (Cf − Ci)ka, is a lumped term representing the magnitude and direction of the concentration change times the value of ka. The mol% (C(t)) data are plotted according Eqn 1 (Figure 1A and B), or Eqn 2 (Figure 3). From these primary plots, the values of km = nk (Figure 1C) or ks = (Cf − Ci)ka (Figures 4 and 5) are plotted as a function of the total number of double bonds in the acyl chains with specified headgroups.
Data fitting for exponential curves over longer time periods (Eqn 1; Figures 1A and B) and linear approximation curves at short times (Eqn 2; Figure 3) was carried out with MATLAB. We determined the linear approximation to be valid for DNP-BSA stimulation by the following comparison: Using mol% at long times (Cf) obtained from fitting the data in Figure 1A with Eqn 1, the value for (Cf − Ci) was determined, and the approximate rate constant ka was calculated from (Cf − Ci)ka values obtained from the linear fit (Eqn 2, Figure 3). We find that these ka values are very similar to k values obtained directly from Figure 1A. Similarly, from a linear fit (Eqn 2) of the 0, 2, 5, 10 min data of Figure 1A, the slope (Cf−Ci)k values were determined. These are also very similar to the (Cf − Ci)ka values obtained from the slopes in Figure 3. This validation of the linear approximation for DNP-BSA stimulation allowed direct comparison of multiple treatments over the shorter time period (Figure 4).
RESULTS
Unsaturated PL Increase in DRM Fractions upon Receptor Mediated Cell Activation
A complete PL analysis was carried out by ESI/MS for DRM samples from cells before and after stimulation with the antigen DNP-BSA at several time points, as represented by the experiment shown in Table 1. Notable in these representative data is the high mol% of total SM in DRMs from unstimulated cells (27.6 mol% of the total phospholipids), indicative of highly purified DRM preparations, and similar to SM values of 20–23 mol% for DRM and non-detergent lipid raft preparations from KB cells characterized by Pike et al. (28). The mol% of SM decreases as a function of stimulation time while total PI increases with stimulation time as exemplified in Table 1. A compiled presentation of lipid compositional changes from many different experiments with DNP-BSA stimulation is shown in Figure 1A, where the extensive data are represented in terms of headgroups (separate panels) and for each of these, the mol% of total PL (open circles, right ordinate). These compiled data show that, on average, SM decreased from 28% to 17% after 30 min of antigen stimulation, and PI increased from 17% to 34% within this period; the other major PLs (PC, PE and PS) show relatively small changes in total mol% as a function of stimulation time.
Lipid changes with respect to acyl chain unsaturation were evaluated (Figure 1A, solid symbols, left ordinate). DNP-BSA stimulation time courses were measured in multiple experiments for stimulation times of typically 0, 2, 5, 10 min, and in some experiments up to 20 and 30 min. We observe generally that the PL with more unsaturated acyl chains (more double bonds) tend to increase in the DRM fractions with stimulation time, whereas those with saturated or mono-unsaturated acyl chains tend to decrease in these fractions. This is consistent with our previous observations made with DRMs derived from unstimulated cells and cells at a single (5 min) time point after DNP-BSA stimulation (24). That previous study compared the PL composition simply in terms of acyl chain saturation: saturated (S: 0 double bonds, db0), mono-unsaturated (M: 1 double bond, db1), and polyunsaturated (P: 2 to 4 or more double bonds, db2 - db4+) and compiled the abundance data as the lumped ratio P/(S+M). This type of analysis of data in the present study (Figure 2) showed that this simple ratio increases with cell stimulation. For stimulation by DNP-BSA at 37°C (Figure 2, solid squares, dark line), the ratio increases approximately 4-fold with a half-time of about 7 min and stabilization by 20 min, whereas there are no changes over 20 min in the absence of stimulant (open squares, dark line). In comparison, DNP-BSA stimulation at 18°C (solid triangles, dark line) results in a somewhat slower, 2-fold increase in the P/(S+M) ratio by 20 min, consistent with the temperature dependence for other antigen-stimulated signaling processes in these cells (34). Stimulated cellular degranulation is not detectable at 18°C (34), indicating that the lipid changes we observe at this temperature are not a consequence of degranulation.
We evaluated a first-order kinetic model (Eqn 1) for comprehensive evaluation of the detailed mol% data representing PL changes occurring in the DRM fractions after cell stimulation. Figure 1A shows first-order kinetic fits for data compiled from eight independent experiments with DNP-BSA stimulation. The data are fitted in terms of the total number of double bonds in the acyl chains (db0, db1, db2, db3, and db4+; left ordinate) associated with each head group (separate panels). (The minor species PG and PA, whose low mol% and corresponding large error bars result in more erratic behavior, are not shown.) Data accumulated over 30 min stimulation are fitted with Eqn 1, which applies to species that decrease or increase in concentration. The quality of the fits shows that the compositional changes are consistent with a first-order kinetic model, and this analysis also provides a detailed accounting for our general observation that the degree of acyl chain unsaturation increases in DRM compartments after cells are stimulated with DNP-BSA (ref 24 and Figure 2).
With Eqn 1, the rate constants, k, for each number of double bonds within each head group can be determined from the exponential fits to the data (Figure 1A; solid symbols fit by Eqn 1, left ordinate). The lumped value km = nk (where n=+1 or −1 for increasing or decreasing concentration, respectively; see Materials and Methods) are listed with respective curves in Figure 1A. These km values for DNP-BSA stimulation are plotted as a function of the number of double bonds for each head group species in Figure 1C (solid squares). These plots summarize succinctly the dependence of stimulated DRM compositional changes on the degree of acyl chain unsaturation. Values of k = |km| for each head group and for summed PLs are generally less than 0.3 min−1 for DNP-BSA stimulation (Figure 1C, left ordinate). It is notable in these plots that the x-axis is crossed as the km values go from negative (decreasing concentration) to positive (increasing concentration). For PC and PE the km values go from negative to positive between two and three double bonds. For SM, with a single acyl chain, this change occurs between one and two double bonds. For PI, the concentration increases after DNP-BSA stimulation (positive km) for acyl chains with any number of double bonds. When the cumulative data are summed over all the lipid species (upper left panel of Figure 1C) the transition from negative to positive km values occurs between one and two double bonds, justifying our choice of the ratio P/(S + M) in the simple data analysis used previously (ref 24 and Figure 2).
A linear approximation to Eqn 1, given by Eqn 2, was also used to evaluate data sets for DNP-BSA stimulation that were collected over shorter time periods (0 – 10 min). As an example, Figure 3 presents the data from the representative experiment in Table 1 in terms of the total number of double bonds in the acyl chains (db0, db1, db2, db3, and db4+) associated with each head group (PC, SM, PE, PI, PS, and sum) as a function of stimulation time (0, 2, 5, and 10 min). These data, fitted with Eqn 2, yield a slope corresponding to the apparent rate constant ka times the direction and magnitude of the concentration change (Cf−Ci). These ks = (Cf−Ci)ka values are listed with respective fitted lines in Figure 3. As expected from preceding analyses of cumulative data with Eqn 1 (Figures 1A and C), the ks values for each PL head group tend to be more positive for a higher number of double bonds and more negative for a lower number of double bonds.
Figure 4 (closed squares, dark line) plots the averaged ks = (Cf−Ci)ka values from five independent experiments with DNP-BSA stimulation as a function of the number of double bonds for each head group species. As expected these plots reveal the same trend as Figure 1C, i.e. there is a clear dependence of stimulated DRM compositional changes on the degree of acyl chain unsaturation, such that those with higher degrees of unsaturation increase after stimulation. We confirmed that results from Eqns 1 and 2 show good agreement for short time periods (≤ 10 min for DNP-BSA stimulation) as described in Materials and Methods. Therefore, we used the linear approximation (Eqn 2) to compare directly the DRM compositional changes caused by FcεRI mediated activation with multiple other treatments, in many different experiments as described in sections below (Figure 4).
We considered alterations in the cholesterol levels or the total PL recovered as factors contributing to our consistent observation of substantial increases in the percentage of unsaturated PL in the DRM compartments after DNP-BSA stimulation. We previously showed under our current experimental conditions that cell lysis is complete and not significantly altered by stimulation (16, 18, 59). Furthermore, >80% of a GD1b ganglioside marker is recovered in low density DRM fractions under these conditions (16). In the present study we found that there is a ~20% increase in cholesterol content of the DRM following stimulation by antigen for 10 min at 37°C, as determined with an enzymatic fluorescence assay for this sterol (Materials and Methods, data not shown). PL recovered in DRMs under the conditions used for their isolation in this study represent 11.2% ± 2.6 (SD; n=3) of cellular PL, based on organic phosphate analysis of chloroform-soluble PL extracted from DRMs and intact cells (see Materials and Methods). These DRMs contain PL from both plasma membrane and endocytic recycling compartments (N Smith et al., unpublished results). To compare the relative amount of PL recovered in the DRM fraction before and after stimulation, a synthetic phospholipid standard, 1,2-di-nonadecanoyl-sn-glycero-3-phosphatidyl choline, was added to each cell lysate sample at a concentration permiting its co-quantification in ESI/MS analysis of the DRM fraction. As summarized in Table 2 (Treatments 1 and 2), this analysis shows that DNP-BSA stimulation causes ~40% molar increase in PLs recovered in the DRM fraction relative to that for unstimulated cells. This is greater than the stimulated increase in DRM cholesterol, suggesting that the stimulated increase in polyunsaturated PLs recovered in DRMs is not due simply to changes in the cholesterol concentration in these compartments. Therefore we investigated involvement of other cellular components in the reorganization of DRM PLs caused by FcεRI-mediated cell activation.
TABLE 2.
Comparison of relative recoveries of phospholipids (PL) in DRMs isolated after specified treatments of the cells. The value in parentheses indicates the number of experiments for specific treatment. The ratio is the relative amount of total DRM PL to an internal standard lipid (see Materials and Methods) at each condition. This ratio value is averaged from ≥ 2 experiments for treatment 1, 2, and 5, or from single experiment for treatment 3, 4, 6, and 7, and normalized to treatment 1. Standard deviations are from multiple experiments, or for single experiment treatments were calculated from error propagation from standard deviations in four separate measurements.
| Treatment | Stimulant | Inhibitor | Ratio |
|---|---|---|---|
| 1 (3) | None | None | 1.00 ±0.06 |
| 2 (3) | DNP-BSA | None | 1.39 ±0.11 |
| 3 (1) | None | PP1 | 0.90 ±0.18 |
| 4 (1) | DNP-BSA | PP1 | 1.29 ±0.09 |
| 5 (2) | Cytochalasin D | None | 1.29 ±0.26 |
| 6 (1) | None | Jasplakinolide | 0.85 ±0.12 |
| 7 (1) | DNP-BSA | Jasplakinolide | 0.95 ±0.10 |
Mechanistic Basis for Observed Changes
To probe the mechanism by which stimulation via FcεRI causes a marked change in the PL composition of DRMs, we examined the effect of the Src family kinase inhibitor, PP1, on these stimulated changes. As shown in the simple analysis of Figure 2 (P/(S+M) vs time), 4 μM PP1 has a small effect on the DNP-BSA-stimulated response (x, dashed line). At the concentration evaluated, PP1 effectively inhibits most antigen-stimulated tyrosine phosphorylation detected in whole cell western blots, although some FcεRI β and LAT phosphorylation persists (ref 35 and Supporting Information Figure S1). The first-order kinetic analysis summarized in Figure 4 (ks = (Cf−Ci)ka vs db#; based on Eqn 2) shows that this concentration of PP1 present during antigen stimulation causes very little difference in PL compositional changes (compare solid squares and x). Table 2 (Treatments 3 and 4) shows that this concentration of PP1 causes only a small change in the DNP-BSA stimulated increase in recovery of PL in the DRM fraction. Together, these results suggest that the antigen-stimulated changes in PL composition of DRMs do not depend strongly on the tyrosine phosphorylation cascade that is initiated by FcεRI crosslinking.
Antigen stimulates a robust Ca2+ response in RBL mast cells, and this Ca2+ mobilization is necessary for degranulation (34, 35). We investigated stimulated PL changes in DRMs caused by the Ca2+ ionophore A23187 that can stimulate RBL cell degranulation (in the absence of DNP-BSA). The simple analysis of Figure 2 shows that a stimulating dose of A23187 (0.9 μM) causes changes in PL composition very similar to those caused by DNP-BSA, but with faster kinetics (compare solid diamonds with solid squares). We also found that DNP-BSA stimulation of cells in buffer without extracellular Ca2+ (Figure 2, open diamonds) causes attenuation of the antigen-stimulated increase in P/(S+M), but does not prevent it. Under these conditions, antigen stimulates a transient increase in intracellular Ca2+ without a sustaining influx of Ca2+ from the extracellular medium, which is insufficient in triggering degranulation (36, 37). In the analysis of Figure 4, DNP-BSA stimulation in the absence of extracellular Ca2+ (open diamonds) causes PL compositional changes similar to those caused by DNP-BSA in the presence of extracellular Ca2+ (solid squares). These results show that a sustained increase in intracellular Ca2+ may contribute to, but is not necessary for, the antigen-stimulated changes in DRM lipid composition observed.
Role of the Cytoskeleton
Cytochalasin D disrupts the actin cytoskeleton by capping the barbed end of actin microfilaments and preventing elongation, thereby effectively preventing stimulated polymerization of F-actin (38). This inhibition of actin polymerization has been shown to enhance IgE receptor signaling in RBL mast cells (38, 39). When testing whether cytochalasin D affects DNP-BSA-stimulated changes in DRM lipid composition, we were surprised to find that cytochalasin D alone causes similar changes, with faster kinetics, as indicated in Figure 2 (compare closed circles with closed squares). First-order kinetic analysis of cytochalasin effects provides detailed accounting of PL compositional changes according to headgroup and double bonds (Figure 1B). A summary of this analysis in terms of km=nk values (eqn 1) reveals that, compared with antigen stimulation (Figure 1C, squares, left ordinate), treatment of RBL cells with 2 μM cytochalasin D (Figure 1C, circles, right ordinate) causes significantly faster changes in DRM lipid composition for each head group: The km values are as much as 6-fold larger for cytochalasin D stimulation. Figure 1C also shows that the dependence of km values on the acyl chain unsaturation is similar to DNP-BSA for all the major PL head groups, with some differences for PI. Latrunculin A is another inhibitor of actin polymerization that disrupts the actin cytoskeleton by a different mechanism: sequestration of monomeric G-actin to inhibit its incorporation into polymeric F-actin (40). Changes similar to those for 2 μM cytochalasin D (Figure 1C, circles) also occurred with 0.2 μM latrunculin A or with cytochalasin D at doses as low as 0.2 μM (data not shown). Only very small changes in net F-actin content occur under these conditions of cytochalasin D treatment (38), indicating that the DRM lipid composition is sensitive to relatively subtle changes in F-actin.
Overall, our results indicate that the mechanistic basis for the antigen-stimulated change in PL composition of DRMs may be stimulated depolymerization of cortical F-actin, which partially redistributes to other intracellular locations (41). To test this explanation, we examined the effect of jasplakinolide, which is known to stabilize F-actin (42), on antigen-stimulated changes in the PL composition of DRMs. We found that 3 μM jasplakinolide has no discernible effect on DRM composition in the absence of stimulation (Figure 2, open circle at 0 min). However, this reagent effectively inhibits the antigen-stimulated changes in PL composition as shown in Figure 2 (open circle at 10 min) and in Figure 4 (open circles). Consistent with these observations, jasplakinolide inhibits the antigen-stimulated increase in the relative amount of PLs fractionating with DRMs (Table 2, Treatments 1, 2, 6 and 7), whereas cytochalasin D causes PL increase similarly to antigen stimulation (Table 2, Treatment 1, 2 and 5). Our results show that the actin cytoskeleton regulates the structural composition and stability of plasma membrane domains that fractionate as DRMs. Correspondingly, we conclude that antigen and IgE receptor mediated changes in the distribution of F-actin substantially modify the composition and/or stability during cell signaling of these membrane domains represented by the DRMs.
Dependence of DRM Compositional Change after Antigen Stimulation on Length of Acyl Chains
Compositional changes in terms of acyl chain length associated with each head group were also evaluated after DNP-BSA stimulation with the first-order kinetic model. For this purpose, acyl chains associated with all head groups were evaluated according to Eqn 2, in terms of both combined length of their acyl chains and total number of double bonds. These results are summarized for a single representative experiment (Table 1) in Figure 5, which compiles the chain length results for the major phospholipids PC, PE, PI (SM with one rather than two acyl chains gave similar results). Compared on this same graph is the dependence of total DRM lipid compositional changes on the number of double bonds (solid squares and dark line reproduced from upper left panel in Figure 4). Whereas the dependence of lipid compositional change on the number double bonds is pronounced, as described above, there is negligible dependence on the chain length.
DISCUSSION
Our detailed PL analysis in the present study builds on previous observations to further our understanding of the interactions between lipid raft membrane domains and the actin cytoskeleton, and the regulation of these interactions by IgE receptor (FcεRI) signaling. Published studies on structural and functional roles for lipid rafts in cell biology number in the thousands, strongly implicating their critical participation in cellular homeostasis and stimulated responses. Yet these compartments remain elusive to experimental definition because of their lipid and protein heterogeneity and their dynamic nature in living cells. Biochemical isolation of subcellular components is an essential part of structure-function analysis in live cells, even while recognizing that the procedures involved perturb their structures relative to those in live cells. Isolation of lipid rafts by detergent fractionation or other methods suffers the same pitfalls of this general approach, but it provides the necessary means for molecular characterization that can be further tested and refined in live cell experiments. DRM preparations have proven to be a useful correlative tool in elucidating the functional role of lipid rafts in FcεRI signaling (8).
We showed previously with ESI/MS that DRM preparations from RBL mast cells contain ~100 distinct PL species (24), highlighting the complexity that exists in these membranes. In the present study we confirmed and extended our initial observation that antigen-crosslinking of IgE receptors stimulates changes in the PL composition of DRMs isolated before and after this cell activation. Furthermore, we discovered that this substantial compositional change depends on stimulated alterations in the actin cytoskeleton, and appears largely independent of the tyrosine phosphorylation cascade that is activated in parallel to these cytoskeletal changes. This finding is surprising, as it indicates that the PL composition of detergent-resistant lipid rafts is much more sensitive to cytoskeletal regulation than to various phospholipases whose activation is stimulated by tyrosine phosphorylation (43, 44). Consistent with this, only small changes in the total PL composition of RBL mast cells are detected due to antigen stimulation (45), indicating that net gain or loss of specific PL species due to stimulated PL turnover is likely to provide a relatively minor contribution to the large changes in DRM PL composition that we observe.
Our results implicate the actin cytoskeleton as strongly influencing the PL composition of DRM preparations. Relatively small changes in net F-actin content caused by cytochalasin D or latrunculin A cause large and rapid changes in this composition, and antigen-stimulated changes are prevented by jasplakinolide. We observe net increases in the amount of PLs isolated as DRMs, and preferential increases in polyunsaturated lipids caused by inhibitors of F-actin polymerization or by antigen stimulation. These results suggest that membrane interactions with the actin cytoskeleton limit recovery of detergent-resistant lipids in resting cells, and that cell stimulation or direct inhibition of F-actin polymerization reduces these interactions. Although antigen stimulation causes a net increase in stimulated actin polymerization (38), it is possible that spatially localized actin depolymerization (40) is chiefly responsible for the increase in detergent resistant PL that are recovered under these conditions.
Our detailed kinetic analysis of extensive mass spectrometry data for DRMs provides a comprehensive means for investigating and comparing temporal changes in lipid composition that are initiated by various stimulants in the signaling pathway. This analysis compares mol % content of individual lipid species within the total lipids collected in the isolated membranes, and thereby structural and physical changes that accompany specific cell stimulating conditions. In a previous study (46), Milne et al. described a lipid array study using ESI-MS coupled with computational approaches to identify lipid pattern of total cellular lipids, and changes in the pattern as indicated by the relative change in peak abundance over the defined time course of antigen stimulation in B cells. Our kinetic study presents an effective way to characterize lipid compositional change in the context of functionally relevant membrane domains and pinpoints subtle changes related to specific stimulating conditions. Thus, our kinetic approach should be a valuable tool for lipidomic studies towards understanding membrane signaling.
Our ESI/MS analysis is carried out on DRMs isolated after cell lysis in relatively low concentration of TX-100 (0.045%). These conditions were chosen because they discriminate between crosslinked and uncrosslinked IgE receptors as DRM components, whereas other components of lipid rafts, such as the GPI-anchored protein Thy-1, are efficiently recovered in DRMs in the presence or absence of IgE receptor crosslinking (16, 18, 47). It is possible that different sensitivity to antigen stimulation or F-actin inhibitors would be observed at higher concentrations of detergent, but substantial detergent interference under these conditions precludes accurate mass spectrometric analysis of the PL composition (24). Special LiCl extraction conditions gave essentially the same results, with no indication of plasmalogen species at m/z of 720.5, 722.5, 770.6, and 774.6 as reported by others (28, 48, 49). This may reflect differences in the membrane preparations or cell growth conditions. It is notable that cytochalasin D does not change the % recovery of crosslinked IgE receptors with DRMs under the conditions of our experiments. However, this treatment does decrease the density of detergent-resistant FcεRI-containing membranes, as separated in sucrose gradients, consistent with cytoskeletal interactions by these detergent-resistant receptors in the absence of cytochalasin D (21).
The changes in DRM PL composition we observe are stimulated by the Ca2+ ionophore, A23187 (Figure 2). They are also stimulated by antigen in the absence of extracellular Ca2+ (Figures 2 and 4), a condition that inhibits degranulation and most signaling processes downstream of FcεRI (36, 50). Interestingly, activation of permeabilized mast cells by either micromolar Ca2+ or GTPγ-S in the presence of EGTA results in redistribution of F-actin from the periphery to the cell interior in a process that is similar to that stimulated in intact mast cells (51, 52). These results suggest that F-actin redistribution from the cell cortex can be elicited by both Ca2+-dependent and Ca2+-independent stimuli, and this may be relevant to the PL changes in DRM that we observe.
A model to explain our results is that loss of F-actin proximal to the plasma membrane caused by antigen activation or by inhibitors of actin polymerization perturbs the structural regulation of nanoscopic Ld/Lo-like phase separation. This could result in lipid redistributions that enhance the recovery of polyunsaturated PLs, particularly those with PI head groups, in DRM fractions. Preferential interactions of polyphosphatidylinositol PLs with the actin cytoskeleton at the inner leaflet of the plasma membrane (23, 53) may be relevant to this process, and the negative charge of PI may also contribute to these interactions. In this scenario, disruption of interactions between PI and structural proteins by antigen stimulation or by inhibitors of actin polymerization could result in increased recovery of PI in detergent–resistant, low density membranes. Future efforts are aimed at detecting in intact cells the membrane structural changes manifested by our ESI/MS analysis of DRM PLs. To this end, biophysical methods such as resonance energy transfer (54, 55), fluorescence correlation spectroscopy (56), and electron spin resonance (57) are proving use to be useful approaches to studying membrane lipid heterogeneity in live cells.
Supplementary Material
Abbreviations
- DRM
detergent resistant membrane
- PL
phospholipid
- FTMS
Fourier transform mass spectrometry
- BSS
buffered saline solution
- ESI/MS
electrospray ionization mass spectrometry
- P/(S+M)
polyunsaturated PL/(saturated PL + monounsaturated PL)
- db
double bond
- Lo
liquid ordered
- Ld
liquid disordered
Footnotes
This research was supported by NIH grants AI018306 (BB/DH), and GM016609 (FWM) and in part by the Nanobiotechnology Center (NSF-ECS-9876771).
Supporting Information Available
Figure S1 is a western blot showing that PP1 inhibits tyrosine phosphorylation that is stimulated by antigen DNP-BSA in RBL-2H3 mast cells sensitized with anti-DNP IgE. This material is available free of charge via the Internet at http://pubs.acs.org.
References
- 1.Mukherjee S, Maxfield FR. Membrane domains. Annu Rev Cell Dev Biol. 2004;20:839–866. doi: 10.1146/annurev.cellbio.20.010403.095451. [DOI] [PubMed] [Google Scholar]
- 2.Brown DA. Lipid Rafts: From Model Membranes to Cells. Biochim Biophy Acta. 2005;1746:182–195. [Google Scholar]
- 3.Simons K, Toomre D. Lipid rafts and signal transduction. Nat Rev Mol Cell Biol. 2000;1:31–39. doi: 10.1038/35036052. [DOI] [PubMed] [Google Scholar]
- 4.Brown DA, Rose JK. Sorting of GPI-anchored proteins to glycolipid-enriched membrane subdomains during transport to the apical cell surface. Cell. 1992;68:533–544. doi: 10.1016/0092-8674(92)90189-j. [DOI] [PubMed] [Google Scholar]
- 5.Cinek T, Horejsi V. The nature of large noncovalent complexes containing glycosyl-phosphatidylinositol-anchored membrane glycoproteins and protein tyrosine kinases. J Immunol. 1992;149:2262–2270. [PubMed] [Google Scholar]
- 6.Simons K, Ikonen E. Functional rafts in cell membranes. Nature. 1997;387:569–572. doi: 10.1038/42408. [DOI] [PubMed] [Google Scholar]
- 7.Anderson RG. The caveolae membrane system. Annu Rev Biochem. 1998;67:199–225. doi: 10.1146/annurev.biochem.67.1.199. [DOI] [PubMed] [Google Scholar]
- 8.Holowka D, Gosse JA, Hammond AT, Han X, Sengupta P, Smith NL, Wagenknecht-Wiesner A, Wu M, RMY, Baird B. Lipid segregation and IgE receptor signaling: a decade of progress. Biochim Biophy Acata. 2005;1746:252–259. doi: 10.1016/j.bbamcr.2005.06.007. [DOI] [PubMed] [Google Scholar]
- 9.Smith AE, Helenius A. How viruses enter animal cells. Science. 2004;304:237–242. doi: 10.1126/science.1094823. [DOI] [PubMed] [Google Scholar]
- 10.Munro S. Lipid rafts: elusive or illusive? Cell. 2003;115:377–388. doi: 10.1016/s0092-8674(03)00882-1. [DOI] [PubMed] [Google Scholar]
- 11.Edidin M. The state of lipid rafts: from model membranes to cells. Annu Rev Biophys Biomol Struct. 2003;32:257–283. doi: 10.1146/annurev.biophys.32.110601.142439. [DOI] [PubMed] [Google Scholar]
- 12.Sengupta P, Baird B, Holowka D. Lipid rafts, fluid/fluid phase separation, and their relevance to plasma membrane structure and function. Seminars in Cell & Development Biology. 2007;18:583–590. doi: 10.1016/j.semcdb.2007.07.010. [DOI] [PMC free article] [PubMed] [Google Scholar]
- 13.Brown DA. Lipid rafts, detergent-resistant membranes, and raft targeting signals. Physiology. 2006;21:430–439. doi: 10.1152/physiol.00032.2006. [DOI] [PubMed] [Google Scholar]
- 14.Janes PW, Ley SC, Magee AI. Aggregation of lipid rafts accompanies signaling via the T cell antigen receptor. J Cell Biol. 1999;147:447–461. doi: 10.1083/jcb.147.2.447. [DOI] [PMC free article] [PubMed] [Google Scholar]
- 15.Harder T, Scheiffele P, Verkade P, Simons K. Lipid domain structure of the plasma membrane revealed by patching of membrane components. J Cell Biol. 1998;141:929–942. doi: 10.1083/jcb.141.4.929. [DOI] [PMC free article] [PubMed] [Google Scholar]
- 16.Sheets ED, Holowka D, Baird B. Critical role for cholesterol in Lyn-mediated tyrosine phosphorylation of FcεRI and their association with detergent-resistant membranes. J Cell Biol. 1999;145:877–887. doi: 10.1083/jcb.145.4.877. [DOI] [PMC free article] [PubMed] [Google Scholar]
- 17.Pyenta PS, Holowka D, Baird B. Cross-correlation analysis of inner-leaflet-anchored green fluorescent protein co-redistributed with IgE receptors and outer leaflet lipid raft components. Biophys J. 2001;80:2120–2132. doi: 10.1016/S0006-3495(01)76185-1. [DOI] [PMC free article] [PubMed] [Google Scholar]
- 18.Field KA, Holowka D, Baird B. Compartmentalized activation of the high affinity immunoglobulin E receptor with membrane domains. J Biol Chem. 1997;272:4276–4280. doi: 10.1074/jbc.272.7.4276. [DOI] [PubMed] [Google Scholar]
- 19.Gosse JA, Wagenknecht-Wiesner A, Holowka D, Baird B. Transmembrane sequences are determinants of immunoreceptor signaling. J Immunol. 2005;175:2123–2131. doi: 10.4049/jimmunol.175.4.2123. [DOI] [PubMed] [Google Scholar]
- 20.Harder T, Simons K. Clusters of glycolipid and glycosylphosphatidylinositol-anchored proteins in lymphoid cells: accumulation of actin regulated by local tyrosine phosporylation. Eur J Immunol. 1999;29:556–562. doi: 10.1002/(SICI)1521-4141(199902)29:02<556::AID-IMMU556>3.0.CO;2-2. [DOI] [PubMed] [Google Scholar]
- 21.Holowka D, Sheets ED, Baird B. Interactions between Fc(epsilon)RI and lipid raft components are regulated by the actin cytoskeleton. J Cell Sci. 2000;113:1009–1019. doi: 10.1242/jcs.113.6.1009. [DOI] [PubMed] [Google Scholar]
- 22.Wu M, Holowka D, Craighead HG, Baird B. Visualization of plasma membrane compartmentalization with patterned lipid bilayers. Proc Natl Acac Sci. 2004;101:13798–13803. doi: 10.1073/pnas.0403835101. [DOI] [PMC free article] [PubMed] [Google Scholar]
- 23.Kwik J, Boyle S, Fooksman D, Margolis L, Sheetz MP, Edidin M. Membrane cholesterol, lateral mobility, and the phosphatidylinositol 4,5-bisphosphate-dependent organization of cell actin. Proc Natl Acad Sci U S A. 2003;100:13964–13969. doi: 10.1073/pnas.2336102100. [DOI] [PMC free article] [PubMed] [Google Scholar]
- 24.Fridriksson EK, Shipkova PA, Sheets ED, Holowka D, Baird B, McLafferty FW. Quantitative analysis of phospholipids in functionally important membrane domains from RBL-2H3 mast cells using tandem high-resolution mass spectrometry. Biochemistry. 1999;38:8056–8063. doi: 10.1021/bi9828324. [DOI] [PubMed] [Google Scholar]
- 25.Barsumian EL, Isersky C, Petrino MG, Siraganian RP. IgE-induced histamine release from rat basophilic leukemia cell lines: isolation of releasing and nonreleasing clones. Eur J Immunol. 1981;11:317–323. doi: 10.1002/eji.1830110410. [DOI] [PubMed] [Google Scholar]
- 26.Posner RG, Lee B, Conrad DH, Holowka D, Baird B, Goldstein B. Aggregation of IgE-receptor complexes on rat basophilic leukemia cells does not change the intrinsic affinity but can alter the kinetics of the ligand-IgE interaction. Biochemistry. 1992;31:5350–5356. doi: 10.1021/bi00138a015. [DOI] [PubMed] [Google Scholar]
- 27.Bligh EG, Dyer WJ. A rapid method of total lipid extraction and purification. Can J Biochem Physiol. 1959;37:911–917. doi: 10.1139/o59-099. [DOI] [PubMed] [Google Scholar]
- 28.Pike LJ, Han X, Chung K, Gross RW. Lipid rafts are enriched in arachidonic acid and plasmenylethanolamine and their composition is independent of caveolin-1 expression: a quantitative electrospray ionization/mass spectrometric analysis. Biochemistry. 2002;41:2075–2088. doi: 10.1021/bi0156557. [DOI] [PubMed] [Google Scholar]
- 29.Beu SC, Senko MW, Quinn JP, Wampler FM, McLafferty FW. Fourier-transform electrospray instrumentation for tandem high-resolution mass spectrometry of large molecules. J Am Soc Mass Spectrom. 1993;4:557–565. doi: 10.1016/1044-0305(93)85017-R. [DOI] [PubMed] [Google Scholar]
- 30.Wilm MS, Mann M. Electrospray and Taylor-Cone theory, Dole’s beam of macromolecules at last? Int J Mass Spectrom Ion Processes. 1994;136:176–180. [Google Scholar]
- 31.Wilm MS, Mann M. Analytical properties of the nanoelectrospray ion source. Anal Chem. 1996;68:1–8. doi: 10.1021/ac9509519. [DOI] [PubMed] [Google Scholar]
- 32.Kim H-Y, Wang TCL, Ma YC. Liquid chromatography/mass spectrometry of phospholipids using electrospray ionization. Anal Chem. 1994;66:3977–3982. doi: 10.1021/ac00094a020. [DOI] [PubMed] [Google Scholar]
- 33.Han X, Gross RW. Electrospray ionization mass spectroscopic analysis of human erythrocyte plasma membrane phospholipids. Proc Natl Acad Sci U S A. 1994;91:10635–10639. doi: 10.1073/pnas.91.22.10635. [DOI] [PMC free article] [PubMed] [Google Scholar]
- 34.WoldeMussie E, Maeyama K, Beaven MA. Loss of secretory response of rate basophilic leukemia (2H3) cells at 40 degrees C is associated with reversible supression of inositol phospholipid breakdown and calcium signals. J Immunol. 1986;137:1674–1680. [PubMed] [Google Scholar]
- 35.Amoui M, Draber P, Draberova L. Src family-selective tyrosine kinase inhibitor, PP1, inhibits both Fc epsilonRI- and Thy-1-mediated activation of rat basophilic leukemia cells. Eur J Immunol. 1997;27:1881–1886. doi: 10.1002/eji.1830270810. [DOI] [PubMed] [Google Scholar]
- 36.Beaven MA, Rogers J, Moore JP, Hesketh TR, Smith GA, Metcalfe JC. The mechanism of the calcium signal and correlation with histamine release in 2H3 cells. J Biol Chem. 1984;259:7129–7136. [PubMed] [Google Scholar]
- 37.Mohr FC, Fewtrell C. Depolarization of rat basophilic leukemia cells inhibits calcium uptake and exocytosis. J Cell Biol. 1987;104:783–792. doi: 10.1083/jcb.104.3.783. [DOI] [PMC free article] [PubMed] [Google Scholar]
- 38.Frigeri L, Apgar JR. The role of actin microfilaments in the down-regulation of the degranultion response in RBL-2H3 mast cells. J Immunol. 1999;162:2243–2250. [PubMed] [Google Scholar]
- 39.Narasimhan V, Holowka D, Baird B. Microfilaments regulate the rate of exocytosis in rat basophilic leukemia cells. Biochem Biophys Res Commun. 1990;171:222–229. doi: 10.1016/0006-291x(90)91380-b. [DOI] [PubMed] [Google Scholar]
- 40.Coue M, Brenner SL, Spector I, Korn ED. Inhibition of actin polymerization by latrunculin . A FEBS Lett. 1987;213:316. doi: 10.1016/0014-5793(87)81513-2. [DOI] [PubMed] [Google Scholar]
- 41.Koffer A, Tatham PE, Gomperts BD. Changes in the state of actin during the exocytotic reaction of permeabilized rat mast cells. J Cell Biol. 1990;111:919–927. doi: 10.1083/jcb.111.3.919. [DOI] [PMC free article] [PubMed] [Google Scholar]
- 42.Bubb MR, Spector I, Beyer BB, Fosen KM. Effects of jasplakinolide on the kinetics of actin polymerization. An explanation for certain in vivo observations. J Biol Chem. 2000;275:5163–5170. doi: 10.1074/jbc.275.7.5163. [DOI] [PubMed] [Google Scholar]
- 43.Beaven MA, Metzger H. Signal transduction by Fc receptors: the Fc epsilon RI case. Immunol Today. 1993;14:222–226. doi: 10.1016/0167-5699(93)90167-j. [DOI] [PubMed] [Google Scholar]
- 44.Field KA, Apgar JR, Hong-Geller E, Siraganian RP, Baird B, Holowka D. Mutant RBL mast cells defective in Fc epsilon RI signaling and lipid raft biosynthesis are reconstituted by activated Rho-family GTPases. Mol Biol Cell. 2000;11:3661–3673. doi: 10.1091/mbc.11.10.3661. [DOI] [PMC free article] [PubMed] [Google Scholar]
- 45.Cohen JS. PhD Thesis. Cornell University; Ithaca, NY: 2001. The role of phospholipid metabolism in regulated secretion in RBL mast cells; p. 105. [Google Scholar]
- 46.Milne SB, Forrester PT, Ivanova PT, Armstrong MD, Brown HA. Multiplexed lipid arrays of anti-immunoglobulin M-induced changes in the glycerophospholipid composition of WEHI-231 cells. AfCS Reports. 2003 Oct. 24;11 ( www.signaling-gateway.org/reports/vl/DA0011/DA0011.htm),
- 47.Field KA, Holowka D, Baird B. Fc epsilon RI-mediated recruitment of p53/56lyn to detergent-resistant membrane domains accompanies cellular signaling. Proc Natl Acac Sci. 1995;92:9201–9205. doi: 10.1073/pnas.92.20.9201. [DOI] [PMC free article] [PubMed] [Google Scholar]
- 48.Pike LJ, Han X, Gross RW. Epidermal growth factor receptors are localized to lipid rafts that contain a balance of inner and outer leaflet lipids. J Biol Chem. 2005;280:26796–26804. doi: 10.1074/jbc.M503805200. [DOI] [PMC free article] [PubMed] [Google Scholar]
- 49.Surviladze Z, Harrison KA, Murphy RC, Wilson BS. FcεRI and Thy-1 domains have unique protein and lipid compositions. J Lipid Research. 2007;48:1325–1335. doi: 10.1194/jlr.M600485-JLR200. [DOI] [PubMed] [Google Scholar]
- 50.Beaven MA, Ludowyke R. Stimulatory signals for secretion in mast cells and basophils. In: JJ M, JC C, A W, editors. Advances in Regulation of Cell Growth. Raven Press; New York: 1989. pp. 245–285. [Google Scholar]
- 51.Norman JC, Price LS, Ridley AJ, Hall A, Koffer A. Actin filament organization in activated mast cells is regulated by heterotrimeric and small GTP-binding proteins. J Cell Biol. 1994;126:1005–1015. doi: 10.1083/jcb.126.4.1005. [DOI] [PMC free article] [PubMed] [Google Scholar]
- 52.Ludowyke RI, Kawasugi K, French PW. PMA and calcium ionophore induce myosin and F-actin rearrangement during histamine secretion from RBL-2H3 cells. Cell Motil Cytoskeleton. 1994;29:354–365. doi: 10.1002/cm.970290408. [DOI] [PubMed] [Google Scholar]
- 53.Raucher D, Stauffer T, Chen W, Shen K, Guo S, York JD, Sheetz MP, Meyer T. Phosphatidylinositol 4,5-bisphosphate functions as a second messenger that regulates cytoskeleton-plasma membrane adhesion. Cell. 2000;100:221–228. doi: 10.1016/s0092-8674(00)81560-3. [DOI] [PubMed] [Google Scholar]
- 54.Zacharias DA, Violin JD, Newton AC, Tsien RY. Partitioning of lipid-modified monomeric GFPs into membrane microdomains of live cells. Science. 2002;296:913–916. doi: 10.1126/science.1068539. [DOI] [PubMed] [Google Scholar]
- 55.Sengupta P, Holowka D, Baird B. Fluorescence Resonance Energy Transfer Between Lipid Probes Detects Nanoscopic Heterogeneity in the Plasma Membrane of Live Cells. Biophys J. 2007;92:3564–3574. doi: 10.1529/biophysj.106.094730. [DOI] [PMC free article] [PubMed] [Google Scholar]
- 56.Bacia K, Scherfeld D, Kahya N, Schwille P. Fluorescence correlation spectroscopy relates rafts in model and native membranes. Biophys J. 2004;87:1034–1043. doi: 10.1529/biophysj.104.040519. [DOI] [PMC free article] [PubMed] [Google Scholar]
- 57.Swamy MJ, Ciani L, Ge M, Smith AK, Holowka D, Baird B, Freed JH. Coexisting domains in the plasma membranes of live cells characterized by spin-label ESR spectroscopy. Biophys J. 2006;90:4452–4465. doi: 10.1529/biophysj.105.070839. [DOI] [PMC free article] [PubMed] [Google Scholar]
- 58.Kingsley PB, Feigenson GW. The synthesis of a perdeuterated phospholipid: 1,2-dimyristoyl-sn-glycero-3-phosphocholine-d72. Chem Phys Lipids. 1979;24:135–147. [Google Scholar]
- 59.Field KA, Holowka D, Baird B. Structural aspects of the association of FcεRI with detergent resistant membranes. J Biol Chem. 1999;274:1753–1758. doi: 10.1074/jbc.274.3.1753. [DOI] [PubMed] [Google Scholar]
Associated Data
This section collects any data citations, data availability statements, or supplementary materials included in this article.