

CT-determined specific gas volume and hyperpolarized 3He MR imaging–determined gas density allowed quantitative separation of normal regions and those with trapped gas.
Abstract
Purpose:
To quantify regional gas trapping in the lung by using computed tomographic (CT)–determined specific gas volume and hyperpolarized helium 3 (3He) magnetic resonance (MR) imaging in a porcine model of airway obstruction.
Materials and Methods:
Four porcine lungs were removed after sacrifice for unrelated cardiac experiments, for which animal studies approval was obtained. Dynamic expiratory thin-section CT and 3He MR imaging were performed during passive deflation from total lung capacity after obstructions were created with inverted one-way endobronchial exit valves in segmental or lobar bronchi to produce identifiable regions of trapped gas. Changes in specific gas volume were assessed from CT data for defined regions of interest within and outside of obstructed segments and for entire lobes. Helium 3 data were analyzed according to the corresponding regional signal reduction during expiration, compared with the total magnetic moment at each time point.
Results:
In 4.5 seconds of free collapse, volume decreased by 6% ± 2 (standard error) and 53% ± 3, respectively, in trapped-gas lobes and in unobstructed regions (P < .0001). Specific gas volume changed by 6% ± 2 in areas of trapped gas and decreased by 56% ± 3 in unobstructed regions, from 3.4 mL/g ± 0.2 to 1.5 mL/g ± 0.1 (P < .0001). The 3He signal intensity decreased by 25% ± 6 and 71% ± 3, respectively, in trapped-gas and normal regions (P = .0008). In unobstructed regions, the percentage decreases in specific gas volume and 3He signal intensity were not statistically different from one another (P = .89).
Conclusion:
The results obtained from the model of gas trapping demonstrate that CT-determined specific gas volume and 3He MR imaging can help identify and quantify the extent of regional trapped gas in explanted porcine lungs.
© RSNA, 2009
Introduction
Chronic obstructive pulmonary disease is usually regarded as a progressively accelerating decline in the ability to expire air rapidly from the lung as measured by the forced expiratory volume in one second (FEV1) (1); however, the earliest functional abnormality in smokers is an increase in residual volume, which occurs before FEV1 declines (2–4). The increase in residual volume results from gas trapping, which increases progressively during the natural history of chronic obstructive pulmonary disease. Gas trapping causes an increase in the ratio of residual volume to total lung capacity from normal values of 0.20–0.25 to 0.70 or greater in severe emphysema. The fact that gas trapping precedes and causes FEV1 to decline suggests that therapy should be aimed more at removing the trapped gas rather than increasing FEV1. Airway bypass is a new experimental treatment for emphysema that attempts to do this. Stent-supported fenestrations are made through the bronchial wall directly into regions of gas trapping, which allows the gas to escape. In emphysematous lungs explanted at transplantation surgery, this procedure results in improvements in the mechanical properties of these end-stage emphysematous lungs that exceed the benefits of any other therapeutic intervention except lung transplantation (5). The procedure is presently the subject of a randomized controlled multicenter clinical trial. Imaging procedures to identify regions of trapped gas should improve the chance of benefit from airway bypass.
To utilize thin-section computed tomographic (CT) scanning and helium 3 (3He) magnetic resonance (MR) imaging and apply them to the regional quantification of trapped gas as a way to test the techniques, we developed a model of airway obstruction and trapped gas in explanted porcine lungs, which lack collateral ventilation between lung lobules (6,7). By partially or completely obstructing isolated segments and/or lobes in lungs and inflating those segments and/or lobes, we were able to study regional differences in gas trapping with specific gas volume (at CT) and relative gas signal decay (at MR imaging) during expiration.
The aim of this study was to quantify regional gas trapping in the lung by using CT-determined specific gas volume and hyperpolarized 3He MR imaging in a porcine model of airway obstruction.
Materials and Methods
Lung Specimens and Preparation
Four lungs were surgically extracted from Yorkshire pigs (weight, approximately 25 kg) immediately after sacrifice for unrelated cardiac experiments, for which approval was obtained from the Animal Studies Committee of Washington University in St Louis. Each main stem bronchus was securely fitted with a cannula, and any minor leaks were repaired with focal ligation or tissue cement. The lung was inflated to 25 cm H2O by using a compressible respiratory bag; gentle massage helped achieve the first full inflation after removal. When the lung was considered fully inflated, the bronchial cannula was opened and the lung was allowed to deflate passively through the airways.
To create isolated airway obstruction, one-way endobronchial exit valves (Emphasys, Redwood City, Calif) intended for bronchoscopic lung volume reduction were inverted and bronchoscopically placed in a lobar bronchus (and in one case in a segmental bronchus) so that the valve closed during expiration in each of the four lungs. The specific, obstructed lobar bronchus was noted for later correlation to images, although in most cases trapping was macroscopically evident by eye. Before transportation to the imaging suite and just before CT and MR imaging, the lungs were inflated to 25 cm H2O at least five times to ensure a constant volume history and to minimize atelectasis. Imaging was performed during passive deflation from full inflation for 4.5–6 seconds before and after the creation of the obstruction.
CT Imaging
Dynamic CT was performed by using a scanner (SOMATOM Definition Dual Source CT; Siemens, Forchheim, Germany). Scanner settings were as follows: tube voltage, 120 kV; tube current, 110 mA; matrix, 512 × 512; section thickness, 1.2 mm; and cycle time, 0.75 second. One longitudinal slab (27 mm thick) across the valve position was acquired during passive expiration from 25 to 2.5 cm H2O airway pressure. Each dynamic sequence was performed as a 4.5-second cine acquisition reconstructed at a 0.75-second interval. Thus, the dynamic scanning series consisted of a seven image set.
The valve was clearly visible on CT images and served as an unambiguous landmark of the obstruction, because it did not move within the airway during lung deflation.
CT Image Analysis
CT images were first segmented to separate lung tissue from the surrounding container by using custom software written in Matlab (MathWorks, Natick, Mass) on the basis of the iterative algorithm proposed by Hu et al (8). The algorithm provided a threshold that averaged approximately −300 HU. Images were then processed by using software (Medical Image Processing, Analysis and Visualization, a freely available medical image processing software package from the National Institutes of Health [9]) to isolate the obstructed lobe or segment. For each imaging voxel, the volume of gas per gram of tissue (specific gas volume [SgV]) was calculated according to the equation (10): SgV = SVtg − SVt, where SVtg is the specific volume of tissue and gas, SVt is the specific volume of tissue, and specific volume (in milliliters per gram) is simply the inverse of density (in grams per milliliter). The specific volume of the lung (tissue and gas) was measured from CT findings as follows: SVtg (in mL/g) = 1000/[HU (in mg/mL) + 1000], where HU is Hounsfield units. The specific volume of tissue was calculated as SVt = 1/1.065 g/mL (11).
Dynamic CT images were analyzed to calculate the changes in the specific gas volume in the entire lobes and within a region of interest (ROI) during 4.5 seconds of free collapse. ROIs were chosen by authors (C.S., J.C.W.) as 15-mm-diameter circles clearly within each obstructed lobe and in an adjacent unobstructed lobe. Regions were drawn randomly within the two lobes by using software (Medical Image Processing, Analysis and Visualization), although large blood vessels and airways were avoided. Distinct anatomic markings on the images, such as airway or vessel branch points, were used to match the same lung ROIs on images at different time points. For each ROI, the average of the specific gas volumes of the voxels (in milliliters per gram) was calculated for each time point, and these were used to plot time-specific volume curves. This allowed determination of the maximum and minimum specific gas volume during passive deflation in regions with trapped gas and in unobstructed regions. All measurements were done before and after the creation of the obstruction.
Helium 3 Gas Preparation and Delivery
For each study, a 300-mL bolus of hyperpolarized 3He gas with 35%–50% polarization was prepared by using a home-built 3He spin-exchange polarizer or a commercial polarizer (GE Healthcare, Princeton, NJ). To increase the 3He T1, the lung was ventilated with 100% nitrogen for 10 minutes by using an open circuit technique and was stored in an airtight plastic bag containing 100% nitrogen. Just before injection into the main stem bronchus, the hyperpolarized gas was mixed in a flexible bag with approximately 300 mL of N2 to ensure sufficient gas volume for full inflation. To homogenize the gas mixture within the lung, the lungs were inflated and deflated at least five times by using a 1-L gas syringe. Transpulmonary pressure was monitored by using a beryllium-copper bourdon-tube pressure gauge (Ashcroft, Stratford, Conn) and was limited to be not more than 25 cm H2O.
MR Imaging
All images were obtained with a whole-body imager (Magnetom Sonata; Siemens Medical, Erlangen, Germany) at 1.5 T. A home-built solenoid coil (high Q and field homogeneity) was used for transmit and receive at 48.52 MHz. First, scout images were obtained by using conventional proton MR imaging. These proton images were used to select the sections and orientations for 3He images and for anatomic reference to 3He images. Multisection two-dimensional fast low-angle shot images (350-mm field of view, 5 × 5 × 10-mm resolution) of 3He were obtained at the end of each inflation cycle (25, 12.5, and 2.5 cm H2O) for localization. For dynamic 3He fast low-angle shot imaging, one section was chosen from the static-volume images and was imaged during passive deflation from 25 cm H2O, with a 100-msec time resolution. The hyperpolarized helium gas was mixed with nitrogen and delivered to the lung through a plastic bag connected with a mechanical piston-cylinder ventilator.
MR Image Analysis
Semiautomated segmentation of lobes and/or segments on 3He images is much more difficult than on CT images because of the lack of clear anatomic landmarks and lobar boundaries; we therefore analyzed MR images by using ROIs only. ROIs were similarly chosen in each obstructed lobe and in an adjacent unobstructed lobe to encompass the same region chosen on the corresponding CT image by using anatomic landmarks from both proton and CT images as guides. The total ROI signal (average over the ROI) was calculated at each time point during passive deflation, to a maximum of 6 seconds. Signal was corrected for radiofrequency consumption of magnetization but not for T1, because T1 in these deoxygenated lungs was several minutes. While we corrected for radiofrequency consumption of magnetization, we noted that the radiofrequency consumption was equivalent in all ROIs, because the B1 field was very homogeneous in our solenoid coil.
Statistical Analysis
Two-way analysis of variance was used to analyze changes in specific gas volume within lobes during 4.5 seconds of passive deflation before and after the insertion of the valve and to compare specific gas volume data before and after valve insertion. Volume and flow variations within the two different lobes before and after the insertion of the valve were tested by using a paired t test.
An unpaired t test was used to analyze the difference of 3He signal during passive collapse between the regions with trapped gas and the normal regions and to evaluate the percentage of decrease in specific gas volume and 3He signal intensity in unobstructed regions. Statistical analysis was performed by using software (SigmaStat, version 9.1; Systat Software, San Jose, Calif). P values less than .05 were considered to indicate significant differences.
Results
Model of Isolated Trapped Gas
Our model of segmental and/or lobar obstruction was able to show trapped gas visually up to an hour after obstruction.
Figure 1a shows a representative example of a series dynamic CT image, while the corresponding specific gas volume variations in the upper and lower lobes, calculated both in the entire lobes and in selected ROIs, are shown in Figure 1d and 1e. In each case, the trapped lobe remained nearly completely inflated during passive deflation (Table 1) through the main stem bronchus over 5 seconds, and in most cases, the trapped lobe remained inflated over many minutes. In the one case where we isolated a basal segment and an upper lobe (Fig 2), the lobe remained entirely obstructed after several minutes, whereas the trapped segment deflated with a much shorter time constant than the trapped lobe but with a much longer time constant than the surrounding segments in the lower lobe.
Figure 1a:

(a–c) Dynamic CT images of a longitudinal section during 4.5 seconds of exhalation in pig 2 (b at 2.25 seconds, c at 4.5 seconds). The presence of trapped gas is clearly visible and stable in the upper lobe (UL), in which obstruction was created by inserting a one-way endobronchial exit valve (clearly visible in the upper lobar bronchus). (d) Graph of time-evolving average specific gas volume (SgV) of upper (red circles) and lower (teal circles) lobes calculated from a–c. (e) Graph of time-evolving specific gas volume of small ROI 1 (upper lobe, red circles) and 2 (lower lobe, teal circles) in a. LL = lower lobe.
Figure 1b:

(a–c) Dynamic CT images of a longitudinal section during 4.5 seconds of exhalation in pig 2 (b at 2.25 seconds, c at 4.5 seconds). The presence of trapped gas is clearly visible and stable in the upper lobe (UL), in which obstruction was created by inserting a one-way endobronchial exit valve (clearly visible in the upper lobar bronchus). (d) Graph of time-evolving average specific gas volume (SgV) of upper (red circles) and lower (teal circles) lobes calculated from a–c. (e) Graph of time-evolving specific gas volume of small ROI 1 (upper lobe, red circles) and 2 (lower lobe, teal circles) in a. LL = lower lobe.
Figure 1c:

(a–c) Dynamic CT images of a longitudinal section during 4.5 seconds of exhalation in pig 2 (b at 2.25 seconds, c at 4.5 seconds). The presence of trapped gas is clearly visible and stable in the upper lobe (UL), in which obstruction was created by inserting a one-way endobronchial exit valve (clearly visible in the upper lobar bronchus). (d) Graph of time-evolving average specific gas volume (SgV) of upper (red circles) and lower (teal circles) lobes calculated from a–c. (e) Graph of time-evolving specific gas volume of small ROI 1 (upper lobe, red circles) and 2 (lower lobe, teal circles) in a. LL = lower lobe.
Figure 1d:

(a–c) Dynamic CT images of a longitudinal section during 4.5 seconds of exhalation in pig 2 (b at 2.25 seconds, c at 4.5 seconds). The presence of trapped gas is clearly visible and stable in the upper lobe (UL), in which obstruction was created by inserting a one-way endobronchial exit valve (clearly visible in the upper lobar bronchus). (d) Graph of time-evolving average specific gas volume (SgV) of upper (red circles) and lower (teal circles) lobes calculated from a–c. (e) Graph of time-evolving specific gas volume of small ROI 1 (upper lobe, red circles) and 2 (lower lobe, teal circles) in a. LL = lower lobe.
Figure 1e:

(a–c) Dynamic CT images of a longitudinal section during 4.5 seconds of exhalation in pig 2 (b at 2.25 seconds, c at 4.5 seconds). The presence of trapped gas is clearly visible and stable in the upper lobe (UL), in which obstruction was created by inserting a one-way endobronchial exit valve (clearly visible in the upper lobar bronchus). (d) Graph of time-evolving average specific gas volume (SgV) of upper (red circles) and lower (teal circles) lobes calculated from a–c. (e) Graph of time-evolving specific gas volume of small ROI 1 (upper lobe, red circles) and 2 (lower lobe, teal circles) in a. LL = lower lobe.
Table 1.
Measurements in Obstructed and Unobstructed Lobes at 4.5 Seconds of Passive Deflation after Valve Insertion
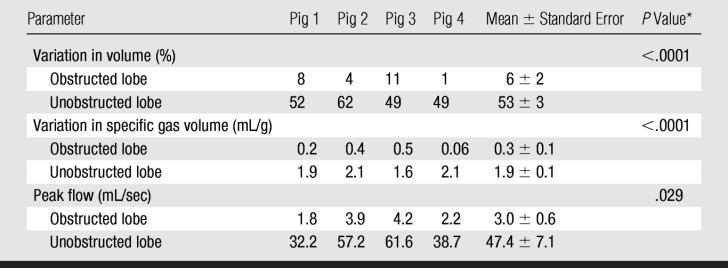
* P values refer to paired comparison of data between obstructed and unobstructed lobes.
Figure 2a:

(a) Longitudinal CT image of the lung where we isolated a basal segment and an upper lobe. ROI analysis was performed at four locations as follows: ROI 1 in the upper lobe (where gas trapping was present due to obstruction induced unintentionally by the connecting tube), ROI 2 in the lower lobe (normal region), ROI S1 in the lower lobe (segment where gas trapping was induced by insertion of a one-way endobronchial valve in the segmental bronchus), and ROI S2 in the lower lobe (normal region). (b) Time course of specific gas volume (SgV) during deflation in four ROIs defined in a.
Figure 2b:

(a) Longitudinal CT image of the lung where we isolated a basal segment and an upper lobe. ROI analysis was performed at four locations as follows: ROI 1 in the upper lobe (where gas trapping was present due to obstruction induced unintentionally by the connecting tube), ROI 2 in the lower lobe (normal region), ROI S1 in the lower lobe (segment where gas trapping was induced by insertion of a one-way endobronchial valve in the segmental bronchus), and ROI S2 in the lower lobe (normal region). (b) Time course of specific gas volume (SgV) during deflation in four ROIs defined in a.
CT Imaging
Multiple measures of trapped gas were evident on CT images as follows: lobar and/or segmental volume changes after segmentation (Table 1), specific gas volume differences averaged over trapped and normal lobes (Table 1), and specific gas volume changes in ROIs (Table 2). Control data (before insertion of the valve) showed that, on average, overall total volume variation at the end of 4.5 seconds of passive deflation in the lower lobes was larger than in the obstructed upper lobes (P = .026) (Fig 3a and 3b). Flow, obtained as variation of volume divided by the time period between two consecutive dynamic images, tended to be higher in the unobstructed lower lobes, even if the difference did not reach statistical significance (P = .084) (Fig 3c). Specific gas volume in the two lobes during exhalation followed two parallel time courses with higher values in the upper lobes (P = .005) (Fig 3e).
Table 2.
Measurements in ROIs in Obstructed and Unobstructed Lobes at 4.5 Seconds of Passive Deflation after Valve Insertion
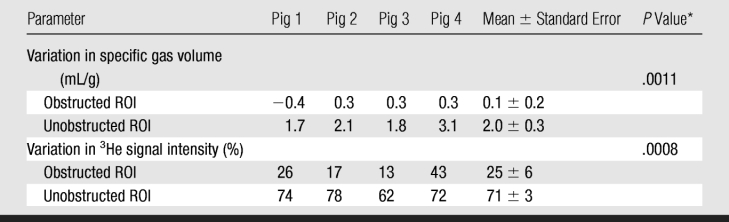
* P values refer to paired comparison of data between obstructed and unobstructed ROIs.
Figure 3a:

(a–f) Graphs of results of volumetric analysis of dynamic CT images of the entire lobes before (a, c, e) and after (b, d, f) insertion of a one-way endobronchial valve to create gas trapping in the upper lobes. Graphs a and b are time courses of volume variations in the upper (closed circles) and lower (open circles) lobes. Graphs c and d are time courses of flow, obtained as variation of volume divided by the time period between two consecutive dynamic images (ΔV/Δt) (closed circles = upper lobe, open circles = lower lobe). Graphs e and f are time courses of specific gas volume (SgV) (closed circles = upper lobe, open circles = lower lobe). Data are means ± standard errors of the mean. * = significant difference (P < .05).
Figure 3b:

(a–f) Graphs of results of volumetric analysis of dynamic CT images of the entire lobes before (a, c, e) and after (b, d, f) insertion of a one-way endobronchial valve to create gas trapping in the upper lobes. Graphs a and b are time courses of volume variations in the upper (closed circles) and lower (open circles) lobes. Graphs c and d are time courses of flow, obtained as variation of volume divided by the time period between two consecutive dynamic images (ΔV/Δt) (closed circles = upper lobe, open circles = lower lobe). Graphs e and f are time courses of specific gas volume (SgV) (closed circles = upper lobe, open circles = lower lobe). Data are means ± standard errors of the mean. * = significant difference (P < .05).
Figure 3c:

(a–f) Graphs of results of volumetric analysis of dynamic CT images of the entire lobes before (a, c, e) and after (b, d, f) insertion of a one-way endobronchial valve to create gas trapping in the upper lobes. Graphs a and b are time courses of volume variations in the upper (closed circles) and lower (open circles) lobes. Graphs c and d are time courses of flow, obtained as variation of volume divided by the time period between two consecutive dynamic images (ΔV/Δt) (closed circles = upper lobe, open circles = lower lobe). Graphs e and f are time courses of specific gas volume (SgV) (closed circles = upper lobe, open circles = lower lobe). Data are means ± standard errors of the mean. * = significant difference (P < .05).
Figure 3d:

(a–f) Graphs of results of volumetric analysis of dynamic CT images of the entire lobes before (a, c, e) and after (b, d, f) insertion of a one-way endobronchial valve to create gas trapping in the upper lobes. Graphs a and b are time courses of volume variations in the upper (closed circles) and lower (open circles) lobes. Graphs c and d are time courses of flow, obtained as variation of volume divided by the time period between two consecutive dynamic images (ΔV/Δt) (closed circles = upper lobe, open circles = lower lobe). Graphs e and f are time courses of specific gas volume (SgV) (closed circles = upper lobe, open circles = lower lobe). Data are means ± standard errors of the mean. * = significant difference (P < .05).
Figure 3e:

(a–f) Graphs of results of volumetric analysis of dynamic CT images of the entire lobes before (a, c, e) and after (b, d, f) insertion of a one-way endobronchial valve to create gas trapping in the upper lobes. Graphs a and b are time courses of volume variations in the upper (closed circles) and lower (open circles) lobes. Graphs c and d are time courses of flow, obtained as variation of volume divided by the time period between two consecutive dynamic images (ΔV/Δt) (closed circles = upper lobe, open circles = lower lobe). Graphs e and f are time courses of specific gas volume (SgV) (closed circles = upper lobe, open circles = lower lobe). Data are means ± standard errors of the mean. * = significant difference (P < .05).
Figure 3f:

(a–f) Graphs of results of volumetric analysis of dynamic CT images of the entire lobes before (a, c, e) and after (b, d, f) insertion of a one-way endobronchial valve to create gas trapping in the upper lobes. Graphs a and b are time courses of volume variations in the upper (closed circles) and lower (open circles) lobes. Graphs c and d are time courses of flow, obtained as variation of volume divided by the time period between two consecutive dynamic images (ΔV/Δt) (closed circles = upper lobe, open circles = lower lobe). Graphs e and f are time courses of specific gas volume (SgV) (closed circles = upper lobe, open circles = lower lobe). Data are means ± standard errors of the mean. * = significant difference (P < .05).
A large difference in the lung volume change between obstructed regions and normal regions was seen. In trapped-gas lobes, the volume decreased by 6% ± 2 (standard error) in 4.5 seconds of passive deflation; in normal regions, it decreased by 53% ± 3 in the same time (P < .0001) (Fig 3b). Flow progressively decreased in unobstructed lower lobes during passive deflation from a peak of 38 mL · sec−1 ± 7 at the beginning to 12 mL · sec−1 ± 5 at the end. On the contrary, in the upper lobes, in which there was trapped gas, the flow was low (P = .029) (Fig 3d). Specific gas volume decreased by a factor of two in unobstructed areas and decreased by only 6% ± 2 in 4.5 seconds in areas of trapped gas. During 4.5 seconds of exhalation, specific gas volume decreased from 4.9 mL/g ± 0.3 to 4.6 mL/g ± 0.3 in trapped gas regions and from 3.4 mL/g ± 0.2 to 1.5 mL/g ± 0.1 in unobstructed ones (P < .0001) (Fig 3f).
The specific gas volume variations at the end of 4.5 seconds of passive deflation were larger in the lower lobes after valve insertion than before valve insertion (P = .0015). Conversely, specific gas volume variations were similar in the upper lobes (P = .084).
Similar results were seen with the ROI analysis: specific gas volume remained nearly constant in ROIs with trapped gas, decreasing from 4.9 mL/g ± 0.9 to 4.8 mL/g ± 1.0 during 4.5 seconds of exhalation. On the contrary, in unobstructed ROIs, specific gas volume decreased by 65% ± 3, from 3.3 mL/g ± 0.6 to 1.1 mL/g ± 0.1 (P = .0011) (Fig 4). In the one case of the isolated segment (Fig 2a), the results showed that specific gas volume decreased by 5%, from 5.6 to 5.3 mL/g in ROI 1, which was placed in the obstructed area of the upper lobe; by 73%, from 4.3 to 1.2 mL/g in ROI 2, which was placed in an unobstructed area in the lower lobe; by 22%, from 3.7 to 2.9 mL/g in the isolated segment in the lower lobe; and by 68%, from 3.9 to 1.3 mL/g in another segment in the lower lobe (Fig 2b).
Figure 4a:

(a, b) Graphs of results of ROI analysis of dynamic CT images (a) before and (b) after insertion of a one-way endobronchial valve to create gas trapping. Closed circles = ROI in the upper lobes (where gas trapping was induced by insertion of a one-way endobronchial valve in the segmental bronchus). Open circles = ROI in the lower lobes (normal regions). Data are means ± standard errors of the mean.
Figure 4b:

(a, b) Graphs of results of ROI analysis of dynamic CT images (a) before and (b) after insertion of a one-way endobronchial valve to create gas trapping. Closed circles = ROI in the upper lobes (where gas trapping was induced by insertion of a one-way endobronchial valve in the segmental bronchus). Open circles = ROI in the lower lobes (normal regions). Data are means ± standard errors of the mean.
The specific gas volume variations at the end of 4.5 seconds of passive deflation in the ROIs in the upper lobes, where gas trapping was induced by insertion of a one-way endobronchial valve in the segmental bronchus, were lower than in control lobes (P = .0054). On the contrary, specific gas volume variations were not significantly different in the lower lobes (P = .08).
Helium 3 MR Imaging
MR images did not demonstrate the same visual differences between normal lobes and those with trapped gas as was seen at CT, although some differences were visually apparent. In lobes with trapped gas, the initial 3He signal was much lower (around 45% of the signal from normal regions) because of incomplete deflation in those areas before initial inspiration. Quantitative analysis of signal decay during passive collapse, however, distinguished the two regions (P = .0008) (Table 2). Figure 5a and 5b is an example of analysis of one of the four cases (pig 2). In normal ROIs, 3He signal intensity decreased by an average of 71% ± 3 after 6 seconds, compared with a 25% ± 6 reduction in ROIs with trapped gas (Fig 6). This contrast compares well to the contrast in specific gas volume at CT analysis. In normal ROIs, the percentage decreases in 3He signal intensity and specific gas volume were not statistically different from each other (P = .89).
Figure 5a:

(a–c) Dynamic 3He fast low-angle shot MR images of a section during 6 seconds of exhalation (b at 4 seconds, c at 6 seconds) in pig 2 after bronchial obstruction. (d) Graph of signal intensity calculated from a–c. Data are percentages of signal intensity at the beginning of 6 seconds of deflation in ROI 1 (closed circles) and 2 (open circles) in a.
Figure 5b:

(a–c) Dynamic 3He fast low-angle shot MR images of a section during 6 seconds of exhalation (b at 4 seconds, c at 6 seconds) in pig 2 after bronchial obstruction. (d) Graph of signal intensity calculated from a–c. Data are percentages of signal intensity at the beginning of 6 seconds of deflation in ROI 1 (closed circles) and 2 (open circles) in a.
Figure 5c:

(a–c) Dynamic 3He fast low-angle shot MR images of a section during 6 seconds of exhalation (b at 4 seconds, c at 6 seconds) in pig 2 after bronchial obstruction. (d) Graph of signal intensity calculated from a–c. Data are percentages of signal intensity at the beginning of 6 seconds of deflation in ROI 1 (closed circles) and 2 (open circles) in a.
Figure 5d:

(a–c) Dynamic 3He fast low-angle shot MR images of a section during 6 seconds of exhalation (b at 4 seconds, c at 6 seconds) in pig 2 after bronchial obstruction. (d) Graph of signal intensity calculated from a–c. Data are percentages of signal intensity at the beginning of 6 seconds of deflation in ROI 1 (closed circles) and 2 (open circles) in a.
Figure 6a:

(a, b) Graphs of results of dynamic 3He fast low-angle shot MR imaging (a) before and (b) after insertion of a one-way endobronchial valve to create gas trapping in upper lobes. Data are percentages of signal intensity at the beginning of 6 seconds of deflation in ROI 1 (upper lobes, closed circles) and 2 (lower lobes, open circles) in Figure 5a. Error bars = standard errors of the mean.
Figure 6b:

(a, b) Graphs of results of dynamic 3He fast low-angle shot MR imaging (a) before and (b) after insertion of a one-way endobronchial valve to create gas trapping in upper lobes. Data are percentages of signal intensity at the beginning of 6 seconds of deflation in ROI 1 (upper lobes, closed circles) and 2 (lower lobes, open circles) in Figure 5a. Error bars = standard errors of the mean.
Discussion
Previous studies (10,12–14) have established that measurements of lung tissue density correlate well with lung disease and tissue destruction. For example, Müller (15) studied several attenuation thresholds for defining emphysema on contrast material–enhanced 10-mm-thick inspiratory CT images and determined that the percentage of voxels less than −910 HU correlated best with the emphysema pathology score, allowing objective quantification of emphysema. Gevenois et al (16) found that expiratory CT studies were less accurate than inspiratory CT studies for quantifying emphysema and were thought to reflect air trapping more than loss of surface area. More recently, Coxson et al (10,17) used CT to measure specific volume, the inverse of lung density, to quantify regional lung expansion, total lung volume, and lung weight. Fuld et al (18) recently established a relationship between the CT-determined specific volume and specific ventilation.
Helium 3 MR imaging is a technique well suited for the quantification of trapped gas, because it has been successful at demonstrating high-resolution ventilation and tissue microstructure (19–26). For purposes of quantification, the hyperpolarized 3He signal is proportional to the total gas magnetic moment (a product of the nuclear-spin polarization and the partial pressure of 3He) and decays with time constant T1 (around 25 seconds in lungs in vivo). The regional gas volume can be quantified as a function of time after the initial magnetization is established during single-bolus injection and after correcting for the depletion of magnetization by radiofrequency pulses and T1 decay.
In our study, both CT and MR images provided good quantitative contrast between normal regions and those regions with trapped gas. While CT images provide more visual contrast and can be segmented more easily than MR ventilation images, both modalities provided measures of the change in gas volume with time in selected regions. Notably in gas-trapped lobes, initial specific gas volume was higher, which demonstrates that specific gas volume itself may be a measure of increased gas volume relative to normal lung, assuming no significant differences in regional blood flow. Similarly, low 3He signal intensity was seen in isolated lobes; this may also be used itself in the future as a simplified measure of trapped gas.
Specific gas volume analysis in small regions of the obstructed and unobstructed lobes (or ROIs) allowed us to establish that the variations in specific gas volume in a small region of the lung reflect the variations in specific gas volume in the whole lobe. Moreover, in our study, ROI analysis was necessary to compare specific gas volume variation obtained from CT images with the corresponding variations of the intensity of 3He signal obtained from MR images, because MR images were near impossible to separate along segmental and/or lobar fissures. An additional reason for assessing changes in ROIs is that ROI analysis will likely be necessary in applying the technique to human lungs, because of the expected heterogeneity in intralobar gas trapping in lungs with severe emphysema.
In the context of our study, the ex vivo porcine model provided particular advantages. It was easy to isolate the trapped gas spatially from unobstructed regions, and the small collateral ventilation allowed effective and long-lived trapped gas. In fact, the trapped gas created in these porcine lungs was similar to isolated regions of trapped gas we have seen in explanted human lungs with severe emphysema (27). In the one case where we isolated a basal segment and an upper lobe (Fig 2a, 2b), the lobe remained entirely obstructed after several minutes, whereas the trapped segment deflated with a much shorter time constant than the trapped lobe but with a much longer time constant than the surrounding segments in the lower lobe; this was due to a small amount of collateral ventilation in the lower lobe, an incomplete seal by the valve, or both. This demonstrated the ability of dynamic imaging to not only help identify trapped gas but to help quantify the time constant of regional emptying.
In our study, the use of inverted endobronchial one-way valves was successful in creating altered regions either in entire lobes or in bronchopulmonary segments. While in control conditions the exhalation is shared between upper and lower lobes (with predominant flow rates in the latter), the creation of completely trapped gas in the upper lobe causes expiratory flow to be uniquely due to the volume change in unobstructed regions. Interestingly, in this condition, the average flow rates in these regions increased (measured with CT-determined variation of volume divided by the time period between two consecutive dynamic images). While differences in mean attenuation or specific gas volume between this ex vivo study and human lungs in vivo are near certain, we expect that similar differences in specific gas volume and 3He signal intensity will be seen between lung regions communicating with the airway opening and those with significant trapped gas. The isolated segments (Fig 2) demonstrated what would be seen when trapped areas empty with a time constant roughly twice that of normal segments.
The primary limitation of the present study was that we used a model based on porcine lungs, which are anatomically different from human lungs: There are more lobes, airway branching is different, alveoli are smaller, and lobules are fully septated, with negligible interlobular collateral ventilation (28,29). Another limitation was our inability to fully segment the 3He MR images in the ex vivo images; this was due to the lack of anatomic landmarks and the lack of in vivo proton images for colocalization. We expect that in vivo MR imaging studies will actually make segmentation easier, because of accompanying proton images that show anatomic landmarks and the chest wall. Two other concerns should also be mentioned: a potential increase in radiation dose from dynamic CT imaging and the availability of 3He gas. In our study, fast dynamic acquisition allowed a cine-type visualization of the lung deflation process to help identify and quantify the trapped gas. The addition of dynamic expiratory CT acquisitions to a standard inspiratory volumetric scan of the entire chest necessarily involves more radiation exposure. However, if this is restricted to only a few single-level acquisitions, the incremental increase in total radiation exposure will be very small and may be further limited by using low-radiation-dose scanning techniques. A previous study on humans (30) showed that a dose of 47 mGy for a 10-second dynamic CT measurement is comparable with a dose of approximately 30–40 mGy when undergoing CT examination of the thorax.
There is currently a shortage of 3He gas; we expect that this shortage will either be reduced in the future or that perfluorinated hydrocarbons or hyperpolarized xenon will be substituted (31–33).
In summary, we built a model of regional airway obstruction and trapped gas in explanted lungs and employed two imaging modalities to help quantify regional differences in lung emptying. While we used animal lungs to facilitate the model and experiments, the purpose of this study was to provide a foundation for the use of dynamic CT and 3He MR imaging to help identify regions of trapped gas in the lungs of patients.
Practical applications: Because our purpose was to provide a framework for identifying and quantifying the extent and severity of trapped gas, we foresee direct applications in human subjects undergoing evaluation for lung volume reduction surgery or for either of the two minimally invasive interventions currently the subject of clinical trials (transbronchial stents or one-way bronchial exit valves). Furthermore, we foresee the use of trapped-gas quantification and of dynamic CT and concomitant regional flow measurements as a potential clinical end point for future studies. This is because a change in the distribution of ventilation has the potential to reduce dyspnea while not greatly affecting bulk flow.
Advances in Knowledge.
CT-determined regional specific gas volume, within dynamic imaging conditions, was sensitive to the extent of regional trapped gas.
Regional changes in specific gas volume during lung deflation were sensitive to the extent of local trapped gas.
Quantitative dynamic 3He MR imaging appeared to be reasonably sensitive to the extent of regional trapped gas.
Implication for Patient Care.
Both dynamic CT and 3He MR imaging can help identify regional trapped gas, which could be a measure for future image guidance and for regional efficacy prediction of minimally invasive interventions for trapped-gas reduction in a patient with emphysema.
Acknowledgments
We acknowledge Emphasys Medical for the donation of the endobronchial valves used in the study and GE Healthcare for the use of a gas polarizer.
Received November 1, 2008; revision requested December 22; revision received March 5, 2009; accepted April 3; final version accepted May 14.
C.S. supported by a grant from the Regione Lombardia (Az.3-2007).
Funding: This research was supported by National Institutes of Health grants (nos. R01090806 and P50 HL084922).
Authors stated no financial relationship to disclose.
Abbreviation:
- ROI
- region of interest
References
- 1.Fletcher C, Peto R. The natural history of chronic airflow obstruction. Br Med J 1977;1(6077):1645–1648 [DOI] [PMC free article] [PubMed] [Google Scholar]
- 2.Corbin RP, Loveland M, Martin RR, Macklem PT. A 4-year follow-up study of lung mechanics in smokers. Am Rev Respir Dis 1979;120(2):293–304 [DOI] [PubMed] [Google Scholar]
- 3.Bates DV, Woolf CR, Paul GI. A report on the first two stages of the co-ordinated study of chronic bronchitis in the Department of Veterans Affairs, Canada. Med Serv J Can 1962;18:211–303 [PubMed] [Google Scholar]
- 4.Bates DV, Gordon CA, Paul GI, Place RE, Snidal DP, Woolf CR. Chronic bronchitis: report on the third and fourth stages of the co-ordinated study of chronic bronchitis in the Department of Veterans Affairs, Canada. Med Serv J Can 1966;22(1):1–59 [PubMed] [Google Scholar]
- 5.Choong CK, Macklem PT, Pierce JA, et al. Airway bypass improves the mechanical properties of explanted emphysematous lungs. Am J Respir Crit Care Med 2008;178(9):902–905 [DOI] [PMC free article] [PubMed] [Google Scholar]
- 6.Brown R, Woolcock AJ, Vincent NJ, Macklem PT. Physiological effects of experimental airway obstruction with beads. J Appl Physiol 1969;27(3):328–335 [DOI] [PubMed] [Google Scholar]
- 7.Woolcock AJ, Macklem PT. Mechanical factors influencing collateral ventilation in human, dog, and pig lungs. J Appl Physiol 1971;30(1):99–115 [DOI] [PubMed] [Google Scholar]
- 8.Hu S, Hoffman EA, Reinhardt JM. Automatic lung segmentation for accurate quantitation of volumetric x-ray CT images. IEEE Trans Med Imaging 2001;20(6):490–498 [DOI] [PubMed] [Google Scholar]
- 9.About MIPAV. Center for Information Technology. National Institutes of Health. http://mipav.cit.nih.gov/. Published March 14, 2007. Updated January 16, 2009.
- 10.Coxson H, Rogers R, Whittall K, et al. A quantification of the lung surface area in emphysema using computed tomography. Am J Respir Crit Care Med 1999;159(3):851–856 [Published correction appears in Am J Respir Crit Care Med 2001;163(6):1500–1501.] [DOI] [PubMed] [Google Scholar]
- 11.Hedlund LW, Vock P, Effmann EL. Evaluating lung density by computed tomography. Semin Respir Med 1983;5:76–87 [Google Scholar]
- 12.Madani A, Zanen J, de Maertelaer V, Gevenois PA. Pulmonary emphysema: objective quantification at multi-detector row CT—comparison with macroscopic and microscopic morphometry. Radiology 2006;238(3):1036–1043 [DOI] [PubMed] [Google Scholar]
- 13.Stern EJ, Song JK, Frank MS. CT of the lungs in patients with pulmonary emphysema. Semin Ultrasound CT MR 1995;16(5):345–352 [DOI] [PubMed] [Google Scholar]
- 14.Maki DD, Gefter WB, Alavi A. Recent advances in pulmonary imaging. Chest 1999;116(5):1388–1402 [DOI] [PubMed] [Google Scholar]
- 15.Müller NL. CT diagnosis of emphysema. It may be accurate, but is it relevant? Chest 1993;103(2):329–330 [DOI] [PubMed] [Google Scholar]
- 16.Gevenois PA, De Vuyst P, Sy M, et al. Pulmonary emphysema: quantitative CT during expiration. Radiology 1996;199(3):825–829 [DOI] [PubMed] [Google Scholar]
- 17.Coxson HO, Mayo JR, Behzad H, et al. Measurement of lung expansion with computed tomography and comparison with quantitative histology. J Appl Physiol 1995;79(5):1525–1530 [DOI] [PubMed] [Google Scholar]
- 18.Fuld MK, Easley RB, Saba OI, et al. CT-measured regional specific volume change reflects regional ventilation in supine sheep. J Appl Physiol 2008;104(4):1177–1184 [DOI] [PubMed] [Google Scholar]
- 19.Parraga G, Ouriadov A, Evans A, et al. Hyperpolarized 3He ventilation defects and apparent diffusion coefficients in chronic obstructive pulmonary disease: preliminary results at 3.0 Tesla. Invest Radiol 2007;42(6):384–391 [DOI] [PubMed] [Google Scholar]
- 20.Dupuich D, Berthezène Y, Clouet PL, Stupar V, Canet E, Crémillieux Y. Dynamic 3He imaging for quantification of regional lung ventilation parameters. Magn Reson Med 2003;50(4):777–783 [DOI] [PubMed] [Google Scholar]
- 21.de Lange EE, Altes TA, Patrie JT. Evaluation of asthma with hyperpolarized helium-3 MRI: correlation with clinical severity and spirometry. Chest 2006;130(4):1055–1062 [DOI] [PubMed] [Google Scholar]
- 22.Middleton H, Black RD, Saam B, et al. MR imaging with hyperpolarized 3He gas. Magn Reson Med 1995;33(2):271–275 [DOI] [PubMed] [Google Scholar]
- 23.Black RD, Middleton HL, Cates GD, et al. In vivo He-3 MR images of Guinea pig lungs. Radiology 1996;199(3):867–870 [DOI] [PubMed] [Google Scholar]
- 24.Ebert M, Grossmann T, Heil W, et al. Nuclear magnetic resonance imaging on humans using hyperpolarised helium-3. Lancet 1996;347(9011):1297–1299 [DOI] [PubMed] [Google Scholar]
- 25.Bachert P, Schad L, Bock M, et al. Nuclear magnetic resonance imaging of airways in humans with use of hyperpolarized 3He. Magn Reson Med 1996;36(2):192–196 [DOI] [PubMed] [Google Scholar]
- 26.MacFall JR, Charles HC, Black RD, et al. Human lung air spaces: potential for MR imaging with hyperpolarized He-3. Radiology 1996;200(2):553–558 [DOI] [PubMed] [Google Scholar]
- 27.Woods JC, Choong CK, Yablonskiy DA, et al. Hyperpolarized 3He diffusion MRI and histology in pulmonary emphysema. Magn Reson Med 2006;56(6):1293–1300 [DOI] [PMC free article] [PubMed] [Google Scholar]
- 28.Maina JN, van Gils P. Morphometric characterization of the airway and vascular systems of the lung of the domestic pig, Sus scrofa: comparison of the airway, arterial and venous systems. Comp Biochem Physiol A Mol Integr Physiol 2001;130(4):781–798 [DOI] [PubMed] [Google Scholar]
- 29.Macklem PT. Airway obstruction and collateral ventilation. Physiol Rev 1971;51(2):368–436 [DOI] [PubMed] [Google Scholar]
- 30.Heussel CP, Hafner B, Lill J, Schreiber W, Thelen M, Kauczor HU. Paired inspiratory/expiratory spiral CT and continuous respiration cine CT in the diagnosis of tracheal instability. Eur Radiol 2001;11(6):982–989 [DOI] [PubMed] [Google Scholar]
- 31.Driehuys B, Cofer GP, Pollaro J, Mackel JB, Hedlund LW, Johnson GA. Imaging alveolar-capillary gas transfer using hyperpolarized 129Xe MRI. Proc Natl Acad Sci U S A 2006;103(48):18278–18283 [DOI] [PMC free article] [PubMed] [Google Scholar]
- 32.Patz S, Hersman FW, Muradian I, et al. Hyperpolarized (129)Xe MRI: a viable functional lung imaging modality? Eur J Radiol 2007;64(3):335–344 [DOI] [PMC free article] [PubMed] [Google Scholar]
- 33.Jacob RE, Chang YV, Choong CK, et al. 19F MR imaging of ventilation and diffusion in excised lungs. Magn Reson Med 2005;54(3):577–585 [DOI] [PubMed] [Google Scholar]