Abstract
S100A1, a 21-kDa dimeric Ca2+-binding protein of the EF-hand type, is expressed in cardiomyocytes and is an important regulator of heart function. During ischemia, cardiomyocytes secrete S100A1 to the extracellular space. Although the effects of extracellular S100A1 have been documented in cardiomyocytes, it is unclear whether S100A1 exerts modulatory effects on other tissues in proximity with cardiac cells. Therefore, we sought to investigate the effects of exogenous S100A1 on Ca2+ signals and electrical properties of superior cervical ganglion (SCG) neurons. Immunostaining and Western blot assays indicated no endogenous S100A1 in SCG neurons. Cultured SCG neurons took up S100A1 when it was present in the extracellular medium. Inside the cell exogenous S100A1 localized in a punctate pattern throughout the cytoplasm but was excluded from the nuclei. S100A1 partially colocalized with markers for both receptor- and non-receptor-mediated endocytosis, indicating that in SCG neurons multiple endocytotic pathways are involved in S100A1 internalization. In compartmentalized SCG cultures, axonal projections were capable of uptake and transport of S100A1 toward the neuronal somas. Exogenous S100A1 applied either extra- or intracellularly enhanced Cav1 channel currents in a PKA-dependent manner, prolonged action potentials, and amplified action potential-induced Ca2+ transients. NMR chemical shift perturbation of Ca2+-S100A1 in the presence of a peptide from the regulatory subunit of PKA verifies that S100A1 directly interacts with PKA, and that this interaction likely occurs in the hydrophobic binding pocket of Ca2+-S100A1. Our results suggest the hypothesis that in sympathetic neurons exogenous S100A1 may lead to an increase of sympathetic output.
Keywords: endocytosis, modulation, sympathetic
the s100 proteins, a vertebrate-specific subfamily of small (9–13 kDa) EF-hand Ca2+-binding proteins, regulate a myriad of intracellular processes ranging from motility through gene transcription (19, 49, 54). Presently, 24 genes of the S100 family have been identified (50). S100 proteins are expressed in a cell-specific manner and exert their effects via protein-protein interactions with different targets through both Ca2+-dependent and -independent mechanisms (64, 82). S100A1, the predominant S100 member in cardiac muscle cells, is a regulator of Ca2+ homeostasis and cardiac contractility (62), particularly during cardiac hypertrophy (55, 56). In addition to its intracellular functions, S100A1 is secreted into the extracellular space and exerts paracrine functions (19). In particular, the extracellular translocation of S100A1 has been documented to occur after heart ischemia (9). In cultured ventricular cardiomyocytes, S100A1 enhanced Ca2+ influx when added to the extracellular media (63).
The sympathetic nervous system regulates heart function through cell-cell signaling between sympathetic neurons and cardiomyocytes. The heart receives sympathetic input initiated from neurons located in the intermediolateral columns of the spinal cord at the T1–T4 levels (30, 36). Axons from these spinal neurons synapse on superior, middle, and inferior (stellate) cervical ganglia neurons, which extend postganglionic axons that reach the heart (4, 69). Sympathetic axons innervate sinoatrial and atrioventricular nodes, along with myocardial muscle fibers, primarily in the ventricles (4, 48, 59). Sympathetic axons release norepinephrine, which, via β-adrenergic signaling, increases heart rate and conduction as well as excitability and contractility of the myocardium (4, 20). Concurrently, signaling from the heart, via the release of neurotrophic factors, is an important regulator for the maintenance of sympathetic synaptic activity, and is especially critical during development (27, 32, 65). Given this reciprocal anatomic and functional interaction between sympathetic ganglion neurons and the heart, and the fact that S100A1 is released to the extracellular media during cardiac distress, we sought to address potential effects of exogenous S100A1 functioning as a signaling molecule in sympathetic neurons.
MATERIALS AND METHODS
Cell Cultures
Mass cultures of superior cervical ganglion neurons.
Superior cervical ganglia (SCG) were dissected from 5-wk-old Wistar rats. The animals were killed according to procedures authorized by the Institutional Animal Care and Use Committee of the University of Maryland Baltimore. SCG neurons were dissociated, plated onto poly-d-lysine- and collagen-coated glass coverslip-bottom culture dishes, and maintained as described previously (24, 25, 31). Dulbecco's modified Eagle's medium (DMEM) was supplemented with fetal bovine serum (10%), penicillin-streptomycin (1%), and nerve growth factor (NGF, 25 ng/ml; Invitrogen). For some experiments, sympathetic neurons were maintained up to 7 days in culture in growth medium containing cytosine arabinoside (ara-C, 10 μM) to eliminate nonneuronal, mitotically active cells. For electrophysiology and Ca2+ imaging neurons were evaluated between 1 and 5 days after plating.
Compartmentalized cultures of SCG neuronal cultures.
SCG neurons from 1-day-old rats were isolated and compartmentalized cultures were established as described previously (11, 12). Briefly, a rake made by clamping together 20 insect pins was used to make 20 parallel scratches ∼250 μm apart on the poly-d-lysine/collagen-coated plastic culture dishes. To assemble the system, the scratched region was first coated with medium containing methylcellulose (1%; Sigma, St. Louis, MO) before a three-compartment Campenot chamber (Camp10 Teflon dividers; Tyler Research, Edmonton, AB, Canada) was set with silicone vacuum grease (Dow Corning). When assembled properly, this silicone vacuum grease-sealed multicompartmentalized neuronal culture constitutes a virtually fluid-impermeable system between the chambers, thus allowing the control of the media environments of the side compartments independently of the central compartment (11, 12). Cells (50–100 × 103) were plated only in nonleaky chambers into the central compartment, which contained DMEM, FBS (10%), antibiotics, and NGF (50 ng/ml). Neurons in Campenot chambers were allowed to adhere for 6–12 h, and side compartments were filled with DMEM, FBS (10%), antibiotics, and NGF (100 ng/ml). The integrity of compartment seals was constantly monitored, and leaky chambers were discarded. Fresh medium was added every 48 h, and ara-C was kept in the central compartment until nonneuronal cells were eliminated.
Overexpression, Purification, and Labeling of Recombinant S100A1 Protein
Wild-type recombinant S100A1 was overexpressed and purified in Escherichia coli [HMS174(DE3) strain] transformed with an expression plasmid (pET-11b; Novagen, Madison, WI) containing the gene for rat S100A1 as previously described (78). Purified S100A1 was labeled with the fluorescent dye Alexa 488 and a standard protein label strategy suggested by the manufacturer (Invitrogen).
Immunocytochemistry
Neurons were fixed in phosphate-buffered saline (PBS, pH 7.4) containing 4% (wt/vol) of paraformaldehyde for 10 min and then permeabilized in PBS containing 0.1% (vol/vol) Triton X-100 (Sigma) for 10 min. The neurons were then exposed to PBS containing 8% (vol/vol) of donkey serum for 1 h at 4°C to block nonspecific labeling. Primary and secondary antibodies were diluted in PBS containing 2% (vol/vol) donkey serum. Neurons were incubated with mouse monoclonal antibody against S100A1 (1:400; Affinity Bioreagents, Golden, CO) for 2 h at room temperature and then incubated with the secondary antibody, Alexa 488-conjugated donkey anti-mouse IgG (1:200 dilution; Invitrogen, Molecular Probes, Eugene, OR), for 2 h at room temperature. Dishes were washed thoroughly after each step in PBS containing 2% (vol/vol) donkey serum. For each primary antibody-treated dish, another dish of SCG neurons was treated with the secondary antibody only and used as control.
Antibody-labeled neurons were imaged on an Olympus FluoView 500 confocal system built on an Olympus IX71 inverted microscope. Neurons were viewed with a UPlan Apo ×60 NA 1.20 water-immersion objective lens using 488-nm excitation (Multiline argon laser) for Alexa 488 and emission detected with a 505-nm long-pass filter. Photobleaching and photodamage were reduced by operating the lasers at the lowest possible power that still provided images with satisfactory signal-to-noise ratio. Confocal images were processed with custom-written software in IDL (RSI, Boulder, CO) and ImageJ (National Institutes of Health, Bethesda, MD; http://rsb.info.nih.gov/ij/).
Western Blot and Lysate Preparation
Ten mass culture plates containing the SCG neurons from 8–10 dissociated ganglia provided a sufficient amount of cellular material for Western blot experiments. Briefly, cultured SCG neurons were lysed with a mammalian protein extraction reagent (M-PER, Pierce), and the homogenates were supplemented with protease inhibitor cocktail and pooled together (Complete-Mini EDTA-free, Roche Diagnostics). The homogenates were subjected to centrifugation at 10,000 rpm for 10 min at 4°C. The supernatant was extracted and stored. Protein content was determined with the Bradford assay (Bio-Rad, Hercules, CA). Samples for electrophoresis were not boiled but were solubilized at 70°C for 10 min. Approximately 60–300 μg of protein sample was fractionated by 4–12% SDS-PAGE and transferred to nitrocellulose membrane at 20 V for 3 h at 4°C with the Xcell II blot module (Invitrogen). Blots were then processed and probed with antibodies against S100A1 and GAPDH (Sigma). The immunoreactive bands were visualized with ECL Western Blotting Detection Reagents (Amersham). ImageJ was used to analyze data.
Fluorescent Probes Used to Study Endocytosis and Labeling of Organelles
In some experiments neurons were simultaneously or sequentially labeled with S100A1-Alexa 488 and different fluorescent probes to stain plasma membrane, evaluate endocytosis, and label organelles (Invitrogen, Molecular Probes). FM4-64 was used to stain plasma membrane and to follow bulk membrane internalization and transport (76). Dextran-TMR (molecular mass 10,000 Da; 500 μg/ml for 12 h) was used as a fluid-phase endocytotic marker (21, 35). Cholera toxin subunit B-Alexa 594 (5 μg/ml for 12 h) was used as a marker for lipid raft-mediated endocytosis and to label Golgi apparatus (58). Labeling of cells with transferrin-Alexa 568 (40 μg/ml for 18 h) was used as a marker for clathrin-dependent endocytosis and to label early/recycling endosomes (28, 80). Labeling of lysosomes was done by incubating cells with LysoTracker (LysoRed DND-99; 5 μg/ml for 40 min). Labeling was conducted on living cells maintained at 37°C at 5% CO2 in DMEM with 10% FBS. After incubation, cells were washed three times in L-15 medium at room temperature and then imaged with a confocal microscope. Colocalization analysis was conducted with a compilation of general colocalization indicators (ImageJ plugin JACoP; Ref. 6).
Solutions
Neurons were locally perfused extracellularly during recording (1–2 ml/min) with mammalian Ringer solution [containing (in mM) 160 NaCl, 3 KCl, 2 CaCl2, 8 glucose, 1 MgCl2, 10 HEPES, pH 7.4 with NaOH] or with an external solution designed to isolate whole cell Ca2+-channel currents [containing (in mM) 162.5 TEA-Cl, 2 CaCl2, 8 glucose, 1 MgCl2, 0.0001 TTX, 10 HEPES, pH adjusted to 7.4 with TEA-OH]. In some experiments CaCl2 was replaced with BaCl2 (1–2 mM). Where noted, nifedipine (5 μM; to selectively block L-type Ca2+ channels), ω-conotoxin-GVIA (ω-ctx, 1 μM; to selectively block N-type Ca2+ channels), and CoCl2 (0.2 mM; a nonspecific Ca2+ channel blocker) were added to the external solution. For whole cell voltage-clamp experiments the pipette solution (internal solution) contained (in mM) 140 CsCl, 0.2 EGTA, 4 MgCl2, 14 creatine phosphate, 4 Na2ATP, 0.3 Na2GTP, 0.1 leupeptin, and 10 HEPES, pH adjusted to 7.4 with CsOH. Current-clamp experiments were carried out with Ringer solution and an intracellular pipette solution containing (in mM) 150 KCl, 10 NaCl, 4 MgCl2, 4 Na2ATP, 14 phosphocreatine-Na2, 0.3 Na2GTP, and 10 HEPES, pH adjusted to 7.4 with KOH. For intracellular uptake and axonal transport experiments as well as for Ca2+ imaging, neurons were assayed 2–24 h after extracellular addition of S100A1. Where indicated, we used either Alexa 488-labeled or unlabeled S100A1 added to the extracellular solution or intracellularly via the patch pipette.
Electrophysiology and Data Analysis
Membrane current and voltage measurements were performed in the whole cell configuration of the patch-clamp technique (29) with a EPC-10 plus amplifier (HEKA Instruments) and pipettes of borosilicate glass (Kimax-51) with resistance of 1.2–1.8 MΩ when filled with the internal solution. For voltage-clamp experiments capacitance compensation was adjusted to largely cancel linear capacity transients, and series resistance was compensated to >60% and periodically monitored. Linear capacitive and leak currents were routinely subtracted by a P/4 protocol from a subholding potential of −120 mV. Care was taken to select neurons with no evident neuronal process to improve space clamp. Neurons with signs of qualitative clamp error were rejected from the analysis. Measurements were started ∼3 min after breakthrough into whole cell configuration. Because the magnitude of the Ca2+-channel currents was dependent on cell size, aggregate current data are presented as current density normalized to cell capacitance, which was estimated with the capacitance cancellation circuitry of the patch-clamp amplifier.
After establishment of the whole cell current-clamp configuration, we waited for the membrane potential to stabilize. Action potential (AP) height was defined as the peak relative to the most negative voltage reached during the afterhyperpolarization. AP width was measured as the full width at half-maximal spike height. Data were excluded from analysis if the AP height was <70 mV. APs were initiated by 20-ms suprathreshold depolarizing current pulses. To test the effect of S100A1, we adjusted the membrane potential to −60 mV by using the amplifier in the low-frequency voltage-clamp mode, a modified current-clamp mode that works like a current clamp for fast signals and like a voltage clamp for low-frequency signals.
Data were acquired, digitized, stored, and analyzed with commercial software (Patchmaster and Fitmaster; HEKA Instruments). For further analysis we used Origin 8 software (OriginLab, Northampton, MA). Command pulses were delivered at 10-s intervals from a holding potential of −80 mV, unless otherwise indicated. Electrical signals were typically low-pass filtered at 3–10 kHz (3-pole Bessel filter). The sampling frequency for Ca2+-channel currents and for membrane potentials was 50 and 10 kHz, respectively.
To measure and quantify inactivation, we divided current amplitude at the end (640 ms) of the test pulse (Iend) by peak current value (Ipeak; Ref. 25). The fractional inactivation was then calculated as 1 − (Iend/Ipeak). We also used a double-exponential function plus one constant to quantify the fast and slow components of inactivation during 640-ms voltage steps. The amplitude of each inactivating component was divided by the total amplitude, which was the sum of the two inactivating and one noninactivating component.
High-Speed Confocal Ca2+ Imaging and Field Stimulation
Fluo-4 fluorescence measurements were carried out on a Zeiss LSM 5 Live System as previously described (31). Neurons were loaded with 2 μM fluo-4 AM in mammalian Ringer solution at room temperature for 20 min and then washed three times with 2 ml of dye-free Ringer solution. Individual neurons were imaged with a ×63 NA 1.2 water-immersion objective lens. Excitation for fluo-4 was provided by the 488-nm line of a 100-mW diode laser, and emitted light was collected at >510 nm. One- to two-millisecond electrical field stimuli were applied via two parallel platinum wires positioned at the bottom of the dish, ∼5 mm apart. Application of each pulse protocol was synchronized relative to the start of confocal scan acquisition. Typically, the field stimulus was applied 100 ms after the start of the confocal scan sequence, thus providing control images before stimulation at the start of each sequence. These control images were used to determine the resting steady-state fluorescence level (F0). Average intensity of fluorescence within selected small (generally 2.5–39 μm2) regions of interest (ROIs) was measured with a Zeiss LSM Image Examiner (Carl Zeiss, Jena, Germany). Images in x-y mode (frame size: 512 × 200 pixels; scan speeds: 108 fps) were background corrected by subtracting an average value recorded outside the cell. The average F0 value in each ROI before electrical stimulation was used to scale Ca2+ signals in the same ROI as ΔF/F0. No attempts were made to estimate the actual cytosolic Ca2+ concentration.
NMR Spectroscopy
Sample preparation.
A synthetic peptide derived from the cAMP-dependent regulatory subunit IIβ of protein kinase A (PKA) was chemically synthesized and prepared for NMR in a manner previously described (78). Recombinant 15N-labeled rat S100A1 protein was purified as previously described (78). NMR samples contained (in mM) 15 Tris, pH 7.2, 15 dithiothreitol, 10 CaCl2, 0.34 NaN3, 20 NaCl, and 0–3 PKA peptide, with 10% D2O and 500 μM S100A1 protein.
NMR spectroscopy and chemical shift assignments.
NMR spectra were collected at 37°C with a Bruker AVANCE 800 NMR spectrometer (800.27 MHz for protons) equipped with four frequency channels and a 5-mm triple-resonance z-axis gradient cryogenic probe head. A series of heteronuclear single-quantum coherence (HSQC) spectra were run with increasing amounts of PKA peptide to S100A1 protein (0, 0.5×, 1×, 3×, and 6× molar ratios). Generally, HSQC peaks could be followed on titration of the PKA peptide into Ca2+-S100A1. However, three-dimensional (3D) 15N-edited nuclear Overhauser enhancement spectroscopy (NOESY) and 3D 15N-edited heteronuclear multiple-quantum coherence (HMQC)-NOESY-HSQC (2) experiments were collected on the final PKA-S100A1 titration point in order to verify the sequence-specific assignments of the HSQC spectra.
To avoid one source of systematic bias, experimental and control measurements were alternated whenever possible and concurrent controls were always performed. All recordings were obtained at room temperature (19–22°C). Where appropriate, data are expressed as means ± SE, with the number of observations (n) in parentheses. Statistical significance was determined by using an unpaired Student's t-test. Data were considered significant when P < 0.05.
RESULTS
S100A1 Is Not Expressed in SCG Neurons
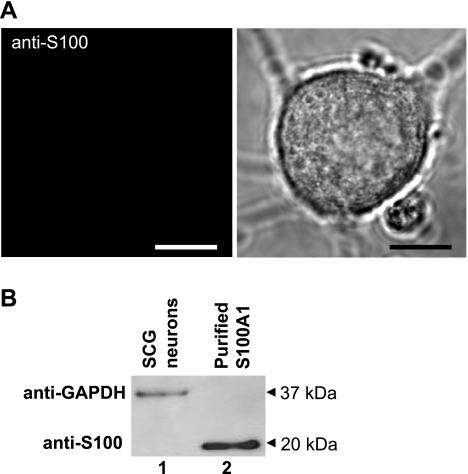
Previous reports have shown that S100A1 is expressed in satellite and glial cells of the SCG but not in principal neurons (15, 68). In agreement with these previous reports, no detectable immunofluorescent signal was seen when using confocal microscopy and antibodies directed against S100A1 in principal SCG neurons (Fig. 1A). As a positive control, this same antibody gave a strong immunofluorescent signal when tested in fast skeletal muscle fibers, a cell type in which S100A1 is expressed (data not shown; see Ref. 61). Further evidence of the absence of S100 in SCG neurons came from Western blot experiments. Lysates from principal SCG neurons (cultures were exposed to ara-C to remove nonneuronal cells; see materials and methods) demonstrated no immunoreactivity to S100A1 antibodies (Fig. 1B). Purified S100A1 was used as a positive control. These results indicate that principal neurons from SCG contain no detectable endogenous S100A1.
Fig. 1.
Superior cervical ganglion (SCG) neurons do not endogenously express S100A1 protein. A, left: representative confocal image of a SCG neuron immunostained with anti-S100A1 and counterstained with a secondary Alexa 488-conjugated antibody demonstrates no endogenous expression of S100A1. Right: corresponding transmitted light image. Scale bars, 10 μm. B: representative Western blot of SCG neurons reveals no endogenous S100A1 expression in cultured SCG neurons (lane 1), with purified S100A1 (lane 2) as a positive control.
Intracellular Translocation of Exogenous S100A1 in Sympathetic Neuron Cultures
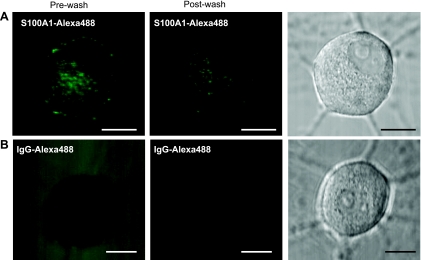
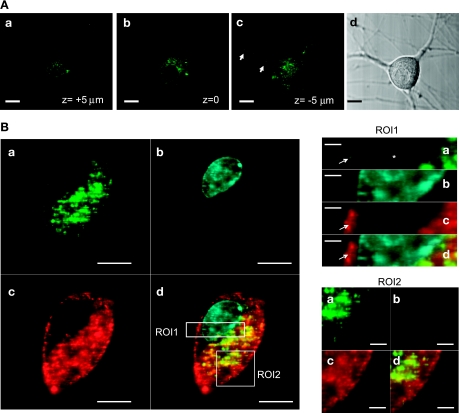
In some cells, specific S100 members are released into the extracellular space and exert paracrine functions on the neighboring cells (19). In particular, the extracellular release of S100A1 occurs after heart ischemia (9), and cultured ventricular cardiomyocytes internalized S100A1 when it was added to the culture medium (63). Therefore, we asked whether cultured sympathetic neurons were able to internalize extracellular S100A1. Neurons were incubated for 30 min to 24 h with Alexa 488-labeled S100A1 protein at a final concentration of 5–10 μM. Cellular uptake was minimal after 30 min and slightly evident after 2 h of incubation (data not shown). Over the next 12–24 h, some aggregates were observed and dramatically increasing numbers of much smaller particles of fluorescence were observed on the cell surface, within cell bodies, and along neuronal projections of virtually all the imaged neurons. Figure 2 shows representative images of live neurons incubated for 24 h with S100A1-Alexa 488 (5 μM, Fig. 2A) and neurons with IgG-Alexa 488 (Fig. 2B). It should be noted that the neurons incubated with S100A1-Alexa 488 exhibited a fluorescent punctate pattern that was persistent even after the washout of the extracellular solution containing the labeled S100A1 protein. Neurons incubated with IgG-Alexa 488 did show a weak intracellular fluorescent signal (likely the result of autofluorescence), and the removal of the extracellular solution resulted in a complete washout of the extracellular labeled IgG (Fig. 2B), indicating no translocation of immunoglobulin after 24 h. After 3–5 days, intracellular S100A1 particles were still readily apparent (data not shown). Figure 3A, a–c, shows representative images at different focal planes of a neuron incubated with S100A1-Alexa 488 (10 μM) for 24 h. It should be noted that the S100A1-Alexa 488 signal is distributed across the cytoplasm and is present in neuronal projections (Fig. 3Ac). Figure 3B shows x-y images at higher magnification of another neuron incubated with S100A1-Alexa 488 for 24 h and costained with FM4-64 (a plasma membrane dye) and DAPI (to stain the nucleus). The S100A1-Alexa 488 image appears as a clear punctate pattern distributed across the cytoplasm (Fig. 3Ba). No S100A1-Alexa 488 signal was detected in the nuclei (Fig. 3B, ROI1). FM4-64 labels membrane structures, including membrane vesicles, and was used to follow bulk membrane internalization (76). Figure 3B, ROI2, shows codistribution of S100A1-Alexa 488 and FM4-64, suggesting uptake of S100A1 via an endocytotic mechanism.
Fig. 2.
Extracellular S100A1 is taken up by SCG neurons. Representative single-plane confocal images of neurons treated for 24 h with S100A1-Alexa 488 (5 μM; A) or with Alexa 488-IgG (20 μg/ml; B) before (left) and after (center) washout of the extracellular media. Right: corresponding transmitted light images. Scale bars, 10 μm.
Fig. 3.
Intracellular distribution of exogenous S100A1. A: confocal x–y images at different z-axial planes (a, top; b, middle; c, bottom) from a neuron treated with extracellular S100A1-Alexa 488 (10 μM) for 24 h. S100A1-Alexa 488 fluorescence is located in the cytoplasm and present in the neuronal processes (arrows in c) but not in the nucleus. Scale bars, 10 μm. B: representative confocal images of another neuron treated with extracellular S100A1-Alexa 488 for 24 h (a) and colabeled with DAPI (b) to stain the nucleus and FM4-64 (c) to stain plasma membrane and to follow bulk membrane internalization; d shows the merge of a–c. ROI1 and ROI2 are enlarged views of the outlined regions of interest in Bd, demonstrating clear S100A1 exclusion from the nucleus and association with membranous structures.
Uptake of S100A1 Involves More Than One Endocytotic Mechanism
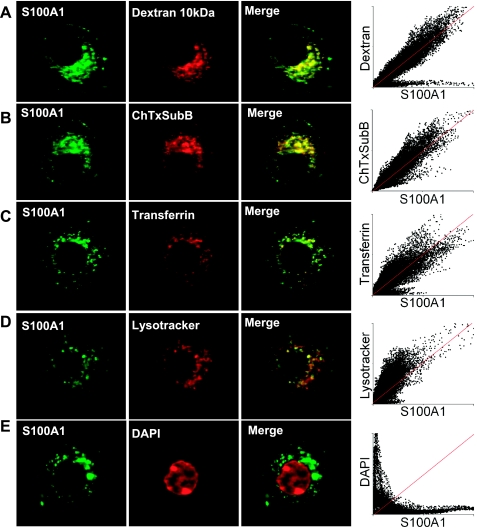
To identify the endocytotic mechanism(s), as well as the subcellular compartments that accumulate and transport exogenous S100A1-Alexa 488, costaining with a variety of endocytotic and organelle markers was performed. Cultured neurons were exposed to extracellular S100A1-Alexa 488 (5 μM) and also labeled with fluorescent 10-kDa dextran (Fig. 4A), a marker of fluid-phase endocytosis (21, 35); cholera toxin subunit B (Fig. 4B), a marker of lipid rafts and Golgi apparatus (58); fluorescent transferrin (Fig. 4C), a tool to evaluate clathrin-dependent endocytosis as well as a marker of early/recycling endosomes (28, 80); and LysoTracker (Fig. 4D), a fluorescent acidic organelle marker, to label lysosomes. Figure 4 shows representative confocal images of neurons treated with S100A1 and with these fluorescent probes. In all the cases shown in Fig. 4, A–D, pixel distributions of the scatter plots form a cloud around the reference line (red line). This reference line illustrates a case of complete colocalization. Average Pearson's coefficients for dextran-, cholera toxin-, transferrin-, and LysoTracker-marked neurons were 0.93, 0.95, 0.92, and 0.91, respectively (15–20 neurons from 2 different cultures/condition). Thresholded Manders's coefficients were <0.5. These results and correlation coefficients suggest partial colocalization events between these probes and S100A1-Alexa 488. As a negative control, the nuclear stain DAPI showed no colocalization with S100A1. Figure 4E shows confocal images of a neuron treated with S100A1 and stained with DAPI to illustrate a case of exclusion of the signals. In this case pixel distributions appear close to both axes of the scatter plot (average Pearson's and Manders's coefficients for DAPI-stained and S100A1-treated neurons were <0.1 and 0.08, respectively). Collectively, colocalization analysis suggest that both non-receptor- and receptor-mediated endocytosis are involved in the internalization of S100A1 and that exogenous S100A1 was internalized and delivered to early/recycling endosomes, Golgi apparatus, late endosomes, and lysosomes.
Fig. 4.
S100A1 is internalized via multiple endocytotic pathways. S100A1-Alexa 488-treated (5 μM) neurons (imaged for Alexa 488, left) were incubated with the following markers (center): dextran-TMR (dextran 10 kDa; A) for fluid-phase endocytosis; cholera toxin subunit B-Alexa 594 (ChTxSuB; B) for non-receptor-mediated endocytosis and to follow lipid raft membranes and Golgi; transferrin-Alexa 568 (C) as marker of clathrin-dependent endocytosis and to follow early/sorting and recycling endosomes; LysoRed DND-99 (LysoTracker, D) to stain acidic organelles and lysosomes; and DAPI (E) as a negative control of colocalization. Right: merged images of left and center panels with S100A1-Alexa 488 in green and markers shown in red. Scatter plots show pixel distributions of red vs. green channels. The reference red line illustrates a case of complete colocalization. In A–D, Pearson's coefficients were >0.9 and thresholded Manders's coefficients were <0.5, indicative of partial colocalization. Scale bars, 10 μm.
S100A1 Is Transported into SCG Neuron Somas Via Axonal Retrograde Transport
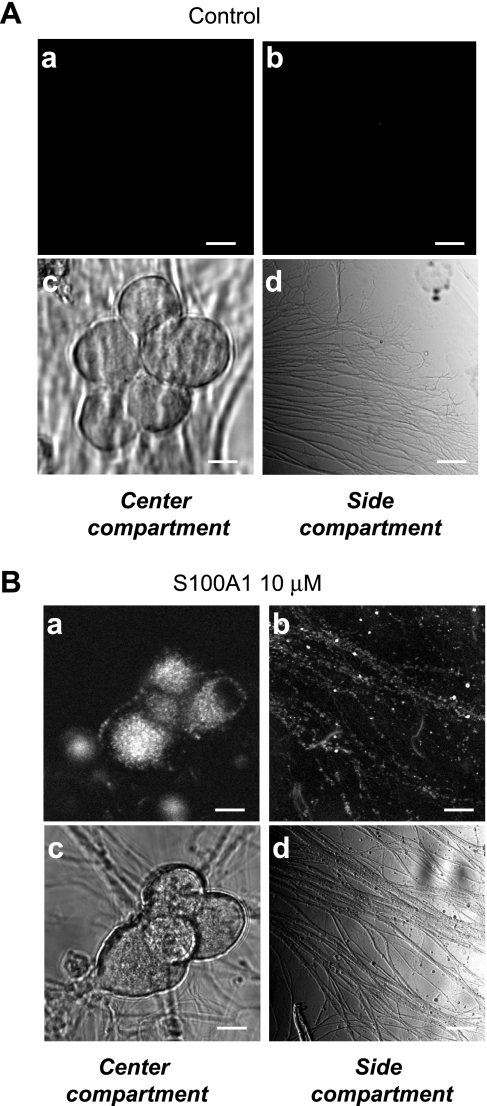
Frequently, in mass cultures of SCG neurons, S100A1-Alexa 488 punctate fluorescent signals within cell bodies and axons were transported in both an anterograde and a retrograde fashion. Time-lapse x-y confocal images (see Supplemental Video S1) of the labeled cells revealed movement (0.4 μm/s) of small fluorescent particles within cell bodies and along neuronal processes.1 A fraction of the postganglionic distal axons that reach the heart originate at the SCGs. The extracellular translocation of S100A1 has been documented to occur after heart ischemia (9). Therefore we sought to evaluate whether S100A1 can be transported from distal axons to the cell bodies of neurons. To this end we used a compartmentalized neuronal culture, a model that allows physical separation between cell somas and axonal projections (see materials and methods; Ref. 11). In this compartmentalized culture, evidence for the operation of different mechanisms of both anterograde and retrograde signaling has been provided (67, 73). Figure 5A, c and d, shows representative transmitted light images of cell bodies located in the central compartment and their axonal projections on the side compartment of a Campenot chamber. Neurons plated into the central chamber tend to reorganize to produce small clusters of somas; axonal projections from these neurons usually grow toward the partitions separating the central and side chambers. We assessed uptake and retrograde transport of S100A1 when the length of axons in the side compartment reached 200–400 μm. Figure 5 also shows representative confocal images of center and side compartments of control (Fig. 5A, a and b) and S100A1-treated (Fig. 5B, a and b) compartmented SCG cultures. Side compartments shown in Fig. 5, A and B, were exposed to Alexa 488-IgG and S100A1-Alexa 488 (5 μM), respectively. After 24 h chambers were rinsed twice with Ringer solution and images were obtained. In control (Alexa 488-IgG treated) neurons no fluorescence was detected (Fig. 5A, a and b). However, S100A1-Alexa 488-treated neurons located in the center compartment displayed a punctalike fluorescent pattern, indicating that S100A1 was effectively transported from axons toward the cell bodies and stained in punctate structures (Fig. 5B, a and b). This result indicates that S100A1 undergoes retrograde transport from distal axons toward the somas when S100A1 is present in the extracellular space.
Fig. 5.
Extracellular S100A1 is taken up and undergoes retrograde axonal transport. Representative confocal (a and b) and transmitted light (c and d) images of center and side compartments of control (A) and S100A1-treated (B) compartmented SCG cultures. Only the side compartments shown in A and B were treated with Alexa 488-IgG or S100A1-Alexa 488 (5 μM), respectively. After 24 h chambers were rinsed and imaged. S100A1-Alexa 488 fluorescent signal was present in axons in the side compartment and in axons and cell bodies of the central compartment, indicating uptake and translocation of S100A1 from axonal projections toward somas via retrograde transport. No uptake or translocation was seen in Alexa 488-IgG treated neurons (A). Scale bars, 10 μm.
Whole Cell Ca2+ Channel Current Enhancement on Extracellular Application of S100A1
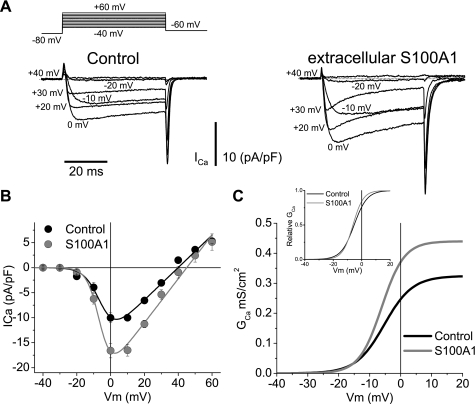
The above results detailing the uptake, localization, and axonal retrograde transport of exogenous S100A1, coupled with the fact that previous studies have shown that S100 family members enhance Ca2+ signals (44, 63), prompted us to look for effects of S100A1 at the level of Ca2+ signals, particularly at the level of Ca2+ influx. We first measured whole cell Ca2+ currents, using 2 mM Ca2+ as a charge carrier. Figure 6 shows representative Ca2+ current traces from a control SCG neuron cultured for 24 h (Fig. 6A, left). Current was elicited by 50-ms step depolarizations from a holding potential of −100 mV to the voltage values indicated close to each trace. The pooled current density vs. test potential (I-V relationship) from control neurons in Fig. 6B shows that the currents activated at potentials positive to −20 mV, reached a maximum inward amplitude near 0 mV, and reversed at +40 mV.
Fig. 6.
Extracellular S100A1 enhances whole cell Ca2+ currents in SCG neurons. A: representative macroscopic Ca2+ current traces from control (left) and S100A1-treated (10 μM; right) neurons. Macroscopic currents were elicited by depolarizing pulses with the voltage protocol illustrated at top, with 2 mM Ca2+ as the charge carrier. B: average peak current density plotted against voltage (I-V) relationship for step depolarizations from control (black circles) and S100A1-treated (10 μM; gray circles) neurons. The solid lines through the I-V curves in B are least squares fits of the data to a modified Boltzmann-ohmic equation. Average parameter values for maximum conductance (Gmax), half-activation potential (Vh), and steepness (k) for control neurons were 0.32 mS/cm2, −5.3 mV, and 4.5 mV, respectively. For S100A1-treated neurons Gmax, Vh, and k were 0.43 mS/cm2, −6.1 mV, and 3.6 mV, respectively. Vm, membrane potential. C: conductance (GCa) vs. V relationship derived from I-V plots from control and S100A1-treated neurons. Inset: normalized G vs. V plots from C.
Figure 6 also shows representative Ca2+ current traces from another neuron treated with extracellular S100A1 (10 μM for 24 h; Fig. 6A, right). S100A1 was added 30 min after the neurons were plated. The extracellular application of S100A1 induced a ∼20–50% enhancement of the peak inward Ca2+ current density (Fig. 6B). Also note that the inactivation during the test pulse is more pronounced in S100A1-treated neurons (see below).
To evaluate the effect of S100A1 on the voltage dependence of Ca2+ current activation I-V plots from control and S100A1-treated neurons were fitted to a Boltzmann-ohmic function, described by the following equation (7): I = Gmax (V − Vrev)/[1 + exp(−V − Vh)/k], where Gmax is the maximum conductance, V is the membrane potential, Vrev is the reversal potential, Vh is the half-activation potential, and k is a measure of the steepness. The solid lines through the I-V curves in Fig. 6B were least squares fits of the data to this modified Boltzmann-ohmic equation. Average parameter values for Gmax, Vh, and k for control neurons were 0.32 mS/cm2, −5.3 mV, and 4.5 mV, respectively. For S100A1-treated neurons Gmax, Vh, and k were 0.43 mS/cm2, −6.1 mV, and 3.6 mV, respectively. These parameters were used to derive the activation curves for control and S100A1-treated cells, as plotted in Fig. 6C. S100A1 dialysis had little or no effect on the voltage dependence of current activation, as shown by Fig. 6C, inset. Therefore, judging by the lack of effect on voltage dependence of the Ca2+ channel activation we conclude that the enhancement of whole cell Ca2+ current can be classified as voltage independent.
Extracellular S100A1 Modifies Kinetics of Whole Cell Ca2+ Current Inactivation
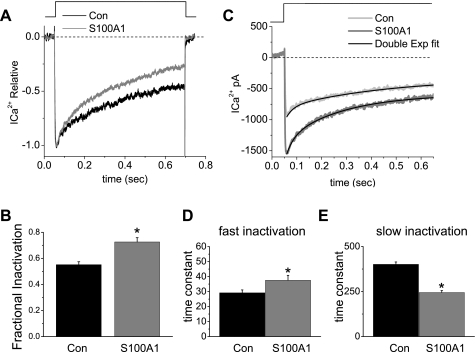
The observation that inactivation kinetics seemed faster in neurons treated with S100A1 prompted us to characterize this process. In Fig. 7A Ca2+ current traces recorded during a voltage step from −80 to 0 mV are displayed. Over the course of this 640-ms depolarization, the current partially inactivated to 43% of its peak value in control neurons vs. 28% of its peak value observed in S100A1-treated neurons (Fig. 7, A and B). The inactivation process could be fit well with the sum of two exponentials plus one constant as shown in Fig. 7C. Mean fast and slow amplitudes of 0.16 ± 0.1 and 0.44 ± 0.2, respectively, were calculated for control neurons vs. 0.17 ± 0.1 and 0.45 ± 0.2 for S100A1-treated neurons (not significant, n = 8; data not shown). Amplitude was measured as the fraction relative to total amplitude, which is the sum of both inactivating and noninactivating components. In general, the amplitude of the fast component was ∼0.3 that of the slow component, and this ratio varied little over recording times up to 10 min. In control neurons the mean time constant for the fast component of inactivation was 29 ± 1.9 ms, whereas the slow component had a time constant of 401 ± 13 ms (Fig. 7, D and E). In S100A1-treated neurons the mean time constant for the fast component of inactivation significantly increased to 37 ± 3.2 ms, whereas the time constant of the slow component significantly decreased to 244 ± 11 ms (Fig. 7, D and E). The above results indicate that S100A1 treatment did not modify the relative amplitude of either the fast or the slow component. However, S100A1 treatment significantly slowed the fast phase of inactivation and considerably accelerated the slow phase of inactivation (n = 8; P < 0.05 for both). These findings may indicate that S100A1 is affecting the inactivation kinetics of one or more population(s) of voltage-dependent Ca2+ channels.
Fig. 7.
S100A1 increases whole cell Ca2+ current inactivation. A: whole cell Ca2+ currents measured during 640-ms voltage steps to 0 mV from a −80 mV holding potential. Representative Ca2+ currents traces recorded from a control and a S100A1-treated neuron. Current traces were normalized with respect to the peak to compare the time course of inactivation between control and S100A1-treated neurons. Dashed line in A and C indicates 0 current level. B: extent of inactivation was calculated as the fraction 1 − (Iend/Ipeak), where Iend is current amplitude at the end of the test pulse and Ipeak is peak current amplitude; see materials and methods. The overall extent of inactivation was statistically different between control and S100A1-treated neurons (*P < 0.05, n = 8). C: inactivation during 640-ms voltage steps was fitted with the sum of 2 (fast and slow) exponential function plus 1 constant (bold lines). D and E: average values for fast (D) and slow (E) time constants from control and S100A1-treated neurons (*P < 0.05, n = 8).
S100A1 Modulates L-type (Cav1) Component of Total Ca2+ Current in Cultured SCG Neurons
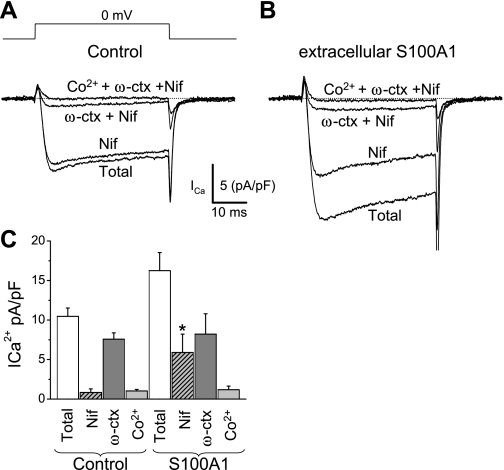
Previous studies have demonstrated that in cultured SCG sympathetic neurons most of the Ca2+ current flows through N-type (Cav2.2; 80–90%) and L-type (Cav1, predominantly Cav1.3; 10–20%) Ca2+ channels, with minimal R-type (Cav2.3) and P/Q (Cav2.1) components (47, 53, 60). Here, Cav1, Cav2.2, and Cav2.3 channel current components are identified as the fraction of the total current [the difference current obtained by subtraction of currents recorded under the channel blocker from that measured immediately before the channel blocker(s) was applied] sensitive to 5 μM nifedipine and 1 μM ω-ctx in the presence of nifedipine and to 0.5 mM Co2+ added in the presence of nifedipine and ω-ctx, respectively (24, 25). Figure 8A shows that the sequential addition of nifedipine, ω-ctx, and CoCl2 progressively resulted in reduced Ca2+ currents, allowing the estimation of the proportion of current carried through Cav1, Cav2.2, and Cav2.3 channels, respectively. We found that in 24-h-cultured control neurons ∼8 ± 2% of whole cell Ca2+ channel current was sensitive to nifedipine, ∼80 ± 5% was sensitive to ω-ctx, and 10 ± 2% was sensitive to Co2+ (Fig. 8, A and C). However, in neurons exposed to extracellular S100A1 for 24 h the percentage of the whole cell Ca2+ current sensitive to nifedipine was increased to ∼40% and only ∼60% was then sensitive to ω-ctx and Co2+ (Fig. 8, B and C). It should be noted that the amplitudes of the ω-ctx- and Co2+-sensitive components (N and R types) are not changed by S100A1 treatment. The amplitude of the N-type component in control neurons was 7.5 ± 0.8 pA/pF versus 8.2 ± 2.5 pA/pF in S100A1-treated neurons (P > 0.05, Fig. 8C). The amplitude of the R-type component in control neurons was 1.0 ± 0.2 pA/pF versus 1.1 ± 0.4 pA/pF in S100A1-treated neurons (P > 0.05, Fig. 8C).
Fig. 8.
Twenty-four-hour extracellular S100A1 treatment increases L-type Ca2+ current (Cav1) in cultured SCG neurons. Current was elicited with the voltage-clamp protocol illustrated in A delivered every 4 s and using Ca2+ as charge carrier (2 mM). A and B: representative Ca2+ current traces before (Total), during nifedipine treatment (Nif; 5 μM), during ω-conotoxin GVIA (ω-ctx; 1 μM) plus nifedipine, and in the presence of cobalt (Co2+; 0.2 mM) plus Nif and ω-ctx from control (A) and S100A1-treated (B) neurons. C: summary of total, nifedipine-sensitive (L-type; Cav1), ω-ctx-sensitive (N-type; Cav2.2), and Co2+-sensitive (R-type; Cav2.3) Ca2+ current densities (*P < 0.05, n = 5 cells/group). The nifedipine-sensitive component was selectively enhanced by S100A1 treatment, suggesting that L-type Ca2+ channels are the primary target for modulation by S100A1.
Intracellular Dialysis of S100A1 Mimics Effect of Extracellularly Added S100A1
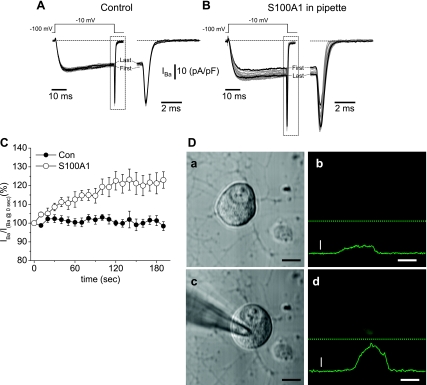
We next asked which signaling mechanism(s) underlies the S100A1-mediated augmentation of Ca2+ channel current. Is S100A1 binding to cell surface receptors sufficient for the activation of a signaling cascade? Or alternatively, is S100A1 being internalized and then released to the cytosol? There is evidence that some S100 members interact with cell surface receptors that transduce their effects (19). For example, S100B and S100A12 interact with the receptor for advanced glycation end-products (RAGE; Ref. 18). To evaluate whether S100A1 affects Ca2+ channel currents through a plasma membrane receptor-mediated cascade we applied S100A1 intracellularly via the patch pipette. If S100A1 binding to a cell surface receptor is required to modulate Cav1, then intracellular dialysis with S100A1 should have no effect on the Ca2+ current. For the following study, we preferred the use of Ba2+ (1 mM) as a charge carrier instead of Ca2+ to increase the stability of the Ca2+ channel current recordings (3). When Ba2+ replaces Ca2+ the I-V plot is left shifted in the voltage axis (3, 7, 25). In our case this shift was ∼10 mV, so that the maximum inward current carried by Ca2+ channels occurred at −10 mV. We first assessed changes in barium current (IBa) amplitude during repetitive depolarizing pulses from a holding potential of −100 mV to a test potential of −10 mV, applied 10 s apart. Recordings started 3 min after the breakthrough into the whole cell configuration. We systematically use this time to allow equilibration of the internal solution within the cell. As seen in Fig. 9D, this time window allows significant diffusion of S100A1 into the cell, and, in addition, this method allowed us to address the effects of S100A1 using individual neurons as their own controls (see Supplemental Fig. 2). Figure 9A shows a representative family of 20 overlapped IBa traces obtained with this protocol in a control neuron dialyzed with the standard internal solution (see materials and methods). The comparison of the first trace with the last trace, obtained within a time window of 180-s duration, illustrates the stability of the IBa recordings for control neurons. Figure 9C shows pooled data for control neurons (n = 8). In this figure IBa amplitude for each trace was normalized to the amplitude of the first trace obtained at time 0. The amplitude of IBa, recorded in this manner, was minimally reduced (<5%) over the time course of a typical experiment, indicating a minimal or absent current run-down or run-up.
Fig. 9.
Intracellular dialysis with S100A1, via patch pipette, enhances whole cell Ca2+ currents. A and B: representative superimposed Ca2+ channel current traces, with Ba2+ as charge carrier (IBa) (1 mM), from a neuron dialyzed with the control internal solution (A) and from another neuron dialyzed with internal solution containing 10 μM S100A1 (B). A total of 20 current traces were elicited with the voltage-clamp protocol illustrated at top and delivered every 10 s. Next to the current traces are expanded time views of the outlined region of current at the end of the test pulse. The first and last traces are shown as dark lines. In control neurons step and tail current amplitudes of the first and last current traces are similar (A); however, in S100A1-dialyzed neurons there is marked difference in amplitude between the first and last traces (dark lines, B). C: time course of the action of intracellular dialysis of S100A1 on peak Ca2+ channel current. Peak current amplitude (IBa) was normalized to the current amplitude obtained at the start of acquisition (IBa at 0 s). Con, control neurons (n = 8); S100A1, S100A1-dialyzed neurons (n = 12). D: transmitted light (a, c) and confocal (b, d) images of a 24-h cultured SCG neuron before (a, b) and 3 min after (c, d) breakthrough into the whole cell configuration and dialysis with S100A1-Alexa 488. Continuous green lines in b and d show fluorescence profile intensities of images taken at the position indicated by dashed lines. Vertical scale bar, fluorescence intensity (500 arbitrary units); horizontal scale bar, 10 μm.
We then tested the effect of S100A1 on the time course of IBa amplitude. One striking distinction was that intracellular dialysis of S100A1 via the patch pipette induced a marked increase of the whole cell IBa amplitude. Figure 9B shows a representative family of 20 overlapped traces from a neuron in which S100A1 (10 μM) was included in the standard internal solution. The comparison of the first trace with the last trace, obtained at a time window of 180 s apart, illustrates the enhancement of IBa. Figure 9C shows pooled data for S100A1-dialyzed neurons (n = 12). Intracellular dialysis of S100A1 significantly enhanced IBa by >10% in all neurons tested, with a mean enhancement of 23 ± 6% (P < 0.05 vs. control). Therefore, judging by the similarity of the effects of S100A1 on Ca2+ current when added either extracellularly or intracellularly we conclude that S100A1-mediated enhancement of whole cell Ca2+ current does not require the activation of an extracellular plasma membrane receptor. In another series of experiments we added a L-type Ca2+ channel blocker to the extracellular solution and measured the amplitude of Ca2+ current in S100A1-dialyzed neurons. The extracellular preapplication of nifedipine (5 μM) to the recording solution of S100A1-dialyzed neurons prevented the increase in the Ca2+ current (see Supplemental Fig. S1). In the presence of nifedipine, six of eight S100A1-dialyzed neurons showed no increase of Ca2+ channel current density. Additionally, S100A1-treated neurons showed no changes in kinetics or voltage dependence of activation in the presence of nifedipine. These results further suggest that L-type (Cav1) channels are the major target for modulation by extracellular S100A1 in SCG neurons.
PKA Inhibition Occludes Effect of S100A1
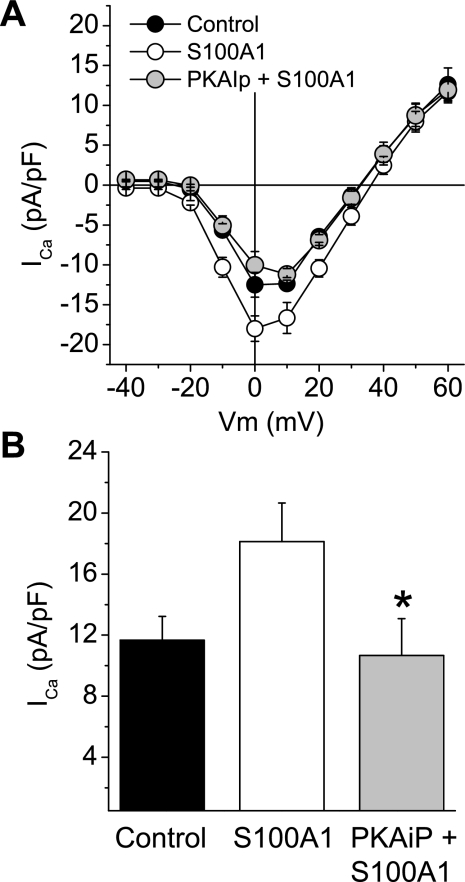
We next asked which intracellular signaling mechanism(s) may underlie the enhancement of the L-type Ca2+ current. The preceding study suggested that S100A1 does not require a membrane receptor to augment Ca2+ channel currents. Does intracellular S100A1 bind to an effector molecule and indirectly modulate the activity of Ca2+ channels? Or does S100A1 bind to and directly interact with Cav channels, thereby altering their contribution to Ca2+ current? In different cell types Cav1 currents are often augmented by phosphorylation (14, 17, 38). The α1-subunits of both skeletal and cardiac Cav1 channels possess sites for phosphorylation by cAMP-dependent PKA (16, 71). PKA modulates Cav1 channel activation and inactivation, and has been implicated in the augmentation of Cav1 channels (17). In addition, in cultured cardiac myocytes Cav1 channel currents are enhanced by S100A1 in a PKA-dependent manner (63). These observations and previous findings led us to the hypothesis that PKA activity is required for the S100A1-induced increase of Cav1 currents. To test this hypothesis, SCG neurons were preincubated for 1 h with a specific and cell membrane-permeant PKA inhibitor [14-22 amide (PKAiP), PKA inhibitor; 5 μM] and then S100A1 (10 μM) was added to the culture medium for 12–18 h. The preincubation with the PKA inhibitor prevented the whole cell Ca2+ current augmentation mediated by S100A1 (Fig. 10A). Average peak inward current density values (evaluated at 0 mV from I-V relationships) for PKAiP-preincubated and S100A1-treated neurons were 10.6 ± 2.4 pA/pF (n = 12) versus 18.1 ± 2.5 pA/pF observed in S100A1-treated neurons (n = 12) (P < 0.05, Fig. 10B). A similar result was observed in experiments in which neurons were preincubated with the inhibitory peptide but S100A1 was added via the patch pipette (data not shown). The above results indicate that exogenous S100A1 enhances neuronal Cav1 channels via a PKA-dependent mechanism.
Fig. 10.
Cell-permeant PKA inhibitory peptide 14–22 amide (PKAiP) occludes Ca2+ current enhancement in S100A1-treated neurons. A: average I-Vstep relationships for control, S100A1-treated, and PKAiP-preincubated and S100A1-treated neurons. B: summary of effect of PKAiP on maximum inward Ca2+ current (ICa) of S100A1-treated neurons. Peak Ca2+ current density in S100A1-treated neurons was 18.1 ± 2.5 pA/pF vs. 10.6 ± 2.4 pA/pF for PKAiP and S100A1-treated neurons (*P < 0.05, n = 12/group).
S100A1 Directly Interacts with PKA
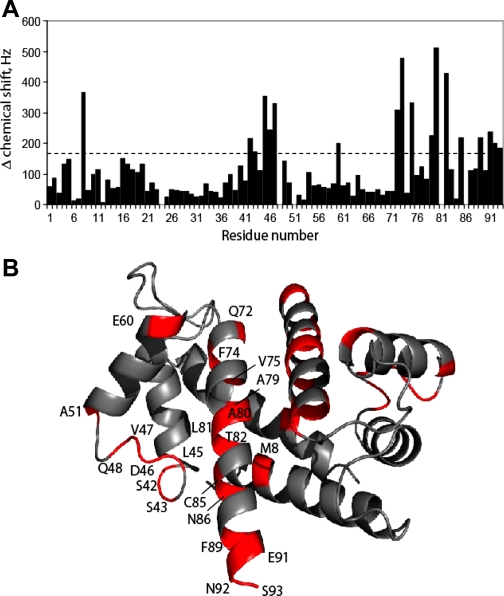
To test whether S100A1 could bind directly to PKA, a peptide derived from the cAMP regulatory subunit of PKA type IIβ (SERLKVVDVIGTK) was slowly titrated into Ca2+-loaded, 15N-labeled rat S100A1 and an HSQC spectra of S100A1 was collected. This titration was continued until the addition of more peptide no longer produced chemical shift changes in the S100A1 HSQC spectra, at which point the complex was considered saturated. As shown in Fig. 11A, several S100A1 residues shift substantially (>170 Hz) on the addition of this PKA peptide, while other residues do not. Residues that experience the most dramatic chemical shift perturbations are generally located in the hinge region and helix 4 of S100A1. These residues include Ser42, Ser43, Leu45, Asp46, Val47, Glu60, Gln72, Glu73, Val75, Ala79, Ala80, Thr82, Cys85, and Phe89, which are close together in 3D space (Fig. 11B) and comprise a large part of the well-characterized calcium-dependent hydrophobic protein binding cleft of S100A1 (61, 78, 79). In the absence of Ca2+, addition of large amounts of the PKA peptide resulted in no chemical shift perturbations. Together, these data indicate that S100A1 can bind to a region of PKA regulatory subunit in a Ca2+-dependent manner, and that this binding event is mediated via the previously characterized hydrophobic pocket of S100A1, as seen in other systems (49, 61, 64, 79).
Fig. 11.
S100A1 binds directly to PKA. A: chemical shift perturbations are illustrated for Ca2+-S100A1 on binding the PKA regulatory subunit peptide. B: chemical shift changes mapped on the Ca2+-S100A1 structure. Regions of Ca2+-S100A1 that have large chemical shift, defined as Δδ > 170 Hz, are colored in red. The majority of these residues are located in the hinge region (residues 40–50) and helix 4 (residues 72–89). These regions are close together in three-dimensional space and comprise a large part of the hydrophobic protein binding cleft of Ca2+-bound S100A1.
S100A1 Enhances Ca2+ Transients in SCG Neurons
S100A1 has been shown to participate in Ca2+ homeostasis and intracellular Ca2+ release in cardiac muscle cells (55, 56), and our group has recently reported (61) modulatory effects of S100A1 on AP-induced Ca2+ transients via interaction of S100A1 with Ca2+-release channels in mammalian skeletal muscle cells. Given the role of S100A1 in regulating Ca2+ signaling in other cell types, we sought to address the functional significance of the Ca2+ influx enhancement induced by S100A1. First, we evaluated the effect of S100A1 on resting Ca2+ levels in SCG neurons. We compared indo-1 ratio values of control neurons to those of neurons exposed to extracellular S100A1 (10 μM) for 24 h. No significant changes in resting indo-1 ratio values (control 1.106 ± 0.11 vs. S100A1-treated 1.105 ± 0.08; P > 0.05, n = 25 neurons per each group) were detected (data not shown). This result indicates that S100A1 did not modify intracellular resting Ca2+ levels.
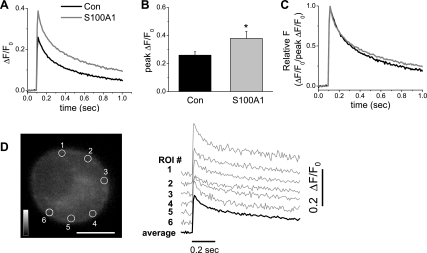
In mammalian SCG neurons a depolarization-evoked Ca2+ transient is mostly the result of Ca2+ influx via voltage-dependent Ca2+ channels, with little if any contribution from Ca2+-induced Ca2+ release (51, 72). Because S100A1 enhanced Ca2+ current in voltage-clamped SCG neurons we next evaluated the effect of S100A1 on AP-induced Ca2+ transients. Neurons were loaded with fluo-4 AM, a nonratiometric Ca2+-sensitive dye, and the amplitude and temporal properties of Ca2+ transients initiated by a single AP were monitored by ultrahigh-speed confocal microscopy. Figure 12A illustrates the average time course of AP-induced Ca2+ transients recorded at the periphery of both control and S100A1-treated neurons. The mean peak amplitude of the peripheral ΔF/F0 signals in control neurons was 0.25 ± 0.02 (n = 14). In S100A1-exposed neurons, the mean ΔF/F0 amplitude at the peak of the Ca2+ transient was 0.37 ± 0.04 (n = 14). The extracellular addition of S100A1 to the medium thus induced a significant increase in the mean peak amplitude of the peripheral ΔF/F0 signals elicited by a single AP (P < 0.05; Fig. 12B). S100A1 induced no kinetic modification of the rising phase of the AP-induced Ca2+ transient and only a slight, not statistically significant reduction was observed in the rate of the decaying phase of the Ca2+ transient (Fig. 12C). The above results indicate that S100A1, by amplifying Ca2+ entry, increases the amplitude of AP-induced Ca2+ transients.
Fig. 12.
S100A1 amplifies Ca2+ transients evoked by single action potentials. Series of successive x-y confocal fluorescence images were recorded at high speed (108 fps) in cultured rat SCG neurons loaded with fluo-4 AM. A single Ca2+ transient was initiated by a 2-ms duration field stimulus applied 100 ms after the start of image acquisition. A: average time course of action potential-induced Ca2+ transients for control and S100A1-treated neurons. B: summary of effects of S100A1 on peak change in fluorescence over resting steady-state fluorescence (ΔF/F0) values. Extracellular addition of S100A1 to the medium induced a significant increase in the mean peak amplitude of the peripheral ΔF/F0 signals elicited by a single action potential (*P < 0.05; n = 14). C: action potential-evoked Ca2+ transients were normalized to peak ΔF/F0 values to compare the temporal properties of the Ca2+ transient shown in A. D: confocal x–y image of a fluo-4 AM-loaded SCG neuron; scale bar, 10 μm. ΔF/F0 time courses shown in A and B were calculated as the average (dark trace) of small circular areas selected at 6 positions within the neuron. The individual ΔF/F0 transients (gray traces) recorded from the 6 peripherally located ROI (circles) are displaced vertically for display.
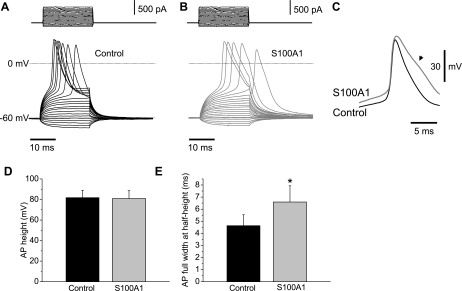
S100A1 Modulates Action Potential Duration
Changes in intracellular Ca2+ induced by S100A1, via an enhanced Ca2+ influx, could also affect neuronal excitability, in particular the AP. To characterize the action of S100A1 on SCG excitability, we evaluated passive and active membrane potential properties of 5-day-old cultured S100A1-dialyzed and control neurons. SCG neurons from 1- to 2-day-old cultures exhibit repetitive firing, whereas phasic firing patterns predominate in 5-day-old cultured SCG neurons (31). Figure 13, A and B, shows membrane potential recordings in response to subthreshold and suprathreshold current-clamp steps from control and S100A1-treated neurons. Resting membrane potential and AP height were unchanged between control and S100A1-dialyzed neurons [control neurons: resting membrane potential −61 ± 5.0 mV, AP height 81 ± 7.0 mV (n = 12); S100A1-treated neurons: resting membrane potential −60 ± 5.0 mV, AP height 80 ± 7.6 mV (n = 12); Fig. 13D] However, S100A1 induced a significant increase in the AP full duration at half-peak [control neurons: 4.6 ± 0.8 ms (n = 12); S100A1-treated neurons: 6.5 ± 1.3 ms (n = 12); P < 0.05, Fig. 13, C and E]. Given the essential role of APs in the release of neurotransmitters, our results suggest that S100A1 may increase sympathetic output at the axon terminals.
Fig. 13.
S100A1 prolongs action potential (AP) duration. Representative membrane potential recordings in response to 20-ms subthreshold and suprathreshold current-clamp steps from control (A) and S100A1-treated (B) neurons. C: superimposed AP recordings from a control (dark traces) and S100A1-treated (gray traces) neuron. Note the prolonged AP duration in the S100A1-treated neuron (arrow). D and E: summary of the effects of S100A1 on AP height (D) and full width at half-height (E) compared with control neurons. S100A1 induced a significant increase in AP full width at half-height [control 4.6 ± 0.8 ms (n = 12) vs. S100A1 6.5 ± 1.3 ms (n = 12); *P < 0.05].
DISCUSSION
The Ca2+ binding protein S100A1 displays a high expression level in cardiomyocytes and is considered an important regulator of heart function (55, 56). Compromised or damaged cardiomyocytes secrete S100A1 during ischemic periods (9, 43). It has been reported that exogenous S100A1 enhances Ca2+ entry in cultured cardiomyocytes (63). In this manner, S100A1 may amplify Ca2+ signals, and hence contractility of nonischemic neighbor areas, and function as a signal molecule for adaptative modifications during and after an ischemic episode. Although the effects of exogenous S100A1 have been documented in cardiac cells, it is unclear whether extracellular S100A1 exerts effects on other tissue types (i.e., blood vessels from local cardiac circulation and nerves), which may also be involved in regulatory and homeostatic responses. This work was aimed at investigating the effects of exogenous S100A1 on Ca2+ signals and electrical properties of SCG neurons, a neuronal population whose nerve projections innervate the heart.
Our data indicate that 1) no endogenous S100A1 is expressed in principal SCG neurons; 2) cultured SCG neurons take up S100A1 when it is present in the extracellular media; 3) inside the cell S100A1 localizes in a punctate pattern throughout the cytoplasm but is excluded from the nuclei; 4) both receptor-mediated and non-receptor-mediated endocytosis are involved in S100A1 internalization in SCG neurons; 5) axonal projections are capable of uptake and transport of S100A1 toward the neuronal somas via retrograde transport; 6) exogenous S100A1 enhances voltage-dependent Cav1 currents in a PKA-dependent manner, which results in amplified Ca2+ entry and augmented Ca2+ transients; and 7) exogenous S100A1, via this increased Ca2+ influx, produces prolonged APs in cultured SCG neurons.
S100A1 is preferentially abundant in the heart, although the protein is also found in lower amounts in skeletal muscle, brain, and kidney (40, 41, 43). Predominant cardiac expression for S100A1 is also seen in several animal models such as mouse (43) and rat (41), recapitulating the human S100A1 expression profile (56). Our data show no detection of endogenous S100A1 in SCG neurons, supporting previous findings by others (15) and indicating a certain degree of cell specificity for S100A1.
Different S100 members are released or secreted into the extracellular space and exert trophic or proapoptotic effects (19). S100A2 and S100A7 act as chemoattractants for leukocytes (46, 37). An S100A8/S100A9 complex and S100A12 modulate the proliferation of certain target cells and regulate the activation state of macrophages/microglia and other inflammatory cells (22, 34, 57, 81). S100B, the predominant S100 member of central and peripheral sensory neurons, as well as glial cells, is released to the extracellular space after brain injury and activates neurotrophic and survival signaling pathways (1, 19, 45, 66, 75). The extracellular release of S100A1 into the extracellular space occurs during acute myocardial ischemia (9). In humans, a few hours after ischemic myocardial damage, S100A1 appears in the serum (56). A S100A1 concentration of ∼1–2 μM was measured in plasma from patients with acute coronary symptoms (43, 74). The local S100A1 concentration during acute myocardial ischemia is unknown; however, it is possible that locally released S100A1 may reach much higher concentrations (63), similar to that used in the present study. Our data showing S100A1 uptake by neuronal projections and translocation from distal axons to cell bodies suggest the hypothesis that S100A1 released from ventricular myocytes during acute ischemic episodes may exert remote modulatory actions on innervating sympathetic neurons.
Our results using endocytosic and organelle markers suggest that both non-receptor- and receptor-mediated endocytosis are involved in the internalization of S100A1. They also suggest that exogenous S100A1 was internalized and delivered to early and late endosomes, Golgi apparatus, and lysosomes. In this regard, it is possible that much of the internalized S100A1 ended up trapped in the organelles; however, the fact that S100A1 colocalized with dextran, a marker of fluid-phase endocytosis, suggests that S100A1 can enter the cytosol directly from the cell surface, likely through macropinocytosis from plasma membrane lipid-rich domains and slow leakage into the cytosol from the macropinosomes (70, 77). However, the exact mechanism of internalization remains to be elucidated.
Some S100 members interact with cell surface receptors that transduce their effects (19). A plasma membrane target for S100B and S100A12, RAGE, has been identified on inflammatory and neural cells (18, 34). S100A4-induced signaling depends on interactions with heparan sulfate proteoglycans at the cell surface of hippocampal neurons (44). In our study, the observation that S100A1 enhanced Ca2+ entry when added intracellularly, via the patch pipette to bypass any potential membrane receptor-mediated cascade, suggests that no membrane receptor was required for this effect.
Within cells, S100 proteins are associated with multiple targets that regulate motility, transcription factors, Ca2+ homeostasis, and cell proliferation and differentiation (19). In both cardiac and skeletal muscle cells, S100A1 was shown to directly interact with the ryanodine receptor (56, 61, 79). In cardiomyocytes S100A1 also interacts with sarcoplasmic reticulum Ca2+-ATPase/phospholamban complex, titin, and the mitochondrial F1-ATP synthase in complex V of the respiratory chain (56).
Interestingly, in this work we find that S100A1 markedly enhanced Ca2+ current density without changing the voltage dependence for activation. In addition we also find that S100A1 modified the kinetics of Ca2+ current inactivation. The use of specific channel blockers allowed us to identify Cav1 channels as the primary target for S100A1 modulation. As far as we know, in SCG neurons Cav1 currents are not augmented by natural neurotransmitters or neuropeptides. Indeed, the predominant effect of neurotransmitters/neuropeptides on Cav1 channels is inhibitory and occurs (in most cases) via G protein-coupled receptors (33, 38). On the other hand, in other cell types Cav1 currents are often augmented by phosphorylation. For example, in both cardiac and skeletal muscle, phosphorylation via cAMP-dependent PKA has been implicated in the augmentation of Cav1 channel currents (17). The α-subunit of Cav1 channels has PKA phosphorylation sites (14, 16, 71). Here we show that the preincubation of neurons with a membrane-permeant PKA inhibitor prevented the enhancement of Cav1 current observed in S100A1-treated neurons. This result indicates that Cav1 channel enhancement induced by S100A1 depends on PKA activation. In cardiomyocytes a similar PKA-dependent mechanism of Cav1 channel modulation by S100A1 has been reported (63). When added to the extracellular media S100A1 enhanced Ca2+ entry, resulting in elevated cytosolic Ca2+ concentrations and enhanced Ca2+-induced Ca2+ release via activation of PKA. Reppel et al. (63) concluded that S100A1 uptake resulted in an increment of PKA activity via a possible direct interaction between PKA and S100A1, but without increasing cAMP levels, suggesting the lack of a receptor-mediated effect. It is possible that cardiac and neuronal Cav1 Ca2+ channels share a similar mechanism for modulation by S100A1. In this scenario, Cav1 Ca2+ channel modulation by S100A1 might occur via an indirect mechanism that uses PKA. Our results of NMR chemical shift perturbation of Ca2+-S100A1 in the presence of a peptide from the regulatory subunit of PKA verifies that S100A1 directly interacts with PKA, and that this interaction likely occurs in the hydrophobic binding pocket of Ca2+-S100A1, as seen in other S100 proteins (50, 61, 64, 79). Alternatively, more complex protein-protein interactions between S100A1-PKA complex and Cav1 α-subunit cannot be ruled out. The finding that S100A1 increased Ca2+ current density within 5 min after S100A1 dialysis via the patch pipette suggests a direct action of S100A1 on signaling pathways involved in channel modulation or trafficking mechanisms rather than upregulation of gene expression. Possible mechanisms to account for S100A1's effect on neuronal Cav1 channels could be 1) an increment of the number of functional channels, via the recruitment of previously inserted silent channels that become active (17), 2) an increment of open probability or single-channel conductance, or 3) alternatively through a rapid recruitment of new Cav1 subunits to the plasma membrane. Finally, we find that S100A1 also modified the inactivation kinetics of the whole cell Ca2+ current. This, like all other effects of S100A1, was prevented by preapplication of nifedipine to S100A1-dialyzed neurons, which suggests that Cav1 channels are the main target of modulation by S100A1. Cav1 channels inactivate by a dual mechanism: voltage dependent, observable during prolonged depolarization, and calcium dependent, caused by Ca2+ ions entering the cell during channel opening (8, 10, 17). Several authors have reported the presence of two kinetic components in the time course of inactivation of Cav1 channels: a fast phase, corresponding to Ca2+-dependent inactivation, and a slow phase, corresponding to voltage-dependent inactivation (23, 26, 39). Our results suggest that S100A1 is slowing Ca2+-dependent inactivation and accelerating the voltage-dependent inactivation mechanism. Further studies are needed to address this issue.
Ca2+ is essential for neuronal function; in particular, it is required to trigger transmitter release when an AP arrives at the axon terminal (5, 42). Changes in Ca2+ entry modify AP duration (52). Our results showing enhanced somatic Ca2+ entry, larger cytosolic Ca2+ transients, and prolongation of AP duration indicate that S100A1 may lead to an increase of transmitter release at sympathetic axon terminals, which in turn would result in an increase in heart rate and contractility of the myocardium. The preservation of cardiac contractility in the damaged heart through paracrine S100A1's actions on the sympathetic nervous system may function as an adaptive mechanism protecting against cardiac failure. It is clear that an important goal of future studies will be to resolve the in vivo significance of extracellular S100A1 protein in the context of myocardial damage in more detail.
GRANTS
This work was supported by National Institutes of Health Grants R01-NS-042839, R01-AR-55099, and R01-GM-58888.
Supplementary Material
ACKNOWLEDGMENTS
The authors thank Gabe Sinclaire and Jeff Michael for design and construction of custom mechanical and electronic apparatus.
Footnotes
The online version of this manuscript contains supplemental material.
REFERENCES
- 1.Adami C, Sorci G, Blasi E, Agneletti AL, Bistoni F, Donato R. S100B expression in and effects on microglia. Glia 33: 131–142, 2001 [PubMed] [Google Scholar]
- 2.Bax A, Ikura M, Kay LE, Barbato G, Spera S. Multidimensional triple resonance MR spectroscopy of isotopically uniformly enriched proteins: a powerful new strategy for structure determination. Ciba Found Symp 161: 108–119, 1991 [DOI] [PubMed] [Google Scholar]
- 3.Bean BP. Whole-cell recording of calcium channel currents. Methods Enzymol 207: 181–193, 1992 [DOI] [PubMed] [Google Scholar]
- 4.Benarroch E, Freeman R, Kaufmann H. Autonomic nervous system. In: Textbook of Clinical Neurology, edited by Goetz CG. Philadelphia, PA: Saunders, 2007 [Google Scholar]
- 5.Berridge MJ. Neuronal calcium signaling. Neuron 21: 13–26, 1998 [DOI] [PubMed] [Google Scholar]
- 6.Bolte S, Cordelières FP. A guided tour into subcellular colocalization analysis in light microscopy. J Microsc 224: 213–232, 2006 [DOI] [PubMed] [Google Scholar]
- 7.Bourinet E, Zamponi GW, Stea A, Soong TW, Lewis BA, Jones LP, Yue DT, Snutch TP. The alpha 1E calcium channel exhibits permeation properties similar to low-voltage-activated calcium channels. J Neurosci 16: 4983–4993, 1996 [DOI] [PMC free article] [PubMed] [Google Scholar]
- 8.Brehm P, Eckert R. Calcium entry leads to inactivation of calcium channel in Paramecium. Science 202: 1203–1206, 1978 [DOI] [PubMed] [Google Scholar]
- 9.Brett W, Mandinova A, Remppis A, Sauder U, Rüter F, Heizmann CW, Aebi U, Zerkowski HR. Translocation of S100A11 calcium binding protein during heart surgery. Biochem Biophys Res Commun 284: 698–703, 2001 [DOI] [PubMed] [Google Scholar]
- 10.Budde T, Meuth S, Pape HC. Calcium-dependent inactivation of neuronal calcium channels. Nat Rev Neurosci 3: 873–883, 2002 [DOI] [PubMed] [Google Scholar]
- 11.Campenot RB. Local control of neurite development by nerve growth factor. Proc Natl Acad Sci USA 74: 4516–4519, 1977 [DOI] [PMC free article] [PubMed] [Google Scholar]
- 12.Campenot RB. Development of sympathetic neurons in compartmentalized cultures. Dev Biol 93: 1–12, 1982 [DOI] [PubMed] [Google Scholar]
- 13.Campenot B, Lund K, Senger DL. Delivery of newly synthesized tubulin to rapidly growing distal axons of sympathetic neurons in compartmented cultures. J Cell Biol 135: 701–709, 1996 [DOI] [PMC free article] [PubMed] [Google Scholar]
- 14.Catterall WA. Structure and regulation of voltage-gated Ca2+ channels. Annu Rev Cell Dev Biol 16: 521–555, 2000 [DOI] [PubMed] [Google Scholar]
- 15.Cocchia D, Michetti F. S-100 antigen in satellite cells of the adrenal medulla and the superior cervical ganglion of the rat. An immunochemical and immunocytochemical study. Cell Tissue Res 215: 103–112, 1981 [DOI] [PubMed] [Google Scholar]
- 16.De Jongh KS, Murphy BJ, Colvin AA, Hell JW, Takahashi M, Catterall WA. Specific phosphorylation of a site in the full-length form of the α1 subunit of the cardiac L-type calcium channel by cAMP-dependent protein kinase. Biochemistry 35: 10392–10402, 1996 [DOI] [PubMed] [Google Scholar]
- 17.Dolphin AC. L-type calcium channel modulation. Adv Second Messenger Phosphoprotein Res 33: 153–177, 1999 [DOI] [PubMed] [Google Scholar]
- 18.Donato R. RAGE: a single receptor for several ligands and different cellular responses: the case of certain S100 proteins. Curr Mol Med 7: 711–724, 2007 [DOI] [PubMed] [Google Scholar]
- 19.Donato R. S100: a multigenic family of calcium-modulated proteins of the EF-hand type with intracellular and extracellular functional roles. Int J Biochem Cell Biol 33: 637–668, 2001 [DOI] [PubMed] [Google Scholar]
- 20.Elfvin LG, Lindh B, Hökfelt T. The chemical neuroanatomy of sympathetic ganglia. Annu Rev Neurosci 16: 471–507, 1993 [DOI] [PubMed] [Google Scholar]
- 21.Ellinger I, Klapper H, Fuchs R. Fluid-phase marker transport in rat liver: free-flow electrophoresis separates distinct endosome subpopulations. Electrophoresis 19: 1154–1161, 1998 [DOI] [PubMed] [Google Scholar]
- 22.Eue I, Pietz B, Storck J, Klempt M, Sorg C. Transendothelial migration of 27E10+ human monocytes. Int Immunol 12: 1593–1604, 2000 [DOI] [PubMed] [Google Scholar]
- 23.Ganitkevich V, Shuba MF, Smirnov SV. Potential-dependent calcium inward current in a single isolated smooth muscle cell of the guinea-pig taenia caeci. J Physiol 380: 1–16, 1986 [DOI] [PMC free article] [PubMed] [Google Scholar]
- 24.García DE, Li B, García-Ferreiro RE, Hernández-Ochoa EO, Yan K, Gautam N, Catterall WA, Mackie K, Hille B. G-protein beta-subunit specificity in the fast membrane-delimited inhibition of Ca2+ channels. J Neurosci 18: 9163–9170, 1998 [DOI] [PMC free article] [PubMed] [Google Scholar]
- 25.García-Ferreiro RE, Hernández-Ochoa EO, García DE. Modulation of N-type Ca2+ channel current kinetics by PMA in rat sympathetic neurons. Pflügers Arch 442: 848–858, 2001 [DOI] [PubMed] [Google Scholar]
- 26.Giannattasio B, Jones SW, Scarpa A. Calcium currents in the A7r5 smooth muscle-derived cell line. Calcium-dependent and voltage-dependent inactivation. J Gen Physiol 98: 987–1003, 1991 [DOI] [PMC free article] [PubMed] [Google Scholar]
- 27.Glebova NO, Ginty DD. Growth and survival signals controlling sympathetic nervous system development. Annu Rev Neurosci 28: 191–222, 2005 [DOI] [PubMed] [Google Scholar]
- 28.Granseth B, Odermatt B, Royle SJ, Lagnado L. Clathrin-mediated endocytosis is the dominant mechanism of vesicle retrieval at hippocampal synapses. Neuron 51: 773–786, 2006 [DOI] [PubMed] [Google Scholar]
- 29.Hamill OP, Marty A, Neher E, Sakmann B, Sigworth FJ. Improved patch-clamp techniques for high-resolution current recording from cells and cell-free membrane patches. Pflügers Arch 391: 85–100, 1981 [DOI] [PubMed] [Google Scholar]
- 30.Hamill RW, Shapiro RE. Peripheral autonomic nervous system. In: Primer on the Autonomic Nervous System, edited by Robertson D. San Diego, CA: Elsevier Academic, 2004 [Google Scholar]
- 31.Hernández-Ochoa EO, Contreras M, Cseresnyés Z, Schneider MF. Ca2+ signal summation and NFATc1 nuclear translocation in sympathetic ganglion neurons during repetitive action potentials. Cell Calcium 41: 559–571, 2007 [DOI] [PMC free article] [PubMed] [Google Scholar]
- 32.Hill CE, Phillips JK, Sandow SL. Development of peripheral autonomic synapses: neurotransmitter receptors, neuroeffector associations and neural influences. Clin Exp Pharmacol Physiol 26: 581–590, 1999 [DOI] [PubMed] [Google Scholar]
- 33.Hille B. Modulation of ion-channel function by G-protein-coupled receptors. Trends Neurosci 17: 531–536, 1994 [DOI] [PubMed] [Google Scholar]
- 34.Hofmann MA, Drury S, Fu C, Qu W, Taguchi A, Lu Y, Avila C, Kambham N, Bierhaus A, Nawroth P, Neurath MF, Slattery T, Beach D, McClary J, Nagashima M, Morser J, Stern D, Schmidt AM. RAGE mediates a novel proinflammatory axis: a central cell surface receptor for S100/calgranulin polypeptides. Cell 97: 889–901, 1999 [DOI] [PubMed] [Google Scholar]
- 35.Holt M, Cooke A, Wu MM, Lagnado L. Bulk membrane retrieval in the synaptic terminal of retinal bipolar cells. J Neurosci 23: 1329–1339, 2003 [DOI] [PMC free article] [PubMed] [Google Scholar]
- 36.Jänig W. Spinal cord reflex organization of sympathetic systems. Prog Brain Res 107: 43–77, 1996 [DOI] [PubMed] [Google Scholar]
- 37.Jinquan T, Vorum H, Larsen CG, Madsen P, Rasmussen HH, Gesser B, Etzerodt M, Honoré B, Celis JE, Thestrup-Pedersen K. Psoriasin: a novel chemotactic protein. J Invest Dermatol 107: 5–10, 1996 [DOI] [PubMed] [Google Scholar]
- 38.Jones SW, Elmslie KS. Transmitter modulation of neuronal calcium channels. J Membr Biol 155: 1–10, 1997 [DOI] [PubMed] [Google Scholar]
- 39.Jones SW, Marks TN. Calcium currents in bullfrog sympathetic neurons. II. Inactivation. J Gen Physiol 94: 169–182, 1989 [DOI] [PMC free article] [PubMed] [Google Scholar]
- 40.Kato K, Kimura S. S100a0 (alpha alpha) protein is mainly located in the heart and striated muscles. Biochim Biophys Acta 842: 146–150, 1985 [DOI] [PubMed] [Google Scholar]
- 41.Kato K, Kimura S, Haimoto H, Suzuki F. S100a0 (alpha alpha) protein: distribution in muscle tissues of various animals and purification from human pectoral muscle. J Neurochem 46: 1555–1560, 1986 [DOI] [PubMed] [Google Scholar]
- 42.Katz B, Miledi R. Ionic requirements of synaptic transmitter release. Nature 215: 651, 1967 [DOI] [PubMed] [Google Scholar]
- 43.Kiewitz R, Acklin C, Minder E, Huber PR, Schäfer BW, Heizmann CW. S100A1, a new marker for acute myocardial ischemia. Biochem Biophys Res Commun 274: 865–871, 2000 [DOI] [PubMed] [Google Scholar]
- 44.Kiryushko D, Novitskaya V, Soroka V, Klingelhofer J, Lukanidin E, Berezin V, Bock E. Molecular mechanisms of Ca2+ signaling in neurons induced by the S100A4 protein. Mol Cell Biol 26: 3625–3638, 2006 [DOI] [PMC free article] [PubMed] [Google Scholar]
- 45.Kligman D, Marshak DR. Purification and characterization of a neurite extension factor from bovine brain. Proc Natl Acad Sci USA 82: 7136–7139, 1985 [DOI] [PMC free article] [PubMed] [Google Scholar]
- 46.Komada T, Araki R, Nakatani K, Yada I, Naka M, Tanaka T. Novel specific chemotactic receptor for S100L protein on guinea pig eosinophils. Biochem Biophys Res Commun 220: 871–874, 1996 [DOI] [PubMed] [Google Scholar]
- 47.Lin Z, Harris C, Lipscombe D. The molecular identity of Ca channel alpha1-subunits expressed in rat sympathetic neurons. J Mol Neurosci 7: 257–267, 1996 [DOI] [PubMed] [Google Scholar]
- 48.Lloyd TR, Marvin WJ. Sympathetic innervation improves the contractile performance of neonatal cardiac ventricular myocytes in culture. J Mol Cell Cardiol 22: 333–342, 1990 [DOI] [PubMed] [Google Scholar]
- 49.Marenholz I, Heizmann CW, Fritz G. S100 proteins in mouse and man: from evolution to function and pathology (including an update of the nomenclature). Biochem Biophys Res Commun 322: 1111–1122, 2004 [DOI] [PubMed] [Google Scholar]
- 50.Marenholz I, Lovering RC, Heizmann CW. An update of the S100 nomenclature. Biochim Biophys Acta 1763: 1282–1283, 2006 [DOI] [PubMed] [Google Scholar]
- 51.Marsh SJ, Wanaverbecq N, Selyanko AA, Brown DA. Calcium signaling in neurons exemplified by rat sympathetic ganglion neurons. In: Molecular Basis of Calcium Action in Biology and Medicine, edited by Pochet R, Donato R, Haiech J, Heizmann C, Gerke V. Dordrecht, The Netherlands: Kluwer Academic, 2000 [Google Scholar]
- 52.McAfee DA, Yarowsky PJ. Calcium-dependent potentials in the mammalian sympathetic neurone. J Physiol 290: 507–523, 1979 [DOI] [PMC free article] [PubMed] [Google Scholar]
- 53.Mintz IM, Adams ME, Bean BP. P-type calcium channels in rat central and peripheral neurons. Neuron 9: 85–95, 1992 [DOI] [PubMed] [Google Scholar]
- 54.Moore BW. A soluble protein characteristic of the nervous system. Biochem Biophys Res Commun 19: 739–744, 1965 [DOI] [PubMed] [Google Scholar]
- 55.Most P, Bernotat J, Ehlermann P, Pleger ST, Reppel M, Börries M, Niroomand F, Pieske B, Janssen PM, Eschenhagen T, Karczewski P, Smith GL, Koch WJ, Katus HA, Remppis A. S100A1: a regulator of myocardial contractility. Proc Natl Acad Sci USA 98: 13889–13894, 2001 [DOI] [PMC free article] [PubMed] [Google Scholar]
- 56.Most P, Remppis A, Pleger ST, Katus HA, Koch WJ. S100A1: a novel inotropic regulator of cardiac performance. Transition from molecular physiology to pathophysiological relevance. Am J Physiol Regul Integr Comp Physiol 293: R568–R577, 2007 [DOI] [PubMed] [Google Scholar]
- 57.Murao S, Collart F, Huberman E. A protein complex expressed during terminal differentiation of monomyelocytic cells is an inhibitor of cell growth. Cell Growth Differ 1: 447–454, 1990 [PubMed] [Google Scholar]
- 58.Nichols BJ, Kenworthy AK, Polishchuk RS, Lodge R, Roberts TH, Hirschberg K, Phair RD, Lippincott-Schwartz J. Rapid cycling of lipid raft markers between the cell surface and Golgi complex. J Cell Biol 153: 529–541, 2001 [DOI] [PMC free article] [PubMed] [Google Scholar]
- 59.Petrecca K, Shrier A. Spatial distribution of nerve processes and beta-adrenoreceptors in the rat atrioventricular node. J Anat 192: 517–528, 1998 [DOI] [PMC free article] [PubMed] [Google Scholar]
- 60.Plummer MR, Logothetis DE, Hess P. Elementary properties and pharmacological sensitivities of calcium channels in mammalian peripheral neurons. Neuron 2: 1453–1463, 1989 [DOI] [PubMed] [Google Scholar]
- 61.Prosser BL, Wright NT, Hernandez-Ochoa EO, Varney KM, Liu Y, Olojo RO, Zimmer DB, Weber DJ, Schneider MF. S100A1 binds to the calmodulin-binding site of ryanodine receptor and modulates skeletal muscle excitation-contraction coupling. J Biol Chem 283: 5046–5057, 2008 [DOI] [PMC free article] [PubMed] [Google Scholar]
- 62.Remppis A, Most P, Löffler E, Ehlermann P, Bernotat J, Pleger S, Börries M, Reppel M, Fischer J, Koch WJ, Smith G, Katus HA. The small EF-hand Ca2+ binding protein S100A1 increases contractility and Ca2+ cycling in rat cardiac myocytes. Basic Res Cardiol 97: I56–I62, 2002 [DOI] [PubMed] [Google Scholar]
- 63.Reppel M, Sasse P, Piekorz R, Tang M, Roell W, Duan Y, Kletke A, Hescheler J, Nürnberg B, Fleischmann BK. S100A1 enhances the L-type Ca2+ current in embryonic mouse and neonatal rat ventricular cardiomyocytes. J Biol Chem 280: 36019–36028, 2005 [DOI] [PubMed] [Google Scholar]
- 64.Santamaria-Kisiel L, Rintala-Dempsey AC, Shaw GS. Calcium-dependent and -independent interactions of the S100 protein family. Biochem J 396: 201–214, 2006 [DOI] [PMC free article] [PubMed] [Google Scholar]
- 65.Schober A, Unsicker K. Growth and neurotrophic factors regulating development and maintenance of sympathetic preganglionic neurons. Int Rev Cytol 205: 37–76, 2001 [DOI] [PubMed] [Google Scholar]
- 66.Selinfreund RH, Barger SW, Pledger WJ, Van Eldik LJ. Neurotrophic protein S100beta stimulates glial cell proliferation. Proc Natl Acad Sci USA 88: 3554–3558, 1991 [DOI] [PMC free article] [PubMed] [Google Scholar]
- 67.Senger DL, Campenot RB. Rapid retrograde tyrosine phosphorylation of trkA and other proteins in rat sympathetic neurons in compartmented cultures. J Cell Biol 138: 411–421, 1997 [DOI] [PMC free article] [PubMed] [Google Scholar]
- 68.Shi H, Cui H, Alam G, Gunning WT, Nestor A, Giovannucci D, Zhang M, Ding HF. Nestin expression defines both glial and neuronal progenitors in postnatal sympathetic ganglia. J Comp Neurol 508: 867–878, 2008 [DOI] [PMC free article] [PubMed] [Google Scholar]
- 69.Shields RW. Functional anatomy of the autonomic nervous system. J Clin Neurophysiol 10: 2–13, 1993 [DOI] [PubMed] [Google Scholar]
- 70.Swanson JA, Watts C. Macropinocytosis. Trends Cell Biol 5: 424–428, 1995 [DOI] [PubMed] [Google Scholar]
- 71.Takahashi M, Seagar MJ, Jones JF, Reber BF, Catterall WA. Subunit structure of dihydropyridine-sensitive calcium channels from skeletal muscle. Proc Natl Acad Sci USA 84: 5478–5482, 1987 [DOI] [PMC free article] [PubMed] [Google Scholar]
- 72.Trouslard J, Marsh SJ, Brown DA. Calcium entry through nicotinic receptor channels and calcium channels in cultured rat superior cervical ganglion cells. J Physiol 468: 53–71, 1993 [DOI] [PMC free article] [PubMed] [Google Scholar]
- 73.Ure DR, Campenot RB. Leukemia inhibitory factor and nerve growth factor are retrogradely transported and processed by cultured rat sympathetic neurons. Dev Biol 162: 339–347, 1994 [DOI] [PubMed] [Google Scholar]
- 74.Usui A, Kato K, Sasa H, Minaguchi K, Abe T, Murase M, Tanaka M, Takeuchi E. S-100a0 protein in serum during acute myocardial infarction. Clin Chem 36: 639–641, 1990 [PubMed] [Google Scholar]
- 75.Van Eldik LJ, Christie-Pope B, Bolin LM, Shooter EM, Whetsell WO. Neurotrophic activity of S-100beta in cultures of dorsal root ganglia from embryonic chick and fetal rat. Brain Res 542: 280–285, 1991 [DOI] [PubMed] [Google Scholar]
- 76.Vida TA, Emr SD. A new vital stain for visualizing vacuolar membrane dynamics and endocytosis in yeast. J Cell Biol 128: 779–792, 1995 [DOI] [PMC free article] [PubMed] [Google Scholar]
- 77.Wadia JS, Dowdy SF. Transmembrane delivery of protein peptide drugs by TAT-mediated transduction in the treatment of cancer. Adv Drug Deliv Rev 57: 579–596, 2005 [DOI] [PubMed] [Google Scholar]
- 78.Wright NT, Varney KM, Ellis KC, Markowitz J, Gitti RK, Zimmer DB, Weber DJ. The three-dimensional solution structure of Ca2+-bound S100A1 as determined by NMR spectroscopy. J Mol Biol 353: 410–426, 2005 [DOI] [PubMed] [Google Scholar]
- 79.Wright NT, Prosser BL, Varney KM, Zimmer DB, Schneider MF, Weber DJ. S100A1 and calmodulin compete for the same binding site on ryanodine receptor. J Biol Chem 283: 26676–26683, 2008 [DOI] [PMC free article] [PubMed] [Google Scholar]
- 80.Yamashiro DJ, Maxfield FR. Acidification of endocytic compartments and the intracellular pathways of ligands and receptors. J Cell Biochem 26: 231–246, 1984 [DOI] [PubMed] [Google Scholar]
- 81.Yui S, Mikami M, Yamazaki M. Purification and characterization of the cytotoxic factor in rat peritoneal exudate cells: its identification as the calcium binding protein complex, calprotectin. J Leukoc Biol 58: 307–316, 1995 [DOI] [PubMed] [Google Scholar]
- 82.Zimmer DB, Wright Sadosky P, Weber DJ. Molecular mechanisms of S100-target protein interactions. Microsc Res Tech 60: 552–559, 2003 [DOI] [PubMed] [Google Scholar]
Associated Data
This section collects any data citations, data availability statements, or supplementary materials included in this article.


