Abstract
We present a computational framework for predicting targets of transcription factor regulation. The framework is based on the integration of a number of sources of evidence, derived from DNA sequence and gene expression data, using a weighted sum approach. Sources of evidence are prioritized based on a training set, and their relative contributions are then optimized. The performance of the proposed framework is demonstrated in the context of BCL6 target prediction. We show that this framework is able to uncover BCL6 targets reliably when biological prior information is utilized effectively, particularly in the case of sequence analysis. The framework results in a considerable gain in performance over scores in which sequence information was not incorporated. This analysis shows that with assessment of the quality and biological relevance of the data, reliable predictions can be obtained with this computational framework.
Keywords: network inference, transcription factor binding site prediction, data integration
Introduction
Recent technological and computational advances have made it possible to study biology as an information science [1]. Several high throughput measurement technologies have expanded the possibilities of molecular biology, making it possible to measure the behavior of biological systems at the molecular level for multiple genes. Equally dramatic changes have been seen in the accumulation of biological information. Currently, large amounts of information about the behavior and structure of biological systems are available in databases, making it straightforward to obtain genome sequences, metabolic networks, and other systems-level information for a variety of organisms.
While many advances have been made in organizing biological information, much information is still scattered and needs to be extracted directly from scientific publications. Recently, projects such as the Cancer Census have started to systematically collect and annotate information that is biologically relevant to a given area of study [2]. For computational biology to uncover and characterize the regulatory mechanisms in biological systems in more detail and with greater accuracy, a more effective utilization of accumulated information in the data analysis process is required. Indeed, data integration in different forms has become a major direction of research in systems biology [3,4]. Large efforts in data integration have focused on unifying and integrating the data that is stored in various databases. To effectively utilize all this data, vocabularies that are used in different databases need to be translated into a unified form. While progress has been made in this area to automate the process, there is still often a need for manual annotation, translation and interpretation of the data.
Another aspect of data integration is the development of principled computational methods for combining different sources of information to infer mechanisms of biological regulatory networks. Numerous application-specific algorithms and frameworks have been proposed. These include Bayesian frameworks [5] that allow for the incorporation of uncertainty related to the quality and the origin of the data as well as general data analysis frameworks that rely on transforming different data sources into a common representation, such as p-values [4].
Here, we present a data analysis framework that is built on biological knowledge that has been collected about the system under study. This framework uses machine learning approaches to generate predictions about the targets of a transcription factor based on existing biological knowledge and high-throughput data. We present this framework in the context of BCL6 transcription factor target prediction. The DREAM initiative has constructed a “gold standard” 200 gene set of targets and non-targets of BCL6 as part of the DREAM2 BCL6 transcriptional-target challenge [6]. We use this DREAM2 200 gene set (53 targets of BCL6 and 147 “decoys”) to quantify the performance of our approach. We demonstrate that our computational framework is able to generate highly accurate predictions when biological prior knowledge is used effectively.
Results
Using a panel of more than 300 microarrays, measured from B cells under different conditions, we propose a data analysis framework that can be used to predict targets for the transcription factor BCL6. To quantify the performance of our approach, we focus on the verified DREAM2 gene set [6]. In addition to microarray data, we also use genomic sequence information in our analysis. Other sources of information, such as gene ontologies, could easily be incorporated into this framework.
First, we performed an extensive literature review to find a set of 51 genes that have previously been verified as BCL6 targets [7–17]. These genes, denoted as the positive target set, are listed in Table 1 together with information about the origin of evidence. Out of these 51 genes, only one gene (STAT1) overlaps with the DREAM2 gene set. In addition to positive targets, we also generated a non-target gene set by selecting 94 genes from the microarray data at random. As there are more than 12000 probe sets on the array, it is expected that a random sampling will not include a significant number of target genes. As such, our training set should be relatively unbiased. These sets of 51 target and 94 non-target genes form a training set that we utilize to establish our data analysis framework.
Table 1.
Positive training set. List of verified BCL6 targets from the literature with sources. In these studies, BCL6 regulation was supported by a variety of targeted experiments, including direct binding assays and functional perturbations.
| NCBI GeneID | Gene Name (HGNC) | Reference |
|---|---|---|
| 399 | RHOH | Polo et al |
| 533 | ATP6V0B | Polo et al |
| 545 | ATR | Ranuncolo et al |
| 598 | BLC2L1 | Transfac |
| 890 | CCNA2 | Hosokawa et al |
| 894 | CCND2 | Shaffer et al |
| 941 | CD80 | Niu et al |
| 952 | CD38 | Polo et al |
| 963 | CD53 | Polo et al |
| 969 | CD69 | Shaffer et al |
| 972 | CD74 | Polo et al |
| 991 | CDC20 | Polo et al |
| 1026 | CDKN1A | Phan et al |
| 1027 | CDKN1B | Shaffer et al |
| 1111 | CHEK1 | Polo et al |
| 1161 | ERCC8 | Polo et al |
| 1642 | DDB1 | Polo et al |
| 1880 | EBI2 | Shaffer et al |
| 2208 | FCER2 | Polo et al |
| 3398 | ID2 | Shaffer et al |
| 3487 | IGFBP4 | Hosokawa et al |
| 3576 | IL8 | Toney et al |
| 3606 | IL18 | Takeda et.al |
| 3627 | CXCL10 | Shaffer et al |
| 4152 | MBD1 | Polo et al |
| 4790 | NFKB1 | Li et al |
| 5134 | PDCD2 | Baron et al |
| 6348 | CCL3 | Polo et al |
| 6772 | STAT1 | Shaffer et al |
| 6773 | STAT2 | Shaffer et al |
| 6890 | TAP1 | Polo et al |
| 6897 | TARS | Polo et al |
| 7009 | TEGT | Polo et al |
| 7157 | TP53 | Transfac |
| 7184 | HSP90B1 | Polo et al |
| 7316 | UBC | Polo et al |
| 7852 | CXCR4 | Hosokawa et al |
| 7862 | BRPF1 | Polo et al |
| 8446 | DUSP11 | Polo et al |
| 8519 | IFITM1 | Shaffer et al |
| 8556 | CDC14A | Polo et al |
| 10370 | CITED2 | Polo et al |
| 10923 | SUB1 | Polo et al |
| 10983 | CCNI | Polo et al |
| 23522 | MYST4 | Polo et al |
| 25816 | TNFAIP8 | Polo et al |
| 25963 | TMEM87A | Polo et al |
| 27095 | TRAPPC3 | Polo et al |
| 54499 | TMCO1 | Polo et al |
| 64116 | SLC39A8 | Polo et al |
Next, we derived a number of features from the various data sources. We used MotifLocator [18] and ProbTF [19] algorithms to compute the p-values and to predict the probabilities of BCL6 binding upstream of the putative target genes. By making use of the biological insights obtained from the literature review, we extracted features from gene expression data that should be biologically relevant. For example, it is known that BCL6 works mostly as a repressor [7, 16]. Thus, if the expression of BCL6 is high, it may be expected that the expression of BCL6 targets is low. Thus, we used correlation of putative target genes expression to BCL6 expression as a feature. Also perturbations of CD40 and anti-IgM are known to regulate BCL6 [16]. As BCL6 activity is downregulated, given CD40 or anti-IgM stimuli, we compute the expression ratios for CD40 and anti-IgM stimulated conditions against non-stimulated conditions within a given cell type. We also utilized a machine learning approach to predict whether a given gene is a target using support vector machines, trained with our literature derived training set. All of the used features are listed in Table 2.
Table 2.
Table of all features. First group of features includes the binding site prediction probabilities using the ProbTF algorithm [19] with four different position weight matrices (PWMs). Second group presents the binding probabilities obtained using a standard motif scan with the same PWMs. Third and fourth groups include features that are computed from gene expression data by utilizing biological insights. Fifth group shows the correlation of gene expression with BCL6 under various subsets of conditions. Final feature is the support vector machine (SVM) class prediction strength. The best feature from each group is shown in boldface. On the right, p-value for class separation is given.
| Feature | Description / details | p-value |
|---|---|---|
| ProbTF PWM A | 5kb upstream scan | 0.505000 |
| ProbTF PWM B | 5kb upstream scan | 0.029101 |
| ProbTF PWM C | 5kb upstream scan | 0.261820 |
| ProbTF PWM D | 5kb upstream scan | 0.402930 |
| ProbTF All matrices | 5kb upstream scan | 0.091943 |
| Motif scan PWM A | 5kb upstream scan | 0.131780 |
| Motif scan PWM B | 5kb upstream scan | 0.121910 |
| Motif scan PWM C | 5kb upstream scan | 0.180070 |
| Motif scan PWM D | 5kb upstream scan | 0.012267 |
| CD40 variance | Over CD40 stimulated samples | 0.902780 |
| CD40 U-statistic | Stim vs unstim U-statistic | 0.001373 |
| CD40 stim-unstim | Logratio | 0.000315 |
| CD40 (PEST_stim-PEST_unstim)<(stim-unstim) | Binary indicator | 0.067835 |
| anti-IgM variance | Over Anti-IgM stimulated samples | 0.325410 |
| anti-IgM U-statistic | Stim vs unstim U-statistic | 0.017266 |
| anti-IgM stim-unstim | Logratio | 0.010253 |
| anti-IgM (PEST_stim-PEST_unstim)<(stim-unstim) | Binary indicator | 0.142510 |
| Pearson correlation to BCL6 expression | All samples | 0.014236 |
| Pearson correlation to BCL6 expression | Cell lines only | 0.004112 |
| Pearson correlation to BCL6 expression | No pinko and biopsy samples | 0.004623 |
| SVM decision value | Classifier trained on training set | N/A |
To identify which features are the most informative we measure the degree of class separation using the constructed training set. Class separation is measured using the Mann-Whitney U-test to test whether the distributions of the two classes are separated using a given feature. As a result, a p-value for class separation is obtained for each feature. Features with the smallest p-values are selected from each group of features (see Table 2) and are used to score the target genes from the DREAM2 200 gene set. The best features are highlighted in Table 2.
We combine the best features using a weighted sum. After the features are normalized (see Methods), we optimize the weights on the training set. Marginal distributions of weights for each feature are shown in Figure 1. It should be noted that using the p-values of the features directly as weights does not give optimal results, as this approach would discard possible joint contributions of the features.
Figure 1.
Distributions for 100 weight combinations that yields the highest prediction accuracy on the training set. Marginal distributions for each feature are shown. Weights have been obtained with exhaustive search over the weight space with 0.2 steps on [0,1] interval. Features: (a) ProbTF, (b) Motif scan, (c) CD40, (d) Anti-IgM, and (e) Correlation (only cell lines). The SVM feature was excluded from the weight optimization (see Methods). The prediction accuracy of these 100 weight combinations is shown in Figure 2.
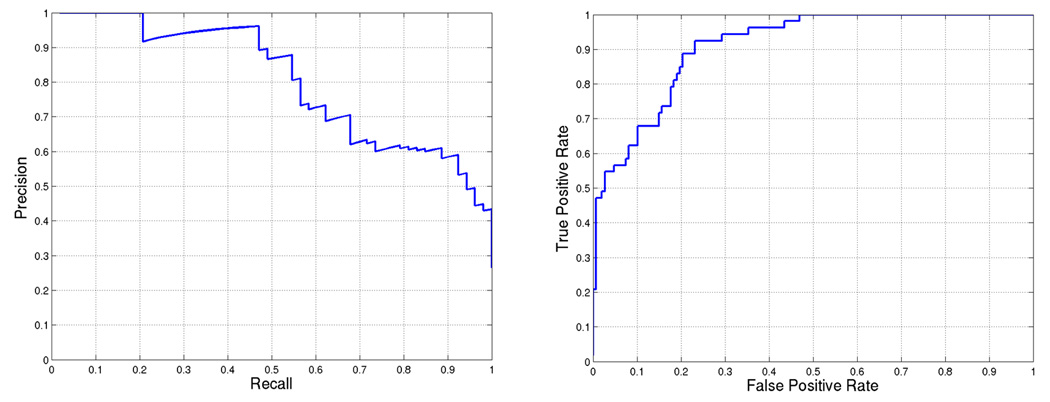
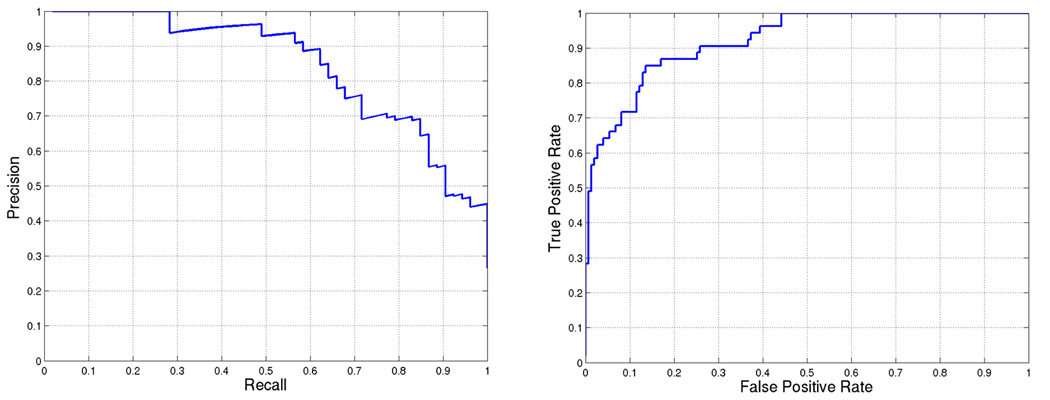
Using the best weight combination, we score each gene of the DREAM2 gene set and rank the genes based on the score. The performance of our approach is illustrated by precision-recall and receiver operating characteristic (ROC) curves in Figure 3. The area under the precision-recall curve for this prediction is 0.80. We can also observe that there is only one mis-classification among the first 25 predicted targets.
Figure 3.
BCL6 target prediction accuracy for weights = [0.0, 0.2, 0.6, 0.6, 0.8, 1.0]. First five weights correspond to (a)–(e) in Figure 1 and the last weight is used for SVM score. Area under the curve is 0.80468 and 0.91002 for (a) precision-recall and (b) ROC, respectively.
Effect of incorporating the sequence data
By examining the weights in Figure 1, it is evident that sequence based information contributed only marginally to the classification result. This indicates that our sequence scores are not very informative about class separation. If this sequence evidence is given more weight than proposed by the weight optimization, it actually lowers the prediction accuracy.
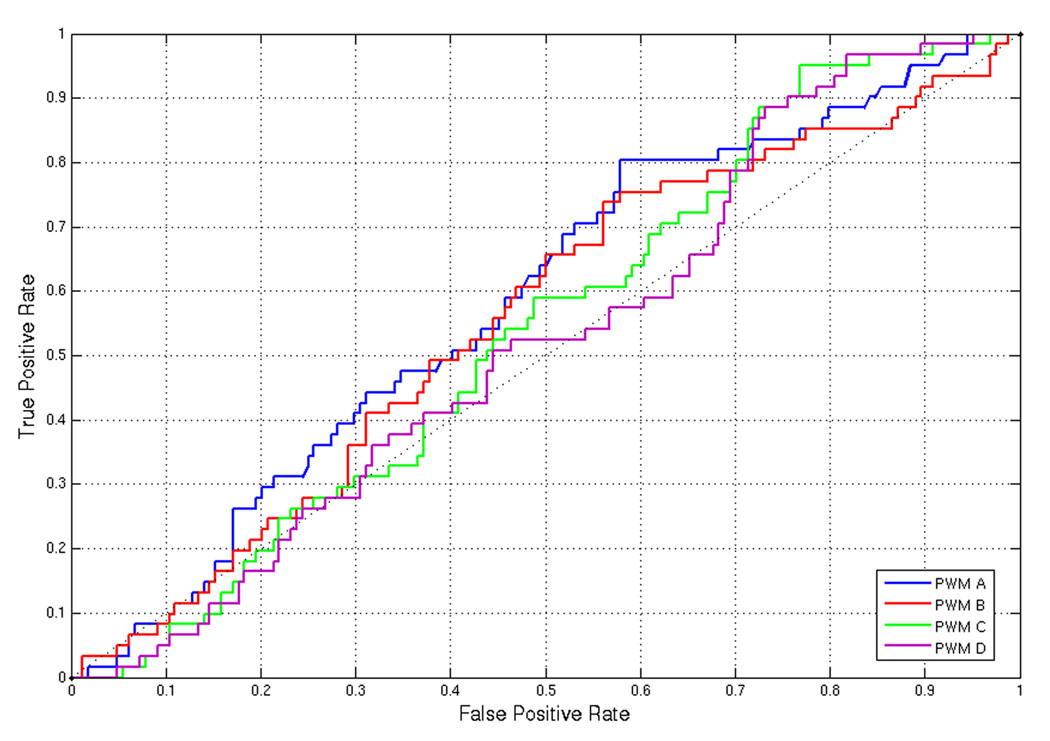
This is somewhat surprising as the use of sequence data can potentially help exclude non-targets from the list of target predictions. The ROC curve (Figure 4), computed against the DREAM2 200 gene set, illustrates that the initial sequence features that we derived are not very informative.
Figure 4.
ROC curve computed against the gold standard 200 gene set using ProbTF and PWMs from the literature.
This raises the question about the validity of our promoter sequence analysis. There are two obvious possibilities for the sources of error. First, it was not originally disclosed in the DREAM2 challenge what type of ChIP-on-chip array was used for the validation of the DREAM2 200 gene set. Thus, it was not possible to know with any certainty which genome build to use, which set of gene annotations to refer to, and what size of the promoter regions to use to search for binding sites. Second, the position weight matrices (PWMs) that we have obtained may not be the optimal ones for identifying BCL6 binding in these experiments.
To test whether these issues caused problems in the analysis, we performed an additional analysis. After the DREAM2 conference, it was disclosed that the ChIP-on-chip array that was used for the generation of the DREAM2 gene set was the Agilent Human Promoter ChIP-on-chip array. This array is based on the NCBI 36.1 (March 2006) genome build and includes probes covering −5.5kb upstream to +2.5kb downstream of the transcriptional start sites for approximately 17000 human transcripts. Thus, we extracted the sequence areas corresponding to the probes on the array, repeat masked the sequences [20], and applied binding site prediction algorithms [19]. In addition, to test whether there are more informative motifs than the BCL6 position weight matrices that we had obtained, we applied the PRIORITY motif discovery algorithm [21] to the sequences from our training set and also to the 200 genes from the DREAM2 set.
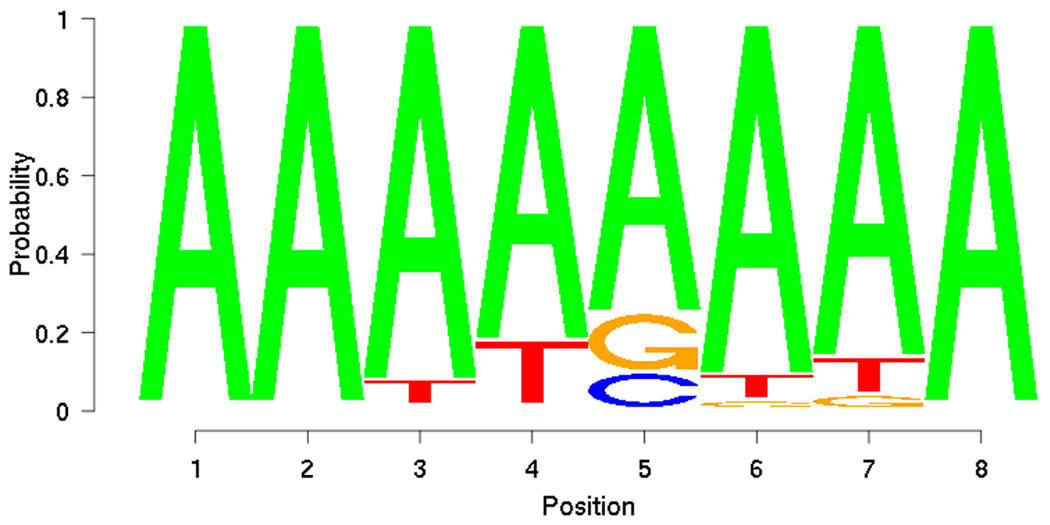
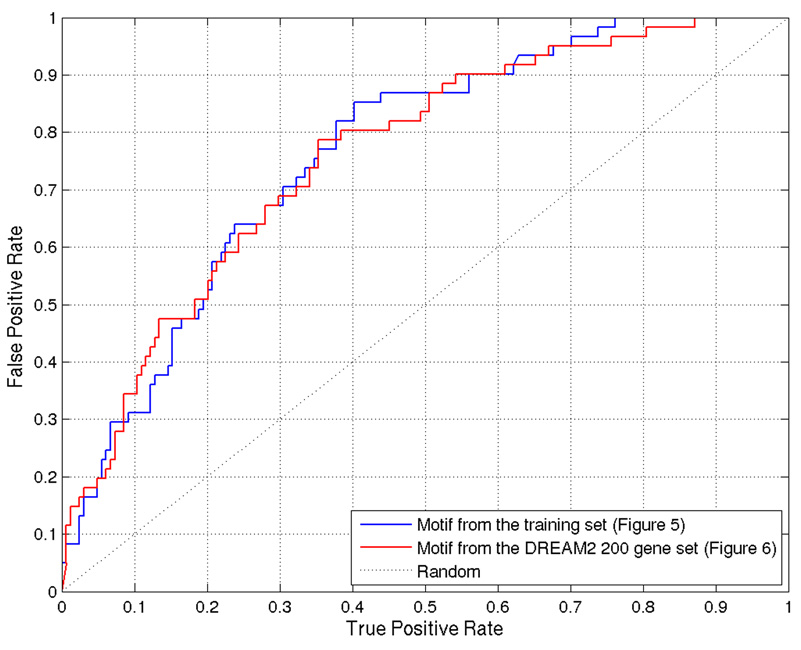
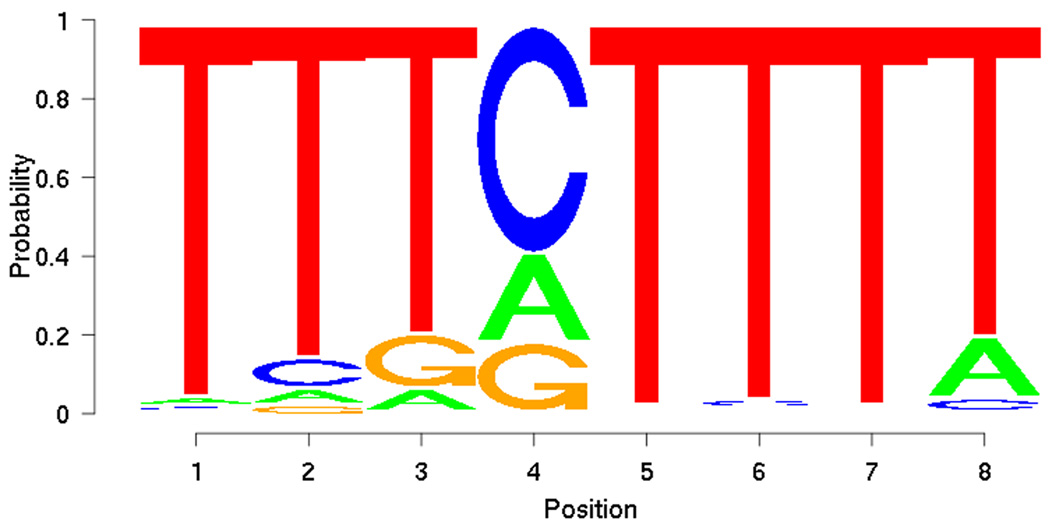
From the training set, PRIORITY identified low-complexity motifs (Figure 5). However, when applied to the DREAM2 gene set together with the ProbTF algorithm, these motifs show good discrimination (AUC = 0.7639) in terms of the ROC curve (Figure 6). Motif searching on DREAM2 gene set yields a slightly more complex motif (Figure 7) that also gives good discrimination (AUC = 0.7594) between targets and non-targets and performs slightly better especially on low false positive rates (Figure 6). Low-complexity motifs may reflect as-yet uncharacterized sequence features that correlate with BCL6 transcription, but are themselves not a model for direct BCL6 binding cis-elements.
Figure 5.
Motif discovered from training set using PRIORITY.
Figure 6.
ROC curve for ProbTF binding site predictions using motifs discovered from the training set and the DREAM2 200 gene gold standard set.
Figure 7.
Motif discovered from DREAM2 200 gene gold standard set using PRIORITY.
By replacing the earlier binding site prediction probabilities with the predictions obtained with discovered motifs and reoptimizing the weights, we can obtain the performance that is shown in Figure 8. The area under the precision-recall curve has increased from 0.80 to 0.84. Improved accuracy is evident also in the ROC curves. While it can be argued that this increase in performance is due to over-fitting, as motifs have been learned from the same data as they are tested on, it does illustrate that the sequences do carry information that can be utilized to boost the target identification performance. Similar performance improvement was also obtained using the motif inferred from the test set. Thus, if the knowledge about biological motifs is reliable, sequence data can be a valuable source of evidence.
Figure 8.
BCL6 target prediction accuracy using the ProbTF feature with discovered motif and weights = [0.6, 0.2, 0.6, 0.6, 0.8, 1.0]. Area under the curve is 0.84488 and 0.92273 for (a) precision-recall and (b) ROC, respectively.
Discussion
This analysis emphasizes the importance of applying bioinformatics tools carefully by taking biological insights into account. If necessary sanity checks and assessments of the quality of the data are not made, the resulting predictions will likely be unreliable. The use of sequence based evidence clearly illustrates this point. If we simply use sequence information blindly, we will only introduce noise into predictions, hurting the performance. However, careful use of this information makes it possible to improve the performance and also contributes to more reliable predictions.
The proposed framework generates quite accurate predictions that clearly outperform those that were obtained as part of the DREAM2 competition. In our DREAM2 submission we utilized this framework using 1/p-values as weights. In addition, we considered only negative correlation with BCL6 as a significant indication for being a target as it is known that BCL6 works as a repressor [7,16]. Positive correlation was taken into account, but given only half the weight of the negative correlation. This ad-hoc adjustment reduced accuracy of the predictions significantly. Thus, this analysis, performed after the gold standard was made available, also uncovered the wrong assumptions in our initial DREAM2 analysis. Summary of the performance under different feature and weight combinations is given in Table 3.
Table 3.
Summary of the prediction performance under different feature and weight combinations. Winning prediction scores from the competition are shown as reference.
The proposed analysis required a substantial amount of manual work in the form of literature review. This illustrates the need for systematic collection and storage of biological information in machine readable formats. Given a collection of prior biological information, this analysis can be automatically applied to identify the targets for any transcription factor and can further be extended to begin uncovering the entire regulatory network.
We have integrated various types of data: probability values, p-values, gene expression ratios, decision values, and correlations. Normalization of the numbers to the [0,1] interval and standardization of the distributions allows us to combine these data sources in a very simple manner using a weighted sum. It would be straightforward to include evidence from any other source as well, since these transformations make the scores comparable.
Methods
Data
A panel of data from 336 Affymetrix HGU95Av2 GeneChip experiments was downloaded from the Gene Expression Omnibus (accession number GSE2350) as described in the DREAM2 BCL6-Targets challenge.
Sequences and gene annotations from the human genome NCBI build 36 were downloaded from Ensembl [22].
Two PWMs for BCL6 transcription factors were obtained from the Genomatix database [23] (PWM A and B) and two matrices were manually constructed (PWM C and D) from literature review.
Data analysis tools
Transcription factor binding on putative target gene promoters was predicted with ProbTF [19]. ProbTF is a probabilistic method for transcription factor binding prediction that makes use of promoter sequences and PWMs to assess binding to the whole promoter region. ProbTF outputs the probability of binding that naturally reflects our degree of belief in transcription factor binding. Although ProbTF is able to incorporate practically any additional genome-level information source, such as evolutionarily conservation and nucleosome locations, we used the ProbTF method with promoter sequences and PWMs only (with default parameter settings).
Promoter scanning for putatitive BCL6 binding sites on target gene promoters was also carried out using MotifLocator [18]. Predicted sites meeting a p-value threshold of p < 0.001, based on a randomized sequence, were retained. For promoters containing a predicted site, an overall score was assigned as the p-value for a single match, or the minimum p-value, if multiple matches were found.
Support vector machines were used to train a classifier using the gene expression data from the genes on the training set. We used LIBSVM implementation in this work with polynomial kernel and default parameters [24]. With leave-one-out cross validation, we obtained the error rate of 24.67%. This classifier was then applied to 200 DREAM2 genes to obtain a decision value for each gene.
Motif discovery was performed with PRIORITY [21, 25]. PRIORITY assumes the same probabilistic sequence model as the standard MEME or Gibbs sampling method and indeed samples motifs with the collapsed Gibbs sampling. In addition, PRIORITY is able to incorporate a number of prior information sources, such as the structural class of transcription factors and nucleosome locations, into motif discovery. PRIORITY can also be applied in a discriminatory manner which allows principled use of two sequence sets, bound and non-bound. We used PRIORITY with the default parameter settings.
Feature Selection and Data Integration
We derived a p-value for the class separation of each feature. This was done with the Mann-Whitney U-test by testing the hypothesis: medians of the positive and negative target feature distributions in the training set are equal. The feature with the smallest p-value from each group of features was chosen (Table 2).
Next, each feature was scaled such that the range of values covered the [0,1] interval, 1 corresponding to a high confidence that the gene is a target. Features were further standardized to have the same distribution of values using the quantile normalization algorithm [26].
Features were combined by a weighted sum to obtain a score for each of the DREAM2 200 target genes. The weights were obtained by running an exhaustive search over the parameter space of the weights and using the performance on the training set to measure the goodness of the different weight combinations. Each weight was iteratively given all the values [0,Δ,2Δ,…,1], where we used Δ=0.2. Based on our tests, more fine grained search did not improve results (data not shown). The SVM decision value was excluded from the weight search as this feature was learned from the training set. However, based on the high cross-validation accuracy, we included it in the computation of the total score with the highest weight. When the weights were optimized, the SVM weight was given the value 1. When p-values were used as weights, SVM was given the smallest p-value as a weight.
Performance quantification
To measure the performance of our predictions we used the same framework that was used to score the DREAM2 competition predictions [5]. We generate precision-recall curves and true positive rate - false positive rate ROC curves. The Area under the curve (AUC) is used as a summary statistic to measure the performance [27].
Figure 2.
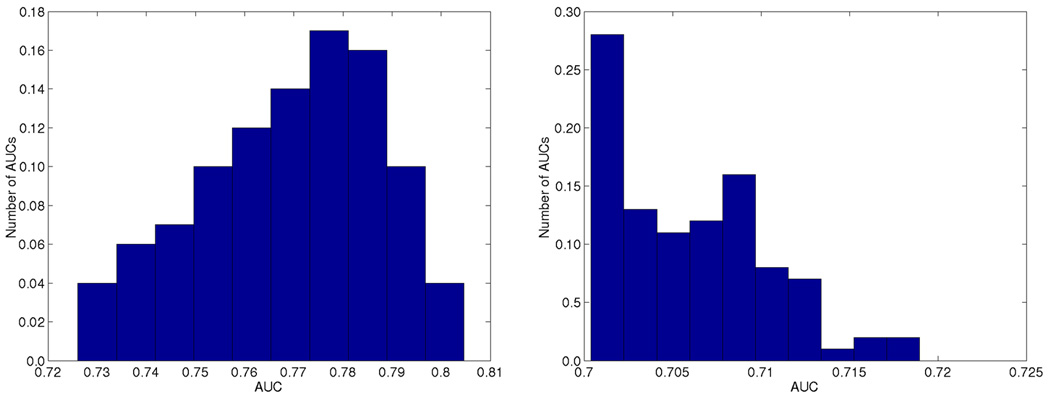
Area under the precision-recall curve using the best 100 weights. Performance on the gold standard is shown on the left and on the training data on the right. The SVM decision value was used as an additional feature in gold standard predictions with weight 1.0.
Acknowledgements
We gratefully acknowledge support from NIH/NIAID Contract HHSN272200700038C (AR, VT, IS), NIH/NIGMS R01-GM072855 (IS), P50 GM076547 (IS), the Academy of Finland (application number 213462 (HL), 120411 (MN) and 122973 (MN)).
References
- 1.Hood L, Galas D. The digital code of DNA. Nature. 2003;421:444–448. doi: 10.1038/nature01410. [DOI] [PubMed] [Google Scholar]
- 2.Futreal PA, et al. A census of human cancer genes. Nat. Rev. Cancer. 2004;4:177–183. doi: 10.1038/nrc1299. [DOI] [PMC free article] [PubMed] [Google Scholar]
- 3.Bar-Joseph Z, et al. Computational discovery of gene modules and regulatory networks. Nat. Biotechnol. 2003;2:1337–1342. doi: 10.1038/nbt890. [DOI] [PubMed] [Google Scholar]
- 4.Hwang D, et al. A data integration methodology for systems biology. Proc. Natl. Acad. Sci. USA. 2005;102:17296–17301. doi: 10.1073/pnas.0508647102. [DOI] [PMC free article] [PubMed] [Google Scholar]
- 5.Beaumont MA, Rannala B. The Bayesian revolution in genetics Nat. Rev. Genet. 2004;5:251–261. doi: 10.1038/nrg1318. [DOI] [PubMed] [Google Scholar]
- 6.DREAM Initiative. BCL6 transcriptional-target challenge. 2007 Information available at http://wiki.c2b2.columbia.edu/dream/index.php/BCL6_Transcriptional-Target_Challenge._Description.
- 7.Shaffer AL, et al. BCL- 6 represses genes that function in lymphocyte differentiation, inflammation, and cell cycle control. Immunity. 2000;13:199–212. doi: 10.1016/s1074-7613(00)00020-0. [DOI] [PubMed] [Google Scholar]
- 8.Polo JM, et al. Transcriptional signature with differential expression of BCL6 target genes accurately identifies BCL6-dependent diffuse large B cell lymphomas. Proc. Natl. Acad. Sci. USA. 2007;104:3207–3212. doi: 10.1073/pnas.0611399104. [DOI] [PMC free article] [PubMed] [Google Scholar]
- 9.Baron BW, et al. The human programmed cell death-2 (PDCD2) gene is a target of BCL6 repression: Implications for a role of BCL6 in the down-regulation of apoptosis. Proc. Natl. Acad. Sci. USA. 2002;99:2860–2865. doi: 10.1073/pnas.042702599. [DOI] [PMC free article] [PubMed] [Google Scholar]
- 10.Hosokawa Y, Maeda Y, Seto M. Target genes downregulated by the BCL-6/LAZ3 oncoprotein in mouse ba/f3 cells. Biochem. Biophys. Res. Commun. 2001;283:563–568. doi: 10.1006/bbrc.2001.4820. [DOI] [PubMed] [Google Scholar]
- 11.Li Z, et al. BCL-6 negatively regulates expression of the NF- B1 p105/p50 subunit. J. Immunol. 2005;174:205–214. doi: 10.4049/jimmunol.174.1.205. [DOI] [PubMed] [Google Scholar]
- 12.Ranuncolo SM, et al. Bcl-6 mediates the germinal center B cell phenotype and lymphomagenesis through transcriptional repression of the DNA-damage sensor ATR. Nat. Immunol. 2007;8:705–714. doi: 10.1038/ni1478. [DOI] [PubMed] [Google Scholar]
- 13.Toney LM, et al. BCL-6 regulates chemokine gene transcription in macrophages. Nat. Immunol. 2000;1:214–220. doi: 10.1038/79749. [DOI] [PubMed] [Google Scholar]
- 14.Takeda N, et al. Bcl6 is a transcriptional repressor for the IL-18 gene. J. Immunol. 2003;171:426–431. doi: 10.4049/jimmunol.171.1.426. [DOI] [PubMed] [Google Scholar]
- 15.Niu H, Cattoretti G, Dalla-Favera R. BCL6 controls the expression of the B7-1/CD80 costimulatory receptor in germinal center B cells. J. Exp. Med. 2003;198:211–221. doi: 10.1084/jem.20021395. [DOI] [PMC free article] [PubMed] [Google Scholar]
- 16.Phan RT, et al. BCL6 interacts with the transcription factor Miz-1 to suppress the cyclin-dependent kinase inhibitor p21 and cell cycle arrest in germinal center B cells. Nat. Immunol. 2005;6:1054–1060. doi: 10.1038/ni1245. [DOI] [PubMed] [Google Scholar]
- 17.Yoshida K, et al. BCL6 controls granzyme B expression in effector CD8+T cells. Eur. J. Immunol. 2006;36:3146–3156. doi: 10.1002/eji.200636165. [DOI] [PubMed] [Google Scholar]
- 18.Thijs G, et al. INCLUSive: INtegrated Clustering, Upstream sequence retrieval and motif Sampling. Bioinformatics. 2002;18:331–332. doi: 10.1093/bioinformatics/18.2.331. [DOI] [PubMed] [Google Scholar]
- 19.Lähdesmäki H, Rust AG, Shmulevich I. Probabilistic inference of transcription factor binding from multiple data sources. PLoS ONE. 2008;3:e1820. doi: 10.1371/journal.pone.0001820. [DOI] [PMC free article] [PubMed] [Google Scholar]
- 20.Smit A, Hubley R, Green P. Repeatmasker computer program. 1997 Software available at http://www.repeatmasker.org/.
- 21.Narlikar L, et al. Informative priors based on transcription factor structural class improve de novo motif discovery. Bioinformatics. 2006;22:e384–e392. doi: 10.1093/bioinformatics/btl251. [DOI] [PubMed] [Google Scholar]
- 22.Hubbard TJP, et al. Ensembl 2007. Nucleic. Acids. Res. 2007;35:D610–D617. doi: 10.1093/nar/gkl996. [DOI] [PMC free article] [PubMed] [Google Scholar]
- 23.Genomatix. 2007 Information available at http://www.genomatix.de/.
- 24.Chang C-C, Lin C-J. LIBSVM : a library for support vector machines. 2001 Software available at http://www.csie.ntu.edu.tw/~cjlin/libsvm. [Google Scholar]
- 25.Narlikar L, Gordân R, Hartemink AJ. A nucleosome-guided map of transcription factor binding sites in yeast. PLoS Comp. Bio. 2008 doi: 10.1371/journal.pcbi.0030215. In press. [DOI] [PMC free article] [PubMed] [Google Scholar]
- 26.Bolstad B, et al. A comparison of normalization methods for high density oligonucleotide array data based on bias and variance. Bioinformatics. 2003;19:185–193. doi: 10.1093/bioinformatics/19.2.185. [DOI] [PubMed] [Google Scholar]
- 27.Fawcett T. An introduction to ROC analysis, Patt. Rec. Lett. 2006;27:861–874. [Google Scholar]


