Abstract
Meningiomas, one of the most common human brain tumors, are derived from arachnoidal cells associated with brain meninges, are usually benign, and are frequently associated with neurofibromatosis type 2. Here, we define a typical human meningioma microRNA (miRNA) profile and characterize the effects of one downregulated miRNA, miR-200a, on tumor growth. Elevated levels of miR-200a inhibited meningioma cell growth in culture and in a tumor model in vivo. Upregulation of miR-200a decreased the expression of transcription factors ZEB1 and SIP1, with consequent increased expression of E-cadherin, an adhesion protein associated with cell differentiation. Downregulation of miR-200a in meningiomas and arachnoidal cells resulted in increased expression of β-catenin and cyclin D1 involved in cell proliferation. miR-200a was found to directly target β-catenin mRNA, thereby inhibiting its translation and blocking Wnt/β-catenin signaling, which is frequently involved in cancer. A direct correlation was found between the downregulation of miR-200a and the upregulation of β-catenin in human meningioma samples. Thus, miR-200a appears to act as a multifunctional tumor suppressor miRNA in meningiomas through effects on the E-cadherin and Wnt/β-catenin signaling pathways. This reveals a previously unrecognized signaling cascade involved in meningioma tumor development and highlights a novel molecular interaction between miR-200a and Wnt signaling, thereby providing insights into novel therapies for meningiomas.
Meningiomas are among the most frequent tumors of the brain and spinal cord, accounting for 15% to 20% of all central nervous system tumors (19). One of the most common events associated with meningioma tumorigenesis is deletion in chromosome 22q associated with loss of the neurofibromatosis 2 (NF2) gene (11, 25). The NF2-encoded protein, merlin (schwannomin), is structurally related to ezrin-radixin-moesin proteins, which link the actin cytoskeleton to specific proteins in the plasma membrane (36, 42). Merlin has distinct properties and functions in regulating cell growth and proliferation in ways that are not ascribed to the ezrin-radixin-moesin proteins (42). Some other genes have also been shown to be mutated in meningiomas, such as TP53, PTEN, and KRAS (17). Additional genetic events in meningiomas include chromosomal deletions in 1p, 3p, 6q, 10q, and 14q and chromosomal gains in 12q, 15q, 17q, and 20q (22, 39, 45).
Recent studies analyzing microRNA (miRNA) profiles and functions in cancer have provided valuable information about the molecular pathogenesis of several tumor types, including glioblastoma (6), hepatocellular carcinoma (24), and breast (23, 44), lung, colon, and prostate cancer (44). miRNAs are a family of small (∼22-nucleotide), endogenous, noncoding RNAs processed from double-stranded hairpin precursors (1, 18). They inhibit the expression of target mRNAs by binding to complementary sequences in untranslated regions (UTR) of mRNAs (typically the 3′ UTR) and repressing translation and/or cleaving the mRNA (1, 18). miRNA genes are included in the genome and transcribed by RNA polymerase II into longer transcripts, referred to as primary transcripts, or pri-miRNAs, and then processed into precursor miRNAs, or pre-miRNAs (10). So far, 800 different miRNAs, predicted by computational scanning in the human genome, have been documented (miRBase 10.0 [http://microrna.sanger.ac.uk]).
Reduction in cadherins and activation of the Wnt/β-catenin signaling pathway are key components of many types of cancer. Previous studies have shown that members of the miR-200 family inhibit epithelial-to-mesenchymal transition (EMT), an initial step in tumorigenesis, by direct targeting of mRNAs for ZEB1 and SIP1, which negatively regulate expression of the E-cadherin gene (4, 12, 20, 32). Thus, downregulation of miR-200 family members promotes EMT as an initial step in tumorigenesis by increasing levels of ZEB1 and SIP1 and thereby decreasing E-cadherin expression. β-Catenin binds directly to cadherin, which serves as a “sink” to restrict the movement of this transcriptional factor into the nucleus in response to Wnt signaling (29). Wnt signaling leads to translocation of β-catenin into the nucleus with activation of responsive target genes involved in stimulation of the cell cycle and inhibition of apoptosis, such as cyclin D1 and MDR1/PGP, respectively (13).
Although there has been considerable effort to reveal molecular events involved in the development of meningiomas, there has been no report, to our knowledge, on the miRNA signatures of meningiomas. In this study, we carried out a genome-wide array screen comparing miRNA levels in 14 sporadic benign human meningioma tumors (WHO grade I) with three normal arachnoidal tissue samples (cells of origin). miR-200a was among the most downregulated miRNAs in meningiomas by approximately 25-fold. The chromosomal region 1p36, including miR-200a, was found to be deleted in 3 of 14 meningioma tumor samples. We further investigated the functional consequences of miR-200a downregulation in meningiomas and showed that overexpression of miR-200a inhibited meningioma cell growth both in culture and in a xenograft tumor model in vivo. Moreover, overexpression of miR-200a decreased the expression of transcription factors ZEB1 and SIP1 and resulted in increased E-cadherin expression. The Wnt signaling pathway was inhibited by direct targeting of β-catenin message by miR-200a, with elevated miR-200a leading to decreased levels of β-catenin. A significant correlation was found between miR-200a downregulation and β-catenin upregulation in meningioma tumor samples compared to arachnoidal control tissues. Taken together, our findings support an important role for reduced miR-200a levels in meningioma tumorigenesis through upregulation of E-cadherin expression and downregulation of the major activator of the Wnt signaling pathway, β-catenin.
MATERIALS AND METHODS
Tumor and normal tissue samples.
Meningioma samples were obtained from discarded tumor tissue at the time of surgery, and normal arachnoid tissue was obtained from autopsies within 5 to 7 h of death. All human tissues were collected and deidentified by the Neuro-Oncology Tumor Repository, snap-frozen, and stored at −80°C under Institutional Review Board protocols approved by the Massachusetts General Hospital Committee on Human Research.
Cell lines.
Human meningioma cell lines, SF4068 and SF4433, were established from benign meningioma tumors that did not have the NF2 gene deleted (kindly provided by Anita Lal, University of California, San Francisco) (9). These meningioma cells were immortalized by transduction with expression cassettes for human telomerase and papillomavirus E6/E7 (9). We stably transduced these cells with lentivirus vectors encoding expression cassettes for Gaussia luciferase (Gluc) or firefly luciferase (Fluc) (2). HEK 293T cells (obtained from Maria Calos, Stanford University), human skin fibroblasts (L2131; obtained from Christine Klein, Luebeck, Germany), and meningioma cell lines were cultured in Dulbecco's modified Eagle's medium supplemented with 10% fetal bovine serum, 100 units/ml penicillin, and 10 μg/ml streptomycin at 37°C in 5% CO2. Primary human arachnoidal cells were cultured in “improved” minimal essential medium with 15% fetal bovine serum, 4 mg/liter insulin, and penicillin-streptomycin (4 mg/liter) (15).
miRNA overexpression and inhibition.
Precursor and inhibitor miRNAs were as follows: precursor-miR-200a (pre-miR-200a) (Ambion, Foster City, CA; AM17100), Cy3 dye-labeled pre-miR negative control 1 (Ambion; AM17120), pre-miR negative control 1 (Ambion; AM17110), anti-miRNA inhibitor negative control 1 (Ambion; AM17010), Cy3 dye-labeled anti-miR negative control 1 (Ambion; AM17011), and anti-miR-200a (Ambion; AM10991). miRNA precursors or inhibitors (both at 50 nM) were transfected into cells using Lipofectamine 2000 (Invitrogen, Carlsbad, CA). The transfection efficiency was 99% in all cells used in this study, as determined by transfection of Cy3-labeled oligonucleotides and fluorescence microscopy (data not shown).
Expression vectors.
pLenti-TOPFLASH (26) and pHGC-hRluc (40) plasmids were provided by Jean Wang and Bakhos A. Tannous, respectively. The Lenti-TOPFLASH vector was packaged using the “trans-lentiviral packaging system” (Open Biosystem, Huntsville, AL). An adenovirus-based expression cassette for β-catenin under the cytomegalovirus promoter, Ad-β-catenin, was purchased from Vector BioLabs (Philadelphia, PA).
Fluorescence-activated cell sorter analysis and apoptosis assays.
SF4433 cells were seeded into 12-well plates (1 × 10⁵ cells per well) and transfected the next day with precursor miRNAs. Five hours later, 10,000 cells were seeded in each well of a six-well plate. After days 1, 2, and 3, the cells were fixed with 70% ethanol on ice for 30 min, washed with phosphate-buffered saline (PBS), and treated with RNase A (100 μg/ml) at 37°C for 30 min and then with 20 μg/ml propidium iodide (Sigma, St. Louis, MO). A total of 10,000 stained nuclei were analyzed in a FACSCalibur flow cytometer (Becton-Dickinson, San Jose, CA) using BD-CellQuest software (Becton-Dickinson). DNA histograms were analyzed using WinMDI 2.8 software (Purdue University Cytometry Laboratories, West Lafayette, IN). Apoptotic cell death was determined using the Caspase-Glo 3/7 assay kit (Promega, Madison, WI) according to the manufacturer's instructions.
Meningioma cell implantation and bioluminescence imaging.
Transfection of the meningioma cell line SF4433-Fluc with miRNAs was performed as described above. Five hours later, the cells were trypsinized, rinsed, and subcutaneously implanted (2 × 10⁵ cells in 100 μl Matrigel per flank) in both flanks of athymic mice (nu/nu; 5-week-old females; Massachusetts General Hospital breeding facility). To visualize tumors, the animals were first anesthetized with ketamine (Hospira, Lake Forest, IL) and xylazine (Lloyd, Shenandoah, IA) and then injected intraperitoneally with d-luciferin (150 μg/g body wt; GoldBio Technology, St. Louis, MO) (40). Ten minutes after the injection of d-luciferin, images were acquired for 1 min using a charge-coupled-device camera (Roper Scientific, Trenton, NJ) and quantified with Living Image analysis software (IDL Research Systems, Boulder, CO). All animal procedures were performed according to guidelines issued by the Committee of Animal Care of Massachusetts General Hospital.
TOPFLASH reporter gene assay.
To measure TOPFLASH activity, meningioma cells were seeded at 10,000 cells per well in 96-well plates. Twenty-four hours later, the cells were infected with the Lenti-TOPFLASH vector or transfected with pre-miR-200a, anti-miR200a, control precursor, or anti-miRNAs using Lipofectamine. To monitor transfection efficiency, an expression cassette for Renilla luciferase (Rluc) (see above) was cotransfected. Five hours later, mWnt3a (50 ng/ml) was added. The cells were treated for 3 days before being harvested. Luciferase activity was measured using the Dual luciferase reporter 100 assay system (Promega). Fluc activity was normalized to Rluc activity using the same kit.
Western blot analysis.
Meningioma cells were seeded into 10-cm-diameter tissue culture plates (4 × 10⁶ cells per plate) and transfected the following day with pre-miR-200a or precontrol 1 or left untransfected, or were infected with Ad-β-catenin vector. After 3 days, the cells were harvested and total protein was separated on a sodium dodecyl sulfate-8% polyacrylamide gel and blotted onto nitrocellulose. The membrane was blocked with 5% nonfat dry milk in PBS containing 0.05% Tween 20 for 2 h at 37°C and then rinsed once with PBS containing 0.05% Tween 20 and washed twice for 15 min and twice for 5 min at room temperature with TBS-T (37). The primary antibodies used were for E-cadherin (1/1,000; BD Bioscience; no. 610182), β-catenin (1/200; Santa Cruz Biotechnology, Santa Cruz, CA; sc-59737), ZEB1 (1/100; Santa Cruz Biotechnology; sc-25388), SIP1 (1/200; Santa Cruz Biotechnology; sc-18392), and β-actin (1/5,000; Sigma; A5356). ImageQuant software (Molecular Dynamics, Sunnyvale, CA) was used to quantify the bands of the Western blots. The intensities were normalized to anti-β-actin levels and depicted as relative intensities.
Growth rate.
Meningioma cell lines, SF4433 and SF4068; primary arachnoidal cells, AC030 (5 × 10³); and human skin fibroblasts, L2131 (1 × 10⁵) were seeded in each well of a 24-well plate and transfected the following day with either precursor miRNAs, control miRNAs, pre-control 1 (50 nM, Ambion), or small interfering RNAs (siRNAs) for E-cadherin or left untransfected or were infected with Ad-β-catenin vector, in various combinations. Five hours later, cells were transferred to each well of a six-well plate in growth medium. The cells were counted on day 1, 2, 3, 4, 5, or 6 using a hemocytometer. siRNAs directed against E-cadherin (sc-44222) and β-catenin (sc-59737) were purchased from Santa Cruz Biotechnology.
Luciferase activity.
Meningioma cells stably expressing Gluc were transfected with precursor miRNAs, as described above, and 10 μl conditioned medium was removed at the indicated time points, mixed with 100 μl luciferase assay solution (Promega), and analyzed in a luminometer (2).
miRNA arrays.
Total RNA was isolated from tissues with Trizol (Invitrogen). RNA labeling and hybridization on a microarray were performed as previously described (21, 27). Briefly, 10 μg total RNA from each sample was filtered through Microcon YM-100 concentrators to obtain a low-molecular-weight fraction of RNA enriched in molecules under 60 bp. The low-molecular-weight RNA was end labeled with 30 μCi y33-P dATP (3,000 Ci/mmol) by T4 polynucleotide kinase (New England Biolabs, Ipswich, MA) and purified using the Qiagen (Valencia, CA) nucleotide removal kit. For hybridization, membranes were first prehybridized in MicroHyb Hybridization Buffer (Invitrogen) at 37°C for 30 min, followed by overnight hybridization in the same solution containing RNA probes. Following hybridization, the membranes were washed and exposed to a phosphor storage screen and scanned using a phosphorimager (Massachusetts General Hospital core facility), and the hybridization signals were quantified using ImageQuant software (Molecular Dynamics). RNA samples were considered independent measurements for the purposes of the two-tailed, two-sample t test. Probe signals that showed high variance in biological replicates (more than twofold with P values of >0.05) were excluded from further analysis.
miRNA array data were first normalized using the median-centric method within BRBArrayTools (http://linus.nci.nih.gov/BRB-ArrayTools.html) and were further subjected to quantile normalization. Differentiated miRNA lists comparing expression in the control to that in all meningioma samples for miRNA arrays were generated using the significance analysis of microarrays method (43) with cutoffs at a false discovery rate of <30% and a P value of <0.05. The normalized array data for the derived differentiated miRNA list were then transformed to z scores for data of each miRNA across samples using the WPS utility program (46), which was subjected to heat map clustering analysis and visualization using the TM4 program from The Institute for Genomic Research (http://www.tm4.org/).
qRT-PCR.
Analysis was used to determine the relative expression levels of miRNAs. Total RNA was isolated using Trizol (Invitrogen). Equal amounts of RNA were converted into cDNAs using reverse transcription (RT) primers (Ambion). Subsequently, quantitative RT-PCR (qRT-PCR) was performed using primers and materials from Ambion. The threshold cycle values were used to calculate the relative difference in miRNA levels. U6 RNA was used as an internal control in these RT-PCRs. For mRNA analysis, cDNA was randomly primed from 1.0 μg of total RNA using the Omniscript RT kit (Qiagen). qRT-PCR was subsequently performed in triplicate. GAPDH (glyceraldehyde-3-phosphate dehydrogenase) mRNA was used to normalize all mRNA quantifications, as described previously (12).
Array CGH.
Array comparative genomic hybridization (CGH) was performed using Agilent cDNA arrays and oligonucleotide arrays as previously described (31, 38). Control DNA (male and female) from healthy individuals was used for comparison. Tumor DNA was extracted from frozen tissues from the Neuro-Oncology Tumor Repository (Massachusetts General Hospital).
Luciferase miRNA target reporter assay.
pMiR-Report Fluc vectors (Ambion) were used to introduce the portion of the 3′ UTR of β-catenin mRNA containing the putative binding site for miR-200a. DNA oligonucleotide templates were synthesized (Invitrogen) as 63-mer sense and antisense oligonucleotide templates and annealed, as described previously (7). The annealed oligonucleotides were digested and ligated at HindIII and SpeI sites in pMiR-Report. The oligonucleotides used in these studies were as follows: β-catenin-wt (5′-CTAGTTTTAAGTCTCTCGTAGTGTTAAGTTATAGTGAATACTGCTACAGCAATTGCTCAGCAA-3′ and 5′-AGCTTTGCTGAGCAATTGCTGTAGCAGTATTCACTATAACTTAACACTACGAGAGACTTAAAA-3′) and β-catenin-mt (5′-CTAGTTTTAAGTCTCTCGTCGTGCTCAGTTATAGTGAATACTGCTACAGCAATTGCTCAGCAA-3′ and 5′-AGCTTTGCTGAGCAATTGCTGTAGCAGTATTCACTATAACTGAGCACGACGAGAGACTTAAAA-3′).
HEK 293T cells were cotransfected with the pMiR-Report vectors containing the β-catenin 3′ UTR with wild-type (wt) or mutant (mt) sequences and pre-miR-200a or pre-control 1. After 2 days, the cells were lysed and luciferase activity was measured using a luminometer. An expression cassette for Rluc (40) was cotransfected and used to normalize the Fluc values expressed by the pMiR-Report constructs.
Immunofluorescence staining.
Cells grown on coverslips were fixed in methanol for 30 min at room temperature and permeabilized with 0.2% Triton X in 1× PBS at room temperature for 15 min. After being blocked in PBS supplemented with 3% low-fat milk (blocking solution) and 0.2% Triton-X, coverslips were incubated overnight at 4°C with primary antibodies to β-catenin (Santa-Cruz mouse monoclonal antibody, catalog no. sc-5973; 1:50 dilution) and E-cadherin (Cell Signaling rabbit, catalog no. 4068; 1:50 dilution). All antibodies were diluted in 3% bovine serum albumin in 0.2% Triton-X in 1× PBS. After being washed with PBS, the cells were incubated with Alexa Fluor-conjugated goat anti-mouse (for β-catenin) and donkey anti-rabbit (for E-cadherin) (both from Molecular Probes, Eugene, OR; diluted 1:500) for 45 min at 37°C. The nuclei were then counterstained with DAPI (4′,6′-diamidino-2-phenylindole) (0.1 μg/ml; Sigma) for 10 min, washed with water, and mounted in Vector Vectashield mounting medium with DAPI. Images were captured with a Nikon Eclipse TE2000-U fluorescence microscope.
Statistical analysis.
All measurements, including cell counting, luciferase measurement, and qRT-PCR, were performed in triplicate, and the values are expressed as the mean ± standard deviation (SD); P values were calculated by using Student's t test, and P values of <0.05 were regarded as significant. Pearson correlation coefficients were calculated as a measurement for the association level of expression of miR-200a with β-catenin, cyclin D1, and E-cadherin from three independent experiments, and the P value was derived from computing a test of the correlation coefficient being zero. Regression lines were derived for each set of data to show the trend of correlation. All the analyses were done using R language (http://www.r-project.org/).
Microarray data accession number.
The microarray data set has been deposited in the NCBI Gene Expression Omnibus (http://www.ncbi.nlm.nih.gov/geo/) with the accession no. GSE17792.
RESULTS
miRNA profiling reveals a set of dysregulated miRNAs in meningiomas.
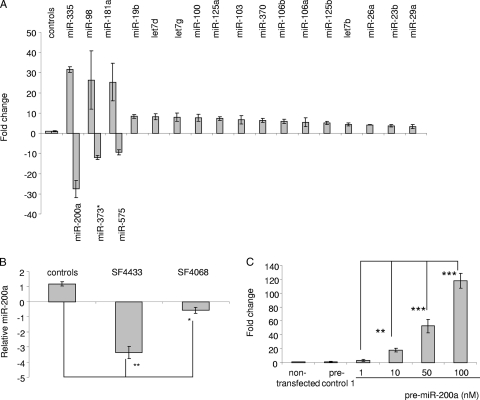
In order to investigate the possible role(s) of miRNAs in meningioma tumor development and progression, we performed radioactive miRNA array screening using an array that could detect 407 known miRNAs (21, 27) and analyzed 14 human sporadic benign meningiomas, WHO grade I, half of which had the NF2 locus deleted and half of which did not, as determined by CGH, as well as three normal control arachnoidal tissue samples (from fresh autopsies). WHO grade I meningiomas are by far the most common type of meningiomas, representing an initial stage in tumor development, and as such, the normal arachnoidal tissue of origin was deemed the best control to look for changes in miRNAs related to tumorigenesis. We found 43 dysregulated miRNAs in most meningioma tumor samples (in 9 to 13 out of 14 tumors) independent of the NF2 status (Table 1). Twenty of these changes in miRNA levels were confirmed by qRT-PCR, with 17 upregulated and 3 downregulated in two independent assays (Fig. 1A) in a comparison of three randomly selected meningioma samples and three arachnoidal tissue control samples. Of the overexpressed miRNAs, miR-335, miR-98, and miR-181a were the most upregulated (25- to 30-fold). Additional miRNAs confirmed to be upregulated (4- to 10-fold) in the qRT-PCR were miR-19b, let7d, let7g, miR-100, miR-125a, miR-103, miR-370, miR-106b, miR-106a, miR-125b, let7b, miR-26a, miR-23b, and miR-29a. All three downregulated miRNAs showed marked decreases: miR-200a, 25-fold; miR-373*, 12-fold; and miR-575, 10-fold. These data revealed a set of dysregulated miRNAs common to most sporadic benign meningiomas, providing a typical meningioma miRNA profile.
TABLE 1.
miRNA profiles of meningioma tumorsa
| miRNA | Fold regulation | No. in tumors (n = 14) | P value |
|---|---|---|---|
| Upregulated | |||
| miR-125b | +59 | 11 | 0.006 |
| miR-19b | +38 | 10 | 0.0009 |
| miR-27a | +36 | 11 | 0.001 |
| let7d | +35 | 13 | 0.02 |
| miR-125a | +26 | 11 | 0.006 |
| let7l | +23 | 12 | 0.006 |
| miR-335 | +21 | 11 | 0.004 |
| let7b | +19 | 10 | 0.04 |
| miR-217 | +16 | 11 | 0.004 |
| miR-106b | +16 | 10 | 0.003 |
| miR-181a | +12 | 11 | 0.04 |
| miR-22 | +12 | 14 | 0.0002 |
| miR-103 | +11 | 11 | 0.02 |
| let7g | +10 | 9 | 0.01 |
| miR-100 | +9 | 10 | 0.04 |
| miR-151 | +9 | 9 | 0.01 |
| miR-451 | +8 | 11 | 0.002 |
| miR-23b | +7 | 10 | 0.04 |
| miR-26a | +7 | 13 | 0.02 |
| miR-29a | +5 | 13 | 0.03 |
| miR-98 | +5 | 10 | 0.03 |
| miR-153 | +5 | 10 | 0.03 |
| miR-106a | +4 | 10 | 0.04 |
| miR-15a | +4 | 12 | 0.008 |
| miR-30a-5p | +2 | 12 | 0.04 |
| Downregulated | |||
| miR-575 | −2.1 | 10 | 0.01 |
| miR-515-3p | −2.3 | 11 | 0.009 |
| miR-370 | −2.4 | 11 | 0.003 |
| miR-623 | −2.6 | 12 | 0.001 |
| miR-292-5p | −2.9 | 11 | 0.001 |
| miR-373 | −3 | 10 | 0.02 |
| miR-654 | −3 | 11 | 0.0001 |
| miR-524 | −3.4 | 10 | 0.0007 |
| miR-483 | −3.6 | 11 | 0.001 |
| miR-485-5p | −3.8 | 10 | 0.0001 |
| miR-200a | −3.8 | 10 | 0.0001 |
| miR-327 | −4 | 10 | 0.0001 |
| miR-298 | −4 | 12 | 0.009 |
| miR-291-5p | −4 | 14 | 0.009 |
| miR-185 | −4 | 9 | 0.0001 |
| miR-546 | −4 | 14 | 0.0001 |
| miR-202 | −5 | 14 | 0.005 |
| miR-608 | −6 | 12 | 0.001 |
Global miRNA expression profiles of benign meningiomas were compared with arachnoidal tissue controls. miRNA screening was performed in triplicate for 14 tumor and 3 control samples using an array with radioactive probes as described in Materials and Methods. A two-tailed, two-sample t test was used with differences of two-fold or greater between samples (P < 0.05) regarded as significant. Forty-three miRNAs were found to be significantly dysregulated in most (9 to 13/14) meningioma samples compared to the means for control tissues.
FIG. 1.
Validation of miRNA levels in meningiomas by qRT-PCR. (A) We performed multiplex RT-PCRs in order to quantitate dysregulated miRNAs using three control and three randomly selected meningioma samples (XT3731, XT3871, and XT3771). Twenty miRNAs were validated as being significantly (P < 0.05) dysregulated, shown as the mean ± SD relative to the control mean. (B) qRT-PCRs were performed on RNAs isolated from two meningioma cell lines, and the endogenous miR-200a levels of these cells were compared to those of arachnoidal controls. (C) Meningioma cells (SF4433) were left untransfected or transfected with pre-control 1 or different concentrations of pre-miR-200a. Two days after transfection, RNA was isolated and miR-200a levels were measured by qRT-PCR. The data in all panels were normalized to the levels of U6 RNA in each sample. Experiments were performed in triplicate, and the values are expressed as means ± SD (*, P < 0.02; **, P < 0.0001).
miR-200a inhibits meningioma cell growth in culture.
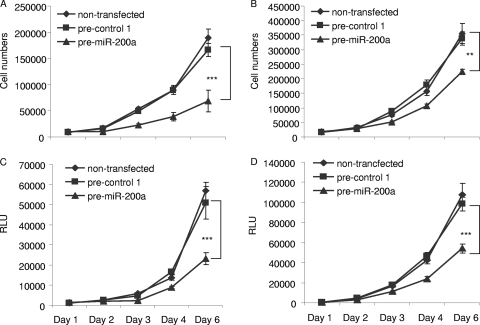
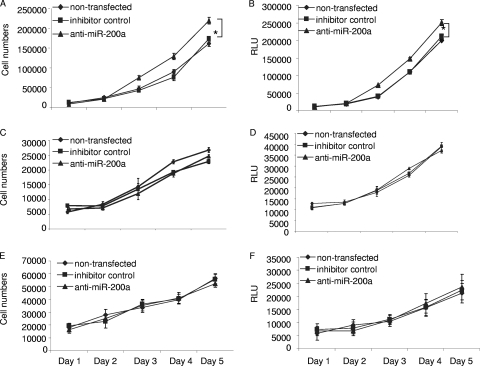
Among several interesting dysregulated miRNAs, we focused on miR-200a, which was downregulated in 10 of 14 meningiomas. We initially employed a gain-of-function approach to investigate the possible role of miR-200a in the growth of meningioma cells using human meningioma cell lines, SF4433-Gluc and SF4068-Gluc (9). SF4433-Gluc cells had about threefold lower levels of miR-200a and SF4068-Gluc cells had approximately 50% lower levels than primary arachnoidal cells (Fig. 1B). In order to increase the levels of miR-200a, these cells were transfected with a precursor for miR-200a (pre-miR-200a; Ambion) and compared with cells transfected with a control precursor (pre-control 1; Ambion) or untransfected cells. The transfection efficiencies were 99% in both cell lines, as determined by transfection of pre-control 1-Cy3 (Ambion) and fluorescence microscopy (data not shown). Two days after the transfection of 50 nM pre-miR-200a, significant overexpression of miR-200a was confirmed by qRT-PCR (Fig. 1C). Five hours after the transfection of meningioma cells, they were replated, and cell counts were determined 1, 2, 3, 4, and 6 days later (Fig. 2). The growth of SF4433 and SF4068 cells was significantly reduced, by about 65% and 50%, respectively, on day 6 after transfection with pre-miR-200a compared with control cells (Fig. 2A and B). In parallel experiments, these cell lines were also transduced with an expression cassette for the Gluc gene to monitor cell growth by measurement of luciferase activity secreted into the medium (2). As predicted, we also observed a pronounced reduction of luciferase activity for both meningioma lines transfected with pre-miR-200a over time (Fig. 2C and D). The inhibitory effect of pre-miR-200a on meningioma cell growth appeared to be specific for this miRNA, as transfection with an miRNA precursor for miR-575, which was also downregulated in meningiomas, did not affect the growth of SF4433-Gluc cells (data not shown). Interestingly, downregulation of miR-200a by an miR-200a-specific inhibitor, anti-miR-200a, significantly increased the growth of meningioma cells, by approximately 25%, compared to the controls (Fig. 3A and B). However, the growth of primary human skin fibroblasts (L2131-Gluc) and arachnoidal cells (AC030-Gluc) was not affected (Fig. 3C to F). Taken together, our data support the ability of increased levels of miR-200a to inhibit the growth of meningioma cells in culture, consistent with the hypothesis that decreased levels of miR-200a support meningioma tumor growth. However, decreased levels of miR-200a alone were not sufficient to promote the proliferation of arachnoidal cells.
FIG. 2.
Increased miR-200a inhibits meningioma cell growth. Meningioma cell lines, SF4433-Gluc (A and C) and SF4068-Gluc (B and D), were transfected with either pre-miR-200a or pre-control 1 or left untransfected and seeded in six-well plates 5 h after transfection. (A and B) Cells were counted on subsequent days after transfection. (C and D) In a parallel experiment, Gluc activity in the media of the cells was measured as relative light units (RLU) to provide a second growth parameter (**, P < 0.001; ***, P < 0.0001).
FIG. 3.
Effects of decreased miR-200a on the growth of different cell types. miRNA transfection and cell growth experiments similar to those for Fig. 2 were performed, except in this case an antisense oligonucleotide for miR-200a and a control antisense were used. The effect of miR-200a downregulation on the growth of meningioma cells, SF4433 (A and B); primary human arachnoidal cells, AC030-Gluc (C and D); and primary human skin fibroblasts, L213-Gluc (E and F), are shown as cell counts and secreted luciferase activity (in relative light units [RLU]). Primary arachnoidal cells and fibroblasts were infected with the Gluc lentivirus vector (90%) prior to the assay. The experiments were performed in triplicate, and the values are expressed as the mean ± SD (*, P < 0.05).
miR-200a triggers apoptosis in meningioma cells and inhibits meningioma tumor growth in vivo.
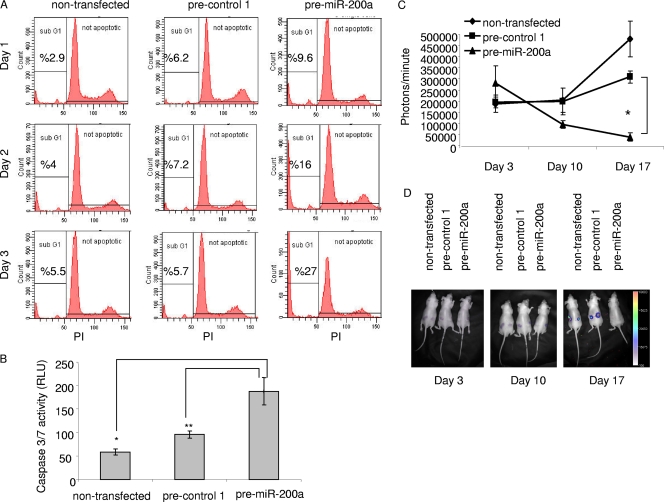
Cell cycle analysis was carried out to investigate the mechanism of the cell growth deficiency in the pre-miR-200a-transfected meningioma cells. SF4433 cells were transfected with pre-miR-200a or pre-control 1 or left untransfected. Cells were harvested 24, 48, and 72 h later and then fixed and labeled with propidium iodide for flow cytometric analysis. A gradual temporal increase in the fraction of cells in the sub-G1 phase, corresponding to the apoptotic cell death population, was observed only in cells transfected with pre-miR-200a (Fig. 4A). By 72 h after transfection, approximately 27% of the pre-miR-200a-transfected cells were in the sub-G1 fraction compared to 5.7% of pre-control 1-transfected cells and 5.5% of untreated cells. Apoptosis was also monitored by caspase 3 and 7 activities in transfected and nontransfected cells as a component of cell death that could account for the reduced meningioma cell numbers seen in Fig. 2. Seventy-two hours post-pre-miR-200a transfection, SF4433 cells showed two to four times more caspase 3/7 activity than the controls (Fig. 4B). These data indicate that the reduced growth of meningioma cells due to elevated miR-200a is a result of apoptosis.
FIG. 4.
miR-200a triggers apoptosis in meningioma cells and inhibits meningioma tumor growth in vivo. (A) Cell cycle analysis of meningioma cells using propidium iodide (PI) labeling and fluorescence-activated cell sorter analysis of DNA content was performed 1, 2, and 3 days after transfection with either pre-miR-200a or pre-control 1 or no transfection. (B) In a separate experiment, transfection was performed as for panel A, and the Caspase-Glo 3/7 (Promega) assay was carried out on cell lysates 3 days after transfection, with the result expressed as relative light units (RLU). Data are shown as the mean ± SD (*, P < 0.002; **, P < 0.005). (C) SF4433-Fluc cells were transfected with either pre-miR-200a or pre-control 1 or left untransfected and then implanted subcutaneously into the flanks of 5-week-old female athymic mice (nu/nu) 5 h later (eight mice per group). Tumor growth was monitored by in vivo bioluminescence imaging using a charge-coupled-device camera. Relative luciferase activity is shown as the mean ± SD (*, P < 0.004). (D) Representative bioluminescence images of three mice are shown with a pseudocolor bar to indicate the degrees of bioluminescence.
The strong growth-inhibitory effect of pre-miR-200a on meningioma cells in culture was then tested on tumor growth in vivo. Meningioma cells stably expressing Fluc (SF4433-Fluc) were transfected with either pre-miR-200a or pre-control 1 or left untransfected and 5 h later were implanted subcutaneously into both flanks of nude mice (1 × 10⁵ cells per injection site; eight mice per group). Subsequent tumor growth was monitored by in vivo bioluminescence imaging over 17 days (Fig. 4C). Almost all the tumors formed by meningioma cells transfected with pre-miR-200a failed to grow, with a marked reduction in size from days 3 to 17 postimplantation, while control tumors grew slowly during this period. Representative bioluminescence images of these mice are shown in Fig. 4D. In control groups, in vivo imaging was terminated 3 weeks after implantation due to the excessive size of tumors. Out of the 16 miR-200a-treated tumors, only 2 grew over an 8-week period, and they manifested levels of luciferase activity comparable to those of the control groups at the 3-week time of sacrifice (data not shown). qRT-PCR analysis of RNA isolated from tumors at the time of sacrifice showed no difference between the levels of miR-200a in pre-miR-200a, pre-control 1, or untreated tumors (data not shown), as presumably transfected precursor and derived mature miR-200a species were diluted out with tumor cell division. This finding indicates that elevated miR-200a levels in meningioma cells markedly reduce their ability to form tumors.
miR-200a leads to E-cadherin upregulation and directly targets β-catenin mRNA.
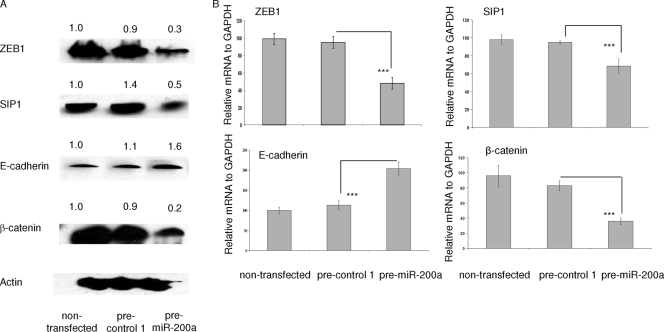
In the light of findings by others that ZEB1 and SIP1 mRNAs are direct targets for miR-200a and regulate E-cadherin expression (4, 12, 20, 32), we tested the effects of miR-200a elevation on the levels of protein and mRNA for these transcription factors in meningioma cells. Meningioma cells were transfected with pre-miR-200a or pre-control 1 or left untransfected, and 3 days later, Western blot analysis was performed on cell lysates using ZEB1, SIP1, and E-cadherin antibodies. As shown in Fig. 5A, miR-200a overexpression reduced ZEB1 and SIP1 protein levels, while E-cadherin protein levels were increased. In the same experimental paradigm, qRT-PCR showed that ZEB1 and SIP1 mRNAs were reduced, whereas E-cadherin mRNA was increased by overexpression of miR-200a (Fig. 5B).
FIG. 5.
Effects of elevated miR-200a on other proteins. (A) Meningioma cells, SF4433, transfected with either pre-miR-200a or pre-control 1 or left untransfected, were harvested 2 days later, and Western blot analysis was performed with antibodies to ZEB1, SIP1, E-cadherin, β-catenin, and β-actin. The relative blot intensities were quantified by image analysis, with densitometry values normalized to β-actin and untransfected values set at 1.0. (B) In a parallel experiment, total RNA was extracted from transfected cells, as described above. qRT-PCRs were performed for ZEB1, SIP1, E-cadherin, β-catenin, and GAPDH mRNAs. The data were normalized to GAPDH in each sample. The results are shown as the mean ± SD (***, P < 0.0001).
We also examined whether another member of the miR-200 family, miR-200b, can affect β-catenin expression. We used both meningioma and primary arachnoidal cells and transfected meningioma cells with pre-miR-200b and primary arachnoidal cells with anti-miR-200b. Three days later, Western blot analysis was performed with anti-β-catenin and anti-actin antibodies. We found that neither overexpression of pre-miR-200b in meningioma cells nor downregulation of miR-200b in arachnoidal cells altered the levels of β-catenin (data not shown). This lack of effect is supported by a search of computationally predicted target sequences in mRNAs that showed that β-catenin mRNA is not among the predicted targets of miR-200b (http://pictar.mdc-berlin.de/cgi-bin/PicTar_vertebrate.cgi).
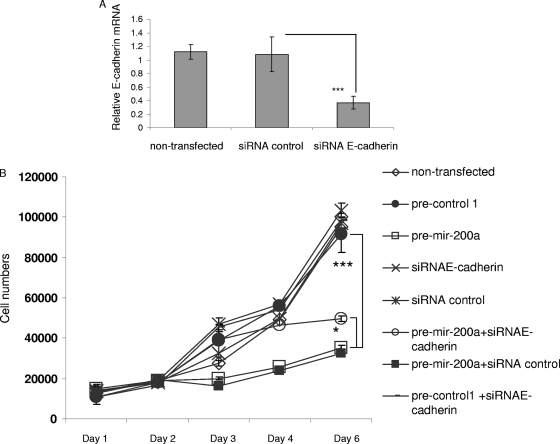
Based on studies showing the interaction between β-catenin and cadherin, as well as the role of β-catenin in the Wnt signaling pathway, we also tested whether miR-200a levels affected β-catenin expression. Interestingly, we found that increased levels of miR-200a in meningioma cells significantly downregulated β-catenin at both mRNA and protein levels (Fig. 5A and B). Thus, we hypothesized that miR-200a might inhibit meningioma tumor growth both by upregulating E-cadherin expression and by decreasing Wnt/β-catenin signaling. To test this hypothesis, we first examined the involvement of E-cadherin upregulation in miR-200a-mediated growth inhibition of meningioma cells. Meningioma cells transfected with an siRNA for E-cadherin mRNA showed a decrease in E-cadherin mRNA levels (Fig. 6A). Cells were then transfected with an siRNA for E-cadherin mRNA or pre-miR-200a alone or cotransfected with both or with control constructs; 5 h later, the cells were replated, and cell counts were determined after 1, 2, 3, 4, and 5 days (Fig. 6B). siRNA reduction of E-cadherin levels alone did not significantly increase the growth of meningioma cells, while as previously observed (Fig. 2), miR-200a overexpression reduced cell growth by approximately 65% compared to untransfected cells. When siRNAs for E-cadherin mRNA and pre-miR-200a were cotransfected, the growth of meningioma cells was reduced by only about 50%, indicating that while miR-200a probably regulates the levels of other proteins involved in meningioma growth, elevated levels of E-cadherin are a contributing component.
FIG. 6.
Role of E-cadherin in miR-200a growth inhibition of meningioma cells. (A) Meningioma cells, SF4433, were transfected with siRNA-E-cadherin or control siRNA or left untransfected, and 3 days later, qRT-PCRs were performed for E-cadherin mRNA and normalized to GAPDH mRNA levels. (B) Meningioma cells were cotransfected with siRNA-E-cadherin and pre-miR-200a or with control siRNA or pre-control 1, in various combinations, or left untransfected, and 5 h later, the cells were replated in six-well plates. The cells were counted at daily intervals after transfection. The results are shown as the mean ± SD (*, P < 0.05; ***, P < 0.0001).
miR-200a directly targets the β-catenin mRNA and inhibits β-catenin/Wnt signaling.
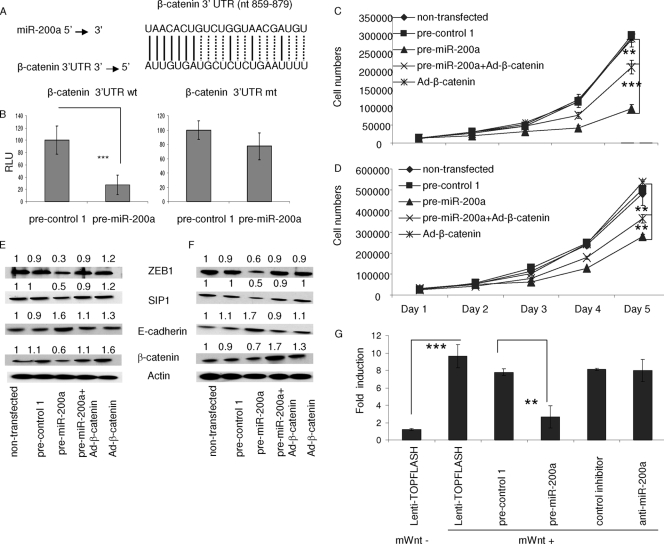
To understand how increased levels of miR-200a lead to decreased levels of β-catenin (Fig. 5B), we evaluated whether the β-catenin mRNA is a direct target for miR-200a. β-Catenin message is among the predicted targets of miR-200a (http://pictar.mdc-berlin.de/cgi-bin/PicTar_vertebrate.cgi), with one potentially conserved binding site within its 3′ UTR (Fig. 7A). In order to test whether miR-200a can bind directly to this 3′-UTR site, luciferase reporter vectors encoding a fragment of wt β-catenin mRNA 3′ UTR (bp 846 to 892) (β-catenin-wt) or the same region containing mismatches in the predicted miR-200a binding site (β-catenin-mt) were transfected into HEK 293T cells, which have higher transfection efficiency than meningioma cells. Cotransfection of the β-catenin-wt construct and pre-miR-200a resulted in significantly decreased luciferase activity compared to transfection with pre-control 1, whereas luciferase activity was not significantly reduced in cells cotransfected with β-catenin-mt and pre-miR-200a (Fig. 6B). These data strongly suggest that the reduced β-catenin levels in pre-miR-200a-transfected cells is a result of direct targeting of the β-catenin RNA by miR-200a.
FIG. 7.
miR-200a targets β-catenin mRNA and inhibits Wnt/β-catenin signaling. (A) Alignment of the binding site for miR-200a and a potential binding site in the 3′ UTR of the human β-catenin mRNA. (B) pMiR-Report vectors containing the wt or mt miR-200a binding site from the 3′ UTR of β-catenin mRNA and pre-miR-200a or pre-control 1, as well as an expression cassette for Rluc, were cotransfected into HEK 293T cells. Two days later, Fluc activity in the cells was measured and normalized to Rluc activity. (C and D) SF4433 (C) or SF4068 (D) cells were left untransfected, transfected with pre-miR-200a or pre-control 1, or infected with Ad-β-catenin vector and seeded in six-well plates 5 h after transfection. The cells were counted at daily intervals after being plated. (E and F) In a parallel experiment to those shown in panels C and D, β-catenin, ZEB1, and SIP1 protein levels were monitored in SF4433 (E) and SF4068 (F) cells by Western blot analysis, normalized to β-actin levels, and compared to those of untransfected cells, set at 1.0. (G) SF4433 cells were first infected with the Lenti-TOPFLASH vector and then transfected with an expression cassette for Rluc, after which some cells were also transfected with pre-control 1, pre-miR-200a, control antisense inhibitor, or anti-miR-200a. Five hours later, the cells were incubated in normal growth medium or medium supplemented with mWnt3 (underlined). Fluc activity was measured 2 days after transfection, normalized to Rluc activity, and expressed as changes in relative light units relative to the level in untransfected cells in normal medium. The results are shown as means ± SD (**, P < 0.001; ***, P < 0.0001).
Since Wnt/β-catenin signaling is involved in tumorigenesis in a number of malignancies (13, 14, 29), we hypothesized that the growth-regulatory effect of miR-200a in meningioma cells might be mediated via inhibition of this signaling pathway through reduced β-catenin levels. To test this, we evaluated whether the decreased growth of cells transfected with pre-miR-200a could be rescued by overexpression of β-catenin. Both SF4433 and SF4068 meningioma cell lines were transfected with pre-miR-200a and/or transduced with an adenovirus-based β-catenin expression vector (Ad-β-catenin) alone or together, plus controls, and 5 h later, the cells were replated and cell counts were determined over 5 days (Fig. 7C and D). The growth rates of miR-200a-transfected meningioma cells and SF4433 and SF4068 cells were reduced by approximately 65% and 43%, respectively, compared to the controls, but concomitant overexpression of β-catenin increased their growth significantly. This supports the thesis that upregulation of β-catenin can partially counteract the growth-inhibitory effect of pre-miR-200a. In parallel experiments, targets of miR-200a—β-catenin, ZEB1, SIP1, and E-cadherin—were examined in Western blots (Fig. 7E and F). miR-200a overexpression reduced β-catenin protein levels by about 40% in SF4433 and 30% in SF4068 cells compared to controls, while transduction with the β-catenin expression cassette increased β-catenin levels by 40 to 60%. ZEB1 and SIP1 protein levels were found to be reduced approximately 40 to 60% in both cell lines, while E-cadherin protein expression was increased 60 to 70% compared to controls when miR-200a was overexpressed. Taken together, these data suggest that decreased β-catenin levels caused by increased miR-200a contribute to miR-200a-mediated growth inhibition.
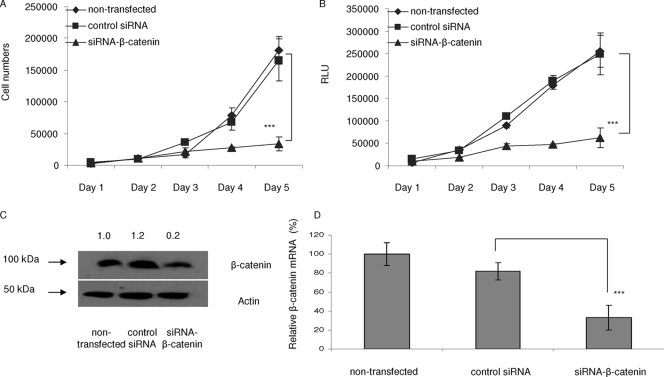
To further examine the effects of miR-200a on Wnt/β-catenin signaling, meningioma cells were transduced with a reporter construct for the Wnt/β-catenin pathway, Lenti-TOPFLASH (26), which contains both an expression cassette for Fluc regulated by 7× β-catenin T-cell factor/lymphoid enhancer factor binding sites and an expression cassette for Rluc under a constitutive promoter for normalization. The cells were transfected with the reporter construct alone or cotransfected with pre-control 1 or pre-miR-200a and the reporter construct, and 5 h later, medium containing 50 ng/ml mouse Wnt (mWnt) ligand (B&D System) was added and the incubation was continued for 2 days. mWnt treatment resulted in an approximately 10-fold induction in Fluc activity in cells transduced with the reporter, whereas cotransfection with pre-miR-200a reduced the activity of mWNT plus the reporter by approximately 50% compared with pre-control 1 (Fig. 7G). However, inhibition of endogenous miR-200a with an inhibitor, anti-miR-200a, did not significantly change the reporter gene activity induced by mWnt. These data indicate that miR-200a can regulate the Wnt/β-catenin signaling cascade, presumably by reducing the levels of β-catenin. In support of this, siRNA inhibition of β-catenin expression also inhibited meningioma cell growth (Fig. 8A and B). siRNA gene silencing of β-catenin expression reduced the levels of β-catenin protein and mRNA (Fig. 8C and D, respectively).
FIG. 8.
Reduction in β-catenin expression by siRNA inhibits meningioma cell growth in culture. (A and B) Transfection of siRNAs directed against β-catenin and controls and a meningioma cell growth assay were performed as for Fig. 2A and C, with measurement of both cell counts (A) and relative luciferase activity (in relative light units [RLU]) (B) using SF4433 cells. (C) Lysates from cells treated as for panel A were analyzed by Western blotting for expression of β-catenin and β-actin, with values for each condition normalized to β-actin levels and expressed relative to untransfected cells (1.0). (D) qRT-PCR was carried out on RNA from cells treated as for panel C, and β-catenin mRNA levels were normalized to GAPDH mRNA levels (***, P < 0.0001). The results are shown as means ± SD.
Wnt/β-catenin signaling is dysregulated in meningioma tumors.
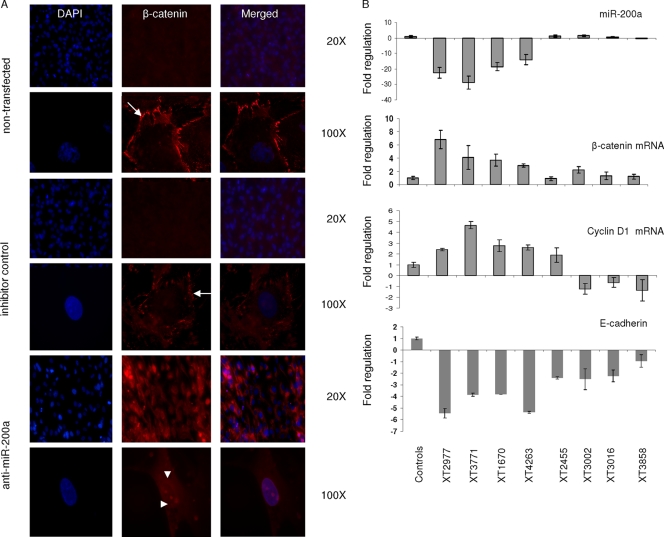
The activation of Wnt signaling results in translocation of β-catenin from the plasma membrane/cytoplasm into the nucleus (14). To test whether reduced levels of miR-200a activity in arachnoidal cells (meningioma origin) affect the levels and cellular localization of β-catenin, we transfected these cells in culture with an miR-200a antisense inhibitor or a control oligonucleotide or left them untransfected and performed immunofluorescence staining for β-catenin 3 days later. In controls, β-catenin showed staining consistent with localization at the plasma membrane, whereas in miR-200a-inhibitor-transfected cells, β-catenin levels appeared higher and showed strong cytoplasmic and some nuclear localization (Fig. 9A). These data suggest that downregulation of miR-200a in arachnoidal cells may contribute to the development of meningioma tumorigenesis by increasing the levels of β-catenin in the nucleus as part of the transformed phenotype.
FIG. 9.
miR-200a and β-catenin expression in primary arachnoidal cells and meningioma tumor samples. (A) Primary arachnoidal cells were left untransfected or transfected with either anti-miR-200a or a control inhibitor, and 3 days later, the cells were fixed with methanol, stained for β-catenin by immunocytochemistry (red) and for DNA by dye binding (blue), and visualized by fluorescence microscopy. Representative images are shown (magnification, ×20 and ×100). In untransfected and antagomir control-treated cells, β-catenin was found predominantly clustered at the plasma membrane (arrows); in anti-miR-200a-treated cells, β-catenin levels were increased and more staining was found in the cytoplasm and nucleus (arrowheads). (B) Total RNA was isolated from meningioma tumor and arachnoidal tissue samples, and RT-PCRs were performed for miR-200a and β-catenin, cyclin D1, and E-cadherin mRNAs. mRNA levels were normalized to GAPDH mRNA and miR-200a levels to U6 RNA. The values relative to arachnoidal tissues are shown as the mean ± SD.
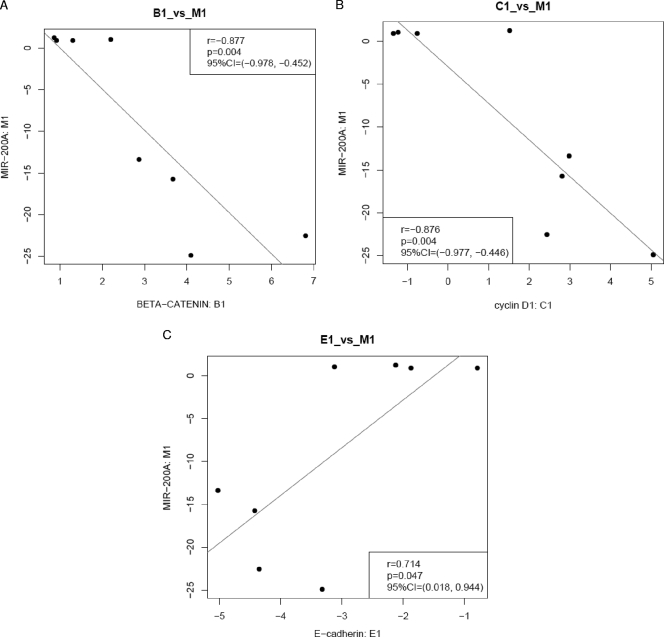
We also examined the expression levels of β-catenin and cyclin D1, the gene for which is a target of β-catenin, in human meningioma tumor samples. We performed qRT-PCR for messages in randomly selected tumor samples, including four with miR-200a downregulation (XT2977, XT3771, XT1670, and XT4263) and four without downregulation of miR-200a (XT2465, XT3002, XT3016, and XT3858), compared to an arachnoidal tissue sample. A significant inverse correlation was found between the levels of miR-200a and those of β-catenin and cyclin D1 mRNAs in meningioma tissue samples, while decreased levels of E-cadherin mRNA were found in all meningioma samples (Fig. 9B; representative correlation graphs are shown in Fig. 10). This suggests that, in addition to miR-200a, other factors are involved in the regulation of E-cadherin expression and that downregulation of E-cadherin mRNA is a common feature of meningiomas.
FIG. 10.
miR-200a levels correlate with levels of β-catenin, cyclin D1, and E-cadherin messages. qRT-PCR data for miR-200a and β-catenin, cyclin D1, and E-cadherin mRNAs from three independent experiments were plotted separately for each pair in each experiment (M1, miR-200a data set 1, versus B1, β-catenin data set 1; M2, miR-200a data set 2, versus B2, β-catenin data set 2; and M3, miR-200a data set 3, versus B3, β-catenin data set 3). Shown in the plot legends are the Pearson correlation coefficient r (r), the P value of a significant test of the corresponding coefficient against null (p), and the 95% confidence interval (95%CI). (A) miR-200a versus β-catenin. (B) miR-200a versus cyclin D1. (C) miR-200a versus E-cadherin.
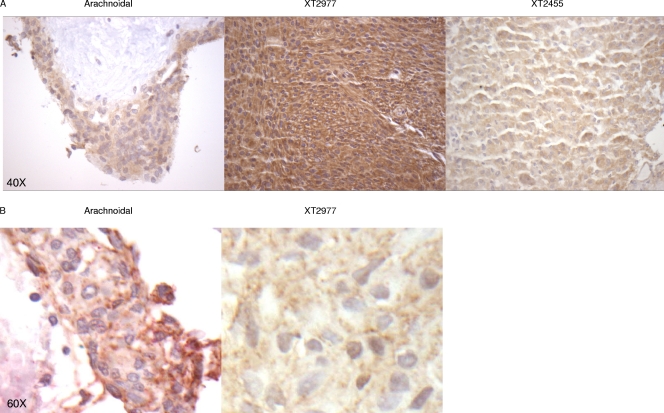
Furthermore, immunohistochemical analysis of sections from meningioma tumors showed that β-catenin was expressed at higher levels in tumors with lower miR-200a levels than in those in which miR-200a was not downregulated, with arachnoidal tissue showing very low levels of β-catenin (representative sections are shown in Fig. 11). E-cadherin was found to be expressed at lower levels in these tumor samples than in arachnoidal tissues (Fig. 11). Taken together, these data suggest that miR-200a regulates the levels of β-catenin in meningioma tumors and that downregulation of miR-200a may have an important role in meningioma growth by increasing β-catenin levels and hence facilitating Wnt signaling.
FIG. 11.
Immunohistochemical staining of meningioma tumor tissues. Shown is immunohistochemical analysis of paraffin-embedded human brain arachnoidal tissue and meningioma tumors costained for β-catenin and E-cadherin. Two representative pictures (A and B) of arachnoidal tissue and meningioma tumor sample XT2977 are shown. Red, E-cadherin; brown, β-catenin.
miR-200a-induced cell death is rescued by β-catenin overexpression.
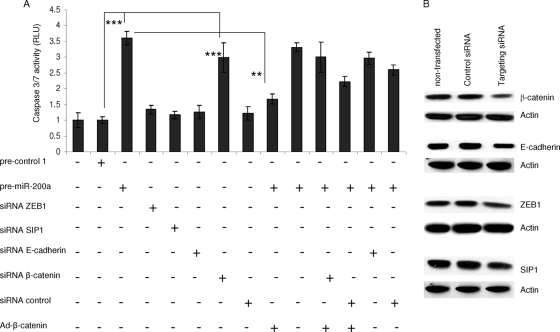
In order to investigate whether β-catenin and/or E-cadherin is involved in miR-200a-induced apoptosis, we carried out caspase activity measurements under various conditions of expression. Meningioma cells were transfected with pre-miR-200a or siRNAs directed against messages for E-cadherin, ZEB1, SIP1, and β-catenin or infected with an expression vector for β-catenin (Ad-β-catenin), alone and in combination (Fig. 12A). As previously noted, transfection with pre-miR-200a significantly increased caspase 3/7 activity. Suppression of β-catenin expression also significantly increased this marker of apoptosis, whereas siRNAs for E-cadherin, ZEB1, and SIP1 mRNAs did not, under these experimental conditions. Overexpression of β-catenin significantly rescued miR-200a-mediated apoptosis. However, siRNA knockdown of E-cadherin in pre-miR-200a-transfected cells did not significantly reduce the caspase 3/7 activity. siRNA gene silencing of ZEB1 (82%), SIP1 (75%), β-catenin (86%), and E-cadherin (79%) expression was confirmed by qRT-PCR, compared to that of controls, and normalized to GAPDH mRNA levels (data not shown). Overexpression of β-catenin resulted in a sixfold increase in the mRNA levels of β-catenin compared to the control (data not shown). In parallel experiments, decreased protein levels of β-catenin, ZEB1, SIP1, and E-cadherin were monitored by Western blotting after the transfection of corresponding siRNAs in meningioma cells (Fig. 12B). Taken together, these data suggest that among miR-200a targets, the β-catenin mRNA is one of the major contributors to miR-200a-induced apoptosis.
FIG. 12.
miR-200a-induced cell death is rescued by β-catenin overexpression. (A) SF4433 cells were transfected alone and cotransfected with different combinations of pre-miR-200a and siRNAs for ZEB1, SIP1, E-cadherin, and β-catenin mRNAs and/or transduced with a β-catenin expression vector, Ad-β-catenin. Three days after transfection, the Caspase-Glo 3/7 (Promega) assay was carried out on the cell lysates, and the results were expressed as relative light units (RLU). The data are shown as the mean plus SD (**, P < 0.002; ***, P < 0.0001). (B) In parallel experiments, siRNA silencing of β-catenin, ZEB1, SIP1, and E-cadherin expression was measured in Western blots.
Decreased miR-200a status and chromosome 1p36 deletion in meningiomas.
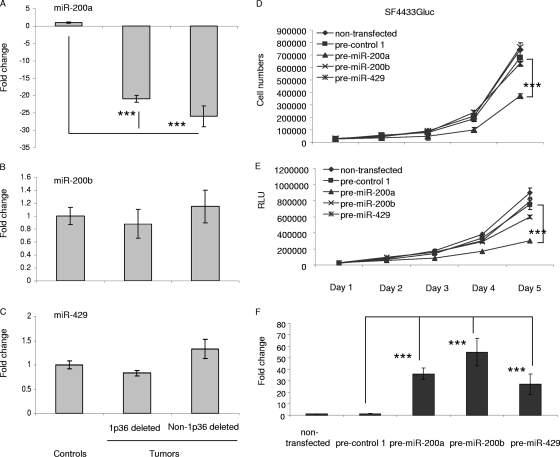
Based on studies demonstrating a correlation between chromosomal alterations and miRNA levels in a variety of cancers (5, 8), we investigated whether the downregulation of miR-200a was associated with chromosomal deletions in meningiomas. Microarray-based CGH analysis was carried out with 70 sporadic benign meningioma tumor samples compared with normal human genome samples. Chromosome 1p36 was one of the most commonly deleted regions, with loss in ∼40% of meningioma samples (Yiping Shen and James F. Gusella, unpublished data), most frequently in tumors with loss of chromosome 22 (Fig. 13 shows representative CGH data). The Sanger database (http://microrna.sanger.ac.uk/sequences/) revealed that chromosome 1p36 harbors genes for miR-200a, miR-200b, and miR-429. Using meningioma samples used in the miRNA array analysis, we compared the expression profiles of miR-200a by qRT-PCR in seven meningioma samples with NF2 deleted, three of which also had 1p36 deleted, and seven meningioma samples without NF2 deleted, none of which had 1p36 deleted (Table 2 ). The expression of the miR-200a gene was significantly downregulated (over twofold) in all seven of the samples with NF2 deleted, irrespective of whether they had 1p36 deleted, and in three of the samples without NF2 deleted, none of which appeared to have 1p36 deleted. The CGH array was able to detect only imbalances larger than 35 kb, and therefore, deletions of the miR-200a gene included in a smaller genomic region would not have been detected by this analysis. We also quantified the expression levels of the other 1p36-encoded miRNAs, miR-200b and miR-429 (Fig. 14A to C). Interestingly, miR-200b was not downregulated in any tumors, while miR-429 was downregulated in 2 out of 14 tumors, and neither of these 2 tumors appeared to have a deletion in the 1p36 region. Thus, there appear to be multiple modes of reduction of miR-200a in these tumors, including deletion of one allele and transcriptional/processing downregulation of expression. Upregulation of miR-200b and miR-429 by expression of their precursor miRNAs did not effect meningioma cell growth in culture, as assessed by cell counts and Gluc activity (Fig. 14D and E). miRNA levels of miR-200a, miR-200b, and miR-429 in these experiments were shown to be increased, as quantified by qRT-PCR (Fig. 14F). These data suggest that among the 1p36-encoded miRNAs, only miR-200a has a potential role in regulating meningioma cell growth, and that in a few cases downregulation of miR-200a is concurrent with deletion of this chromosomal region.
FIG. 13.
Representative CGH analysis of 1p36 deletion in genomic DNA from one of the meningiomas. Tumor DNA was labeled with Cy5, and control human DNA (Promega) was labeled with Cy3, and relative hybridization to meningioma DNA was analyzed using the Agilent 244K oligonucleotide array CGH chip. The log2-transformed Cy5/Cy3 ratios for each probe were plotted and arranged horizontally according to their physical locations on chromosome 1. Probes with log2 ratios of >0.25 are colored red, indicating copy number gain. Probes with log2 ratios of <−0.25 are colored green, indicating copy number loss. Others are colored black, indicating no copy number change. The vertical blue line shows the position of the centromere, and the black line indicates the extent of the deletion.
TABLE 2.
Expression levels of 1p36-related miRNAsa
| Meningioma sample | 1p36b | Expressionc |
|
|---|---|---|---|
| miR-200a | miR-429 | ||
| NF2 deleted | |||
| XT 3731 | − | −6.21 | 1.05 |
| XT 3871 | + | −4.52 | 1.27 |
| XT 4263 | − | −4.27 | 1.96 |
| XT 3633 | + | −5.72 | 2.15 |
| XT 3009 | + | −4.02 | 0.76 |
| XT 1670 | + | −4.82 | −1.62 |
| XT 4173 | − | −2.56 | 1.43 |
| NF2 not deleted | |||
| XT 3771 | + | −0.56 | 1.08 |
| XT 3858 | + | 1.27 | −2.61 |
| XT 2455 | + | 1.52 | 1.12 |
| XT 2977 | + | −5.93 | 1.72 |
| XT 2994 | + | −6.31 | 1.37 |
| XT 3002 | + | 0.82 | 1.14 |
| XT 3016 | + | 1.13 | 1.22 |
| Controls | + | 1 | 1 |
Individual meningioma samples were typed with respect to deletion of chromosome 1 and >2-fold downregulation of miR-200a or miR-429 relative to arachnoidal tissue levels.
−, deletion; +, no deletion.
−, downregulation.
FIG. 14.
RT-PCR analysis of miRNAs in 1p36. qRT-PCRs for miR-200a, miR-200b, and miR-429 were performed on the RNA samples from meningioma tumors, including three with 1p36 deleted (XT3731, XT4263, and XT4173) and three without deletions (XT3771, XT2994, and XT1670), as well as three arachnoidal control tissues. (A) miR-200a. (B) miR-200b. (C) miR-429. The data were normalized to the level of U6 RNAs in each sample. The values are expressed as the mean ± SD. (D and E) To compare the effects of miR-200a, miR-200b, and miR-429 levels on meningioma cell growth, precursors for these miRNAs were transfected into SF443Gluc cells, and cell population growth and secreted Gluc luciferase activity were assessed as for Fig. 2A and C. (F) To monitor miRNA levels under these experimental conditions, we performed qRT-PCR for miR-200a, miR-200b, and miR-429. The data are shown as the means ± SD (***, P < 0.0001).
DISCUSSION
In this study, we defined a specific miRNA profile found in most sporadic benign human meningioma tumors. Among dysregulated miRNAs, miR-200a was one of the most downregulated in meningiomas compared to the arachnoidal tissues from which these tumors arise. Moreover, we found that miR-200a functions as a potential tumor suppressor by inhibiting Wnt/β-catenin signaling through two complementary mechanisms: direct targeting of the β-catenin mRNA, leading to reduced β-catenin levels, and targeting of the mRNAs for ZEB1 and SIP1 with consequent upregulation of E-cadherin levels and sequestration of β-catenin. Dysregulation of Wnt/β-catenin signaling and the E-cadherin cell adhesion system have been implicated as important events in the initiation and/or progression of several forms of cancer (3, 4, 16, 33, 34). These results provide insight into the mechanism by which reduced levels of miR-200a promote meningioma tumor growth through elevation of β-catenin and Wnt signaling, as well as reduction of E-cadherin.
To our knowledge, this is the first report analyzing the miRNA profiles of human meningioma tumors. This study focused on miR-200a, the most downregulated miRNA (about 25-fold) in 10 out of 14 meningioma tumors (7 with NF2 deleted and 7 without deletion). Elevation of miR-200a in meningioma cells reduced their apparent growth rate in culture via induction of apoptosis and suppressed tumor growth in vivo in a xenograft model. Recent studies showed that the members of the miR-200 family, including miR-200a, inhibit EMT as the initial step in tumorigenesis by directly targeting mRNAs for the transcriptional repressors ZEB1 and SIP1 (4, 12, 20, 32). Reduction of miR-200 members leads to increased levels of ZEB1 and SIP1, which bind to an E box in the promoter of the E-cadherin gene, thereby downregulating E-cadherin expression. Consistent with these previous reports, our studies showed that increased miR-200a levels act to downregulate the expression of ZEB1 and SIP1 in meningioma cells, with a commensurate increase in E-cadherin expression.
With respect to the role of miR-200a in β-catenin signaling, we found that miR-200a directly targets the 3′ UTR of β-catenin mRNA. To our knowledge, miR-200a is the first miRNA shown to be involved in the regulation of β-catenin levels. Given the wide role of Wnt/β-catenin signaling in many cancers, including colon cancer, hepatocellular carcinoma, melanoma, and ovarian and prostate cancers (33, 34), we presume that reduction in miR-200a may contribute to increased β-catenin signaling in other forms of cancer.
To investigate the downstream effect of miR-200a levels on β-catenin-responsive promoters, we overexpressed miR-200a in meningioma cells and monitored the activity of a promoter containing T-cell factor/lymphoid enhancer factor binding sites driving luciferase (Lenti-TOPFLASH [26]) in response to the Wnt ligand, mWnt3a. Overexpression of miR-200a strongly inhibited the response of this promoter to Wnt induction, and this suppression could be overcome with an antisense inhibitor of miR-200a. Moreover, we found that β-catenin overexpression via an expression vector, Ad-β-catenin, significantly overcame the growth inhibition caused by elevated miR-200a in meningioma cells. Taken together, these data suggest that low levels of miR-200a in meningioma cells activate Wnt signaling by increasing the levels of β-catenin mRNA and its availability to enter the nucleus and activate genes supporting the growth of meningioma tumors. Furthermore, our data suggest that miR-200a can act as a key “negative regulator” of the Wnt/β-catenin signaling pathway and hence a potential therapeutic agent, with elevation of miR-200a levels inhibiting the growth of meningioma tumors in a xenograft model. The stability of β-catenin in the cytoplasm is tightly regulated by a degradation complex containing adenomatous polyposis coli (APC), axin, casein kinase 1, and glycogen synthase kinase 3 that marks β-catenin for proteolytic destruction (16). Mutations in the APC gene lead to constant activation of Wnt/β-catenin signaling as one of the main players in cancer (13). Interestingly, in a recent report, miR-135a and -b were shown to target the 3′ UTR of the APC transcript and to suppress its expression in colon carcinoma (30). Thus, potentiation of β-catenin/Wnt signaling seems to be a critical step in cancer that can be regulated by miRNAs.
We also evaluated the role of miR-200a in the level and localization of β-catenin in normal primary human arachnoidal cells in culture as the cell of origin of meningioma tumors. When levels of miR-200a were decreased by transfection with a specific inhibitor, the levels of β-catenin increased, and its localization changed from primarily at the plasma membrane to a more cytoplasmic and nuclear location. This observation is consistent with loss of membranous β-catenin immunostaining in most human meningioma tumors (3). Together, these data implicate the downregulation of miR-200a in activation of Wnt/β-catenin signaling in the initial steps of tumorigenesis in meningiomas.
qRT-PCR analysis of β-catenin mRNA in human meningioma tumor samples demonstrated a significant inverse correlation between the levels of miR-200a and β-catenin mRNA. This increase in β-catenin mRNA levels in meningiomas appeared to have functional consequences, as the levels of a downstream target gene of the β-catenin nuclear complex, the cyclin D1 gene, were significantly elevated in meningioma tissue with low levels of miR-200a. On the other hand, we did not find a correlation between upregulation of c-myc, encoded by another β-catenin target gene, and downregulation of miR-200a in meningioma tissues (data not shown), possibly due to other modes of c-myc regulation in tumors (35).
Our findings also support a role for E-cadherin in miR-200a-mediated growth inhibition of meningioma cells, as an siRNA for the E-cadherin message substantially blocked growth inhibition of meningioma cells resulting from elevated miR-200a. Reduced expression of miR-200a increases the levels of the transcriptional repressors ZEB1 and SIP1, which in turn downregulate E-cadherin in meningiomas, as shown by immunohistochemistry of meningioma tumors (3, 41). E-cadherin levels were also low in arachnoidal tissue and meningioma tumors that had no decrease in miR-200a levels, so a deficiency in miR-200a expression appears to be only one of the factors responsible for the E-cadherin reduction in meningiomas.
The activity of the Wnt/β-catenin signaling pathway is mainly determined by the amount of β-catenin free in the cytoplasm versus that sequestered in the plasma membrane or APC degradation complex (28, 29). Decreased levels of E-cadherin in meningioma cells should thus make more β-catenin available in the cytoplasm/nucleus, at the same time possibly decreasing links between E-cadherin and the cytoskeleton. The latter effect should also reduce cell-to-cell adhesion of arachnoidal cells as part of the tumorigenesis process. Disruption of cell-cell communication through miR-200a downregulation may thus promote meningioma tumor growth and progression through both decreased E-cadherin and elevated β-catenin levels.
In conclusion, this study has defined an miRNA signature of benign meningioma tumors and demonstrated a key role for miR-200a downregulation in promoting the growth of these tumors. Reduced levels of miR-200a appear to contribute to tumorigenesis through two converging pathways mediated by upregulation of three mRNA targets. Those for ZEB1 and SIP1 lead to increased levels of these transcriptional repressors, which decreases the levels of E-cadherin in the tumors. Upregulation of a new β-catenin mRNA target for miR-200a, discovered in this study, results in more β-catenin being available to enter the nucleus and activate genes in the Wnt signaling pathway. These miR-200a-mediated tumorigenic processes are undoubtedly shared with other tumors and provide potential targets for therapeutic intervention.
Acknowledgments
This study was supported by Children's Tumor Foundation grants 2007-01-043 (O.S.) and 2005-01-004 (Y.S.), NINDS NS24279 (X.O.B., J.F.G., and A.O.S.-R.), NCI CA69246 (C.F. and X.O.B.) and CA86355 (X.O.B.), the Brain Tumor Society (A.M.K.), the American Brain Tumor Society (T.W.), and the Cancer League of Canton Zurich (C.F.) as well as Neurofibromatosis Inc.—New England and the S. Sydney De Young Foundation (J.F.G.).
We thank Anita Lal for meningioma cell lines SF4433 and SF4068. We also thank Casey A. Maguire for critical reading of the manuscript, Arda Mizrak for assistance, Suzanne McDavitt for skilled editorial assistance, and Applied Biosystems for supplying the miRNA qRT-PCR primers.
Footnotes
Published ahead of print on 24 August 2009.
REFERENCES
- 1.Ambros, V. 2004. The functions of animal microRNAs. Nature 431:350-355. [DOI] [PubMed] [Google Scholar]
- 2.Badr, C. E., J. W. Hewett, X. O. Breakefield, and B. A. Tannous. 2007. A highly sensitive assay for monitoring the secretory pathway and ER stress. PLoS ONE 2:e571. [DOI] [PMC free article] [PubMed] [Google Scholar]
- 3.Brunner, E. C., B. F. Romeike, M. Jung, N. Comtesse, and E. Meese. 2006. Altered expression of beta-catenin/E-cadherin in meningiomas. Histopathology 49:178-187. [DOI] [PubMed] [Google Scholar]
- 4.Burk, U., J. Schubert, U. Wellner, O. Schmalhofer, E. Vincan, S. Spaderna, and T. Brabletz. 2008. A reciprocal repression between ZEB1 and members of the miR-200 family promotes EMT and invasion in cancer cells. EMBO Rep. 9:582-589. [DOI] [PMC free article] [PubMed] [Google Scholar]
- 5.Calin, G. A., C. D. Dumitru, M. Shimizu, R. Bichi, S. Zupo, E. Noch, H. Aldler, S. Rattan, M. Keating, K. Rai, L. Rassenti, T. Kipps, M. Negrini, F. Bullrich, and C. M. Croce. 2002. Frequent deletions and down-regulation of micro-RNA genes miR15 and miR16 at 13q14 in chronic lymphocytic leukemia. Proc. Natl. Acad. Sci. USA 99:15524-15529. [DOI] [PMC free article] [PubMed] [Google Scholar]
- 6.Chan, J. A., A. M. Krichevsky, and K. S. Kosik. 2005. MicroRNA-21 is an antiapoptotic factor in human glioblastoma cells. Cancer Res. 65:6029-6033. [DOI] [PubMed] [Google Scholar]
- 7.Cheng, A. M., M. W. Byrom, J. Shelton, and L. P. Ford. 2005. Antisense inhibition of human miRNAs and indications for an involvement of miRNA in cell growth and apoptosis. Nucleic Acids Res. 33:1290-1297. [DOI] [PMC free article] [PubMed] [Google Scholar]
- 8.Cimmino, A., G. A. Calin, M. Fabbri, M. V. Iorio, M. Ferracin, M. Shimizu, S. E. Wojcik, R. I. Aqeilan, S. Zupo, M. Dono, L. Rassenti, H. Alder, S. Volinia, C. G. Liu, T. J. Kipps, M. Negrini, and C. M. Croce. 2005. miR-15 and miR-16 induce apoptosis by targeting BCL2. Proc. Natl. Acad. Sci. USA 102:13944-13949. [DOI] [PMC free article] [PubMed] [Google Scholar]
- 9.Cuevas, I. C., A. L. Slocum, P. Jun, J. F. Costello, A. W. Bollen, G. J. Riggins, M. W. McDermott, and A. Lal. 2005. Meningioma transcript profiles reveal deregulated Notch signaling pathway. Cancer Res. 65:5070-5075. [DOI] [PubMed] [Google Scholar]
- 10.Denli, A. M., B. B. Tops, R. H. Plasterk, R. F. Ketting, and G. J. Hannon. 2004. Processing of primary microRNAs by the Microprocessor complex. Nature 432:231-235. [DOI] [PubMed] [Google Scholar]
- 11.Fontaine, B., G. A. Rouleau, B. R. Seizinger, A. G. Menon, A. F. Jewell, R. L. Martuza, and J. F. Gusella. 1991. Molecular genetics of neurofibromatosis 2 and related tumors (acoustic neuroma and meningioma). Ann. N. Y. Acad. Sci. 61:338-343. [DOI] [PubMed] [Google Scholar]
- 12.Gregory, P. A., A. G. Bert, E. L. Paterson, S. C. Barry, A. Tsykin, G. Farshid, M. A. Vadas, Y. Khew-Goodall, and G. J. Goodall. 2008. The miR-200 family and miR-205 regulate epithelial to mesenchymal transition by targeting ZEB1 and SIP1. Nat. Cell Biol. 10:593-601. [DOI] [PubMed] [Google Scholar]
- 13.Huang, D., and X. Du. 2008. Crosstalk between tumor cells and microenvironment via Wnt pathway in colorectal cancer dissemination. World J. Gastroenterol. 14:1823-1827. [DOI] [PMC free article] [PubMed] [Google Scholar]
- 14.Huang, H., and X. He. 2008. Wnt/beta-catenin signaling: new (and old) players and new insights. Curr. Opin. Cell Biol. 20:119-125. [DOI] [PMC free article] [PubMed] [Google Scholar]
- 15.James, M. F., J. M. Lelke, M. Maccollin, S. R. Plotkin, A. O. Stemmer-Rachamimov, V. Ramesh, and J. F. Gusella. 2008. Modeling NF2 with human arachnoidal and meningioma cell culture systems: NF2 silencing reflects the benign character of tumor growth. Neurobiol. Dis. 29:278-292. [DOI] [PMC free article] [PubMed] [Google Scholar]
- 16.Jeanes, A., C. J. Gottardi, and A. S. Yap. 2008. Cadherins and cancer: how does cadherin dysfunction promote tumor progression? Oncogene 27:6920-6929. [DOI] [PMC free article] [PubMed] [Google Scholar]
- 17.Joachim, T., Z. Ram, Z. H. Rappaport, M. Simon, J. Schramm, O. D. Wiestler, and A. von Deimling. 2001. Comparative analysis of the NF2, TP53, PTEN, KRAS, NRAS and HRAS genes in sporadic and radiation-induced human meningiomas. Int. J. Cancer. 94:218-221. [DOI] [PubMed] [Google Scholar]
- 18.Kim, S. K., J. W. Nam, J. K. Rhee, W. J. Lee, and B. T. Zhang. 2006. miTarget: microRNA target gene prediction using a support vector machine. BMC Bioinform. 7:411. [DOI] [PMC free article] [PubMed] [Google Scholar]
- 19.Kleihues, P., P. C. Burger, and B. W. Scheithauer. 1993. The new W. H. O. classification of brain tumours. Brain Pathol. 3:255-268. [DOI] [PubMed] [Google Scholar]
- 20.Korpal, M., E. S. Lee, G. Hu, and Y. Kang. 2008. The miR-200 family inhibits epithelial-mesenchymal transition and cancer cell migration by direct targeting of E-cadherin transcriptional repressors ZEB1 and ZEB2. J. Biol. Chem. 283:14910-14914. [DOI] [PMC free article] [PubMed] [Google Scholar]
- 21.Krichevsky, A. M., K. S. King, C. P. Donahue, K. Khrapko, and K. S. Kosik. 2003. A microRNA array reveals extensive regulation of microRNAs during brain development. RNA 9:1274-1281. [DOI] [PMC free article] [PubMed] [Google Scholar]
- 22.Leone, P. E., M. J. Bello, J. M. de Campos, J. Vaquero, J. L. Sarasa, A. Pestaña, and J. A. Rey. 1999. NF2 gene mutations and allelic status of 1p, 14q and 22q in sporadic meningiomas. Oncogene 18:2231-2239. [DOI] [PubMed] [Google Scholar]
- 23.Ma, L., J. Teruya-Feldstein, and R. A. Weinberg. 2007. Tumour invasion and metastasis initiated by microRNA-10b in breast cancer. Nature 449:682-688. [DOI] [PubMed] [Google Scholar]
- 24.Meng, F., R. Henson, H. Wehbe-Janek, K. Ghoshal, S. T. Jacob, and T. Patel. 2007. MicroRNA-21 regulates expression of the PTEN tumor suppressor gene in human hepatocellular cancer. Gastroenterology 133:647-658. [DOI] [PMC free article] [PubMed] [Google Scholar]
- 25.Menon, A. G., J. F. Gusella, and B. R. Seizinger. 1990. Progress toward the isolation and characterization of the genes causing neurofibromatosis. Brain Pathol. 1:33-40. [DOI] [PubMed] [Google Scholar]
- 26.Minami, Y., S. A. Stuart, T. Ikawa, Y. Jiang, A. Banno, I. C. Hunton, D. J. Young, T. Naoe, C. Murre, C. H. Jamieson, and J. Y. Wang. 2008. BCR-ABL-transformed GMP as myeloid leukemic stem cells. Proc. Natl. Acad. Sci. USA 105:17967-17972. [DOI] [PMC free article] [PubMed] [Google Scholar]
- 27.Monticelli, S., K. M. Ansel, D. U. Lee, and A. Rao. 2005. Regulation of gene expression in mast cells: micro-RNA expression and chromatin structural analysis of cytokine genes. Novartis Found. Symp. 271:179-187. [PubMed] [Google Scholar]
- 28.Moon, R. T., B. Bowerman, M. Boutros, and N. Perrimon. 2002. The promise and perils of Wnt signaling through beta-catenin. Science 296:1644-1646. [DOI] [PubMed] [Google Scholar]
- 29.Moon, R. T., A. D. Kohn, G. V. De Ferrari, and A. Kaykas. 2004. WNT and beta-catenin signalling: diseases and therapies. Nat. Rev. Genet. 5:691-701. [DOI] [PubMed] [Google Scholar]
- 30.Nagel, R., C. le Sage, B. Diosdado, M. van der Waal, J. A. Oude Vrielink, A. Bolijn, G. A. Meijer, and R. Agami. 2008. Regulation of the adenomatous polyposis coli gene by the miR-135 family in colorectal cancer. Cancer Res. 68:5795-5802. [DOI] [PubMed] [Google Scholar]
- 31.Nunes, F., Y. Shen, Y. Niida, R. Beauchamp, A. O. Stemmer-Rachamimov, V. Ramesh, J. Gusella, and M. MacCollin. 2005. Inactivation patterns of NF2 and DAL-1/4.1B (EPB41L3) in sporadic meningioma. Cancer Genet. Cytogenet. 162:135-139. [DOI] [PubMed] [Google Scholar]
- 32.Park, S. M., A. B. Gaur, E. Lengyel, and M. E. Peter. 2008. The miR-200 family determines the epithelial phenotype of cancer cells by targeting the E-cadherin repressors ZEB1 and ZEB2. Genes Dev. 22:894-907. [DOI] [PMC free article] [PubMed] [Google Scholar]
- 33.Peifer, M., and P. Polakis. 2000. Wnt signaling in oncogenesis and embryogenesis—a look outside the nucleus. Science 287:1606-1609. [DOI] [PubMed] [Google Scholar]
- 34.Polakis, P. 2000. Wnt signaling and cancer. Genes Dev. 14:1837-1851. [PubMed] [Google Scholar]
- 35.Prochownik, E. V. 2008. c-Myc: linking transformation and genomic instability. Curr. Mol. Med. 8:446-458. [DOI] [PubMed] [Google Scholar]
- 36.Rouleau, G. A., P. Merel, M. Lutchman, M. Sanson, J. Zucman, C. Marineau, K. Hoang-Xuan, S. Demczuk, C. Desmaze, and B. Plougastel. 1993. Alteration in a new gene encoding a putative membrane-organizing protein causes neuro-fibromatosis type 2. Nature 363:515-521. [DOI] [PubMed] [Google Scholar]
- 37.Saydam, O., D. L. Glauser, I. Heid, G. Turkeri, M. Hilbe, A. H. Jacobs, M. Ackermann, and C. Fraefel. 2005. Herpes simplex virus 1 amplicon vector-mediated siRNA targeting epidermal growth factor receptor inhibits growth of human glioma cells in vivo. Mol. Ther. 12:803-812. [DOI] [PubMed] [Google Scholar]
- 38.Shen, Y., D. T. Miller, S. W. Cheung, V. Lip, X. Sheng, K. Tomaszewicz, H. Shao, H. Fang, H. S. Tang, M. Irons, C. A. Walsh, O. Platt, J. F. Gusella, and B. L. Wu. 2007. Development of a focused oligonucleotide-array comparative genomic hybridization chip for clinical diagnosis of genomic imbalance. Clin. Chem. 53:2051-2053. [DOI] [PubMed] [Google Scholar]
- 39.Simon, M., A. von Deimling, J. J. Larson, R. Wellenreuther, P. Kaskel, A. Waha, R. E. Warnick, J. M. J. Tew, and A. G. Menon. 1995. Allelic losses on chromosomes 14, 10, and 1 in atypical and malignant meningiomas: a genetic model of meningioma progression. Cancer Res. 55:4696-4701. [PubMed] [Google Scholar]
- 40.Tannous, B. A., D. E. Kim, J. L. Fernandez, R. Weissleder, and X. O. Breakefield. 2005. Codon-optimized Gaussia luciferase cDNA for mammalian gene expression in culture and in vivo. Mol. Ther. 11:435-443. [DOI] [PubMed] [Google Scholar]
- 41.Tohma, Y., T. Yamashima, and J. Yamashita. 1992. Immunohistochemical localization of cell adhesion molecule epithelial cadherin in human arachnoid villi and meningiomas. Cancer Res. 52:1981-1987. [PubMed] [Google Scholar]
- 42.Trofatter, J. A., M. M. MacCollin, J. L. Rutter, J. R. Murrell, M. P. Duyao, D. M. Parry, R. Eldridge, N. Kley, A. G. Menon, and K. Pulaski. 1993. A novel moesin-, ezrin-, radixin-like gene is a candidate for the neurofibromatosis 2 tumor suppressor. Cell 72:791-800. [DOI] [PubMed] [Google Scholar]
- 43.Tusher, V. G., R. Tibshirani, and G. Chu. 2001. Significance analysis of microarrays applied to the ionizing radiation response. Proc. Natl. Acad. Sci. USA 98:5116-5121. [DOI] [PMC free article] [PubMed] [Google Scholar]
- 44.Volinia, S., G. A. Calin, C. G. Liu, S. Ambs, A. Cimmino, F. Petrocca, R. Visone, M. Iorio, C. Roldo, M. Ferracin, R. L. Prueitt, N. Yanaihara, G. Lanza, A. Scarpa, A. Vecchione, M. Negrini, C. C. Harris, and C. M. Croce. 2006. A microRNA expression signature of human solid tumors defines cancer gene targets. Proc. Natl. Acad. Sci. USA 103:2257-2261. [DOI] [PMC free article] [PubMed] [Google Scholar]
- 45.Weber, R. G., J. Boström, M. Wolter, M. Baudis, V. P. Collins, G. Reifenberger, and P. Lichter. 1997. Analysis of genomic alterations in benign, atypical, and anaplastic meningiomas: toward a genetic model of meningioma progression. Proc. Natl. Acad. Sci. USA 94:14719-14724. [DOI] [PMC free article] [PubMed] [Google Scholar]
- 46.Yi, M., J. D. Horton, J. C. Cohen, H. H. Hobbs, and R. M. Stephens. 2006. WholePathwayScope: a comprehensive pathway-based analysis tool for high-throughput data. BMC Bioinform. 7:30. [DOI] [PMC free article] [PubMed] [Google Scholar]


