Abstract
Tyrosine kinases and phosphatases establish the crucial balance of tyrosine phosphorylation in cellular signaling, but creating specific inhibitors of protein Tyr phosphatases (PTPs) remains a challenge. Here we report the development of a potent, selective inhibitor of Mycobacterium tuberculosis PtpB, a bacterial PTP that is secreted into host cells where it disrupts unidentified signaling pathways. The inhibitor, (oxalylamino-methylene)-thiophene sulfonamide (OMTS), showed an IC50 of 440 +/− 50 nM and >60-fold specificity for PtpB over six human PTPs. The 2-Å resolution crystal structure of PtpB in complex with OMTS revealed a large rearrangement of the enzyme, with some residues shifting >27 Å relative to the PtpB:PO4 complex. Extensive contacts with the catalytic loop provide a potential basis for inhibitor selectivity. Two OMTS molecules bound adjacent to each other, raising the possibility of a second substrate phosphotyrosine binding site in PtpB. The PtpB:OMTS structure provides an unanticipated framework to guide inhibitor improvement.
Keywords: inhibitor recognition, conformational changes, PTP inhibitors, entropy-driven binding
Introduction
Tyrosine phosphorylation broadly regulates the physiology of eukaryotic cells. While pharmaceuticals targeting tyrosine kinases are already on the market, development of drugs that target any of the 85 human protein tyrosine phosphatases (PTPs) is at an earlier stage. Given the diverse roles of phosphatases in cellular homeostasis, inhibitor specificity is crucial to minimize side effects. Two approaches to developing PTP inhibitors have been reported. One recent strategy relies on natural products to guide inhibitor development (Noren-Muller et al., 2006). In contrast, many synthetic PTP inhibitors are based on a pTyr mimetic as the central building block (Bialy and Waldmann, 2005). This latter approach has the advantage that it is relatively easy to find starting points for inhibitors. However, the phosphotyrosine mimetic poses a challenge to introduce sufficient selectivity, because the phosphotyrosine binding pockets of different PTP enzymes are similar. This problem is reinforced by the observation that isolated PTP catalytic domains often exhibit modest substrate specificity, with cellular localization and the activities of appended substrate-binding domains enhancing selectivity in vivo (Barford et al., 1998).
The central roles of PTPs in eukaryotic signaling are exploited by some pathogenic bacteria, which produce and secrete PTPs to attenuate host immune defenses (DeVinney et al., 2000). To explore approaches to develop selective inhibitors against such bacterial PTPs, we targeted the PtpB enzyme that functions as a key secreted virulence factor in Mycobacterium tuberculosis (Mtb). Tuberculosis is a major cause of worldwide mortality from infectious disease, prompting a search for innovative targets for therapeutics. New targets are needed not only to speed the course of treatment, but also to attack emerging multidrug-resistant Mtb strains (Nachega and Chaisson, 2003) and to treat tuberculosis in AIDS patients.
Among the proteins secreted into the host cell by Mtb are PtpA and PtpB, which are thought to interfere with host signaling pathways. Importantly, the genetic knockout of ptpB attenuated growth of Mtb in activated macrophages and guinea pigs (Singh et al., 2003). This study implies that a specific PtpB inhibitor may speed treatment by enabling macrophages to target the intracellular reservoirs of the bacterium that remain after treatment with current drugs.
The crystal structure of the PtpB:PO4 product complex established this enzyme as a member of a novel subfamily of “conventional” tyrosine phosphatases that exclusively act on phosphotyrosine (Grundner et al., 2005). The conventional PTPs include other bacterial virulence factors, such as YopH from Yersinia spec., as well as hundreds of eukaryotic enzymes. Conventional PTPs share core structural features, such as a catalytic domain containing a four-stranded parallel β sheet that connects to a helix through the so-called P-loop. The P-loop harbors the catalytic cysteine nucleophile within the invariant sequence HCX5R. Other residues important for catalysis are found in PTPs with varying degrees of conservation, among them the WPD loop containing the general acid and the pTyr recognition loop (the Q loop) that coordinates the substrate pTyr and a catalytic water molecule (Barford et al. 1998). Most PTPs also contain cellular localization signals that regulate their activity and confer tighter substrate specificity (Barford et al., 1998).
The structure of the Mtb PtpB:PO4 complex revealed two major differences from this standard architecture that might be exploited to develop selective inhibitors. First, PtpB lacks a targeting domain, suggesting that substrate specificity is determined by direct interactions of the catalytic domain. Second, the PtpB:PO4 structure revealed an unexpected two-helix lid that completely covered the active site and blocked substrate turnover in the crystals (Grundner et al., 2005). The enzyme is active in solution, however, suggesting that the lid opens readily to permit ligand binding and release. Because reversible oxidation of the catalytic cysteine has emerged as a potentially general mechanism of PTP regulation (Salmeen et al., 2003; Groen et al., 2004), we hypothesized that the PtpB lid might protect Cys160 from inactivation by reactive oxygen and nitrogen species released in macrophages during the oxidative burst (Grundner et al. 2005). This hypothesis was supported by the observation that PtpB resists oxidative inactivation better than PtpA or other phosphatases that do not have a comparable lid. The PtpB:PO4 structure identified autoinhibition as the crucial feature determining PtpB function, but revealed little about the mechanism by which substrates access the active site. Due to the disorder of a ∼30-residue loop, the previous structure also fell short of fully defining the active site cavity.
Here we describe the structure and the molecular mechanism of recognition of a novel competitive inhibitor of PtpB, (oxalylamino-methylene)-thiophene sulfonamide (OMTS). The crystal structure of PtpB in complex with OMTS reveals that the enzyme undergoes a large conformational change, allowing the inhibitor to bind deep in the active site pocket. Compared to the PtpB:PO4 complex, there are two major changes. First, inhibitor binding promotes a large hinge motion of one helix in the lid to form a hydrophobic hairpin and a channel that leads to the catalytic cysteine. Second, the 30-residue, disordered loop folds to form a new helix bordering the active site. Unexpectedly, two molecules of OMTS bound one molecule of PtpB in solution and in the crystal structure. The binding of two phosphotyrosine (pTyr) mimetics is reminiscent of binding of peptides containing two phosphotyrosines to PTP1B and PTPL1 (Puius et al., 1997, Villa et al., 2005) and raises the possibility of a second pTyr binding site on PtpB.
Results
Inhibitor design and binding properties
The structural conservation of the PtpB active site led us to search for inhibitors based on scaffolds previously used to target eukaryotic PTPs. Initial hits were identified in a screen of a library of oxamic acid derivatives using a homogeneous plate assay (D. Swinnen et al., manuscript in preparation). OMTS (Figure 1A) inhibited PtpB with an IC50 value of 0.44 ± 0.05 μM (Figure 1B), but was not effective against a panel of three human PTPs (Figure 1B). At the highest concentration tested (30 μM), OMTS was inactive on PTP1B (5% inhibition) and displayed only 45% inhibition of Glepp1. On a broader panel of phosphatases tested at 10 μM inhibitor where PtpB was 95% inhibited, OMTS showed less than 10% inhibition not only on PTP1B and Glepp1 but also on PTPβ, PTP-H1 and PAC1 (Figure 1C).
Figure 1. Inhibitory activity of OMTS on phosphatases.
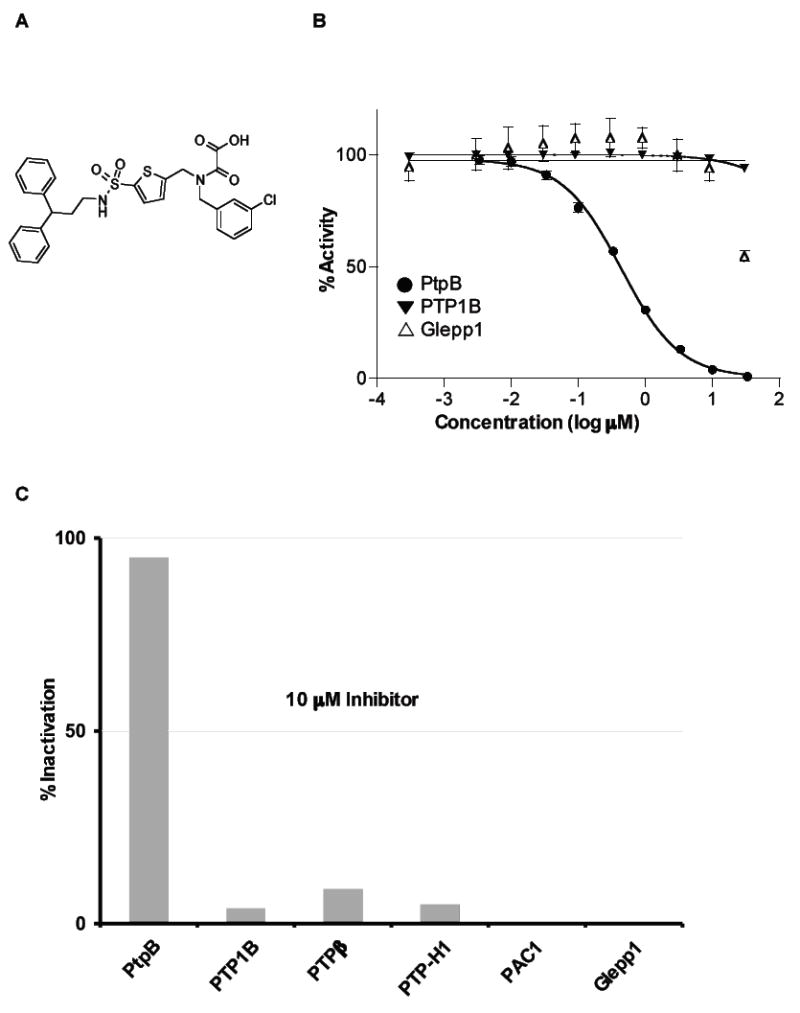
(A) Structure of OMTS.
(B) IC50 determination. Inhibitory activity of increasing concentrations of OMTS was assessed on PtpB, Glepp1 and PTP1B phosphatases. Mean values and standard deviations are represented. An IC50 value for PtpB of 0.44 μM was calculated from this experiment.
(C) Selectivity of OMTS on a panel of phosphatases. Results are expressed as percent inhibition at 10 μM OMTS.
The mode of PtpB inhibition by OMTS was determined in a competition study, varying simultaneously the substrate and inhibitor concentrations. The compound behaved as a classic competitive inhibitor (Figures 2A and 2B), affecting the apparent Km value while Vmax was unchanged. An apparent Ki value of 0.33 ± 0.04 μM was calculated from these experiments.
Figure 2. Inhibition kinetics.
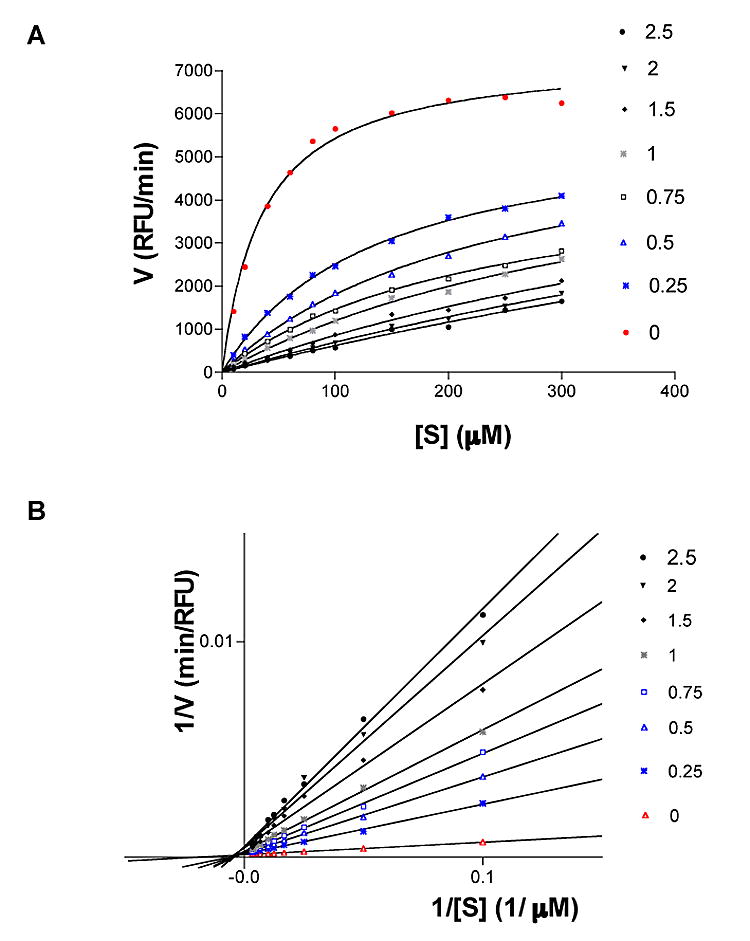
(A) Michaelis-Menten representation of PtpB inhibition. RFU: Relative fluorescence units.
(B) Lineweaver-Burk representation of PtpB activity at increasing concentrations of inhibitor. Both representations indicate that OMTS is a competitive inhibitor of PtpB.
PtpB:OMTS structure determination
In the PtpB:PO4 complex, a lid comprising helices α7, α8 and the connecting loop completely sequestered the active site from solvent (Grundner et al., 2005). Because it was unlikely that the crystal lattice of the PtpB:PO4 complex could accommodate inhibitor binding, we initiated a screen for new crystallization conditions. The PtpB:OMTS complex produced a new crystal form with two enzyme molecules in the asymmetric unit. The structure of the complex was determined by molecular replacement and refined to R/Rfree values of 0.189/0.249 at 2 Å resolution (Table 1 and Figure 3). The two independent copies of PtpB adopted similar structures with a root mean square deviation (rmsd) between Cα atoms of 0.56 Å. The final model includes residues 4–104 and 112–276 for molecule A and residues 4–104 and 117–276 for molecule B. No clear electron density was visible for residues 105–111 and 105–116 for molecules A and B, respectively. For each PtpB chain, two inhibitor molecules were built into well-defined electron density, and 421 ordered waters were modeled in the asymmetric unit.
Table 1.
Data collection and refinement statistics.
|
| |
| Data collection and phasing
| |
| Crystal symmetry | P212121 |
| Unit cell | a= 74.4 |
| b= 72.5 | |
| c= 96.1 | |
| α=β=γ=90° | |
| Resolution (Å) | 50−2.0 |
| Completeness (%) | 97.1 (79.6) |
| Multiplicity | 3.6 (1.9) |
| Rmerge (%)a | 3.4 |
| ‹I/σI› | 30.1 (7.0) |
| Mosaicity (°) | 0.299 |
|
| |
| Refinement
| |
| Resolution (Å) | 50−2 |
| Reflections | 34,740 |
| Rcrystb / Rfree (%) | 18.9/ 24.9 |
| Rms Δ bondsc (Å) | 0.013 |
| Rms Δ anglesc (°) | 1.5 |
| Average B-factor (Å2) | 14.4 |
| Main-chain dihedral angles (%) | |
| Most favored | 90.8 |
| Allowed | 9.2 |
Parentheses denote values for the highest resolution shell.
; I, intensity.
; Fo, observed structure-factor amplitude; Fcalc, calculated structure-factor amplitude.
Root mean square deviations from ideal values.
Figure 3. Overall structure of the PtpB:OMTS complex.
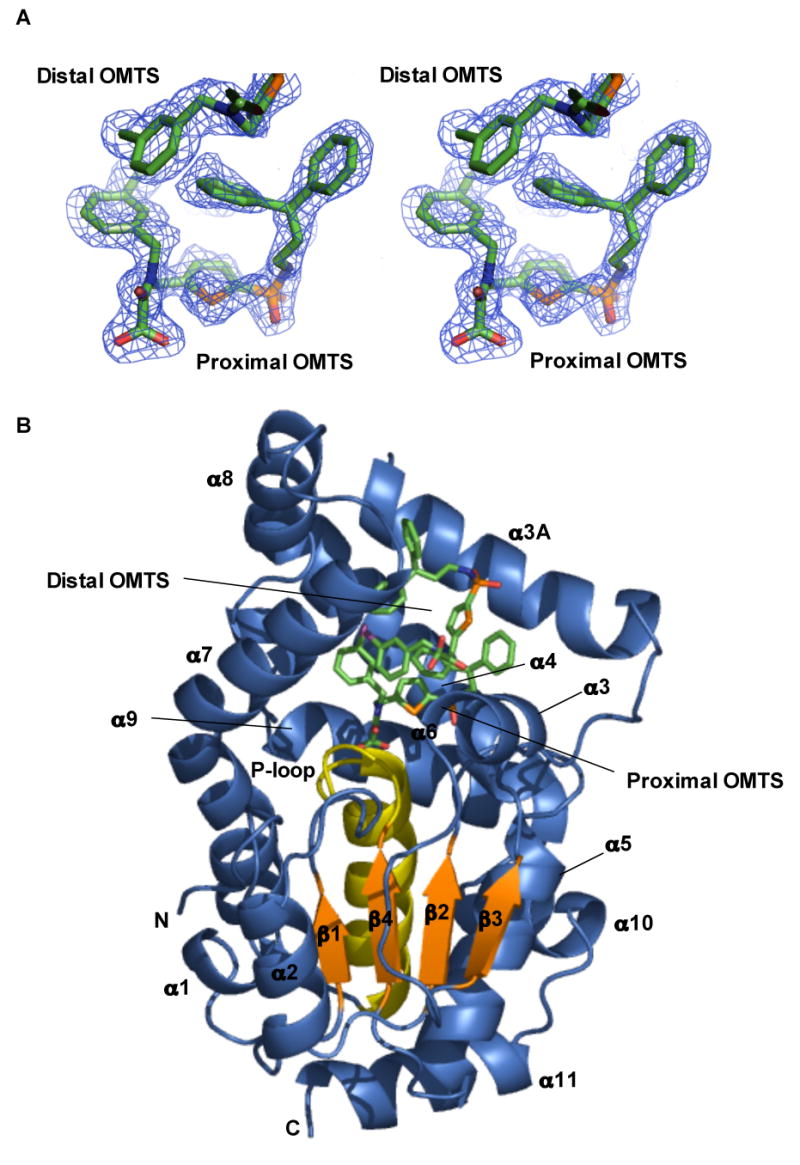
(A) Stereo representation of the simulated-annealing, Fo-Fc omit map of OMTS bound in the PtpB active site contoured at 3 σ. Electron density for the proximal and the chlorobenzyl group of the distal OMTS is shown.
(B) Two molecules of OMTS bind in the PtpB active site. Helix α8, part of the autoinhibitory lid, rotated around Ser228 by ∼90° to open the active site. Residues 88–103 form helix α3A not seen in the PtpB:PO4 structure. Helices α3, α3A, α4 and the α7–α8 hairpin ring the active-site cavity.
Conformational changes in the PtpB:OMTS complex
Compared to the closed structure of the PO4 complex (PDB ID 1YWF), the structure of the PtpB:OMTS complex showed three major structural differences. Most notably, a large, en bloc movement of helix α8 created a paddle-like helical hairpin (α7–α8) with an exposed hydrophobic surface extending away from the catalytic domain (Figures 4A, 5A, and 5B). Second, residues 85–104, which were disordered in the PtpB:PO4 complex crystals, formed a new α-helix (called α3A) adjacent to the active site pocket (Figure 5C). Third, formation of helix α3A also inverted the adjacent WPD loop (FPD in PtpB) that contains a conserved Asp residue that functions as a general acid in PTPs. The loop projects in the opposite direction from that in the PtpB:PO4 complex (Figure 5C).
Figure 4. Interactions between OMTS and PtpB.
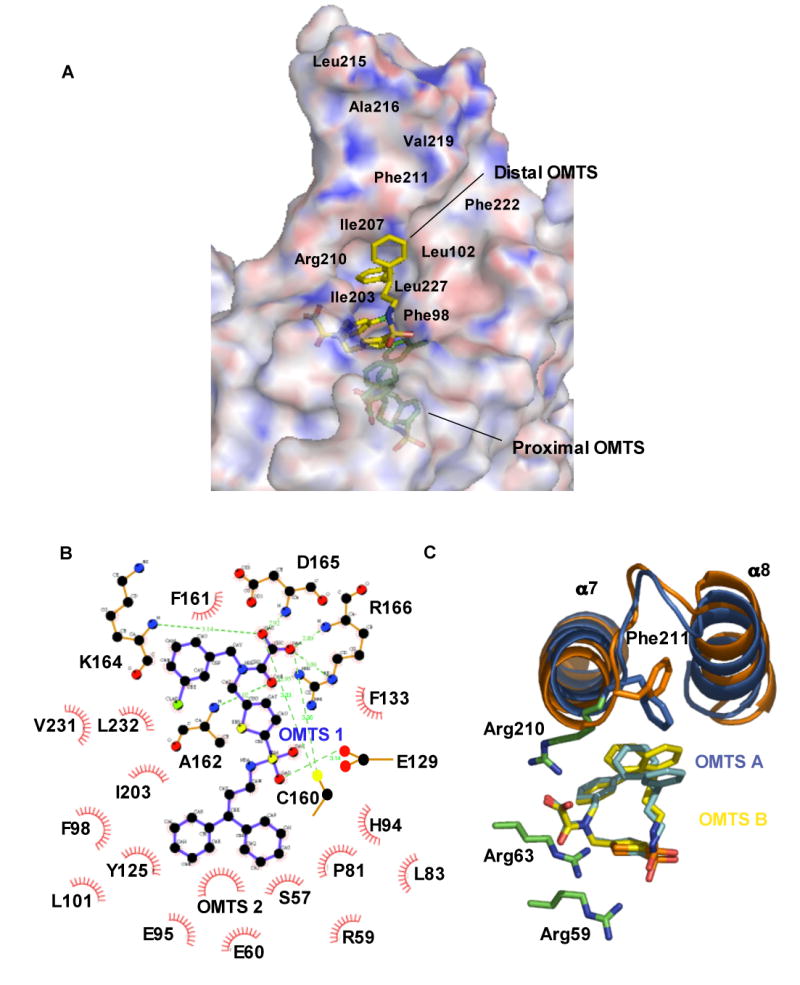
(A) Electrostatic surface representation of PtpB generated with APBS (Baker et al., 2001. Blue: positive potential, red: negative potential) and stick representation of the inhibitors shows the depth of the active-site cleft. The distal OMTS molecule is more exposed, while the inhibitor proximal to Cys160 is buried. The approximate locations of hydrophobic residues lining the surface of the helix-α7–α8 hairpin are indicated.
(B) Schematic drawing of interactions between the proximal inhibitor and the PtpB catalytic site (generated with LIGPLOT and edited manually). Water 391 contacting the sulfonyl group was omitted. Over 20 PtpB residues contact the proximal inhibitor.
(C) The distal inhibitor binds with the oxamic acid group surrounded by Arg side chains. This cluster of Arg side chains provides a chemically reasonable site for the binding of a second pTyr residue to PtpB. Differences between the structures of the distal inhibitors in the two complexes in the asymmetric unit are shown.
Figure 5. Movement of helix α8 allows access to the active site.
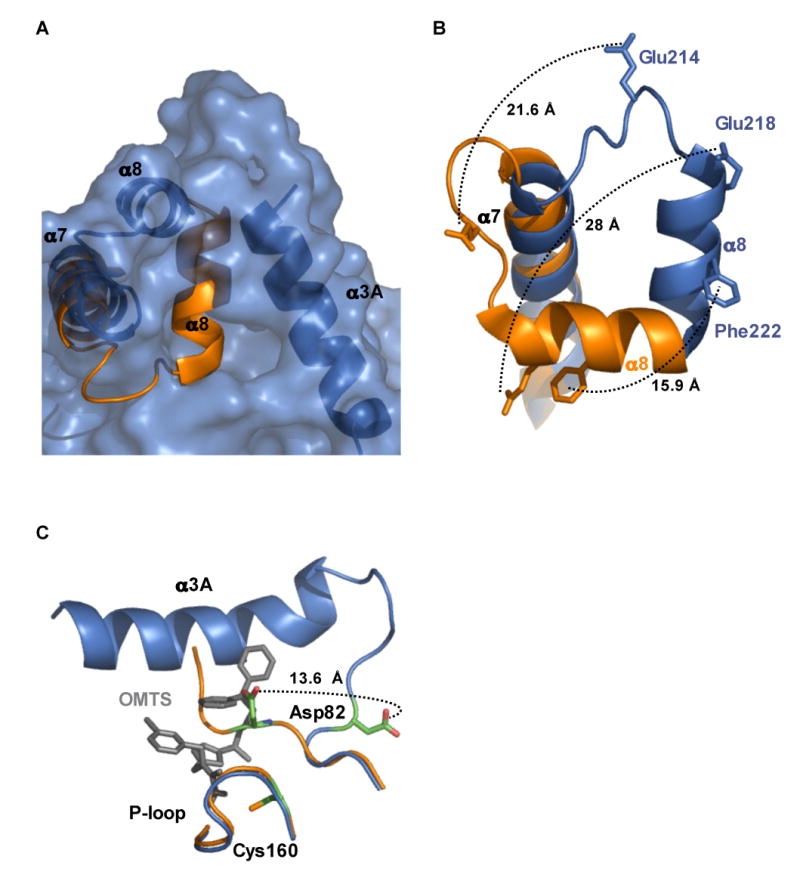
(A) Surface representation of the PtpB:OMTS structure (blue) shows the opening to the active site and the position of helix α3A that blocks access to the active site in the PtpB:PO4 structure (orange).
(B) Movement of selected residues in helix α8 upon inhibitor binding. Many residues buried in the PtpB:PO4 complex are exposed upon OMTS binding. Phe222, which mimics the substrate pTyr side chain in the autoinhibited PtpB:PO4 complex, shifts almost 16 Å. Glu218, which forms a salt bridge with the conserved, PO4-liganding Arg166 in the P-loop, moves almost 28 Å in the PtpB:OMTS complex.
(C) Helix α3A folds and the WPD loop flips upon inhibitor binding. The general acid Asp82 moves by >13 Å in the PtpB:OMTS complex (blue) compared to the product complex (orange). The new helix α3A (blue) and the proximal inhibitor (grey) clash with the WPD loop of the closed structure (orange).
In the PtpB:PO4 complex, the closed lid made many intramolecular interactions with the rest of the protein, including salt bridges (Glu214:Arg63, Glu218:Arg166, Lys224:Asp85, and Asp229:Arg200) and hydrophobic contacts exemplified by the burial of Phe222. The superposition of the PtpB:PO4 and the PtpB:OMTS structures revealed that a ∼90° rotation of helix α8 around Ser228 eliminated all of these contacts (Figures 5A and B). This shift projected helix α8 against helix α7 and created an opening to the active-site cysteine. This rotation moved the tip of helix α8 by ∼20 Å from its position in the closed state. Several side chains that are deeply buried in the closed structure (e.g. Glu218 and Phe222) moved up to 28 Å (Figure 5B).
The C-terminus of helix α7 was pulled slightly (∼2 Å) towards the active site by the rotation of helix α8. These movements exposed a large hydrophobic surface on the face of the α7–α8 hairpin that lines one side of the entrance to the active site (Ile203, Ile207, Thr213, Phe211, Leu215, Val219, Val220 (Figure 4A)). With the lid in this position, the inhibitors filled the narrow channel to the catalytic Cys160, and this close fit of OMTS in the channel makes it apparent that additional conformational changes would be needed for the inhibitor molecules to bind and release.
In the PtpB:PO4 complex, no interpretable electron density was visible for the entire region between Asp85 and Gln116. The large conformational changes upon OMTS binding were accompanied by the formation of a helix α3A encompassing residues Asp88 to Thr103. The position of helix α8 in the closed structure partially overlaps with the position of the C-terminus of the new helix α3A of the PtpB:OMTS complex, suggesting that these conformational elements are mutually exclusive. Helix α3A packs on top of helix α4 and forms the side of the active-site cavity, deepening the pocket to ∼20 Å from the helix backbone to the catalytic Cys160. Formation of helix α3A reveals the full extent of the active-site cavity, which is ringed by helices α3, helix α3A and the α7–α8 hairpin (Figure 3B).
Inhibitor binding was associated with a change in conformation of the Asp82 in the FPD loop compared to the closed PtpB:PO4 complex (Figure 5C). The formation of the helix α3A, which immediately follows the FPD loop, is probably coupled to the rearrangement in the loop. In the PtpB:OMTS complex, Pro81 was flipped by, and this change positioned the general acid Asp82 away from the active site. Asp82 moved over 13 Å from its position in the closed structure (Figure 5C).
To investigate the folding transition of helix α3A in solution, we probed the sensitivity of the protein to limited proteolysis. OMTS binding led to an overall protection of PtpB from proteolysis (Figure 6). Trypsin and thermolysin were predicted to cleave PtpB at positions within helix α3A, producing proteolytic fragments of ∼11 and ∼19 kD. When limited proteolysis of PtpB was carried out in the absence of inhibitor, the two expected fragments were readily generated (Figure 6). Mass spectrometry (data not shown) confirmed that these fragments arose from cleavages in the β3–α4 loop, which was disordered in the crystal structure of the PtpB:PO4 complex. Production of the two fragments peaked after ∼30 minutes incubation with trypsin and after ∼2 hr with thermolysin. When proteolysis was performed in the presence of 1 mM OMTS, the cleavage of helix α3A was inhibited. Trypsin cleavage in the β3–α4 loop peaked after 3 hours and thermolysin cleavage required an overnight incubation at 37°C (Figure 6A and data not shown). OMTS protected PtpB from thermolysin cleavage in the β3–α4 loop in a concentration-dependent manner (Figure 6B). This protection suggests that inhibitor binding stabilizes and promotes folding of helix α3A.
Figure 6. OMTS protects the β3–α4 loop of PtpB from proteolysis.
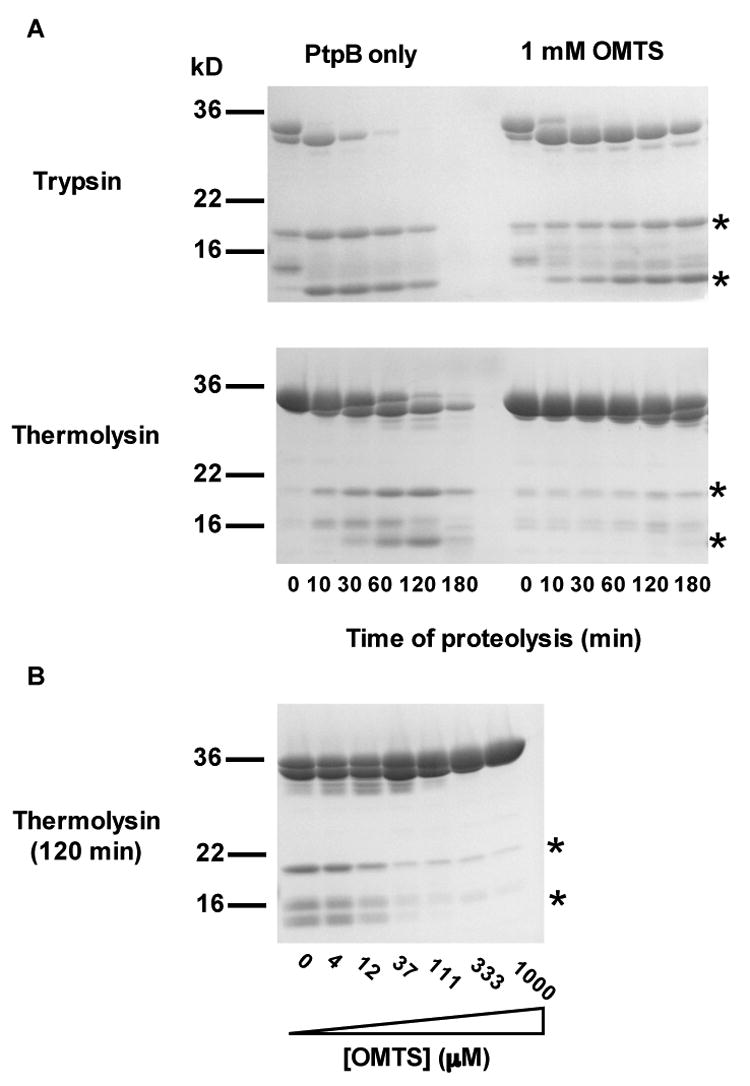
(A) SDS PAGE gels show the course of partial proteolytic cleavage with trypsin (top) and thermolysin (bottom) in the absence (left) and presence (right) of 1 mM OMTS. The generation of the cleavage products at 11 and 19kD (asterisks) is inhibited by the presence of OMTS. Mass spectrometry of these bands extracted from the gels showed that these products result from cleavage at sites in the β3–α4 loop (data not shown). OMTS slowed cleavage of this segment by both proteases, consistent with the folding of helix α3A in the PtpB:OMTS structure. A fragment of slightly smaller molecular mass than PtpB resulted from cleavage of the six-histidine tag.
(B) PtpB cleavage by thermolysin is inhibited with increasing OMTS concentration.
Inhibitor interactions with PtpB
Unexpectedly, two molecules of the inhibitor bound in the active site, in direct contact with each other (Figure 3). The inhibitor proximal to the catalytic Cys160 was completely buried. The second, distal inhibitor was wedged in by the newly formed helix α3A and helices α7 and α8. The proximal inhibitor bound in identical positions and made the same interactions in the two independent PtpB complexes in the asymmetric unit. The oxalylamino carboxyl group occupied the position of the PO4 in the PtpB:PO4 complex. The oxalylamino group formed six hydrogen bonds to Cys160, Ala162, Lys164, and Arg166 (Fig. 4B), and the negative charge of this pTyr mimetic also was complementary to the helix dipole of helix α5. The inhibitor sulfonyl group formed another hydrogen bond to the buried water 391. The proximal inhibitor was surrounded by PtpB, making contacts with over 20 residues of the enzyme (Figures 4A and 4B), including the entire P-loop (residues 160–166).
The two inhibitor molecules formed an extensive hydrophobic network with aromatic side chains and each other. The two inhibitors contacted each other through an edge-to-face interaction of the chlorobenzyl groups. In addition, the terminal benzyl groups of the proximal inhibitor interacted with the thiophene group of the distal inhibitor (Fig. 3A). The distal inhibitor looped over Phe98, projecting from the newly formed helix α3A toward the active site. The oxalylamino group bound in a positively charged pocket bordered by three Arg side chains (Arg59, Arg64 and Arg210; Figure 4C). Binding of the distal inhibitor differed slightly between molecules A and B, which reflected differences in intermolecular contacts in the crystals (Figure 4C). As a result of the different crystal contacts, the Phe211 side chains in the α7–α8 helical hairpin adopted different rotamers in the two PtpB molecules. The distal inhibitor makes overall fewer interactions than the proximal one. The oxalylamino carboxyl group formed two hydrogen bonds with Arg210, and Arg59 formed another hydrogen bond to the sulfonyl group. The terminal benzyl groups made hydrophobic interactions with Phe98, Leu102, and Phe211.
The presence of the distal inhibitor in the PtpB:OMTS structure raised the question of whether two inhibitor molecules also bind in solution, particularly since the distal inhibitor participated in intermolecular crystal contacts. To determine the stoichiometry of OMTS binding in solution, we performed isothermal titration calorimetry (Figure 8). The data provided evidence for binding of two inhibitor molecules per protein, with apparent dissociation constants of 73 nM and 1.2 μM. Unexpectedly, the binding of the first inhibitor showed a positive enthalpy change at room temperature, indicating that the reaction is entropy driven. The binding of the second OMTS molecule showed a conventional, enthalpy-driven isotherm.
Figure 8. Binding characteristics of OMTS.
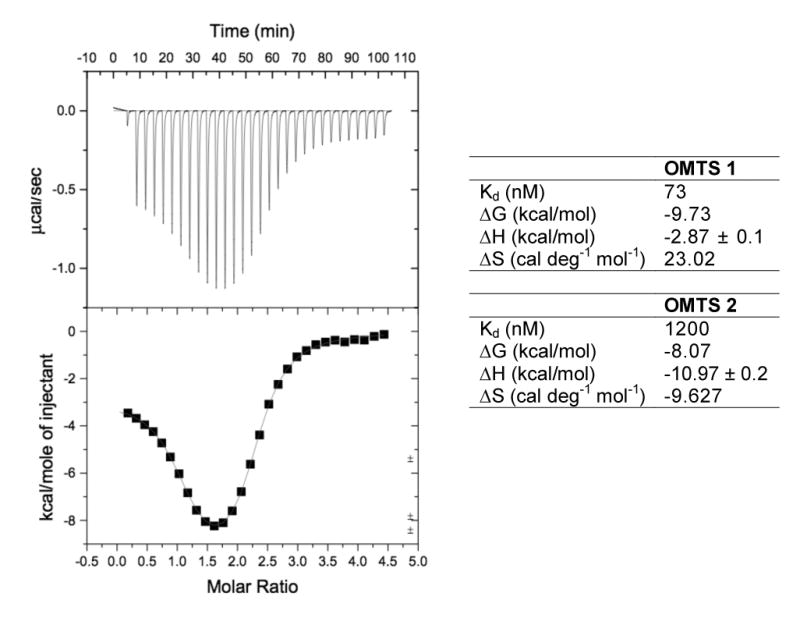
ITC data for the binding of OMTS to PtpB and fitting to a two binding site model. The biphasic fitting curve shows entropy-driven binding of the proximal, and enthalpy-driven binding of the distal OMTS. Thermodynamic parameters for the proximal (OMTS 1) and distal (OMTS 2) inhibitor at 25°C are given.
Discussion
The attenuated growth and virulence of a ptpB gene knockout strain of Mtb in IFNγ-stimulated macrophages and in guinea pigs afforded a compelling rationale to target PtpB to develop new drugs to treat TB (Singh et al., 2003). Moreover, PtpB also provides an attractive target because the enzyme functions outside the bacterium in the host cells, eliminating the need for inhibitors to traverse the relatively impermeable bacterial envelope. The structural similarities of PtpB and mammalian PTPs, as well as the discovery of chemically related inhibitors that target PtpB and mammalian PTPs (Noren-Muller et al., 2006), suggested that traditional chemical pTyr mimetics could be adapted to inhibit this bacterial homolog.
Here we identified a potent competitive inhibitor of PtpB based on the oxamic acid scaffold previously used to target mammalian PTPs. While many oxalylamino compounds bind PTPs relatively nonspecifically, OMTS showed >60 fold selectivity for PtpB over a panel of human PTPs (PTP1B, Pac1, Glepp1, and PTPH1). Inhibitor binding was associated with the folding of helix α3A and a large conformational change in helix α8 (Figure 5) that together established a deep channel to the active site. Helix α8 packed parallel to the end of α7, forming a paddle with an extensive hydrophobic surface (Figure 4A) that is positioned to mediate protein substrate recognition.
Interestingly, two inhibitor molecules bound to PtpB in solution and in the crystals. The inhibitor molecule proximal to the catalytic site was buried in the crystal structure of the PtpB:OMTS complex, making extensive interactions that contribute to binding affinity and specificity. The intimate contacts of OMTS with the entire P-loop, for example, provide clues about the basis for specificity of PtpB:OMTS recognition. Three of the five P-loop residues that contact OMTS are unique to PtpB compared to the human PTPs that were not significantly inhibited (Figure 7A). While PtpB Phe161 in the position adjacent to the catalytic cysteine made hydrophobic contacts, the human PTPs PTP1B, PTProt (Glepp1), PTPH1 have a Ser or Gln (Pac1) in this position. Similarly, Lys164 (Ile or Val in the human PTPs) and Asp165 (Gly in human PTPs) represent non-conservative changes from the human consensus residues. The consensus among the human P-loop residues extends to other PTPs such as LAR, PTPα, and CD45 (Figure 7B). This pattern suggests that OMTS is likely to show specificity for PtpB over PTPs in addition to the ones tested in this study. The oxalylamino group of OMTS also bound to PtpB in a different orientation compared to other PTP inhibitors based on this scaffold (Andersen et al., 2000) (Figure 7B). These subtle structural differences also may contribute to the observed specificity of OMTS for PtpB.
Figure 7. Basis for the selectivity of OMTS recognition.
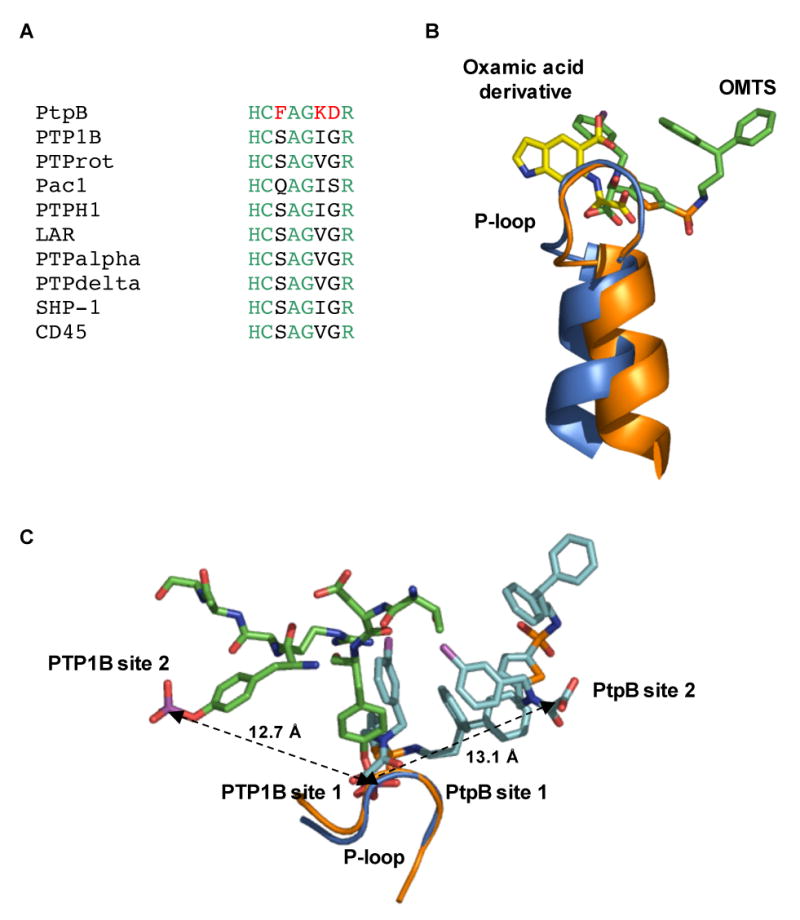
(A) Three (red) of the seven residues in the P-loop that make contacts to OMTS (Cys160-Arg166) are unique in PtpB compared to a variety of human conventional PTPs.
(B) Binding of the proximal OMTS (green) in the PtpB active site (blue) shows an alternative orientation of the oxalylamino group compared to the binding of a 2-(oxalylamino)-benzoic acid derivative (yellow) to PTP1B (PDB ID 1C88).
(C) Comparison of the phosphotyrosine binding sites of PTP1B (PDB ID 1G1H) and the two OMTS binding sites in PtpB. The second binding sites are positioned in opposite directions from the catalytic Cys in the two PTPs. A similar distance of ∼13 Å separates the adjacent pTyr phosphates bound to PTP1B and the oxamic acid groups of the proximal (site 1) and distal (site 2) OMTS molecules bound to PtpB.
The distal inhibitor packed on top of the proximal inhibitor. Our solution measurements suggested that the second inhibitor molecule binds in solution with ∼16-fold weaker affinity than the first (Figure 8). The entropy-driven character of the first binding event is consistent with a model in which desolvation of charges and hydrophobic groups (Yin et al., 2006) and conformational transitions in the lid dominate the binding thermodynamics. The second inhibitor molecule highlights the space that is available for extending the inhibitors to improve binding. Covalently linking features of the two OMTS molecules might further enhance affinity and specificity and help satisfy pharmacological requirements.
The binding of two molecules of OMTS was reminiscent of the binding of diphosphorylated substrate peptides to mammalian PTPs such as PTP1B. The interaction of the pTyr mimic of the distal inhibitor was chemically reasonable—the oxalylamino group bound in a surface pocket ringed by three Arg residues (Figure 4C). To assess the plausibility of the binding of substrates with two pTyr residues, we compared the PtpB:OMTS complex with the PTP1B complex with a pTyr-pTyr substrate motif (Salmeen et al., 2000). The distal OMTS molecule bound in a different direction on the PtpB surface compared to the non-substrate pTyr in the PTP1B complex (Figure 7C). Nonetheless, the distance between bound tyrosine phosphates in the complex of PTP1B with a peptide substrate complex (12.7 Å) closely matched the distance between the carboxylate oxygens (13.1 Å) in the two OMTS molecules bound to PtpB. This similarity raises the possibility that PtpB may recognize substrates with adjacent pTyr residues.
More directly, the binding of OMTS begins to define the plasticity of PtpB that underlies the seemingly paradoxical functional model in which the lid simultaneously protects the enzyme from oxidative inactivation and enables substrate access to the active site (Grundner et al., 2005). Although the closed structure of the PtpB:PO4 complex revealed elements of structural strain (such as buried charges and a segment of two full turns of 3(10) helix embedded in helix α7) that might potentiate movement of the lid, the mode of opening was not apparent. OMTS accesses the catalytic Cys160 by a deceptively simple hinge motion of helix α8 and smaller adjustments of nearby residues (Figure 5). The large movement of helix α8 leaves space for the folding of the new helix α3A. Since OMTS protects this helix from proteolytic cleavage in solution, helix α3A apparently is stabilized upon OMTS binding.
In turn, helix α3A established a deep channel to the active site and flipped the general acid, Asp82, into a nonproductive conformation that is too far from the active site to participate in catalysis. The formation of helix α3A at the same time as the FPD loop movement suggests that the helix might be disordered until substrate binds. This inherent flexibility presents a somewhat larger and more pliable opening for initial substrate docking. This idea is consistent with the finding that the channel occupied by the OMTS molecules is too narrow to enable OMTS binding and release. While the space occupied by the two inhibitor molecules may indicate the path of a polypeptide substrate, the channel is a dead-end. This lack of an exit channel beyond Cys160 suggests that even larger structural changes are needed both to fully open the lid and to accommodate protein substrates. Thus, the PtpB:OMTS complex represents a second closed structure distinct from the PtpB:PO4 complex. While the movement of helix α8 reveals one crucial mechanism of lid opening, the narrow, dead-end binding channel suggests that even larger changes are required to access the open state of the enzyme.
Experimental Procedures
PtpB expression and purification
PtpB was cloned in frame with an N-terminal His-tag as described previously (Grundner et al., 2005). The full-length, His-tagged PtpB protein was expressed in BL21 (DE3)-CodonPlus cells (Stratagene) grown in Terrific Broth containing 50 μg/ml kanamycin and 34 μg/ml chloramphenicol at 37°C to an OD600 of 0.8. After adding IPTG to 20 μM, the cultures were grown for an additional 20 h at 20°C. The cells were harvested by centrifugation and resuspended in 20 mM Tris pH 7.5, 100 mM NaCl. The cells were lysed by sonication on ice and centrifuged at 15,000 g for 1 h. PtpB was purified by immobilized metal affinity chromatography, and size exclusion chromatography (Superdex S75). The protein was eluted from the size exclusion column with 20 mM Tris pH 7.5, 50 mM NaCl and was concentrated to 10 mg/ml.
Measurement of phosphatase activity and inhibition
Unless otherwise stated, chemicals were purchased from Sigma-Fluka. DiFMUP (6,8-Difluoro-4-methyumbelliferyl phosphate) was from Molecular Probes/Invitrogen. 96-well plates were from Corning Incorporated. OMTS ({(3-chlorobenzyl)[(5-{[(3,3-diphenylpropyl)amino]sulfonyl}-2-thienyl)methyl]amino}(oxo)acetic acid) was synthesized at Serono International (D. Swinnen et al., manuscript in preparation).
Phosphatase assays were carried out in 96-well plates containing 5 μl of diluted compound or solvent (100% DMSO) in each well. Fifty-five μl of DiFMUP (72.7 μM) diluted in PTPB buffer (20 mM Bis Tris HCl pH 6.6, 0.1% Brij 35, 1 mM DL-dithiothreitol) was added, followed by 40 μl of recombinant PtpB (50 ng/ml) diluted in PTPB buffer in order to start the reaction. After 45 minutes at room temperature, fluorescence intensity (FI) was measured (excitation at 355 nm and emission at 460 nm for 0.2 s) on a Perkin-Elmer Fusion spectrofluorimeter (Perkin-Elmer Life Sciences). Negative controls were performed in the absence of enzyme, and positive controls were carried out in the presence of enzyme without compound. The percentage of activity was calculated according to the formula: % activity = 100 × (FI compound−FI low control)/(FI high control−FI low control). IC50 values were determined in triplicate in two independent experiments. For competition studies, concentrations of both DiFMUP and inhibitor were varied and fluorescence intensity was measured in kinetic mode on a Fluostar (BMG Labtech Gmbh) spectrofluorimeter. The Ki value for OMTS was determined by varying substrate and inhibitor concentration and calculated from the intersection with the x-axis of the reciprocal plot of the slopes of the Lineweaver-Burke plots versus inhibitor concentration. Data were analyzed with the Prism3 software (Graphpad Software Inc.).
For selectivity studies, assays were performed at pH 7.5 as described for PtpB using a DiFMUP concentration corresponding to the Km of the enzyme studied. The GST-tagged catalytic domain of human phosphatases PTP1B, PTPβ, PTP-H1, PAC1 and Glepp1 were cloned, expressed in E.coli and purified by affinity on a GSH column as described (Wälchli et al., 2000, Pasquali et al., 2003).
Crystallization
The PtpB-OMTS complex was crystallized at 18°C using sitting drop vapor diffusion. The inhibitor was dissolved in DMSO and added to PtpB (10 mg/ml, ∼330 μM) to achieve a final inhibitor concentration of 0.6 μM. PtpB-OMTS solution was mixed with an equal volume of crystallization solution (0.1 M ammonium acetate, 0.1 M Bis-Tris pH 5.5, 17% PEG 10,000, 0.5% β-octylglucoside) and equilibrated against 500 μl of crystallization solution.
X-ray data collection and analysis
Crystals were briefly immersed in crystallization solution containing 25% glycerol, mounted on a loop and frozen in liquid nitrogen. Data were collected to a resolution of 2 Å at the Lawrence Berkeley National Laboratory Advanced Light Source Beamline 8.3.1. The data were reduced with HKL2000 (Otwinowski and Minor, 1997). Phases were obtained by molecular replacement using MolRep (Vagin and Isupov, 2001). The search model was built from the coordinates of the PtpB:PO4 complex (1YWF) by deleting the phosphate and the lid segment (helices α7 and α8). The initial model was built with ARP/wARP (Morris et al., 2002) followed by manual building using Coot (Emsley and Cowtan, 2004). Refinement with REFMAC (Murshudov et al., 1997) was performed between cycles of manual building. Water molecules were identified using Coot. After refinement of the protein and water molecules, unambiguous electron density for two molecules of inhibitor per PtpB was apparent. The inhibitor was built in O (Jones et al., 1991) using coordinates and ideal bond and angle parameters generated with PRODRG (Schuettelkopf and van Aalten, 2004) and modified as required. The final model was refined with REFMAC to an R factor of 19% and a free R factor of 24.8%. PROCHECK and MolProbity were used for structure validation.
Isothermal titration calorimetry
For isothermal titration calorimetry, the PtpB concentration was determined photometrically in 6 M guanidinium hydrochloride and by Coomassie blue visualization after SDS-PAGE. Inhibitor was diluted to 400 μM in 20 mM Tris pH7.5, 50 mM NaCl, resulting in a final DMSO concentration of 4%. PtpB was diluted in the same buffer with 4% DMSO to obtain a 20 μM protein concentration. Measurements were carried out in a VP-ITC instrument (MicroCal) at 25°C by injecting inhibitor to PtpB. Inhibitor into buffer and buffer into PtpB injections were performed to control for solvation and dilution effects. The data were fitted to a two binding site model using the Origin software package (MicroCal).
Limited proteolysis and mass spectrometry
Recombinant PtpB was incubated with 1:1,000 (w/w) trypsin or thermolysin (Sigma) in 20 mM Tris, pH 7.5, 50 mM NaCl at room temperature or 37°C. Inhibitor in 100% DMSO or the same volume of DMSO without inhibitor was added to the protein before addition of protease. Samples were taken at various time points and proteolysis stopped by the addition of SDS-PAGE loading buffer to achieve a final SDS concentration of 1%. The samples were run on a 14% Tris-glycine gel and stained with Coomassie blue. The molecular masses and trypsin cleavage sites of the 11 and 19kD fragments were determined by electrospray ionization-ion trap mass spectrometry (Bruker-Agilent).
Acknowledgments
We thank Thérèse Jomotte for her skilled technical assistance and Markus Seeliger and Tom Lowery for help with isothermal titration calorimetry. We are indebted to David King for mass spectrometry and Megan Flynn for helpful discussions and critical reading of the manuscript. We acknowledge the essential support of Jane Tanamachi, George Meigs and James Holton at Beamline 8.3.1 at the Advanced Light Source. Beamline 8.3.1 was funded by the National Science Foundation, the University of California and Henry Wheeler. This work was supported by a postdoctoral fellowship to C.G. from the American Lung Association of California. We are grateful for the support of the TB Structural Genomics Consortium established by P01 AI68135 from the National Institutes of Health.
Footnotes
Publisher's Disclaimer: This is a PDF file of an unedited manuscript that has been accepted for publication. As a service to our customers we are providing this early version of the manuscript. The manuscript will undergo copyediting, typesetting, and review of the resulting proof before it is published in its final citable form. Please note that during the production process errors may be discovered which could affect the content, and all legal disclaimers that apply to the journal pertain.
Accession Numbers: The coordinates and structure factors were deposited in the Protein Data Bank (accession number 2OZ5).
References
- Andersen HS, Iversen LF, Jeppesen CB, Branner S, Norris K, Rasmussen HB, Moller KB, Moller NP. 2-(oxalylamino)-benzoic acid is a general, competitive inhibitor of protein-tyrosine phosphatases. J Biol Chem. 2000;275:7101–7108. doi: 10.1074/jbc.275.10.7101. [DOI] [PubMed] [Google Scholar]
- Baker NA, Sept D, Joseph S, Holst MJ, McCammon JA. Electrostatics of nanosystems: application to microtubules and the ribosome. Proc Natl Acad Sci USA. 2001;98:10037–10041. doi: 10.1073/pnas.181342398. [DOI] [PMC free article] [PubMed] [Google Scholar]
- Barford D, Das AK, Egloff MP. The structure and mechanism of protein phosphatases: insights into catalysis and regulation. Annu Rev Biophys Biomol Struct. 1998;27:133–164. doi: 10.1146/annurev.biophys.27.1.133. [DOI] [PubMed] [Google Scholar]
- Bialy L, Waldmann H. Inhibitors of protein tyrosine phosphatases: next-generation drugs? Angew Chem Int Ed Engl. 2005;44:3814–3839. doi: 10.1002/anie.200461517. [DOI] [PubMed] [Google Scholar]
- DeVinney I, Steele-Mortimer I, Finlay BB. Phosphatases and kinases delivered to the host cell by bacterial pathogens. Trends Microbiol. 2000;8:29–33. doi: 10.1016/s0966-842x(99)01657-1. [DOI] [PubMed] [Google Scholar]
- Emsley P, Cowtan K. Coot: model-building tools for molecular graphics. Acta Crystallogr D Biol Crystallogr. 2004;60:2126–2132. doi: 10.1107/S0907444904019158. [DOI] [PubMed] [Google Scholar]
- Groen A, Lemeer S, van der Wijk T, Overvoorde J, Heck AJ, Ostman A, Barford D, Slijper M, den Hertog J. Differential oxidation of protein-tyrosine phosphatases. J Biol Chem. 2005;280:10298–10304. doi: 10.1074/jbc.M412424200. [DOI] [PubMed] [Google Scholar]
- Grundner C, Ng HL, Alber T. Mycobacterium tuberculosis protein tyrosine phosphatase PtpB structure reveals a diverged fold and a buried active site. Structure. 2005;11:1625–1634. doi: 10.1016/j.str.2005.07.017. [DOI] [PubMed] [Google Scholar]
- Koul A, Choidas A, Treder M, Tyagi AK, Drlica K, Singh Y, Ullrich A. Cloning and characterization of secretory tyrosine phosphatases of Mycobacterium tuberculosis. J Bacteriol. 2000;182:5425–5432. doi: 10.1128/jb.182.19.5425-5432.2000. [DOI] [PMC free article] [PubMed] [Google Scholar]
- Murshudov GN, Vagin AA, Dodson EJ. Refinement of macromolecular structures by the maximum-likelihood method. Acta Crystallogr D Biol Crystallogr. 1997;53:240–255. doi: 10.1107/S0907444996012255. [DOI] [PubMed] [Google Scholar]
- Nachega JB, Chaisson RE. Tuberculosis drug resistance: a global threat. Clin Infec Dis. 2003;36:24–30. doi: 10.1086/344657. [DOI] [PubMed] [Google Scholar]
- Noren-Muller A, Reis-Correa I, Jr, Prinz H, Rosenbaum C, Saxena K, Schwalbe HJ, Vestweber D, Cagna G, Schunk S, Schwarz O, Schiewe H, Waldmann H. Discovery of protein phosphatase inhibitor classes by biology-oriented synthesis. Proc Natl Acad Sci USA. 2006;103:10606–10611. doi: 10.1073/pnas.0601490103. [DOI] [PMC free article] [PubMed] [Google Scholar]
- Otwinowski Z, Minor W. Processing of x-ray diffraction data collected in oscillation mode. In: Carter CW Jr, Sweet R, editors. Methods in Enzymology. Vol. 276. New York: Academic Press; 1997. pp. 307–326. [DOI] [PubMed] [Google Scholar]
- Pasquali C, Curchod ML, Walchli S, Espanel X, Guerrier M, Arigoni F, Strous G, Van Huijsduijnen RH. Identification of protein tyrosine phosphatases with specificity for the ligand-activated growth hormone receptor. Mol Endocrinol. 2003;17:2228–2239. doi: 10.1210/me.2003-0011. [DOI] [PubMed] [Google Scholar]
- Puius YA, Zhao Y, Sullivan M, Lawrence DS, Almo SC, Zhang ZY. Identification of a second aryl phosphate-binding site in protein-tyrosine phosphatase 1B: a paradigm for inhibitor design. Proc Natl Acad Sci USA. 1997;94:13420–13425. doi: 10.1073/pnas.94.25.13420. [DOI] [PMC free article] [PubMed] [Google Scholar]
- Salmeen A, Andersen JN, Myers MP, Tonks NK, Barford D. Molecular basis for the dephosphorylation of the activation segment of the insulin receptor by protein tyrosine phosphatase 1B. Mol Cell. 2000;6:1401–1412. doi: 10.1016/s1097-2765(00)00137-4. [DOI] [PubMed] [Google Scholar]
- Salmeen A, Andersen JN, Myers MP, Meng TC, Hinks JA, Tonks NK, Barford D. Redox regulation of protein tyrosine phosphatase 1B involves a sulphenyl-amide intermediate. Nature. 2003;423:769–773. doi: 10.1038/nature01680. [DOI] [PubMed] [Google Scholar]
- Schuettelkopf AW, van Aalten DMF. PRODRG - a tool for high-throughput crystallography of protein-ligand complexes. Acta Crystallographica D Biol Crystallogr. 2004;60:1355–1363. doi: 10.1107/S0907444904011679. [DOI] [PubMed] [Google Scholar]
- Singh R, Rao V, Shakila H, Gupta R, Khera A, Dhar N, Singh A, Koul A, Singh Y, Naseema M, et al. Disruption of mptpB impairs the ability of Mycobacterium tuberculosis to survive in guinea pigs. Mol Microbiol. 2003;50:751–762. doi: 10.1046/j.1365-2958.2003.03712.x. [DOI] [PubMed] [Google Scholar]
- Vagin AA, Isupov MN. Spherically averaged phased translation function and its application to the search for molecules and fragments in electron-density maps. Acta Crystallogr D Biol Crystallogr. 2001;57:1451–56. doi: 10.1107/s0907444901012409. [DOI] [PubMed] [Google Scholar]
- Villa F, Deak M, Bloomberg GB, Alessi DR, van Aalten DM. Crystal structure of the PTPL1/FAP-1 human tyrosine phosphatase mutated in colorectal cancer: evidence for a second phosphotyrosine substrate recognition pocket. J Biol Chem. 2005;280:8180–8187. doi: 10.1074/jbc.M412211200. [DOI] [PubMed] [Google Scholar]
- Wälchli S, Curchod ML, Gobert RP, Arkinstall S, Hooft van Huijsduijnen R. Identification of tyrosine phosphatases that dephosphorylate the insulin receptor. A brute force approach based on “substrate-trapping” mutants. J Biol Chem. 2000;275:9792–9796. doi: 10.1074/jbc.275.13.9792. [DOI] [PubMed] [Google Scholar]
- Yin F, Cao R, Goddard A, Zhang Y, Oldfield E. Enthalpy versus entropy-driven binding of bisphosphonates to farnesyl diphosphate synthase. J Am Chem Soc. 2006;128:3524–3525. doi: 10.1021/ja0601639. [DOI] [PubMed] [Google Scholar]


