

Abstract
We report regional rates of cerebral protein synthesis (rCPS) measured with the fully quantitative l-[1-11C]leucine positron emission tomography (PET) method. The method accounts for the fraction (λ) of unlabeled amino acids in the precursor pool for protein synthesis derived from arterial plasma; the remainder (1 -λ) comes from tissue proteolysis. We determined rCPS and λ in 18 regions and whole brain in 10 healthy men (21 to 24 years). Subjects underwent two 90-min dynamic PET studies with arterial blood sampling at least 2 weeks apart. Rates of cerebral protein synthesis varied regionally and ranged from 0.97 ± 0.70 to 2.25 ± 0.20 nmol/g per min. Values of rCPS were in good agreement between the two PET studies. Mean differences in rCPS between studies ranged from 9% in cortical regions to 15% in white matter. The λ value was comparatively more uniform across regions, ranging from 0.63 ± 0.03 to 0.79 ± 0.02. Mean differences in λ between studies were 2% to 8%. Intersubject variability in rCPS was on average 6% in cortical areas, 9% in subcortical regions, and 12% in white matter; intersubject variability in λ was 2% to 8%. Our data indicate that in human subjects low variance and highly reproducible measures of rCPS can be made with the l-[1-11C]leucine PET method.
Keywords: brain, leucine, positron emission tomography-human, protein synthesis
Introduction
Biosynthesis of proteins is a fundamental process necessary for the physiological maintenance and functioning of organisms. In the central nervous system (CNS), de novo protein synthesis is critical for adaptive responses such as long-term memory formation. Animal studies indicate that the rate of cerebral protein synthesis (rCPS) is altered in models of various clinical conditions including fragile X syndrome (Qin et al, 2005), phenylketonuria (Smith and Kang, 2000), ischemia/stroke (Widmann et al, 1991), CNS tumors (Widmann et al, 1992), epilepsy (Collins et al, 1980), and in certain physiologic states such as slow-wave sleep (Nakanishi et al, 1997). Studies in rodents have demonstrated that rCPS changes during the process of aging (Ingvar et al, 1985) and during brain development (Sun et al, 1995). Activity-dependent protein synthesis is thought to be an integral step in many forms of synaptic plasticity (Nguyen et al, 1994), and, in a study of developmental plasticity in monkeys, we found regionally selective changes in rCPS (Kennedy et al, 1981). Variations in rCPS likely reflect adaptive processes taking place over a longer period of time compared with the acute physiological changes signaled by positron emission tomography (PET) measurements of regional cerebral metabolic rate for glucose or cerebral blood flow. Thus, changes in rCPS are expected to provide complementary information to existing PET radiotracers on elucidating CNS processes. On the basis of the findings in rodents and monkeys, we anticipate that the l-[1-11C]leucine PET method will have many applications in the study of the normal human brain and in clinical medicine by providing a new tool to investigate disorders of brain development, recovery from brain injury, and neurodegenerative diseases.
With the recently developed and validated l-[1-11C]leucine PET method (Schmidt et al, 2005; Smith et al, 2005, 2008), we now have a means to quantitatively measure rCPS in vivo in human subjects. Previously, PET studies with radiolabeled amino acids measured uptake or transport of the tracer, and measurements of incorporation into tissue proteins considered only amino acids derived from the arterial plasma and did not account for those derived from proteolysis of tissue protein (Hawkins et al, 1989; Hsu et al, 1996). Studies in experimental animals have shown that this can result in a significant underestimation of rCPS (Smith et al, 1988). Furthermore, the degree of underestimation may vary, making comparisons of different experimental groups problematic. A critical advantage of the l-[1-11C]leucine PET method is that it takes into account the relative contributions to the tissue amino acid pool by labeled and unlabeled leucine from plasma and unlabeled leucine derived from proteolysis of tissue proteins. In the operational equation of the method, recycling of amino acids derived from proteolysis is accounted for by the factor lambda (λ), which represents the fraction of leucine in the precursor pool for protein synthesis derived from arterial plasma; the fraction derived from tissue proteolysis is then 1-λ (Schmidt et al, 2005). Because the l-[1-11C]leucine method accounts for the unlabeled leucine which is recycled from proteolysis, it provides a truly quantitative rate of protein synthesis.
Although the l-[1-11C]leucine PET method has been validated in nonhuman primates (Smith et al, 2005) and applied to humans (Sundaram et al, 2006), the reproducibility and variability of measurements of λ and rCPS are unknown. Knowledge of the variability of these measurements will greatly facilitate application of the method to studies of human subjects and clinical conditions. Herein, we report our data on the variability and reproducibility of λ and rCPS determined in 18 brain regions in 10 healthy male volunteers who each underwent two PET studies with l-[1-11C]leucine. In all regions examined, values of rCPS were in good agreement between the first and second study, and intersubject variability was small.
Materials and methods
Subjects
Eighteen to 24-year-old male volunteers were prospectively evaluated by clinical history, physical examination, and a structured clinical interview, which is designed to identify psychiatric diagnoses based on DSM-IV criteria (Ventura et al, 1998). Inclusion criteria were (1) no current or past diagnoses of psychiatric, neurologic, or chronic medical condition; (2) no history of neurologic trauma; (3) no family history of genetically transmissible neurologic syndrome; and (4) HIV negative. Subjects were excluded if they did not meet all inclusion criteria. A total of 10 right-handed subjects (mean age: 22 years, range: 21 to 24 years) were included in the study. Each subject underwent two l-[1-11C]leucine PET examinations and one noncontrast magnetic resonance imaging (MRI) of the brain. The interval between PET studies one and two varied among subjects (range: 18-292 days). All 20 studies took place over a 13-month interval with the first and second studies of a subject interspersed over that time. The protocol was approved by the National Institutes of Health Combined Neuroscience Institutional Review Board and the National Institutes of Health Radiation Safety Committee. All subjects gave written informed consent before study enrollment.
Brain MRI
All subjects underwent a noncontrast T1-weighted MRI of the brain for region of interest (ROI) placement and to exclude structural brain abnormalities. Magnetic resonance imaging examinations were performed using a head coil on either a 1.5-T Signa (GE Medical Systems, Milwaukee, WI, USA) (eight subjects), or a 3-T unit (Phillips, Cleveland, OH, USA) (two subjects). Typical imaging parameters were three-dimensional fast spin gradient echo, echo time/repetition time: 9 ms/2 ms, 20° flip angle, 1 net excitation, in plane field of view: 240 mm, 256 × 256 matrix, 1 mm slice thickness without interleaved slices. Images were reconstructed to voxel dimensions of 0.94 × 0.94 × 1 to 1.3 mm, and interpolated to voxel dimensions of 0.94 mm3. Magnetic resonance imaging in one subject was reconstructed to voxel dimensions of 1 mm3. Regions of interest were placed on each MRI by visually identifying anatomic landmarks, and manually outlining the individual regions and whole brain.
l-[1-11C]Leucine Synthesis
d,l-[1-11C]Leucine was prepared from H11CN with a modified Strecker-Bucherer reaction (Studenov et al, 2003). Pure l-amino acid was isolated from the racemic mixture by chiral high-pressure liquid chromatography with a Chirobiotic T column (10 × 250 mm) (Advanced Separation Technologies Inc., Whippany, NJ, USA), mobile phase of ethanol/water: 5/95 (v/v), and a flow rate of 3 mL/min. Retention times of the l- and d-isomers were approximately 7 and 8 mins as determined by the corresponding standards. l-[1-11C]Leucine was obtained with a radiochemical purity of > 99% and an estimated specific activity of 3 mCi/nmol.
Positron Emission Tomography Studies
Subjects were instructed to consume a high protein snack and then fast for 8 h before each PET study. On the morning of the study, arterial and intravenous lines were placed in the radial artery of the nondominant hand and contralateral antecubital fossa, respectively. Subjects were also fitted with a headband to which targets for the Polaris® optical tracking system (Northern Digital Inc., Waterloo, ON, Canada) had been attached. Position information was continuously recorded throughout the scanning procedure to allow for motion correction of the emission data during image reconstruction. Positron emission tomography studies were performed on the ECAT high-resolution research tomograph (CPS Innovations, Knoxville, TN, USA). Subjects were positioned in the scanner and a 3-min transmission scan was acquired for optimal subject positioning within the field of view. A 6-min transmission scan was then obtained for attenuation correction. Ninety-minute dynamic emission scans were initiated coincident with the intravenous infusion of 20 to 30 mCi of l-[1-11C]leucine administered over 1 min (one subject) or 2 mins (nine subjects). The infusion time was lengthened after studies of the first subject to allow a larger l-[1-11C]leucine dose without exceeding the maximum count rate of the scanner.
Data were acquired in list mode and reconstructed using the motion-compensated three-dimensional ordinary Poisson ordered subset expectation maximum algorithm (30 subsets, 2 iterations). Spatial resolution after reconstruction was approximately 2.6 mm FWHM (full width at half maximum) in the radial and transverse directions (Carson et al, 2003). Three-dimensional frames of data were reconstructed to 207 slices 1.23-mm thick (no interleaved slices) with a pixel size of 1.21 × 1.21 mm. The transverse and axial fields of view are 31.2 and 25.2 cm, respectively (Wienhard et al, 2002). Images were reconstructed as 42 frames of data (16 × 15, 4 × 30, 4 × 60, 4 × 150, and 14 × 300 secs). All activities were decay corrected to the time of radiotracer injection.
[11C]Leucine Blood Sample Analysis
Arterial blood sampling was initiated concurrently with the start of the [11C]leucine infusion to determine the time courses of the concentrations of unlabeled and labeled leucine in plasma and total 11C and 11CO2 activities in whole blood. Timed samples were hand drawn continuously (~one sample/4 to 6 secs) for the first 2 to 4 mins, and at increasing intervals thereafter for a total of ~40 samples per study.
The procedure apportioned blood samples as follows: (1) approximately 0.2 to 0.3 mL of whole blood was transferred to a preweighed tube containing 1 n NaOH; the tube was immediately reweighed and counted in a gamma counter (Cobra II Auto Gamma; Packard Instrument Co. Inc., Downers Grove, IL, USA) to obtain total activity in whole blood. (2) Approximately 0.5 mL was centrifuged to remove red cells and 0.2 mL of plasma from each sample was diluted in distilled water and deproteinized at 4°C by the addition of a solution of 16% (w/v) sulfosalicylic acid containing l-norleucine (0.04 mmol/L) as an internal standard for amino-acid analysis. Labeled and unlabeled leucine concentrations in the acid-soluble fraction were assayed by γ-counting and fluorescence detection of postcolumn orthophthaldehyde-derivatized amino acids separated with ion exchange high-pressure liquid chromatography (Agilent Technologies Inc., Santa Clara, CA, USA; and Pickering Laboratories Equipment, Mountain View, CA, USA), respectively. (3) Approximately 1 mL of whole blood was injected through the septum of a sealed vial into 2 mL of 8% sulfosalicylic acid. Attached to the septum of the vial was a polyethylene cup with a filter paper soaked with 1 n NaOH. The vial was weighed and, after allowing 30 mins for the evolution of 11CO2, the filter paper was removed and counted. 11C activities in all samples were decay corrected to the time of injection.
Positron Emission Tomography Data Analysis
For each study, a three-dimensional volume was constructed from the average of the emission data acquired between 30 and 60 mins. This volume was isotropically smoothed with a Gaussian filter (FWHM 3 mm) and aligned to the MRI volume by use of the Flexible Image Registration Toolbox (Fischer and Modersitzki, 2004) with a three-dimensional rigid body transformation. The resliced average 30- to 60-min PET image was visually reviewed for correct alignment with the MRI by use of Vinci software (Volume Imaging in Neurological Research, Co-Registration and ROIs Included, Max Planck Institute for Neurological Research, Cologne, Germany). The transformation parameters were then applied to each frame of the PET study (without prior smoothing) to effect their alignment with the MRI volume. Regions of interest drawn on MRIs were transferred to l-[1-11C]leucine scans to compute regional tissue time-activity curves.
Kinetic Model
The model for the behavior of leucine in brain (Schmidt et al, 2005) (Figure 1) includes four rate constants: K1 and k2 for carrier-mediated transport from plasma to brain and back from brain to plasma, respectively; k3 for metabolism of leucine to yield CO2; and k4 for incorporation of leucine into protein. The rate constants are identical for labeled and unlabeled leucine. In light of the long average half-life (> 3 days) of brain protein (Lajtha et al, 1976), we know that the rate constant for the breakdown of unlabeled tissue protein, k5, is very small. In the case of unlabeled protein, k5 acts on the large pool of brain protein producing a significant amount of unlabeled leucine in the tissue. In the case of labeled protein, k5 acts on the very small pool of labeled protein produced during the study duration. We assume, therefore, that there is no significant breakdown of the labeled protein during the experimental interval. We also assume that unlabeled leucine and protein are in a steady state.
Figure 1.
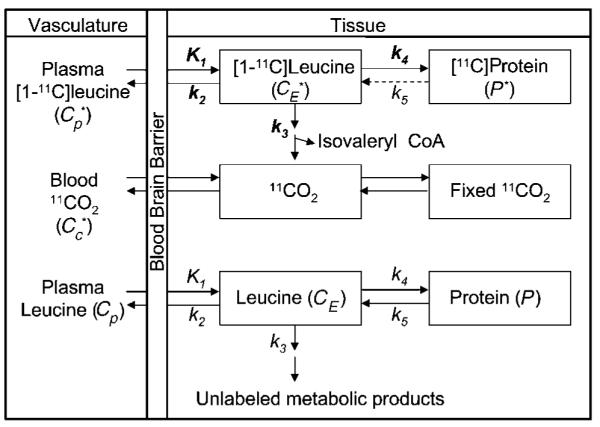
Compartmental model for the l-[1-11C]leucine PET method. The exchangeable (unlabeled-CE or labeled-) leucine pool in the brain includes intra- and extracellular free leucine and intracellular tRNA-bound leucine. K1 and k2 are the rate constants for carrier-mediated transport of leucine from plasma to tissue and back, respectively. k3 is the rate constant for the first two steps in leucine catabolism, transamination, and decarboxylation. Following an injection of leucine labeled on the carboxyl carbon the only possible labeled metabolites in brain are α-KIC, CO2, and products of CO2 fixation. Because there is very little labeled α-KIC in brain (Keen et al, 1989), this pool is not explicitly represented in the model and k3 combines the transamination and decarboxylation reactions. k4 and k5 are the rate constants for leucine incorporation into protein and for the release of free leucine from proteolysis, respectively. Unlabeled leucine and protein are assumed to be in steady state, so that k4CE = k5P. Labeled leucine is administered as a short infusion at the beginning of the study and is, therefore, not in steady state. Because of the long half-life of protein in brain (Lajtha et al, 1976), it is assumed that there is no significant breakdown of labeled product (P*) during the experimental interval, that is, k5P* = 0. Labeled CO2 arises either through catabolism of labeled leucine in brain or through influx from blood (Cc*) after catabolism in other tissue. We assume that fixation of 11CO2 is negligible during the experimental period (Buxton et al, 1987; Siesjo et al, 1964), and that diffusible 11CO2 in brain rapidly equilibrates with the arterial blood (Buxton et al, 1987).
The total concentration of 11C in the field of view of the PET camera at time T includes free [11C]leucine and [11C]leucine incorporated into protein in the tissue ( and P*, respectively) as well as activity in the blood in the brain (, where Vb is the fraction of the volume occupied by blood and is the concentration of activity in whole blood). It also includes the labeled products of [11C]leucine metabolism: 11CO2 and products of 11CO2 fixation. We assume negligible fixation of 11CO2 during the experimental period (Buxton et al, 1987; Siesjo and Thompson, 1964), and that diffusible 11CO2 in brain rapidly equilibrates with the arterial blood (Buxton et al, 1987), that is, its concentration can be approximated by , where is the 11CO2 activity in whole blood and VD is the brain/blood equilibrium distribution volume of 11CO2. Therefore
| (1) |
Time courses of , , and plasma [11C]leucine concentration are measured from arterial blood samples taken at the time of the PET study. For any set of rate constants, the time courses of and P* can be calculated from by solving the differential equations corresponding to the compartmental model:
| (2) |
Rate constants are estimated by the method described below; rCPS can then be determined by the relationship
| (3) |
where Cp is the plasma concentration of unlabeled leucine. In terms of K, the net uptake rate constant for [11C]leucine, rCPS can also be expressed as
| (4) |
where λ is the fraction of leucine in the precursor pool for protein synthesis derived from arterial plasma. Although rCPS may be directly calculated from equation 3, the importance of λ arises from its physiologic relevance. Without knowledge of λ, it is not possible to distinguish whether changes in rCPS between states/conditions are primary effects or are secondary to changes in λ or some combination of the two. This was originally elucidated in the development the l-[1-14C]leucine autoradiographic method, and the high accuracy of estimates of λ using the l-[1-11C]leucine PET method were confirmed in validation experiments in monkeys (Smith et al, 2005). The λ values can be expressed in terms of the rate constants of the model as
| (5) |
Rate Constant Estimation
For each ROI, including whole brain, the rate constants (K1, k2 + k3, and k4) and the blood volume (Vb) were estimated using a weighted, nonlinear least-squares method to fit the model equation for total activity (equation 1) to the measured [11C]leucine activity in plasma, total 11C, and 11CO2 activity in blood, and total activity in the ROI. The equilibrium brain/blood distribution ratio for 11CO2 was fixed at the value measured in rhesus monkeys (VD = 0.41; Smith et al, 2005), a value in agreement with the mean whole brain/plasma distribution volume determined from 11CO2 studies in humans (Brooks et al, 1984). (The blood/plasma equilibrium distribution ratio for 11CO2 in human subjects is close to unity; Gunn et al, 2000). Weights were inversely proportional to the standard deviation of the decay-corrected activity in each frame of data. Assuming Poisson statistics that the counts originate only in the region itself and that there are no other noise effects such as randoms or deadtime, the standard deviation was modeled as:
| (6) |
where γ is the decay constant for 11C, ti is the midpoint of Frame i, Δti is the length of Frame i, and N is a coefficient of proportionality. The difference between the tracer arrival time in the brain and the arterial sampling site was estimated by shifting the blood curves from 0 to 20 secs, fitting the whole brain time-activity curve, and selecting the delay time that produced the best fit of the data. Tracer appearance times in various parts of the brain differ from the mean of the brain as a whole by ± 2 secs (Iida et al, 1988); therefore, in each study the whole brain tracer arrival delay value was used for all regions.
After estimation of the rate constants, λ and rCPS were calculated from the estimated rate constants and the measured plasma leucine concentration by equations 3 and 5.
Statistical Analyses
Differences between studies in baseline plasma leucine concentration, regional estimates of the kinetic model parameters K1, k2 + k3, k4, Vb, estimates of tracer arrival delay, and regional values of λ and rCPS were tested for statistical significance by means of paired two-tailed Student’s t-tests. Bonferroni corrections for comparisons in 18 regions and whole brain were made, and corrected P-values are reported.
Results
Baseline physiologic variables obtained immediately before each PET study were within normal limits and were similar between studies (Table 1). Time courses of the plasma [11C]leucine, whole blood total 11C, and whole blood 11CO2 concentrations from a typical study are shown in Figure 2. Plasma [11C]leucine and whole blood total activities generally peaked in the first or second sample after the end of tracer infusion. Plasma [11C]leucine then cleared at a progressively decreasing rate during the 90-min study interval. After the initial peak, whole blood total activity decreased until 35 to 40 mins and gradually increased thereafter. Blood 11CO2 concentrations were low throughout the study, peaking at 25 to 30 mins to ~ 13% of total blood activity and gradually decreasing thereafter (Figure 2). Baseline plasma unlabeled leucine concentrations (Cp) were similar for Study 1 (intersubject mean 103; range: 60 to 137 nmol/mL) and Study 2 (intersubject mean 110; range: 67 to 150 nmol/mL); concentrations remained relatively constant in all studies. To quantify deviation from the mean Cp in each individual study, the coefficient of variation (CV) was calculated for the 90-min study period. Coefficients of variation were low in all studies, and did not differ between Study 1 (mean 3.2%, range: 0.8% to 6.4%) and Study 2 (mean 4.4%, range: 0.6% to 10%). The concentrations of other large neutral amino acids that compete with leucine for entry into brain (methionine, valine, isoleucine, tyrosine, and phenylalanine) were also measured and found to be relatively constant within a study and did not differ significantly between Study 1 and Study 2.
Table 1.
Physiologic variables
| Variable | Study 1 | Study 2 |
|---|---|---|
| Weight (kg) | 81±19 | 81±19 |
| Plasma glucose (mg/dL)a | 96±7 | 97±5 |
| Hematocrit (%)b | 47±4 | 46±5 |
| pHc,d | 7.40±0.01 | 7.41±0.02 |
| pCO2 (mm Hg)d,e | 39±4 | 41±2 |
| pO2 (mm Hg)d,f | 103±7 | 96±7 |
All values are intersubject means ± SD for 10 studies in 10 subjects.
Normal range (fasting): 70-110 mg/dL.
Normal range: 40-52%.
Normal range: 7.35-7.45.
Mean values for nine subjects.
Normal range: 35-45 mm Hg.
Normal range: 80-100 mm Hg.
Normal ranges are derived from population based data.
Figure 2.
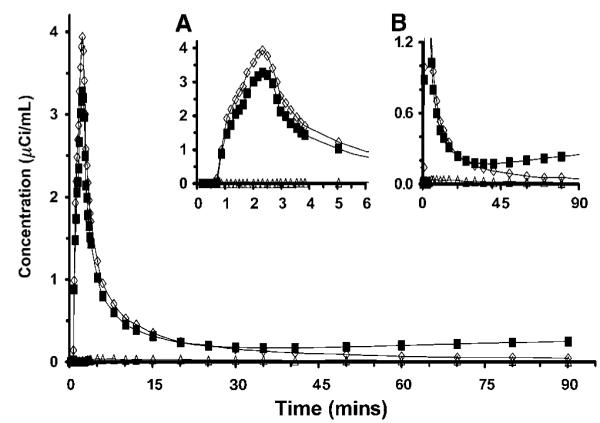
Arterial clearance curves from one study. Open diamonds (◇) represent plasma [11C]leucine concentration, solid squares (■) represent whole blood total 11C concentration, and open triangles (△) represent whole blood 11CO2 concentration. (Inset A) Expanded abscissa shows peak values of plasma [11C]leucine and whole blood total 11C shortly after the end of the 2-min infusion. (Inset B) Expanded ordinate shows clearance of plasma [11C]leucine and blood 11CO2, and slight increases in whole blood total 11C concentration after 40 mins.
Measured time-activity curves for a cortical and white matter region in one study are shown in Figures 3A and 3B, respectively. Total activity peaked at 5 to 7 mins in most regions, with some regions demonstrating an additional earlier smaller peak, which corresponded in time to the peak in the whole blood total 11C activity. Measured activity in most ROIs then decreased reaching a nadir at 30 to 40 mins, reflecting clearance of free [11C]leucine that was more rapid than the accumulation of labeled protein. Thereafter, activity either increased slowly through the end of the experimental interval or remained relatively constant, reflecting a rate of accumulation of labeled protein greater than or equal to the rate of clearance of free [11C]leucine from the precursor pool.
Figure 3.

Time courses of activity in (A) temporal cortex and (B) corona radiata from one study. Open circles (○) and solid lines represent the measured and fitted total activity in the ROI, respectively. As indicated in the figure, dashed and dotted lines represent model estimates of total 11C in blood in the brain, and concentrations of labeled protein, leucine, and 11CO2 in tissue. Parameter estimates in temporal cortex were K1 = 0.048 mL/g per min, k2 + k3 = 0.071 min(-1)), k4 = 0.041 min(-1), Vb = 0.078. The λ-value was 0.63 and rCPS was 2.00 nmol/g per min. Parameter estimates in corona radiata were K1 = 0.028 mL/g per min, k2 + k3 = 0.065 min(-1), k4 = 0.033 min(-1), Vb = 0.039. The λ-value was 0.67 and rCPS was 1.02 nmol/g per min. Tracer delay was 13 secs as estimated from the whole brain time-activity curve. Data are from the same study for which the arterial clearance curves are shown in Figure 2.
Regional estimates of rate constants and Vb (Table 2) were used to calculate model-predicted time courses of 11C activity in tissue distributed among the blood, free [11C]leucine, 11CO2, and [11C]protein pools (Figure 3). Model-predicted activity in the free [11C]leucine pool steadily rises for 5 to 7 mins and then begins to clear, whereas activity in the [11C]protein pool increases throughout the study. Model-predicted activity in the blood in brain initially comprises a significant fraction of total activity in the ROI, but decreases to <10% by 10 mins and remains low for the balance of the study. In the present study, model-predicted values of [11C]protein, [11C]leucine, and 11CO2 in brain were typically 90%, 5% to 8%, and 1% to 2%, respectively, of measured total 11C activity in an ROI at 90 mins. The remaining 4% to 5% of the total activity in the ROI was intravascular.
Table 2.
Estimated kinetic model parameters
|
K1 (mL/g per min) |
k2+k3 (min-1) |
k4 (min-1) |
Vb |
|||||
|---|---|---|---|---|---|---|---|---|
| Region (volume mL±s.d.) | Study 1 | Study 2 | Study 1 | Study 2 | Study 1 | Study 2 | Study 1 | Study 2 |
| Cerebellum (116.4±15) | 0.062±0.007 | 0.064±0.010 | 0.154±0.023 | 0.156±0.018 | 0.051±0.004 | 0.049±0.003 | 0.082±0.012 | 0.072±0.008 |
| Vermis (5.7±1.3) | 0.060±0.007 | 0.063±0.013 | 0.157±0.024 | 0.161±0.023 | 0.053±0.005 | 0.051±0.006 | 0.059±0.012 | 0.052±0.008 |
| Cortical | ||||||||
| Occipital cortex (30.5±8.4) | 0.058±0.005 | 0.062±0.011 | 0.121±0.023 | 0.124±0.015 | 0.044±0.005 | 0.042±0.004 | 0.072±0.013 | 0.067±0.010 |
| Frontal cortex (114.6±24.6) | 0.048±0.005 | 0.049±0.007 | 0.091±0.007 | 0.093±0.008 | 0.039±0.003 | 0.036±0.003 | 0.068±0.008 | 0.060±0.006 |
| Parietal cortex (16.4±4.4) | 0.049±0.005 | 0.051±0.010 | 0.104±0.007 | 0.105±0.009 | 0.043±0.004 | 0.040±0.004 | 0.069±0.010 | 0.061±0.007 |
| Temporal cortex (59.2±10.9) | 0.042±0.004 | 0.043±0.008 | 0.083±0.006 | 0.085±0.008 | 0.037±0.004 | 0.035±0.003 | 0.069±0.008 | 0.062±0.006 |
| Precentral gyrusa (2.6±0.4) | 0.050±0.006 | 0.053±0.017 | 0.109±0.010 | 0.124±0.017 | 0.043±0.005 | 0.044±0.005 | 0.063±0.011 | 0.055±0.007 |
| Postcentral gyrusa (1.7±0.3) | 0.052±0.005 | 0.052±0.008 | 0.123±0.019 | 0.117±0.011 | 0.045±0.005 | 0.041±0.003 | 0.061±0.011 | 0.054±0.005 |
| Supraorbital gyrus (4.1±1.1) | 0.045±0.004 | 0.045±0.008 | 0.091±0.011 | 0.091±0.012 | 0.039±0.003 | 0.035±0.005 | 0.057±0.008 | 0.051±0.007 |
| Anterior cingulate gyrus (1.7± 0.8) | 0.032±0.004 | 0.036±0.006 | 0.054±0.008 | 0.063±0.008 | 0.030±0.006 | 0.028±0.003 | 0.070±0.012 | 0.061±0.011 |
| Subcortical | ||||||||
| Hippocampus (4.2±1.3) | 0.032±0.004 | 0.032±0.006 | 0.065±0.016 | 0.064±0.011 | 0.035±0.006 | 0.031±0.004 | 0.087±0.014 | 0.078±0.010 |
| Amygdala (4.6±0.7) | 0.029±0.002 | 0.030±0.004 | 0.064±0.011 | 0.066±0.012 | 0.034±0.004 | 0.031±0.004 | 0.065±0.014 | 0.058±0.011 |
| Thalamus (15.4±5.1) | 0.046±0.003 | 0.048±0.009 | 0.124±0.019 | 0.124±0.015 | 0.042±0.002 | 0.039±0.004 | 0.067±0.009 | 0.059±0.009 |
| Putamen (8.8±1.2) | 0.047±0.006 | 0.050±0.010 | 0.108±0.013 | 0.114±0.014 | 0.031±0.003 | 0.029±0.003 | 0.055±0.006 | 0.047±0.004 |
| Hypothalamusa (0.5±0.2) | 0.038±0.005 | 0.040±0.010 | 0.078±0.012 | 0.085±0.013 | 0.027±0.009 | 0.026±0.004 | 0.053±0.009 | 0.049±0.010 |
| Caudate (8.2±1.0) | 0.032±0.004 | 0.033±0.008 | 0.082±0.008 | 0.086±0.010 | 0.028±0.003 | 0.027±0.004 | 0.048±0.007 | 0.043±0.006 |
| White matter | ||||||||
| Cerebellar peduncles (13.2±1.8) | 0.040±0.006 | 0.040±0.009 | 0.132±0.020 | 0.132±0.018 | 0.043±0.006 | 0.042±0.007 | 0.047±0.007 | 0.041±0.005 |
| Corona radiata (45.5±4.5) | 0.025±0.004 | 0.026±0.005 | 0.071±0.007 | 0.074±0.008 | 0.027±0.003 | 0.027±0.004 | 0.035±0.004 | 0.032±0.004 |
All values are intersubject mean±s.d. for 10 studies in 10 subjects, except where indicated.
Values for nine studies in nine subjects.
Estimates of rate constants varied regionally and tended to be highest in cerebellum and vermis followed by cortical regions. They were typically lowest in the corona radiata. Intersubject variability in the estimates of the rate constants was generally low, and we found good agreement between estimates in Study 1 and Study 2. Estimates of tracer arrival delay in whole brain (Study 1: 8.9 ± 4.7 secs; Study 2: 9.8 ± 3.7 secs) were also similar between Study 1 and Study 2. In the brain as a whole in Study 1 and Study 2, estimates of K1 were 0.043 ± 0.004 and 0.045 ± 0.008 mL/g per min, respectively; estimates of k2 + k3 were 0.097 ± 0.008 and 0.099 ± 0.008 min(-1), respectively; estimates of k4 were 0.039 ± 0.003 and 0.037 ± 0.003 min(-1), respectively. Estimates of Vb in whole brain were 0.068 ± 0.009 (Study 1) and 0.061 ± 0.006 (Study 2). We found no statistically significant differences in the estimated parameters between Study 1 and Study 2 in whole brain. Mean whole brain volume was 1454 ± 168 mL for the 10 subjects.
Mean regional values of λ ranged from 0.65 to 0.79 (Table 3), with the lowest values in hippocampus and amygdala. Intersubject variability was low, ranging from 3% to 8%. In whole brain, values of λ were 0.71 ± 0.03 and 0.73 ± 0.02 for Study 1 and Study 2, respectively. Only in the anterior cingulate were differences between studies statistically significant. Values in the anterior cingulate were 8% higher in Study 2.
Table 3.
Fraction of precursor pool derived from arterial plasma (λ) and regional rates of cerebral protein synthesis
| λ |
rCPS (nmol/g per min) |
|||
|---|---|---|---|---|
| Region | Study 1 | Study 2 | Study 1 | Study 2 |
| Cerebellum | 0.75±0.03 | 0.76±0.03 | 2.19±0.12 | 2.16±0.15 |
| Vermis | 0.74±0.04 | 0.76±0.02 | 2.16±0.12 | 2.13±0.17 |
| Cortical | ||||
| Occipital cortex | 0.73±0.04 | 0.75 ±0.03 | 2.25±0.20 | 2.22±0.15 |
| Frontal cortex | 0.70±0.03 | 0.72±0.03 | 2.13±0.13 | 2.06±0.17 |
| Parietal cortex | 0.71±0.03 | 0.73±0.02 | 2.12±0.19 | 2.05±0.19 |
| Temporal cortex | 0.69±0.03 | 0.71±0.02 | 1.99±0.13 | 1.93±0.09 |
| Precentral gyrusa | 0.72±0.03 | 0.74±0.02 | 2.16±0.21 | 2.14±0.23 |
| Postcentral gyrusa | 0.73±0.03 | 0.74±0.02 | 2.12±0.17 | 2.05±0.18 |
| Supraorbital gyrus | 0.70±0.04 | 0.72±0.02 | 2.00±0.14 | 1.87±0.16 |
| Anterior cingulate gyrus | 0.65±0.05 | 0.69±0.03b | 1.86±0.17 | 1.70±0.12 |
| Subcortical | ||||
| Hippocampus | 0.65±0.04 | 0.67±0.02 | 1.82±0.14 | 1.69±0.16 |
| Amygdala | 0.65±0.03 | 0.68±0.03 | 1.63±0.12 | 1.55±0.11 |
| Thalamus | 0.74±0.03 | 0.76±0.02 | 1.67±0.10 | 1.63±0.17 |
| Putamen | 0.78±0.02 | 0.79±0.02 | 1.43±0.10 | 1.40±0.09 |
| Hypothalamusa | 0.74±0.03 | 0.76±0.02 | 1.37±0.21 | 1.29±0.18 |
| Caudate | 0.74±0.02 | 0.76±0.03 | 1.15±0.10 | 1.11±0.13 |
| White matter | ||||
| Cerebellar peduncles | 0.75±0.03 | 0.76±0.03 | 1.36±0.12 | 1.36±0.21 |
| Corona radiata | 0.73±0.03 | 0.73±0.04 | 0.97±0.07 | 1.01±0.17 |
All values are intersubject mean±s.d. for 10 studies in 10 subjects, except where indicated.
Values for nine studies in nine subjects.
Statistically significantly different from Study 1, P≤0.05, paired t-test.
Rates of cerebral protein synthesis (Table 3) ranged from 2.3 nmol/g per min in occipital cortex to 1.0 nmol/g per min in corona radiata. Intersubject variability in rCPS was small: CVs varied regionally with the lowest mean CV in cortical (6%), followed by subcortical (9%) and white matter (12%) regions. Agreement between Study 1 and Study 2 was good; mean percentage differences in rCPS between studies were lowest in the cortical (9%) followed by subcortical (10%) and white matter regions (15%). There were no statistically significant differences in rCPS between Study 1 and Study 2 in any region. Whole brain rates of cerebral protein synthesis were 1.84 ± 0.10 and 1.81 ± 0.12 nmol/g per min in Study 1 and Study 2, respectively. Positron emission tomography images (Figure 4) reveal interesting patterns of high and low rCPS. Clearly areas of white matter tend to have lower rates than gray matter, but within gray matter rCPS is higher in occipital cortex and cerebellum with some focal areas of high activity in the thalamus and pons. The cortex is not uniform in relation to rCPS; for example, rCPS is higher in some frontal gyri compared with adjacent cortical areas. Areas of high activity outside the brain, such as the parotid glands, scalp muscles, and vertebral bodies are apparent in the coronal and sagittal views (Figure 4).
Figure 4.
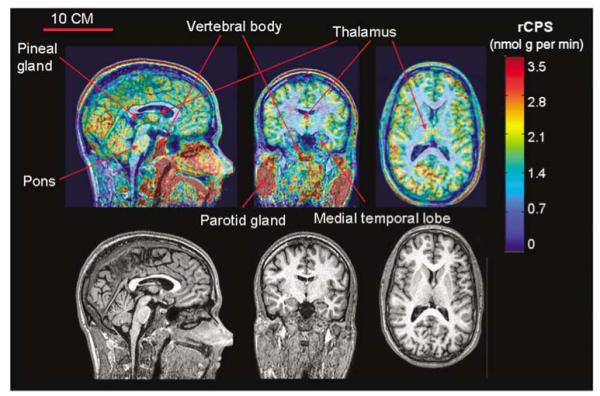
l-[1-11C]Leucine PET (upper) and MR (lower) images from study of a 21-year old man. Sagittal view at the midline is shown on the left, coronal view at the level of the thalamus is shown in the center, and axial view is on the right. [11C]Leucine PET images are color-coded for rCPS; color bar is to the right of the PET images. Slice thickness is 1.0 mm. rCPS was computed from the total activity in each voxel in each 5-min frame of data between 60 and 90 mins by use of an alternate equation for rCPS (equation 3 in Smith et al, 2005) and whole brain rate constants and λ estimated from this subject’s dynamic PET study, that is, K1 = 0.040 mL/g per min, k2 + k3 = 0.106 min(-1), k4 = 0.035 min(-1), λ = 0.75, Vb = 0.066. Rate of cerebral protein synthesis shown is the average of rCPS in the six frames of data. Bar in the upper left MR image is 10 cm and applies to all six images.
Discussion
Our results show the high reproducibility and low variability of the l-[1-11C]leucine PET method for measuring rCPS in vivo in humans. We found no statistically significant differences in rCPS and a statistically significant difference in λ between PET studies in the same subject in only 1 out of the 18 regions examined. There was expected regional variation in rCPS with higher rates in cortical followed by subcortical and white matter regions whereas λ was comparatively more uniform across brain regions. Coefficients of variation for λ and rCPS were small.
The l-[1-11C]leucine PET method offers two significant advantages compared with previous PET studies using radiolabeled amino acids: (1) it accounts for recycling of amino acids from proteolysis of tissue proteins, and (2) it uses the radiotracer l-[1-11C]leucine. Failure to account for recycling of amino acids results in an underestimation of rCPS as the estimates then only reflect the rate of incorporation of the labeled tracer amino acid into protein (Hawkins et al, 1989; Hsu et al, 1996; Smith et al, 1988). By correcting for recycling with the factor λ, the l-[1-11C]leucine PET method provides physiologically accurate rCPS. The choice of leucine labeled on the carboxyl carbon as the tracer is also critical. In contrast to fluorinated amino acids, l-[1-11C]leucine has no isotope effect, (i.e., it behaves in vivo like the unlabeled amino acid), and in contrast to other 11C-labeled amino acids, l-[1-11C]leucine has a simple metabolic pathway minimizing the number of labeled products in tissue (Coenen et al, 1989; Hsu et al, 1996; Ishiwata et al, 1988; Keen et al, 1989; Smith et al, 1988). In tissue, leucine may be tRNA bound and subsequently incorporated into protein or catabolized via transamination to α-ketoisocaproic acid (α-KIC) in which the label remains on the carboxyl carbon. The α-KIC is rapidly decarboxylated to yield 11CO2. Because the concentrations of leucyl-tRNA and α-KIC are very low in brain (Sun et al, 1995) and there is negligible fixation of 11CO2 in brain during the experimental interval (Buxton et al, 1987), the only labeled molecules in brain are [11C]protein, [11C]leucine, and 11CO2.
Estimates of the fractions of 11C activity in the various chemical species in the current study in human subjects are in good agreement with values previously determined in l-[1-11C]leucine PET studies in rhesus monkeys (Smith et al, 2005). In rhesus monkeys, in the brain as a whole 60 mins after the injection of l-[1-11C]leucine, an average of 84% of the activity was in labeled protein. This fraction would be expected to increase after an additional 30 mins of tracer circulation. In the present study, we found ~ 90% of activity in labeled protein 90 mins after injection of the radiopharmaceutical, in most regions (Figure 3). Estimated free 11CO2 in brain represented ~ 4% to 5% of total activity in the brain of the rhesus monkey at 60 mins (Smith et al, 2005). In the present study, it represented only ~ 1% to 2% of total activity at 90 mins (Figure 3).
We scanned subjects for a total of 90 mins after injection of the tracer. This allowed most of the label in brain to be in the form of [11C]protein by the end of the study, thereby potentially allowing greater accuracy in estimating the rate of incorporation of [11C]leucine into [11C]protein and hence rCPS. Because 11C has a half-life of ~ 20 mins, noise due to low count rates increases substantially at late times and the increased noise may offset the advantage of scanning for 90 mins. It may be possible to obtain good estimates of λ and rCPS with a shorter scanning interval; this possibility is under investigation in our laboratory.
Kinetic model considerations also affect the optimal scanning time. The kinetic model for l-[1-11C]leucine assumes that tissue in an ROI is homogeneous in relation to concentrations of amino acids, blood flow, rates of transport and metabolism of amino acids, and rates of incorporation into protein (Schmidt et al, 2005). Rates of these processes differ in gray and white matter regions, and, therefore, values of rate constants of the kinetic model also differ. In practice, the resolving power of PET (like other imaging modalities) means that an ROI contains a heterogeneous mix of gray and white matter, each containing heterogeneous subregions themselves. We used the high-resolution research tomograph because of its superior spatial resolution (FWHM ~ 2.6 mm), but tissue heterogeneity remains a problem. Effects of tissue heterogeneity have been investigated for [14C]deoxyglucose and [18F]fluorodeoxyglucose (Schmidt et al, 1992, 1995). The similarities between the kinetic model for deoxyglucose or fluorodeoxyglucose and the kinetic model for leucine allow inferences for the behavior of leucine in a heterogeneous tissue. The effective rate constants for efflux of tracer from brain to plasma and for incorporation of precursor into product decrease with time until all precursor pools in the tissue equilibrate with the arterial plasma (Schmidt et al, 1991). This could result in an overestimation of rCPS if a kinetic model that assumes tissue homogeneity is used. Effects of tissue heterogeneity must, therefore, be considered in determination of the optimal scanning interval. Tissue heterogeneity may also be responsible for some of the observed trends in overestimation of measured tissue activity by the kinetic model at early and late times after administration of the tracer, and underestimation during the intervening interval (Figure 3).
The purpose of the present study was to establish normal values in humans and evaluate the variability of the l-[1-11C]leucine PET method. On the basis of our data from the l-[1-14C]leucine autoradiographic method in rodents, differences in rCPS between states and interventions are expected to be small, on the order of 20% or less (Qin et al, 2005; Smith et al, 1995, 1998; Smith and Kang, 2000). To detect differences of this magnitude, low variability in the measurement of rCPS is critical to the application of the l-[1-11C]leucine PET method to pathologic and physiologic conditions in humans. For this reason, our study subjects were well matched regarding both gender and age.
In a recent study of rCPS with the l-[1-11C]leucine PET method in human subjects, Sundaram et al (2006) reported a mean value of rCPS in whole brain of 1.4 nmol/g per min (CV 40%) in a group of 16 subjects (6 males, 10 females; aged 20 to 50 years), and a value of approximately 1.2 nmol/g per min in the subgroup of male subjects. These values of rCPS are lower, and the CV is larger, than our measurements. Although both studies are based on the kinetic model published in 2005 (Schmidt et al, 2005), there are important differences between studies that may be responsible for the discrepant findings.
Sundaram et al (2006) studied a group of subjects (males and females) with a wide age range, whereas our study subjects were all males between the ages of 21 and 24 years. Studies in rodents have demonstrated significant decreases in rCPS in whole brain and several regions with increasing age (Qin et al, 2005; Smith et al, 1995; Sun et al, 1995). Inclusion of older subjects in the study may result in lower mean rCPS values and higher variability. The administration of an infusion of glucose before the study, a procedure designed to lower the concentration of circulating amino acids, was used in the study of Sundaram et al (2006). Following this procedure, mean plasma leucine concentration in their male subjects was 64 ± 20 nmol/mL, a value 40% lower than the mean value in our fasted subjects. Whether there are physiological effects in brain of such considerably lower plasma amino acid concentrations is not known. The scanner used by Sundaram et al (2006) had a lower spatial resolution than the high-resolution research tomograph used in the present study, possibly increasing the influence of partial volume effects. Even more important is the fact that in our study, ROIs were identified and drawn on each subject’s MRI, whereas in the study of Sundaram et al (2006), ROIs were identified directly on the PET images. It is difficult to identify ROIs precisely on leucine PET images, and inclusion of tissue outside the anatomical boundaries of a region may result in increased variability. There are also other methodological differences between the two studies. In our study, the estimation interval used was 90 mins, whereas Sundaram et al (2006) used a 60-min interval. In addition, we took into consideration the delay in tracer arrival between brain and arterial sampling site. We also measured 11CO2 in arterial blood to evaluate the time course of 11CO2 in the brain. The most significant methodological difference between the two studies is probably in the determination of the input function. In our study, the time course of the arterial concentration of l-[1-11C]leucine was measured directly in each study. In contrast, Sundaram et al (2006) reported direct measurement of arterial plasma [11C]leucine concentration in some of the subjects; in the remainder, total 11C in arterial plasma was measured and a population-derived fraction of unmetabolized free [11C]leucine relative to total 11C was used to estimate arterial plasma [11C]leucine concentration. This estimation is likely to add increased variability; its impact on rCPS measurement is unknown.
We have determined rCPS across several species with either the autoradiographic l-[1-14C]leucine method or the PET l-[1-11C]leucine method (Qin et al, 2005; Smith and Kang, 2000; Smith et al, 2005; Sun et al, 1995). In the brain as a whole, rCPS is lower in healthy human subjects compared with either rodents or monkeys. In adult rhesus monkeys, rates are 50% to 60% higher than human, and, in rodents, rates are several fold higher. In all species examined, the value of λ for the brain as a whole is significantly less than 1.0, but the value of λ is lower in rodent brain (0.54 to 0.60 in mouse: Qin et al, 2005; Smith and Kang, 2000; 0.58 in rat: Sun et al, 1995) compared with primates (0.72 in rhesus monkey: Smith et al, 2005; 0.72 in human subjects). Species differences are also seen in cerebral metabolic rates for glucose and cerebral blood flow (Sokoloff, 1981) and may reflect differences in brain structure such as neuronal packing density as well as differences in metabolism.
The l-[1-11C]leucine PET method for the quantitative measurement of rCPS in human subjects provides us with a new and potentially powerful tool to investigate adaptive CNS responses in humans. In animal models, conditions such as sleep, hibernation, axonal injury with subsequent regeneration, synaptic plasticity in the visual system, and ischemia are all associated with altered rCPS compared with appropriate controls (Frerichs et al, 1998; Kennedy et al, 1981; Nakanishi et al, 1997; Smith et al, 1984; Widmann et al, 1991). The l-[1-11C]leucine PET method can be used to track changes in rCPS and/or λ across regions and over time. It should therefore be possible to follow the progression of changes at a regional level during normal brain development and aging and in processes such as neural plasticity. Such studies will enhance our understanding of these normal processes and possibly provide an objective measure with which to identify abnormalities. Ultimately, the ability to make these quantitative measurements in human subjects may give us new insights into mechanisms underlying pathologies in neurodevelopmental and cognitive and neurodegenerative disorders. l-[1-11C]Leucine PET may also have diagnostic and prognostic utility in clinical oncology and may provide insight into the efficacy of therapeutic interventions.
The precision shown in the present study coupled with the accuracy shown in validation experiments in nonhuman primates (Smith et al, 2005, 2008) indicates that the l-[1-11C]leucine PET method provides a reliable and accurate means to measure rCPS in vivo in humans.
Acknowledgements
We thank the following members of the PET Department: G Jacobs, S Sestrich, W Kong, M Der, J Divel, C Barker, and S Thada. We thank Dr H Chugani, Department of Pediatrics, Wayne State University School of Medicine for sharing l-[1-11C]leucine dosimetry data with us. This research was supported by the Intramural Research Program, National Institute of Mental Health; the Clinical Center, National Institutes of Health; and the Fragile X Research Foundation.
Footnotes
Parts of this work were presented in preliminary form at the 2007 Annual Meeting of the Society for Nuclear Medicine (Bishu et al, 2007) and the VIIIth International Conference on Quantification of Brain Function with PET (BrainPET’07) (Schmidt et al, 2007).
Disclosure
The authors have no duality of interest to declare.
References
- Bishu S, Schmidt KC, Burlin T, Channing M, Huang T, Liu Z-H, Qin M, Vuong B, Xia Z, Zametkin A, Herscovitch P, Smith C. PET measurement of regional rates of cerebral protein synthesis with l-[1-11C]leucine in young adult males. J Nucl Med. 2007;48:238P. [Google Scholar]
- Brooks DJ, Lammertsma AA, Beaney RP, Leenders KL, Buckingham PD, Marshall J, Jones T. Measurement of regional cerebral pH in human subjects using continuous inhalation of 11CO2 and positron emission tomography. J Cereb Blood Flow Metab. 1984;4:458–65. doi: 10.1038/jcbfm.1984.65. [DOI] [PubMed] [Google Scholar]
- Buxton RB, Alpert NM, Babikian V, Weise S, Correia JA, Ackerman RH. Evaluation of the 11CO2 positron emission tomographic method for measuring brain pH. I. pH changes measured in states of altered PCO2. J Cereb Blood Flow Metab. 1987;7:709–19. doi: 10.1038/jcbfm.1987.125. [DOI] [PubMed] [Google Scholar]
- Carson R, Barker W, Liow J-S, Johnson C. Design of a motion-compensation OSEM list-mode algorithm for resolution-recovery reconstruction for the HRRT. IEEE Trans Nucl Sci. 2003;5:3281–5. [Google Scholar]
- Coenen HH, Kling P, Stocklin G. Cerebral metabolism of l-[2-18F]fluorotyrosine, a new PET tracer of protein synthesis. J Nucl Med. 1989;30:1367–72. [PubMed] [Google Scholar]
- Collins RC, Nandi N, Smith CB, Sokoloff L. Focal seizures inhibit brain protein synthesis. Trans Am Neurol Assoc. 1980;105:43–6. [PubMed] [Google Scholar]
- Fischer B, Modersitzki J. Intensity-based image registration with a guaranteed one-to-one point match. Methods Inf Med. 2004;43:327–30. [PubMed] [Google Scholar]
- Frerichs KU, Smith CB, Brenner M, DeGracia DJ, Krause GS, Marrone L, Dever TE, Hallenbeck JM. Suppression of protein synthesis in brain during hibernation involves inhibition of protein initiation and elongation. Proc Natl Acad Sci USA. 1998;95:14511–6. doi: 10.1073/pnas.95.24.14511. [DOI] [PMC free article] [PubMed] [Google Scholar]
- Gunn RN, Yap JT, Wells P, Osman S, Price P, Jones T, Cunningham VJ. A general method to correct PET data for tissue metabolites using a dual-scan approach. J Nucl Med. 2000;41:706–11. [PubMed] [Google Scholar]
- Hawkins RA, Huang SC, Barrio JR, Keen RE, Feng D, Mazziotta JC, Phelps ME. Estimation of local cerebral protein synthesis rates with l-[1-11C]leucine and PET: methods, model, and results in animals and humans. J Cereb Blood Flow Metab. 1989;9:446–60. doi: 10.1038/jcbfm.1989.68. [DOI] [PubMed] [Google Scholar]
- Hsu H, Yu YM, Babich JW, Burke JF, Livni E, Tompkins RG, Young VR, Alpert NM, Fischman AJ. Measurement of muscle protein synthesis by positron emission tomography with l-[methyl-11C]-methionine. Proc Natl Acad Sci USA. 1996;93:1841–6. doi: 10.1073/pnas.93.5.1841. [DOI] [PMC free article] [PubMed] [Google Scholar]
- Iida H, Higano S, Tomura N, Shishido F, Kanno I, Miura S, Murakami M, Takahashi K, Sasaki H, Uemura K. Evaluation of regional differences of tracer appearance time in cerebral tissues using [15O] water and dynamic positron emission tomography. J Cereb Blood Flow Metab. 1988;8:285–8. doi: 10.1038/jcbfm.1988.60. [DOI] [PubMed] [Google Scholar]
- Ingvar MC, Maeder P, Sokoloff L, Smith CB. Effects of ageing on local rates of cerebral protein synthesis in Sprague-Dawley rats. Brain. 1985;108(Part 1):155–70. doi: 10.1093/brain/108.1.155. [DOI] [PubMed] [Google Scholar]
- Ishiwata K, Vaalburg W, Elsinga PH, Paans AM, Woldring MG. Comparison of l-[1-11C]methionine and l-methyl-[11C]methionine for measuring in vivo protein synthesis rates with PET. J Nucl Med. 1988;29:1419–27. [PubMed] [Google Scholar]
- Keen RE, Barrio JR, Huang SC, Hawkins RA, Phelps ME. In vivo cerebral protein synthesis rates with leucyl-transfer RNA used as a precursor pool: determination of biochemical parameters to structure tracer kinetic models for positron emission tomography. J Cereb Blood Flow Metab. 1989;9:429–45. doi: 10.1038/jcbfm.1989.67. [DOI] [PubMed] [Google Scholar]
- Kennedy C, Suda S, Smith CB, Miyaoka M, Ito M, Sokoloff L. Changes in protein synthesis underlying functional plasticity in immature monkey visual system. Proc Natl Acad Sci USA. 1981;78:3950–3. doi: 10.1073/pnas.78.6.3950. [DOI] [PMC free article] [PubMed] [Google Scholar]
- Lajtha A, Latzkovits L, Toth J. Comparison of turnover rates of proteins of the brain, liver and kidney in mouse in vivo following long term labeling. Biochim Biophys Acta. 1976;425:511–20. doi: 10.1016/0005-2787(76)90015-0. [DOI] [PubMed] [Google Scholar]
- Nakanishi H, Sun Y, Nakamura RK, Mori K, Ito M, Suda S, Namba H, Storch FI, Dang TP, Mendelson W, Mishkin M, Kennedy C, Gillin JC, Smith CB, Sokoloff L. Positive correlations between cerebral protein synthesis rates and deep sleep in Macaca mulatta. Eur J Neurosci. 1997;9:271–9. doi: 10.1111/j.1460-9568.1997.tb01397.x. [DOI] [PubMed] [Google Scholar]
- Nguyen PV, Abel T, Kandel ER. Requirement of a critical period of transcription for induction of a late phase of LTP. Science. 1994;265:1104–7. doi: 10.1126/science.8066450. [DOI] [PubMed] [Google Scholar]
- Qin M, Kang J, Burlin TV, Jiang C, Smith CB. Postadolescent changes in regional cerebral protein synthesis: an in vivo study in the FMR1 null mouse. J Neurosci. 2005;25:5087–95. doi: 10.1523/JNEUROSCI.0093-05.2005. [DOI] [PMC free article] [PubMed] [Google Scholar]
- Schmidt K, Lucignani G, Moresco RM, Rizzo G, Gilardi MC, Messa C, Colombo F, Fazio F, Sokoloff L. Errors introduced by tissue heterogeneity in estimation of local cerebral glucose utilization with current kinetic models of the [18F]fluorodeoxyglucose method. J Cereb Blood Flow Metab. 1992;12:823–34. doi: 10.1038/jcbfm.1992.114. [DOI] [PubMed] [Google Scholar]
- Schmidt K, Mies G, Sokoloff L. Model of kinetic behavior of deoxyglucose in heterogeneous tissues in brain: a reinterpretation of the significance of parameters fitted to homogeneous tissue models. J Cereb Blood Flow Metab. 1991;11:10–24. doi: 10.1038/jcbfm.1991.2. [DOI] [PubMed] [Google Scholar]
- Schmidt KC, Bishu S, Burlin T, Channing M, Huang T, Liu Z-H, Qin M, Vuong B-K, Xia Z, Zametkin A, Herscovitch P, Smith CB. Regional rates of cerebral protein synthesis in normal adult young men measured with l-[1-11C]leucine and PET: effect of scanning interval. J Cereb Blood Flow Metab; International Conference on Quantification of Brain Function with PET; Osaka, Japan. 2007.pp. P02–6U. [Google Scholar]
- Schmidt KC, Cook MP, Qin M, Kang J, Burlin TV, Smith CB. Measurement of regional rates of cerebral protein synthesis with l-[1-11C]leucine and PET with correction for recycling of tissue amino acids: I. Kinetic modeling approach. J Cereb Blood Flow Metab. 2005;25:617–28. doi: 10.1038/sj.jcbfm.9600067. [DOI] [PubMed] [Google Scholar]
- Schmidt KC, Mies G, Dienel GA, Cruz NF, Crane AM, Sokoloff L. Analysis of time courses of metabolic precursors and products in heterogeneous rat brain tissue: limitations of kinetic modeling for predictions of intracompartmental concentrations from total tissue activity. J Cereb Blood Flow Metab. 1995;15:474–84. doi: 10.1038/jcbfm.1995.59. [DOI] [PubMed] [Google Scholar]
- Siesjo BK, Thompson WO. The rate of incorporation of gaseous 14CO2 into brain tissue constituents. Experientia. 1964;20:98–9. doi: 10.1007/BF02151265. [DOI] [PubMed] [Google Scholar]
- Smith CB, Crane AM, Kadekaro M, Agranoff BW, Sokoloff L. Stimulation of protein synthesis and glucose utilization in the hypoglossal nucleus induced by axotomy. J Neurosci. 1984;4:2489–96. doi: 10.1523/JNEUROSCI.04-10-02489.1984. [DOI] [PMC free article] [PubMed] [Google Scholar]
- Smith CB, Deibler GE, Eng N, Schmidt K, Sokoloff L. Measurement of local cerebral protein synthesis in vivo: influence of recycling of amino acids derived from protein degradation. Proc Natl Acad Sci USA. 1988;85:9341–5. doi: 10.1073/pnas.85.23.9341. [DOI] [PMC free article] [PubMed] [Google Scholar]
- Smith CB, Eintrei C, Kang J, Sun Y. Effects of thiopental anesthesia on local rates of cerebral protein synthesis in rats. Am J Physiol. 1998;274:E852–9. doi: 10.1152/ajpendo.1998.274.5.E852. [DOI] [PubMed] [Google Scholar]
- Smith CB, Kang J. Cerebral protein synthesis in a genetic mouse model of phenylketonuria. Proc Natl Acad Sci USA. 2000;97:11014–9. doi: 10.1073/pnas.97.20.11014. [DOI] [PMC free article] [PubMed] [Google Scholar]
- Smith CB, Schmidt KC, Bishu S, Channing M, Bacon J, Burlin T, Qin M, Liu ZH, Xia Z, Huang T, Vuong BK, Herscovitch P. Use of acute hyperphenylalaninemia in rhesus monkeys to examine sensitivity and stability of the l-[1-11C]leucine method for measurement of regional rates of cerebral protein synthesis with PET. J Cereb Blood Flow Metab. 2008 doi: 10.1038/jcbfm.2008.27. in press. [DOI] [PMC free article] [PubMed] [Google Scholar]
- Smith CB, Schmidt KC, Qin M, Burlin TV, Cook MP, Kang J, Saunders RC, Bacher JD, Carson RE, Channing MA, Eckelman WC, Herscovitch P, Laverman P, Vuong BK. Measurement of regional rates of cerebral protein synthesis with l-[1-11C]leucine and PET with correction for recycling of tissue amino acids: II. Validation in rhesus monkeys. J Cereb Blood Flow Metab. 2005;25:629–40. doi: 10.1038/sj.jcbfm.9600066. [DOI] [PubMed] [Google Scholar]
- Smith CB, Sun Y, Sokoloff L. Effects of aging on regional rates of cerebral protein synthesis in the Sprague-Dawley rat: examination of the influence of recycling of amino acids derived from protein degradation into the precursor pool. Neurochem Int. 1995;27:407–16. doi: 10.1016/0197-0186(95)00022-z. [DOI] [PubMed] [Google Scholar]
- Sokoloff L. Relationships among local functional activity, energy metabolism, and blood flow in the central nervous system. Federation Proc. 1981;40:2311–6. [PubMed] [Google Scholar]
- Studenov AR, Szalda DE, Ding YS. Synthesis of no-carrier-added C-11 labeled d- and l-enantiomers of phenylalanine and tyrosine for comparative PET studies. Nucl Med Biol. 2003;30:39–44. doi: 10.1016/s0969-8051(02)00349-9. [DOI] [PubMed] [Google Scholar]
- Sun Y, Deibler GE, Jehle J, Macedonia J, Dumont I, Dang T, Smith CB. Rates of local cerebral protein synthesis in the rat during normal postnatal development. Am J Physiol. 1995;268:R549–61. doi: 10.1152/ajpregu.1995.268.2.R549. [DOI] [PubMed] [Google Scholar]
- Sundaram SK, Muzik O, Chugani DC, Mu F, Mangner TJ, Chugani HT. Quantification of protein synthesis in the human brain using l-[1-11C]-leucine PET: incorporation of factors for large neutral amino acids in plasma and for amino acids recycled from tissue. J Nucl Med. 2006;47:1787–95. [PubMed] [Google Scholar]
- Ventura J, Liberman RP, Green MF, Shaner A, Mintz J. Training and quality assurance with the Structured Clinical Interview for DSM-IV (SCID-I/P) Psychiatry Res. 1998;79:163–73. doi: 10.1016/s0165-1781(98)00038-9. [DOI] [PubMed] [Google Scholar]
- Widmann R, Kuroiwa T, Bonnekoh P, Hossmann KA. [14C]Leucine incorporation into brain proteins in gerbils after transient ischemia: relationship to selective vulnerability of hippocampus. J Neurochem. 1991;56:789–96. doi: 10.1111/j.1471-4159.1991.tb01993.x. [DOI] [PubMed] [Google Scholar]
- Widmann R, Kocher M, Ernestus RI, Hossmann KA. Biochemical and autoradiographical determination of protein synthesis in experimental brain tumors of rats. J Neurochem. 1992;59:18–25. doi: 10.1111/j.1471-4159.1992.tb08870.x. [DOI] [PubMed] [Google Scholar]
- Wienhard K, Schmand M, Casey ME, Baker K, Bao J, Eriksson L, Jones WF, Knoess C, Lenox M, Lercher M, Luk P, Michel C, Reed JH, Richerzhagen N, Treffert J, Vollmar S, Young JW, Heiss WD, Nutt R. The ECAT HRRT: performance and first clinical application of the new high resolution research tomograph. IEEE Trans Nucl Sci. 2002;49:104–10. [Google Scholar]