Abstract
In this work, the influence of nonlinear and diffraction effects on amplification factors of focused ultrasound systems is investigated. The limiting values of acoustic field parameters obtained by focusing of high power ultrasound are studied. The Khokhlov-Zabolotskaya-Kuznetsov (KZK) equation was used for the numerical modeling. Solutions for the nonlinear acoustic field were obtained at output levels corresponding to both pre- and post- shock formation conditions in the focal area of the beam in a weakly dissipative medium. Numerical solutions were compared with experimental data as well as with known analytic predictions.
I. INTRODUCTION
The study of problems that involve the focusing of intense ultrasonic beams is an important area of nonlinear acoustics [1]. Recently, there has been increasing interest in these problems mainly due to the development of new medical devices for nonlinear diagnostic ultrasound imaging, for noninvasive destruction of tumors (high-temperature hyperthermia or acoustic surgery), for cessation of internal bleeding (acoustic hemostasis), and for kidney stone comminution [2, 3]. All of these applications rely on the focusing of acoustic waves in a nonlinear medium. In ultrasound surgery systems which are already used in clinical practice, the intensity levels in the focal area can reach 10000 - 30000 W/cm2 [4]. At these intensities, the shock formation distance for an initially harmonic plane wave with a frequency of 1.5 MHz - typical for medical applications - is only 3 - 5 mm. In most ultrasound surgery devices, this distance is less than the length of the focal area of the beam, therefore it is necessary to account for nonlinear effects when characterizing the acoustic fields of such systems [3].
With an increase of pressure amplitude at the source, the combined effects of nonlinearity and diffraction result in changes of the focusing gains of the acoustic parameters of the beam [5]. Moreover, these changes are different for each parameter of the field. With a further increase of the source output, nonlinear saturation phenomenon occurs and the parameters of the field at the focus no longer depend on the source pressure amplitude. Knowledge of these saturation values in acoustic focusing systems is an interesting problem for fundamental studies of nonlinear waves as well as for practical applications.
Approximate analytic models for estimation of focal pressures and saturation levels in nonlinear beams were proposed more than 50 years ago [6, 7]. These results are still used to estimate the limiting pressures obtained due to focusing. It was shown that analytic predictions in general agree with experimental data; however, they cannot provide quantitatively correct values for various parameters of the acoustic field [8]. The paraxial approach can be used to analytically calculate the change of focusing gains in pre-shock formation regimes [9]. More accurate and detailed investigation of nonlinear focused fields became possible using numerical modeling [5, 10-12]. The change of focusing gains and saturation of acoustic fields at the focus due to nonlinear effects were investigated for initially Gaussian beams [5]. However, the Gaussian source is an idealized model; real transducers have a finite size and therefore have more complicated spatial field distributions. In the paper [11] the nonlinear effects in the field of a weakly focused piston source with parameters typical for medical diagnostic sensors were investigated in more detail. The problem of determining the change in focusing gains due to nonlinear-diffractive effects in strongly focused beams, used in ultrasound surgery, has not yet been solved.
In this work, this problem is investigated numerically using the Khokhlov-Zabolotskaya-Kuznetzov equation. Simulations are performed over a wide range of parameters typical for medical ultrasound transducers in a fluid of low absorption for beams of initially harmonic waves with uniform pressure amplitude at the source. The pressure waveforms, spatial distributions of peak pressures, intensity, and heat deposition (mainly due to absorption of the wave energy at the shocks) are calculated. The maximum focusing gains of the systems working in nonlinear regimes, and also the limiting values of the acoustic parameters in the focal area of the beam are obtained. Numerical solutions are compared with experimental data as well as with known analytic estimates. The results obtained in this work can be used for characterizing the fields of high power focused ultrasound sources in water and in low-absorptive tissue phantoms, for determining the focal values of acoustic parameters of nonlinear fields, and for choosing the optimal operating parameters of medical ultrasound transducers.
II. ANALYTIC APPROACHES
In this section, a short overview of the most common analytic approaches used for calculation of saturation levels at the focus of spherical transducers excited by initially harmonic waves are presented. The analytic solutions will be compared with the numerical results obtained in this paper. The first approach was proposed by Naugolnykh and Romanenko [6]. They considered a converging spherical wave, which propagates from the surface of a spherical cap with a radius F towards the focal region defined by a sphere of radius rf. The propagation of this wave is described by the one-dimensional generalized simple wave equation [13]:
| (1) |
Here p is the acoustic pressure, x is the propagation coordinate, τ = t − x/c0 is the retarded time, ε is the coefficient of nonlinearity, ρ0 is the ambient density, and c0 is the sound speed. The distance rf is defined so that the pressure amplitude of the one-dimensional linear spherically converging wave at rf is equal to the pressure amplitude at the geometrical focus of a linearly focused beam described using the parabolic equation to account for diffraction effects [1]:
| (2) |
with boundary condition
| (3) |
Here A0 is the pressure amplitude at the source, k is the wave number, ω0 = 2π f0 is the angular frequency of the wave, r is the coordinate across the beam axis, and a0 is the source radius (Fig. 1). Using the exact solution of Eq. (2) on the beam axis for a focused piston source, Eq. (3):
| (4) |
we obtain that the pressure amplitude at the geometrical focus of the beam A(x = F) is equal to A0G, where is the focusing gain for the pressure. Substitution of A(x = F), Eq. (4), into the linear solution for spherically converging wave yields the value of rf = F/G. At this distance rf from the focus, the saturation values of pressure and intensity are calculated from the exact solution of the one-dimensional nonlinear equation (1):
| (5) |
FIG. 1.
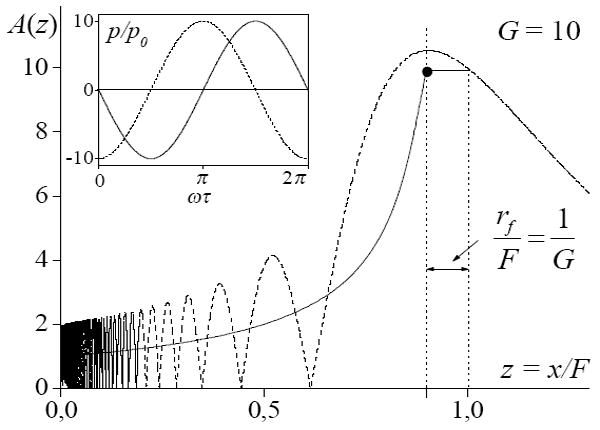
Distributions of the dimensionless amplitude of harmonic wave along the axis z = x/F of the piston transducer for 1D spherically convergent wave (solid line) and linear focused beam (dashed line) with the focusing gain G = 10. The waveforms of the same amplitude are shown in the small figure (for linear focused beam - in the geometrical focus, for 1D spherical convergent wave - at the distance z = 1/G prefocally).
From the solution given by Eq. (5), it can be seen that the level of saturation pressure psat depends on the source geometry (convergence angle of the wave from the source to the focus sinα = a0/F), the characteristic internal pressure of the medium , and nonlinear parameter of medium ε [6]. The limiting value of intensity Isat (5) at the focus is calculated under the assumption that the waveform is sawtooth-like with a maximum pressure of psat.
Various other analytical models for estimating limiting values of acoustic fields at the focus have been developed as well. Ostrovskii and Sutin employed an approximate approach for step-by-step calculation of the acoustic field of a focused acoustic beam [3]. In this approach, first, the nonlinear focusing of the beam is considered while ignoring diffraction effects. Then, at some distance from the focus, nonlinear propagation is neglected and the linear diffraction problem is solved. Finally, near the focus, nonlinear effects again dominate over diffraction effects and the wave transforms into a sequence of pulses with nearly planar shock fronts. The saturation pressures obtained using this method agrees within an order of magnitude with the values obtained using Eq. (5).
The model of one-dimensional nonlinear propagation of a non-diffractive beam in a focused tube with a Gaussian cross-section was also considered [14]. The saturation pressure at the focus for the sawtooth wave given by this model
is very similar to Eq. (5) and practically coincides with it for high linear focusing gains G.
Some analytical results have been obtained for estimation of focusing gains in nonlinear beams. It was shown that the pressure amplitude at the focus of a nonlinear beam can increase fourfold and intensity can increase twofold as compared to the linear beam [7]. Nonlinear increase of focusing gain for peak positive pressure was also calculated using the paraxial approximation, but only for quasi-linear propagation, far from the shock solutions [9].
In the present work, a numerical approach will be used and the results for saturation levels will be compared to the analytical estimation, Eq. (5).
III. NUMERICAL MODEL
The propagation of high intensity focused acoustic waves will be described by the KZK equation [1]:
| (6) |
where Δ┴ is the transverse Laplacian, Δ┴ = 1/r ∂/∂r(r∂/∂r) for axially symmetric beam, b = ξ + 4/3·η is the dissipative coefficient, which is assumed to be small.
The boundary condition for a circular focused transducer with uniform amplitude distribution in the parabolic approximation is written as
| (7) |
Equations (6) and (7) can be rewritten in dimensionless variables:
| (8) |
| (9) |
Here P = p/p0 is the acoustic pressure normalized to the initial amplitude p0 at the source; θ = ω0τ is the dimensionless time; z = x/F is the dimensionless propagation coordinate normalized to the focal distance, and R = r/a0 is the dimensionless transverse coordinate normalized to the source radius.
Equation (8) contains three dimensionless parameters: N = F/xs is the parameter of nonlinearity, G = xd/F is the parameter of diffraction, and A = F/xa is the absorption parameter, where is the characteristic diffraction length, is the characteristic nonlinear length, which corresponds to the shock formation distance for a plane initially harmonic wave, and is the absorption length of the linear wave. If the absorption is low, i.e. A ≪ 1, then the value of the parameter A will only change the fine structure of the shock front formed in the wave profile [1]. Thus, the set of physical parameters which determine the focusing of the wave in a weakly dissipative medium is reduced to only two dimensionless parameters: (nonlinearity) and (diffraction).
Equation (8) with boundary condition (9) is solved numerically at each step along the coordinate z using an operator splitting procedure. A combined time- and frequency- domain approach is used to model diffraction, nonlinearity, and absorption:
| (10) |
Both the temporal waveform and its spectral representation are necessary to solve different operators L in Eq. (10). Both representations are related by the Fourier transform:
| (11) |
where Cn is the complex amplitude of the nth harmonic in the spectrum of a propagating wave.
At each integration step along the beam axis from layer z to layer z+hz, the operator splitting procedure consists of three substeps. At the first substep, diffraction effects are calculated using independent parabolic equations for each of Nmax harmonics of the wave: ∂Cn/∂z = (i/4nG)Δ┴Cn, where n is the harmonic number. In the nearfield of the transducer, where the acoustic field has a strongly oscillatory structure (at distances of z < 0.1), an implicit backward finite difference scheme, which is the most stable one, is used to solve Nmax independent equations over a small step size hzIB [15]. The second order Crank–Nicholson scheme with a bigger step size, hzCN, is used at longer distances of z > 0.1. The solution to the diffraction problem obtained at the new layer z+hz is taken as the initial condition (i.e. on the layer z) for the second substep to take into account nonlinear effects. The nonlinear equation ∂P/∂z = Lнелин is solved independently for each grid point along the coordinate R using the Godunov-type method [16, 17]. This shock capturing scheme can be used to describe the propagation of nonlinear waves with shock fronts, using only 4-5 temporal grid points at the front. The advantage of this scheme is the absence of oscillations near the shock front in the numerical solution and the presence of internal numerical viscosity, which only influences the width of the shock front and therefore does not influence the general properties of the solution. The solution of the nonlinear operator is used as the initial condition for the third substep to calculate the dissipative effects: ∂Cn/∂z = Labs. The exact solution is used for the amplitudes of the harmonics of the wave Cn(z + hz, R) = Cn(z, R)exp(−hz·An2).
The algorithm described above was used to obtain the non-dimensional waveforms P(z, θ, R); the peak positive P+ and peak negative P− pressures, and also the time-averaged intensity of the wave:
| (12) |
where Ĩn(z, R) is the intensity of the nth harmonic [18].
The heating rate is calculated at each step of the grid along z as the intensity difference
| (13) |
before and after calculation of nonlinear and dissipative operators. The energy absorbed at the shock fronts due to the numerical viscosity of the Godunov scheme is also taken into account in Eq. (13).
Equation (8) was numerically solved using a wide range of values for parameters G and N. The linear focusing gain of the beam G was varied from 10, which corresponds to the case of weakly focused diagnostic transducers, to high values G = 40 ÷ 60, which are typical for transducers used for noninvasive surgery. The nonlinear parameter N, which is determined by the source amplitude, was varied over the range 0 ≤ N ≤ 6. The following values of the parameters of the numerical scheme were used: the number of the calculated number of harmonics in the spectrum was Nmax = 256; the number of the time grid points over the wave period was 512; the integration distance along the beam axis was 0 ≤ z ≤ 1.5; the grid boundaries in the transverse coordinate were 0 ≤ R ≤ 3. The number of grid points along the coordinate R and the spatial steps were adjusted depending on the linear focusing gain G of the system. The steps in the longitudinal and transverse coordinates hzCN and hr were related as hzCN~(hr)2. The number of grid points along R was varied from 1500 to 6000. For small values of the focusing gain, G = 10, the steps were hzCN = 4·10-4 and hr = 2·10−3. As the parameter G was increased, the grid step along R was decreased inversely with G, in accordance with the narrowing of the focal width. The minimum absorption parameter A was chosen for each value N so that the shock front of the wave would have no less than six time grid points. As the nonlinear parameter N was increased, the value of the absorption coefficient A was varied from A = 0.01 to A = 0.2.
IV. RESULTS
One of the most important characteristics of focusing systems is the focusing gain, or amplification factor, i.e. the ratio between the value of some acoustic field parameter at the focus x = F and the corresponding quantity at the source. For the case of a focused linear harmonic wave, Eq. (4), the focusing gain for the pressure amplitude uniquely determines the amplification of all acoustic parameters of the field at the focus. The peak positive and peak negative pressures in the profile increase G times while the mean intensity of the wave and heat deposition increase G2 times.
The relationship between acoustic parameters in nonlinear beams is much more complicated. Focal waveform becomes asymmetric due to the combined effects of nonlinearity and diffraction; and the peak positive pressure noticeably exceeds the peak negative pressure. To determine the wave intensity and heat deposition, it is necessary to know not only the pressure amplitude but also the temporal waveform or wave spectrum, Eq. (12). With an increase of the initial wave amplitude, i.e. with an increase of the parameter N in Eq. (8), the focusing gains will change in different ways for different acoustic parameters and for different values of linear focusing gain G.
Figure 2 shows the correction indices K = Gnonlin/Glin to obtain nonlinear focusing gains for a given nonlinear parameter N. The curves are calculated for the peak positive (a) and negative (b) pressures as well as for the intensity of the wave (c). At N = 0, which corresponds to small amplitude linear propagation, the correction indices are equal to one. As shown in the figure, with increase of the source amplitude, i.e. with increase of N, the focusing gains rise noticeably for peak positive pressure (KP+) and intensity (KĨ). Enhancement of focusing in nonlinear beams is more pronounced for higher linear focusing gains G = 40 and 60, i.e. for more focused transducers. The intensity focusing gain increases up to 1.5 times the linear case due to better focusing of the higher harmonics. The strongest increase in focusing gain (up to 3.5 times) is observed for the peak positive pressure, which is due to the diffraction phase shifts between the higher harmonics and also their better focusing.
FIG. 2.
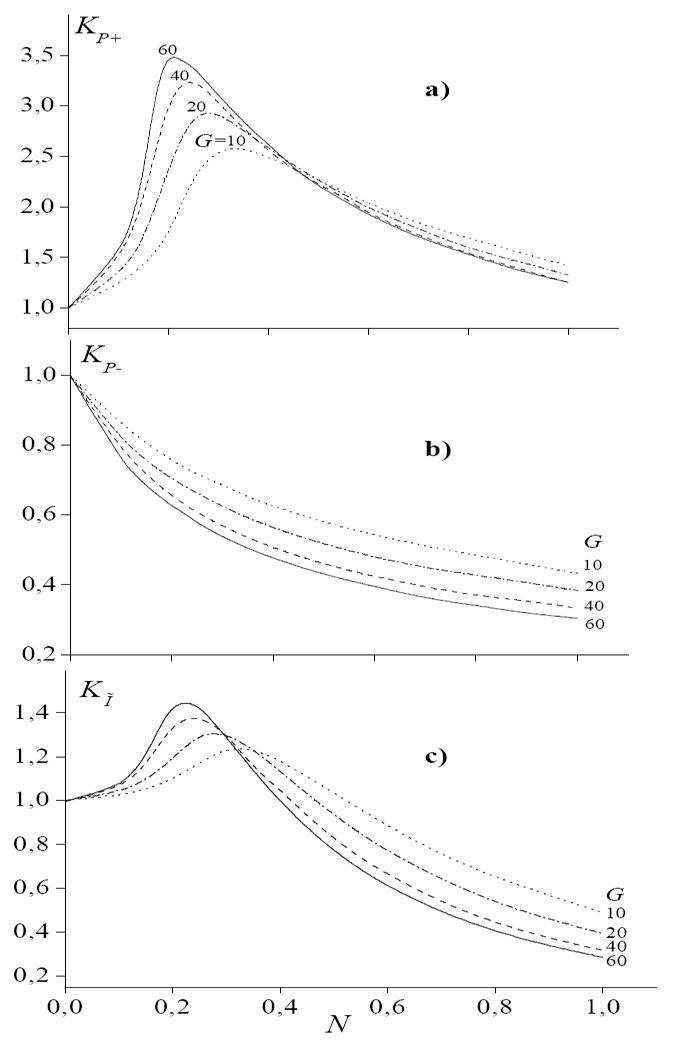
Dependences of correction factors to the focusing gains in nonlinear beam on nonlinear parameter N for the peak positive p+F (a) and peak negative p−F (b) pressures, and intensity IF (c). Correction factors are defined as KP+ = p+F/p0G, KP− = p−F/p0G, and KĨ = IF/I0G2, where G is the linear focusing gain of the source (G = 10, 20, 40, 60).
The analysis of simulation results indicates that the maxima of the curves in Fig. 2 correspond to such values of N (proportional to the source amplitude) when the shocks form close to the focus. With increase of linear focusing gain G, the shocks form at lower initial wave amplitude and thus the maximum of enhancement occurs at smaller values of N. With further increase of the source amplitude, the shock front forms in the prefocal region, which leads to additional losses of wave energy on the way to the focus, and to a decrease of the correction indices KP+ and KĨ. For peak negative pressure (KP−) the focusing gain decreases monotonically with increase of N, i.e. the value of P− at the focus of nonlinear beam is always less than predicted in linear approximation. In the area of maximum enhancement, when the shock front forms close to the focus, the focusing gain for P− is 60% of its linear value.
Using the results shown in Fig. 2, the focal values of peak pressures and intensity can be obtained for any piston transducer at any level of its excitation. Thus, they can be used as calibration curves for nonlinear corrections to acoustic quantities at the focus of ultrasound transducers operating at high intensity levels. These results are of practical importance and can be used for regulating the fields of high power focused ultrasound sources, for determination of the focal values of acoustic parameters of nonlinear fields, and for choosing optimal operating levels.
For higher source output levels, shock fronts form closer to the source, an effective absorption of energy occurs at the shock fronts, and saturation of the acoustic field at the focus ensues. The calculated saturation curves for peak pressures (a, b) and intensities (c) are shown in Figure 3. On the right side of each plot, horizontal lines depict the levels of saturation corresponding to Eq. (5). For convenience, graphs are presented in dimensionless quantities. The ordinate axes on the top two figures correspond to the values proportionate to peak pressures at the focus and , on the bottom figure – intensity of the wave . As can be seen in Fig.3, the saturation levels for peak negative pressures are about twice lower and for peak positive pressure about twice higher than analytic predictions given by Eq. (5). At the same time, for intensity and half-sum of peak pressures, the results obtained from the simple model of one-dimensional spherically converging wave, Eq. (5), and calculated data are very close. Also, it is important to note that saturation at the focus is reached at lower values of N for transducers with higher linear focusing gains G.
FIG. 3.
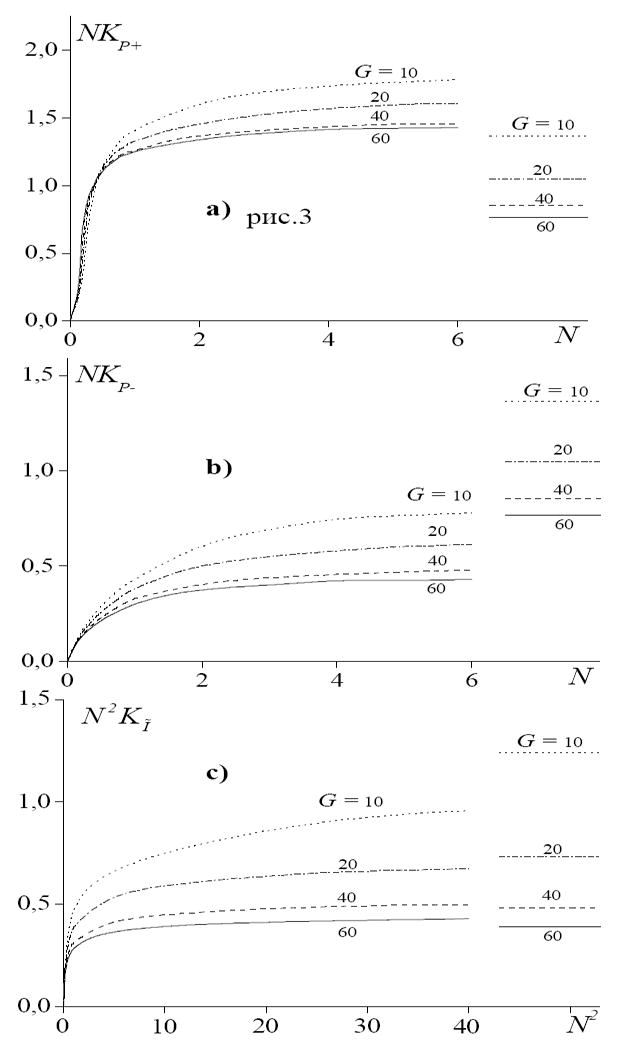
Saturation curves at the focus for dimensionless peak pressures (NKP± ~ p±F, a, b) and intensity Ĩ (N2KĨ~ IF, c). The value of parameter N is proportional to the source pressure output p0, the curves are presented for various values of G = 10, 20, 40, 60. Shown on the right are the approximate saturation values given by the analytic solution, Eq. 5.
Calculations have shown that for weakly focused transducers (G <10), the maximum of the field can occur in the lobe preceding the main focal lobe, even though saturation at the focus has not yet occurred. Such situation is shown in the Figure 4, where the distribution of dimensionless intensity of the wave along the beam axis is presented for G = 10 and N = 4. For strongly focused transducers (G = 20, 40, 60), the maximum of the field always occurs spatially within the focal lobe up to the saturation levels.
FIG. 4.
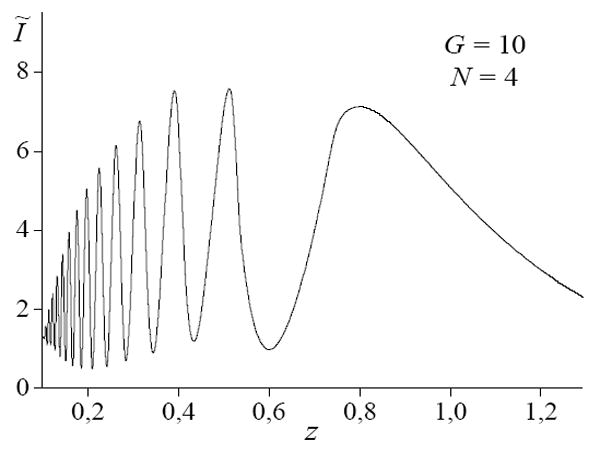
Distribution of the dimensionless intensity Ĩ along the beam axis under conditions of well developed shocks (G = 10, N = 4).
Figure 5 illustrates how the acoustic field of a nonlinear spherically converging one-dimensional wave, Eq. (1), differs from the field of a real transducer, which has strongly oscillatory structure in the nearfield. Figure 5 presents the dimensionless peak pressures P+ and P− (dash and dash-dot lines accordingly) which were obtained by numerical solution of the KZK equation (8), and the pressure amplitude (solid line) obtained using the Eq. (1) for a nonlinear spherically converging wave along the beam axis. The figures are plotted assuming a focusing gain G = 10 for different parameters N that correspond to the cases when a shock front is not yet formed (N = 0.25, a), is formed close to the focus (N = 0.33, b), and prefocally (N = 1.17, c). The pressure amplitudes for a one-dimensional wave at the distance 1/G = 0.1 from the focus, where saturation levels, Eq. (5), are analytically estimated, are marked by crosses on the figures. The corresponding waveforms obtained using the KZK equation in the geometrical focus, and for one-dimensional spherical converging wave at a distance 1/G before the focus are shown in the top left corner of the figures. As can be seen from the figures, the pressure amplitude calculated using the one-dimensional nonlinear model strongly underestimates the peak positive pressure and overestimates the peak negative pressure at the focus, which was also shown for the saturation pressures (Fig. 3).
FIG. 5.
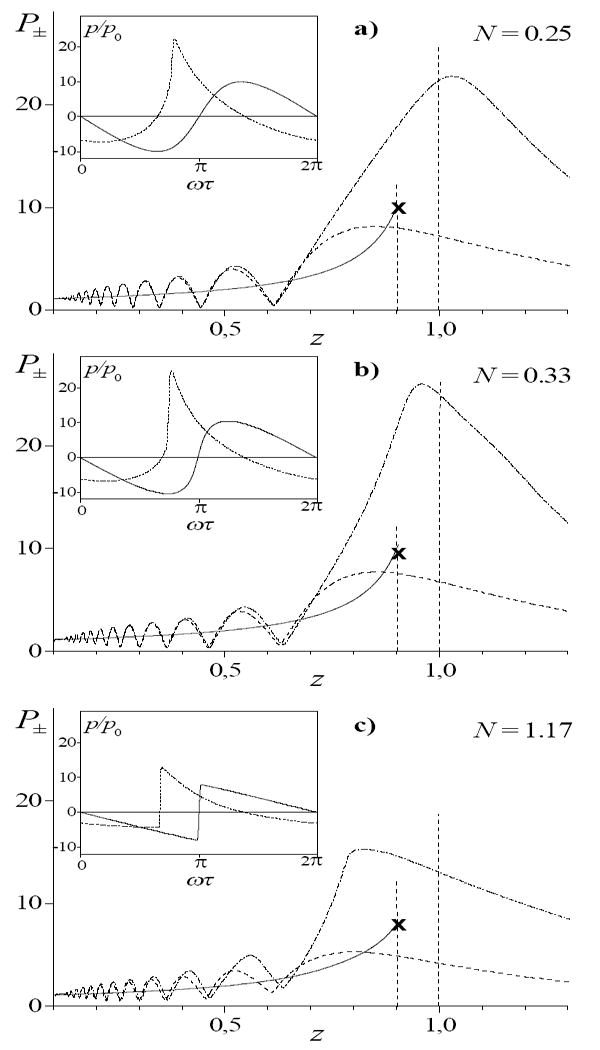
Distributions of the dimensionless peak pressures P+ and P− along beam axis (G = 10) for various values of nonlinear parameter N = 0.25 (a), 0.33 (b), and 1.17 (c). Solid lines correspond to the peak pressure in one-dimensional spherically convergent wave (P+ = P−); dashed lines – to the peak negative P− and dash-dotted line – to the peak positive P+ pressure in nonlinear beam. Shown in small frames are waveforms calculated in the geometrical focus for a beam and at the distance 1/G from the focus towards the source for one-dimensional spherically convergent wave.
In Figure 5, it can be seen that the positions of the spatial maxima for P+ and P−, which are coincident when N = 0, are shifted with increasing N along the beam axis in different ways, in some cases not monotonically. The maximum for the peak negative pressure is shifted towards the source with increasing values of N. Conversely, the maximum value of peak positive pressure shifts towards the geometrical focus at first, even passing behind the focus in some range of values of N (Fig. 5a), and then moves back towards the transducer. Such non monotonic behavior can be explained by the self-defocusing effect due to asymmetrical distortion of the wave profile and to the increase in propagation velocity of the compressive phase of the wave close to the beam axis. For small profile distortion (N = 0.25), the self-defocusing effect is small and leads to a displacement of the pressure maximum P+ away from the source. For the case of maximum asymmetry (N = 0.33), the defocusing effect becomes stronger and the pressure maximum P+ shifts towards the source. With a further increase of N, the absorption of wave energy at the shocks in the prefocal area leads to additional displacement of the maximum towards the source. On the other hand, with increasing N, the propagation velocity of the rarefaction phases of the wave close to the beam axis decreases, which leads to an increase in self-focusing and monotonic displacement of the pressure P− maximum towards the source. For strongly focused transducers, the displacements of spatial maxima of various field parameters in the focal area are less pronounced because the focal area is smaller.
In this work, the focusing gains of nonlinear beams are calculated at the geometrical focus. However, as can be seen from Fig. 5, the maximum values of various acoustic parameters of the field in space are different than corresponding values at the geometrical focus. For example, for values of the nonlinear parameter N where the maximum focusing gain of the peak positive pressure is achieved (Fig. 2), the maximum pressure P+ in space differs from the pressure at the geometrical focus for G = 10 by 13.5 %, for G = 20 by 3.4 %, for G = 40 by 0.8 %, and for G = 60 is practically the same.
The difference of saturation levels for peak positive pressure, calculated at the geometrical focus (Fig. 3), and at the point of spatial maximum of the field, changes none monotonically and corresponds to a difference of 12 % (G = 10), 0.38 % (G = 20), 6 % (G = 40) and 20 % (G = 60). Therefore, it is necessary to take into account these differences when estimating focusing gains and limiting values of acoustic field parameters for high power ultrasound transducers.
As nonlinear effects increase, not only the focusing gains and locations of spatial maxima of different acoustic parameters of the beam change, but also the spatial structure becomes different [19]. Figure 6 shows the spatial distributions of the positive P+ and negative P− peak pressures, intensity Ĩ, and heat deposition H in the axial plane for linear (a, b) and nonlinear (c-f) focusing (G = 40). The value of the nonlinear parameter N = 0.25 corresponds to the case of the maximum enhancement of focusing gain for peak positive pressure (Fig. 2). The figures are plotted on a linear scale using eight equal contour levels that vary from zero to the maximum amplitude of the corresponding quantity. For the linear beam (left column), only the distributions of pressure amplitude P± and intensity Ĩ are presented, because in this case, the distributions of peak positive and negative pressure are identical, and the distributions of wave intensity and heat deposition are proportional to each other, i.e. they also have identical spatial structure. Since the propagation of acoustic wave was simulated in a weakly dissipative medium, an increase in absorption of wave energy was observed during shock wave formation. As can be seen from the figures, in a nonlinear field, the focal area of peak positive pressure (c) and especially heat deposition (f) are more localized in space as compared to the linear field. On the other hand, the focal area of the peak negative pressure (d) is noticeably displaced towards the source and is much less localized in space, especially in the direction across the beam. Interestingly, the distribution of the intensity in a nonlinear beam (d) weakly differs from the linear case, even though the focal waveform contains a shock front.
FIG. 6.
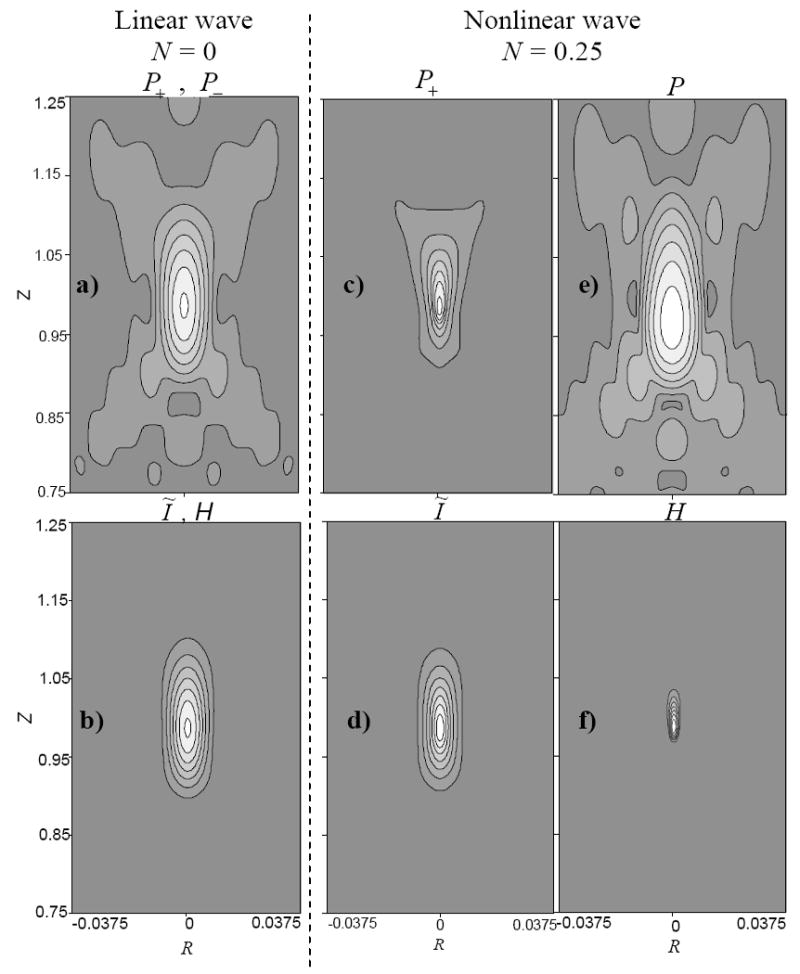
Spatial distributions in (z, R) coordinates of the peak positive P+ and negative P− pressures, intensity Ĩ, and heat deposition H for linear (N = 0, a-b) and nonlinear (N = 0.25, c-e) beams (G = 40).
Since various parameters of the acoustic wave are responsible for different effects of ultrasound on tissue, it is necessary to take into account the mentioned changes that can occur in the spatial localization of acoustic parameters in nonlinear fields when planning the therapeutic impact of high power ultrasound on biological tissue. The negative phase of the waveform determines cavitation impact, while the absorption of the wave at the shocks leads to faster heat deposition. It is expected, therefore, that in high power focused fields, cavitation phenomena will be more pronounced in a wider area and closer to the transducer as compared to thermal effects, and that very high heating rates are possible in the focal area [12]. It is also clear that in the nonlinear regime of focusing, the wave intensity cannot be used to estimate heat deposition.
To illustrate the practical use of the calibration curves depicted in Fig. 2, a specific example will be considered. The acoustic field generated in water by a transducer with frequency f0 = 2 MHz, radius a0 = 22.5 mm and focal length F = 44.4 mm is used as an example. These parameters correspond to G = 48. If the acoustic power is 120 W, then the pressure amplitude at the source is p0 = 0.4 MPa and the initial intensity is I0 = 5 W/cm2, which corresponds to a value for the nonlinear parameter of N = 0.25 [10]. Based on the curves for nonlinear correction of focusing gains (Fig. 2), the values of acoustic parameters of the beam at the focus for the quantities N = 0.25 and G = 48 can be estimated. As can be seen from the figure, at this output level, the values of the correction indices for focusing gains of peak positive pressure and intensity are close to their maximum values. Let us choose the values of correction indices between the curves for G = 40 and G = 60: KP+ = 3.27, KP− = 0.6 and KĨ = 1.4. In this case, at the focus, p+(F) = p0G KP+ = 61.4 MPa, p−(F) = p0G KP− = 10.8 MPa, and I(F) = I0G2KĨ = 16.6 kW/cm2. At the same time, the linear estimates give different values: 19 MPa for peak pressures and 11.5 kW/cm2 for intensity of the wave at the focus. These values will be compared with results of numerical modeling for this transducer and this acoustic output, and with experimental results obtained in water. Figure 7 shows the profile of experimental impulse at the focus (a), and also the comparison of two periods of the measured and simulated signals (b) and their spectra (c). The measurements of the pressure profiles at the focus were performed using a broadband fiber-optic hydrophone with an active diameter of 100 μm in a pulse mode (30-40 periods in pulse) to avoid development of cavitation [10]. The solid line is the experimental data, while the dashed line is the modeled result. As can be seen from the figure, the experimental results are in good agreement with numerical simulations, and peak parameters of the simulated waveform (p+ = 63.5 MPa and p− = 11.5 MPa) practically coincide with the estimations on the curves shown in Fig. 2. Differences between experimental and numerical data for the peak positive pressure are due to the limited bandwidth of the hydrophone (100 MHz). Thus, the algorithm developed in the work presented herein allows the fields of focused transducers to be obtained with high accuracy, even in the regime of developed shocks, and the results of modeling can be used as an alternative to physical measurements.
FIG. 7.
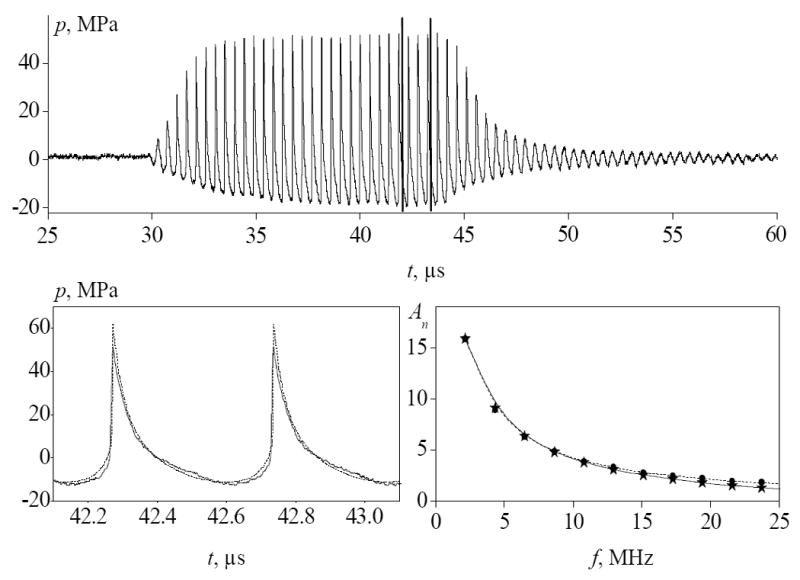
Comparison of measured data (solid lines) with the results of numerical modeling (dashed lines) for the pressure waveform at the focus: (a) - the measured signal; (b) - two periods in the wave profile between vertical lines on the graph of the measured signal, and (c) - the corresponding spectrum. Here An is the amplitude of the n-th harmonic of an initial wave, A1 = p0 at z = 0. Source parameters are: 22.5 mm radius, 44.4 mm focal length, 2 MHz frequency, and 0.4 MPa initial pressure, that correspond to the values of G = 48 and N = 0.25.
The breaking point of piezoceramics and the presence of cavitation activity make it technically difficult to achieve saturation levels experimentally. Using the results shown in Fig. 3, we can estimate the limiting values of the field of the transducer considered above: the limiting peak positive pressure is 117 MPa, peak negative pressure is 39 MPa, and intensity is 96 kW/cm2. In the experiment, the fields at the focus were measured up to the values of p+F = 80 MPa, p−F = 15 MPa, IF = 33 kW/cm2 [10]. Consider now characteristic values of acoustic fields for some other transducers used in experimental research on ultrasonic surgery. For example, the ultrasound transducer used at the Royal Marsden hospital in Sutton (United Kingdom) has the frequency f = 1.7 MHz, the radius a0 = 42 mm and the focal distance F = 150 mm which corresponds to G = 42.2. At typical output levels used to generate thermal damage in tissue, the intensity of the field at the focus is equal to 1500 W/cm2 in linear approximation [18]. In accordance with Fig. 2, this output level (N = 0.27) is close to the maximum for enhancement in gain of the peak positive pressure. In strongly focused fields (G > 20), the acoustic parameters of the focal waveform in tissue and in water will be similar when the same intensity level is reached at the focus; therefore, in tissue, the focal wave profile also has a shock front and the maximum localization of heat deposition is observed for these regimes [18]. The limiting values of the field at the focus for this transducer (from Fig. 3) correspond to a peak positive pressure of 35.5 MPa and a peak negative pressure of 11.6 MPa. At this output level, the half-sum of the peak positive and negative pressures is 23.6 MPa and the limiting intensity value of the field is 10.6 kW/cm2, which are close to the saturation pressure of 20.7 MPa and intensity of 9.6 kW/cm2 obtained using Eq. (5).
For a source with higher frequency f0 = 5.5 MHz, radius a0 = 9.5 mm and F = 19 mm (G = 55) the limiting peak positive pressure at the focus is 113 MPa, limiting peak negative pressure is 34.7 MPa, intensity is 85 kW/cm2. In the experiment the pressure was measured up to p+ = 34.5 MPa and p− = 15.5 MPa, which is also far from saturation [8].
V. CONCLUSION
In this work, the nonlinear-diffractive effects which occur in high power sound beams in a weakly dissipative medium are investigated numerically. The quantitative data for nonlinear corrections of focusing gains and saturation of the field at the focus are obtained. Various characteristics of nonlinearly distorted waveforms are calculated over a wide range of parameters for piston transducers. It is shown that as the pressure amplitude at the source increases, the focusing gains of the field for peak positive pressure and intensity change none monotonically; at first, they noticeably increase (up to 3.5 times for p+ and 1.4 times for I) and then they decrease. The maxima on these curves correspond to the initial amplitude when the shock front is formed in the wave profile near the focus. The effect of enhancement of field concentration is more pronounced for sources with higher linear focusing gains G. For peak negative pressures, the focusing gain decreases monotonically as the source pressure amplitude increases and is only 60% of its linear value when the focusing gain for peak positive pressure is at a maximum.
It was established that the present analytical estimations (5) for saturation levels at the focus underestimate the values for peak positive pressure and overestimate the values for peak negative pressure (by about 2 times). At the same time, these estimations are sufficiently close to numerically calculated intensities and to half-sum of peak pressure values. The main differences in the spatial distribution of different acoustic parameters in nonlinear acoustic fields were presented: peak positive pressure, intensity and heat deposition are strongly localized and, on the contrary, the area of peak negative pressure is extended and shifted towards the source.
The results of modeling are in good agreement with the experimental data and can be used for calibration of real therapeutic ultrasound transducers and for optimization of clinical protocols.
Acknowledgments
The authors wish to thank M.V. Averiyanov for help in the optimization of numerical algorithm. The work was partially supported by RFBR 06-02-16860, INTAS 05-1000008-7841, ISTC 3691, NSBRI SMS00402, and NIH R01EB007643 grants.
Contributor Information
O.V. Bessonova, Email: olga@acs366.phys.msu.ru.
V.A. Khokhlova, Email: vera@acs366.phys.msu.ru.
M.R. Bailey, Email: bailey@apl.washington.edu.
References
- 1.Rudenko OV, Soluyan SI. Theoretical foundations of nonlinear acoustics. Plenum; New York: 1977. p. 268. [Google Scholar]
- 2.Hill CR, Bamber JC, ter Haar GR. Physical Principles of Medical Ultrasonics. John Wiley&Sons; 2004. p. 528. [Google Scholar]
- 3.Bailey MR, Khokhlova VA, Sapozhnikov OA, Kargl SG, Crum LA. Physical mechanisms of the therapeutic effect of ultrasound (a review) Acoustical Physics. 2003;49(4):369–388. [Google Scholar]
- 4.Wu F, Wang ZB, Chen WZ, et al. Extracorporeal focused ultrasound surgery for treatment of human solid carcinomas: early Chinese clinical experience. Ultrasound in Med & Biol. 2004;30(2):245–260. doi: 10.1016/j.ultrasmedbio.2003.10.010. [DOI] [PubMed] [Google Scholar]
- 5.Khokhlova VA, Bailey MR, Crum LA. Acoustic nonlinearity in derating problem for HIFU sources. Proc. 4th International Symposium on Therapeutic Ultrasound; Kyoto, Japan. 2004. pp. 134–136. [Google Scholar]
- 6.Naugolnykh KA, Romanenko EV. Amplification factor of a focusing system as a function of sound intensity. Sov Phys Acoust. 1959;5:191–195. [Google Scholar]
- 7.Ostrovskii LA, Sutin AM. Focusing of finite-amplitude acoustic waves. Akust Zh. 1975;221(6):1300–1303. [Google Scholar]
- 8.Bigelow TA, O’Brien WD., Jr Experimental evaluation of indicators of nonlinearity for use in ultrasound transducer characterizations. Ultrasound in Med & Biol. 2002;28(11/12):1509–1520. doi: 10.1016/s0301-5629(02)00610-5. [DOI] [PubMed] [Google Scholar]
- 9.Hamilton MF, Khokhlova VA, Rudenko OV. Analytical method for describing the paraxial region of finite amplitude sound beams. J Acoust Soc Am. 1997;101(3):1298–1308. doi: 10.1121/1.418158. [DOI] [PubMed] [Google Scholar]
- 10.Canney MS, Bailey MR, Crum LA, Khokhlova VA, Sapozhnikov OA. Acoustic characterization of high intensity focused ultrasound fields: A combined measurement and modeling approach. J Acoust Soc Am. 2008;124(4):2406–2420. doi: 10.1121/1.2967836. [DOI] [PMC free article] [PubMed] [Google Scholar]
- 11.Christopher T, Carstensen EL. Finite amplitude distortion and its relationship to linear derating formulae for diagnostic ultrasound systems. Ultrasound in Med & Biol. 1996;22(8):1103–1116. doi: 10.1016/s0301-5629(96)00099-3. [DOI] [PubMed] [Google Scholar]
- 12.Khokhlova VA, Bailey MR, Reed J, Canney MS, Kaczkowski PJ, Crum LA. Nonlinear mechanisms of lesion formation by high intensity focused ultrasound. Proc. 5th International Symposium on Therapeutic Ultrasound; Boston, USA. 2005. pp. 117–121. [Google Scholar]
- 13.Gurbatov SN, Rudenko OV. Nonlinear Acoustics in Problems. Vol. 80. MSU; 1990. in Russian. [Google Scholar]
- 14.Bacon DR. Finite amplitude distortion of the pulsed fields used in diagnostic ultrasound. Ultrasound Med & Biol. 1984;10(2):189–195. doi: 10.1016/0301-5629(84)90217-5. [DOI] [PubMed] [Google Scholar]
- 15.Press WH, Teukolsky SA, Vetterling WT, Flannery BP. Numerical Recipes in FORTRAN. Cambridge U.P; New York: 1997. p. 1002. [Google Scholar]
- 16.Bakhvalov NS, Zhileykin YaM, Zabolotskaya EA. Nonlinear Theory of Sound Beams. American Institute of Physics; New York: 1987. p. 168. [Google Scholar]
- 17.Kurganov A, Tadmor E. New High-Resolution Central Schemes for Nonlinear Conservation Laws and Convection–Diffusion Equations. J Comp Phys. 2000;160:241–282. [Google Scholar]
- 18.Filonenko EA, Khokhlova VA. Effect of acoustic nonlinearity on heating of biological tissue induced by high intensity focused ultrasound. Acoust Phys. 2001;47(4):541–549. [Google Scholar]
- 19.Bessonova OV, Khokhlova VA. Spatial distributions of various parameters of acoustic field in high intensity focused beams. Proc. XIII Session of the Russian Acoustical Society; 11-15 September, 2006; Taganrog, Russia. pp. 94–97. (in Russian) English version is available at http://ras.akin.ru/ [Google Scholar]


