Abstract
During the interaction of a T cell with an antigen-presenting cell (APC), several receptor ligand pairs, including the T cell receptor (TCR)/major histocompatibility complex (MHC), accumulate at the T cell/APC interface in defined geometrical patterns. This accumulation depends on a movement of the T cell cortical actin cytoskeleton toward the interface. Here we study the involvement of the guanine nucleotide exchange factor vav in this process. We crossed 129 vav−/− mice with B10/BR 5C.C7 TCR transgenic mice and used peptide-loaded APCs to stimulate T cells from the offspring. We found that the accumulation of TCR/MHC at the T cell/APC interface and the T cell actin cytoskeleton rearrangement were clearly defective in these vav+/− mice. A comparable defect in superantigen-mediated T cell activation of T cells from non-TCR transgenic 129 mice was also observed, although in this case it was more apparent in vav−/− mice. These data indicate that vav is an essential regulator of cytoskeletal rearrangements during T cell activation.
Keywords: haploinsufficiency, superantigen, costimulation, receptor accumulation, T cell activation
T cell activation depends on the interaction of several receptors on the T cell surface with their ligands on the antigen-presenting cell (APC), most prominently on the interaction of the T cell receptor (TCR) with an antigenic peptide presented by the major histocompatibility complex (MHC) (1). T cell activation is initiated by the formation of a tight interface between a T cell and an APC (2–5). This initial step is followed rapidly by the clustering of receptors and signaling molecules at the T cell/APC interface in discrete geometrical patterns (6–8) (C.W. et al., unpublished work; Krummel et al., ref. 31). This accumulation correlates with sustained TCR signaling and might serve to coordinate downstream signaling events leading to proliferation and cytokine secretion. We have previously described a video microscopy-based experimental system that allows us to monitor the accumulation of surface molecules at the T cell/APC interface and, by using large crosslinking beads, the movement of the T cell cortical actin cytoskeleton (5, 9) (C.W. et al., unpublished work). We showed that receptor accumulation at the T cell/APC interface is an actin cytoskeleton-driven process that depends on myosin motor proteins and costimulation (9) (C.W. et al., unpublished work). The molecular components controlling this actin reorganization still remain to be defined. It has been suggested that the protooncogene vav plays an important role in this process (10–12).
Vav is preferentially expressed in hematopoietic cells (13) and is believed to function as a guanine nucleotide exchange factor (GEF) for the Rho/Rac/Cdc42 family of GTPases, which are involved in the dynamic organization of the actin cytoskeleton (14–16). Its importance in lymphocyte activation was demonstrated by analysis of mice deficient in the vav gene (17–19). These studies revealed that vav is required for antigen receptor antibody-induced capping, IL-2 production, cell proliferation, calcium signaling, and effective T cell selection (10, 11, 17–19). Interestingly, most of these processes are actin dependent. Thus vav seems to play a critical role in the cytoskeletal rearrangements of lymphocytes.
Here we show that in a peptide/MHC-mediated physiological T cell/APC interaction, vav plays a central role in the clustering of class II MHC/TCR receptor couples at the T cell/APC interface. We crossed 129 vav −/− or vav +/+ control mice to B10/BR 5C.C7 TCR transgenic mice. Using real-time imaging of TCR transgenic T cells from these vav+/− mice vs. vav+/+ mice, we observed clear defects in MHC II/peptide/TCR accumulation at the T cell/APC interface and in the T cell activation-induced movement of the T cell cortical actin cytoskeleton. We corroborated this observation by using superantigen-mediated T cell activation of T cells from non-TCR transgenic 129 mice. We found a defect in MHC II/TCR accumulation at the T cell/APC interface comparing T cells from vav−/− and vav+/+ mice. We propose that vav is a central regulator of T cell activation-induced actin cytoskeleton rearrangements, necessary for an organized accumulation of signaling molecules at the interface of APCs and responding T cells.
Experimental Procedures
Mouse Strains.
Vav−/− mice have been described previously (20). Control mice were 129/SvEv. 5C.C7 mice have been previously described (21). Mice used for experiments were 4–6 weeks old.
Cell Preparation.
Primary T cells were taken from either 5C.C7 mice (21), the F1 generation of a cross of the 5C.C7 mice with the 129 vav-deficient or vav wild-type control mice or from 129 mice deficient, heterozygous, or wild type in vav. 5C.C7 T cells were isolated and maintained as described (5). Briefly, lymph nodes were isolated and T cells were primed by incubation with irradiated B10/BR splenocytes and 3 μM moth cytochrome c (MCC) peptide. From day 3, exogenous IL-2 was added to the culture. Nontransgenic T cells from 129 mice were isolated and maintained analogously; they were primed on 129 irradiated splenocytes in the presence of 10 μg/ml staphylococcal superantigen A (SEA) or E (SEE). As APCs in the assay for MHC II/TCR accumulation, A20 B cell lymphoma cells transfected with an I-Ek–green fluorescent protein (GFP) fusion expression construct were used (C.W. et al., unpublished work). Staphylococcal SEA and SEE were obtained from Toxin Technology (Sarasota, FL).
Microscopy.
Microscopy to assay for MHC/TCR accumulation at the T cell/APC interface was performed as in Krummel et al. (31). Briefly, the imaging system is based on a Zeiss Axiovert S100TV microscope equipped with a 175-W Xenon source (Sutter Instruments, Novato, CA), dual excitation and single emission filter wheels (Sutter), a piezoelectric z-drive (Physik, Germany) and a Keller port, bottom mounted cooled-CCD camera (6.7 nm pixels) (interline CCD-1300-V/HS, Princeton Instruments, Trenton, NJ). The temperature was controlled by air heating with a custom-designed heating box in combination with an objective heater (ΔTC3 system, Bioptechs, Butler, PA). The imaging system was controlled and data were acquired and analyzed by using the metamorph software package enhanced by a z-streaming option (Universal Imaging, Media, PA). For each of the 15-min experiments, every 20 s 1 differential interference contrast image, 1 Fura-2 ratio, and a stack of I-Ek–GFP z-planes were collected. Twenty-one z-planes spaced 1 μm apart form one stack from which the three-dimensional reconstructions have been created by using the metamorph software package. Only cells that could be observed for at least 5 min after the formation of the tight T cell/APC interface were analyzed. For analysis, three-dimensional reconstructions were made and rotated in two perpendicular orientations at four maximally spread time points at and after T cell activation and the pattern of accumulation of the class II MHC was classified. The diffuse form of the I-Ek accumulation covers the whole T cell/APC interface, whereas the concentrated form covers only 10–25% of the interface. Both forms have a fluorescence intensity of at least 40% and up to 100% over the fluorescence intensity of the parts of the APC cell surface that are not in contact with the T cell. The basic microscopy experiment, including peptide loading of the APCs, Fura-2 loading of the T cells, and excitation wavelengths, was carried out as described (5) by using only eight-well cover slips. When superantigen was used instead of the MCC peptide, APCs were preincubated for at least 30 min with 10 μg/ml SEA or SEE at 37°C, and superantigen was present at the same concentration during the microscopy experiment. The bead assay to monitor movement of the T cell cortical actin cytoskeleton was performed as described (9). Briefly, T cells were surface biotinylated and incubated for at least 15 min with 2.8 μm streptavidin-coated beads before they were added to peptide-incubated CH27 B cell lymphoma APCs on the heated microscope stage. During the experiment, the onset of T cell activation was determined by the formation of the T cell/APC interface that is concomitant with the rise in the T cell intracellular calcium concentration, and subsequent bead movement was followed for at least 5 minutes. Bead movement was then classified as described in detail in Wülfing and Davis (9).
Proliferation and IL-2 Secretion Assays.
Proliferation of T cells from 5C.C7 mice crossed with either 129 wild-type or 129 vav-deficient mice was measured as the uptake of [3H]thymidine. Naive lymphocytes (1 × 10⁵) and irradiated (3,000 rads) B10.BR spleen cells (5 × 10⁵) were incubated with serial dilutions of peptides in a 96-well plate. We added 1 μCi [3H]thymidine at 48 h, and cellular DNA was harvested at 64 h. Background radioactivity was less than 2,000 cpm. T cell culture supernatants were assayed in triplicate for IL-2 at 48 h by ELISA (PharMingen). T cells from 129 non-TCR transgenic mice were stimulated with syngeneic spleen in the presence of a serial dilution of superantigen.
Results and Discussion
Vav Is a Central Regulator of Actin Cytoskeleton Rearrangements in Peptide/MHC-Mediated T Cell Activation.
To study the role of vav in the T cell activation-induced movement of the T cell cortical actin cytoskeleton, and in the accumulation of MHC/TCR receptor couples at the T cell/APC interface, we crossed 5C.C7 TCR transgenic mice with mice deficient in vav. We compared the offspring to F1 mice derived from a control cross of the 5C.C7 with vav+/+ mice. The 5C.C7 TCR recognizes MCC peptide 87–103 presented by the MHC II allele I-Ek (21).
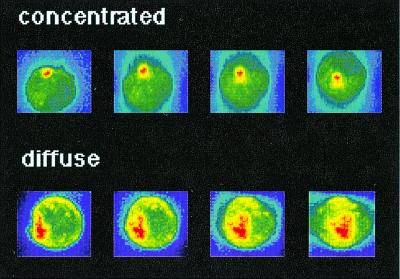
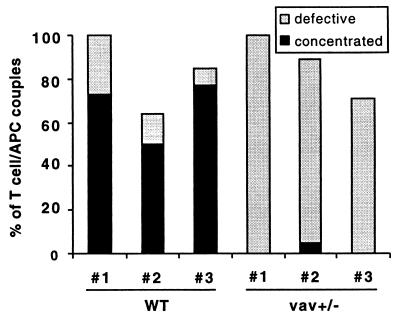
To analyze the accumulation of MHC/TCR receptor couples at the T cell/APC interface after T cell activation, we used video fluorescence microscopy to monitor the interaction of T cells with A20 B cell lymphoma APCs that have been transfected with a GFP-tagged I-Ek and that were peptide loaded with the MCC peptide. During the experiments, every 20 seconds we collected a bright field image to monitor cell morphology, two fluorescence images to determine the T cell intracellular calcium concentration with the ratiometric dye Fura-2 and a stack of GFP images. Each stack consisted of 21 images separated by 1 μm z-distance and was rendered in a three-dimensional representation. This representation was used to analyze and classify the accumulation of MHC/peptide/TCR complexes at the T cell/APC interface as shown in Fig. 1 and described in the methods section. We have previously shown (C.W. et al., unpublished work) that with a T cell from parental 5C.C7 mice a strong stimulus provided by high concentrations of the MCC agonist peptide results in MHC II accumulation in a concentrated form (Fig. 1A) at the center of the T cell/APC interface. Lower concentrations of the strong MCC agonist or high concentrations of the MCC T102S weak agonist peptide provide a weaker stimulus and result in a defective MHC II accumulation. This can take the form of either a diffuse accumulation all over the interface (Fig. 1) or of a transient accumulation, which is defined by an inability of MHC II to stay enriched at the T cell/APC interface 40% over the cellular background for at least 5 min. Here, we compared T cells from F1 mice from the crosses of 5C.C7 with vav-−/−- or with vav+/+ control mice. We found a clear defect in the MHC II/TCR accumulation in vav+/− F1 mice (Fig. 2), even though the formation of the T cell/APC interface was undisturbed (data not shown). Although using high concentrations of the MCC strong agonist peptide, T cells from vav+/− F1 mice accumulated MHC II predominantly in a diffuse pattern (Fig. 2). T cells from vav+/+ F1 control mice, similar to ones from the parental 5C.C7 mice, accumulated MHC II in a concentrated form at the center of the T cell/APC interface (Fig. 2). Vav heterozygosity thus leads to a defect in the ability of T cells to accumulate MHC II/peptide/TCR at the center of the interface, which is a hallmark of efficient T cell activation (7).
Figure 1.
Definition of I-Ek accumulation phenotypes. A three-dimensional reconstruction of the I-Ek-GFP intensity of transfected A20 cells in T cell/APC couples is shown. Increasing I-Ek density is color encoded from blue through green and yellow to red. The color scales have been applied to each of the two cells separately to cover the whole intensity range of the cell. Thus similar colors do not correspond to the same intensity when the two cells are compared. To analyze the amount of accumulation, the difference in absolute intensity values between the interface and the sides and back of the cell is used. The position of the T cell, as identified in a parallel bright field image and visible as a flattening of the APC (in the left-most panels) is on top of the APC for the “concentrated” and at left for the “diffuse” pattern. The four panels are related to each other by a 30° rotation around a horizontal axis for the “concentrated” and a vertical axis for the “diffuse” accumulation pattern.
Figure 2.
Vav+/− T cells do not induce a concentrated MHC II accumulation phenotype on interaction with peptide-pulsed APCs. I-Ek-GFP-transfected A20 B cell lymphoma cells were loaded with 10 μM MCC agonist peptide and were used to stimulate either wild-type (WT) or vav+/− T cells. The frequency of occurrence of different geometrical patterns of the I-Ek accumulation at the interface of T cell/APC couples is given. A “concentrated” accumulation pattern is defined in Fig. 1. A “defective” accumulation is either an accumulation that is not sustained during the course of the experiment or that is diffuse as defined in Fig. 1. Wild-type and vav+/− mice nos. 1, 2, and 3 derived from different breedings were analyzed in independent experiments. The number of T cell/APC couples analyzed in each experiment for T cells from wild-type mice nos. 1, 2, and 3 was n = 11, n = 14, n = 13, and for T cell from vav+/− mice nos. 1, 2, 3, it was n = 5, n = 19, and n = 7, respectively.
Next, we studied whether T cells from the F1 mice showed the T cell activation-induced and costimulation-controlled movement of the T cell cortical actin cytoskeleton toward the T cell/APC interface seen with T cell from the parental 5C.C7 mice (9). This movement can be monitored with large crosslinking beads (9). Here we used 2.8-μm streptavidin-coated beads after having surface biotinylated T cells before their interaction with the APCs. The experimental details and analysis criteria are exactly the same as previously published (9). In this assay, we previously found with T cells from parental 5C.C7 mice that 83% (n = 29) of the T cell/APC couples showed a translocation of the beads toward the T cell/APC interface (9). Beads on T cells from vav+/− F1 mice translocate in only 10% (n = 20) of the cell couples, whereas 54% (n = 24) of the T cells from vav+/+ F1 mice show bead translocation.
In both assays, for cellular rearrangements during T cell activation, T cells from vav+/− F1 mice showed a clear defect in comparison to T cells from vav+/+ F1 control mice, which behave essentially like T cells from parental 5C.C7 mice. In comparison to the bead translocation assay, the defect in MHC II/peptide/TCR accumulation was less drastic in that even though accumulation in a concentrated form was inhibited, accumulation at the interface in a diffuse form still occurred. In contrast, the bead movement was completely inhibited. Such a difference in the severity of the phenotypes in the two assays is also seen when studying the influence of costimulation in these assays. Although the bead assay is very sensitive to any interference with costimulatory receptors (9), some accumulation of MHC II/peptide/TCR still occurs when costimulation is partially blocked (C.W. et al., unpublished data). It is intriguing that both the nature and the relative extent of the cytoskeletal phenotype of the vav+/− T cells resemble that of a moderate block in costimulation. This similarity in phenotype suggests that vav might be an effector of costimulatory receptors that regulate the T cell actin cytoskeleton. This finding is consistent with studies showing that vav can be a substrate in the CD28 signal-transduction pathway (22–26).
T Cells from F1 Mice from the Crosses of 5C.C7 with vav−/− or vav +/+ Control Mice Are Less Reactive than T Cells from 5C.C7 Mice but Maintain Their Antigen Specificity.
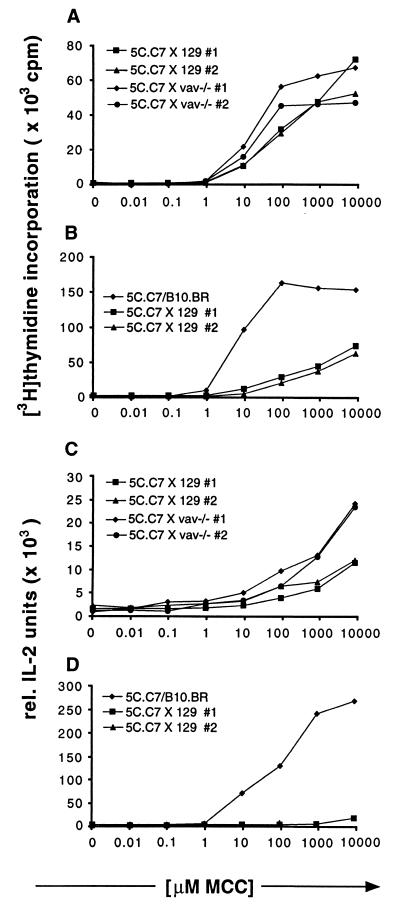
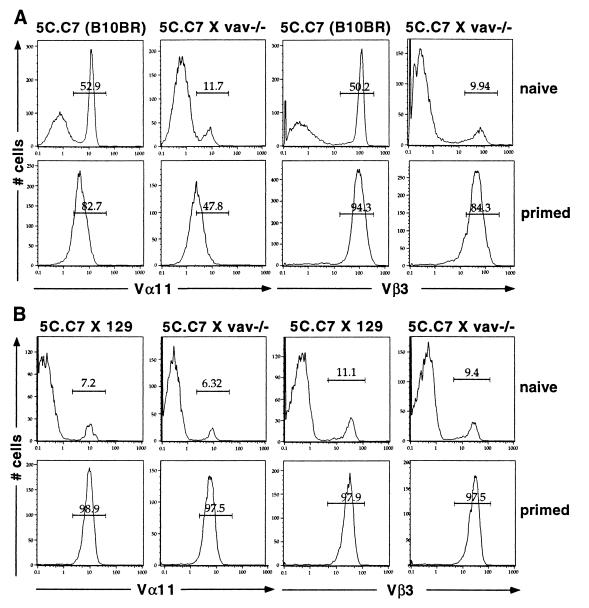
The F1 mice used in the aforementioned experiments have a mixed strain background, because the 5C.C7 transgenic mice are on the B10.BR strain, whereas the vav−/− mice and the corresponding vav+/+ control mice are on the 129 strain. As a control, we therefore compared vav+/+ and vav+/− F1 mice used here with parental 5C.C7/B10.BR mice in a number of different immunological assays. The F1 mice, irrespective of vav genotype, showed reduced proliferation and IL-2 secretion of lymphocytes (Fig. 3 A and B, C and D) and reduced surface expression of TCR, CD3 and CD4 (Fig. 4 A and B and data not shown). Such a phenotype is similar to the one observed in 5C.C7 TCR transgenic mice on a B10.BR background expressing the MCC peptide as a fusion protein with hen egg lysozyme under the control of the metallothionein promoter. In these mice, the developing T cells are forced through enhanced negative selection (27). Based on this similarity of phenotypes, we assume that the 5C.C7 T cells in the mixed background are also partially negatively selected, presumably by an endogenous superantigen expressed in the 129 strain. However, even though proliferation and IL-2 secretion of the 5C.C7 × 129 F1 mice are partially defective, both are still mediated by the 5C.C7 TCR. To assay for the dependence of T cell proliferation on the 5C.C7 TCR, we first stained T cells for the presence of the 5C.C7 variable domains Vα11 and Vβ3 during T cell proliferation in response to MCC peptide on B10.BR splenocytes. Although the F1 lymph node suspension used to set up the proliferation experiment contained only 6–11% T cells that stained positive for Vα11 and Vβ3 (Fig. 4B Upper), all cells that survived after 1 week of culture were positive for both Vα11 and Vβ3 (Fig. 4B Lower). This indicates that all proliferation was mediated by the 5C.C7 TCR. Second, we assayed for the dependence of T cell proliferation on the MCC peptide in a dose-response experiment. We found that all F1 lymph node proliferation and IL-2 secretion depended completely on the presence of the MCC peptide (Fig. 3). Although the F1 T cells have lost part of their reactivity, they have lost none of their specificity. Therefore, our experiments addressed 5C.C7 TCR-mediated T cell activation events. Interestingly, both vav+/− and vav+/+ F1 mice behave identically in all respects except for T cell cytoskeletal rearrangements. Thus, the vav+/− phenotype is independent of the mixed strain background of these mice, although it is possible that the presumed superantigen-mediated thymic selection exacerbates this effect in some way (see below).
Figure 3.
Proliferation and IL-2 secretion dose response to MCC peptide of lymph node cells from 5C.C7 mice crossed with 129 wild-type or 129 vav−/− mice are the same but differ from 5C.C7 mice on its original B10.BR background. Lymph node cells isolated from 5C.C7 mice or the crosses shown in the figures were stimulated for 48 h with B10.BR mouse splenocytes loaded with increasing amounts of MCC peptide. Data are representative of four independent experiments. (A and B) The incorporation of [3H]thymidine during the last 16–20 h of culture was measured. Experiments were performed in triplicates. (C and D) Culture supernatants of the cell cultures described in A and B were assayed in triplicate for IL-2 production by ELISA.
Figure 4.
Expression of the 5C.C7 variable domains Vα11 and Vβ3 in 5C.C7 TCR transgenic mice on the B10.BR background or crossed with 129 mice. (A) Reduced 5C.C7 TCR expression in naive lymph node cells of 5C.C7 TCR transgenic mice crossed with 129 vav−/− mice (Upper). After these cells were primed with irradiated B10.BR splenocytes and 3 μM MCC peptide for 5–7 days, only cells positive for both Vα11 and Vβ3 survived (Lower). Naive and primed cells were stained for Vα11 and Vβ3 on different days. Minor differences in staining efficiency may therefore account for the differences in the absolute Vα11 staining intensity between naive and primed cells. (B) Comparable 5C.C7 TCR expression in lymph node cells of 5C.C7 TCR transgenic mice crossed with 129 wild-type or 129 vav−/− mice. Irrespective of the vav genotype, normal levels of the 5C.C7 TCR have been reduced to 6–11% by negative selection, presumably by a superantigen from the 129 background (Upper). After these cells were primed as described in A, only Vα11 and Vβ3-positive cells survived (Lower).
Vav Plays a Role in the Regulation of Actin Cytoskeletal Rearrangements in Superantigen-Mediated T Cell Activation.
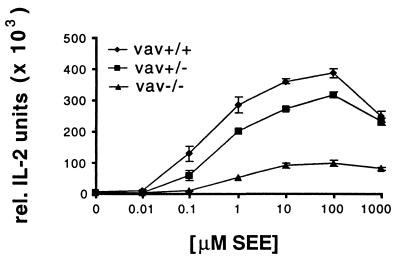
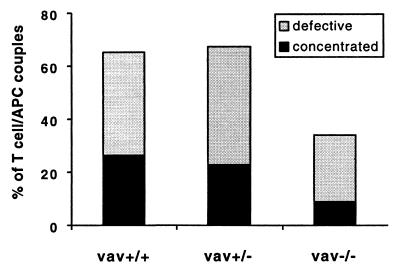
To corroborate our observations in a different experimental system, we studied the role of vav in superantigen-mediated T cell activation. We compared T cells from 129 mice that were either wild type, heterozygous, or deficient in vav when activated by a cellular interaction with 129 splenocytes or A20 B cell lymphoma cells in the presence of SEA or SEE. Importantly, the TCR repertoire of these mice is not restricted by the expression of a TCR transgene, and therefore the majority of the T cells are not subject to superantigen-mediated negative selection. We did not find a difference between the two superantigens in our assays and have, therefore, pooled the data. Similar to published work that used concanavalinA or antibodies to activate T cells, we found a small defect in IL-2 secretion for vav+/− and a larger defect for the vav−/− lymphocytes in comparison to vav+/+ cells (Fig. 5) (17). These defects are also evident in the proliferative response to superantigen (data not shown). The surface expression of CD4 and different TCR Vβ domains is the same irrespective of the vav genotype (data not shown). To study the involvement of vav in T cell activation-related cytoskeletal rearrangements, we monitored the accumulation of MHC II/TCR at the T cell/APC interface in the presence of superantigen using our I-Ek–GFP transfected A20 B cell lymphoma cells. For the vav+/+ T cells, even in the presence of a high concentration of SEA or SEE (10 μg/ml), we found that only about one-fourth of the T cell/APC couples showed accumulation of I-Ek in a concentrated form. A similar percentage of cell couples showed a diffuse accumulation, an unstable accumulation, or no accumulation at all (Fig. 6). The formation of a tight T cell/APC interface was undisturbed (data not shown). Thus, superantigen-mediated T cell activation is more heterogeneous in its MHC II accumulation phenotype than that driven by peptide/MHC. Because it has been shown that the signal transduction through the TCR/CD3 complex can differ substantially in response to MHC/peptide vs. superantigen, it seems conceivable that the relative lack of a concentrated MHC II accumulation in the T cell response to superantigen/APC is related to this signal transduction phenomenon (28). Comparing vav+/+ to vav+/− T cells in MHC II accumulation, we found that the former showed a somewhat more concentrated and less diffuse accumulation (Fig. 6), even though this difference is not statistically significant. In contrast, all forms of MHC II accumulation occurred substantially less frequently in vav−/− T cells than in vav+/+ cells. Vav thus does play a role in the regulation of cytoskeletal rearrangements in superantigen-mediated T cell activation, although in this context it is less sensitive to the gene dose. Because our experiments with peptide/MHC vs. superantigen-mediated T cell activation have been done on different genetic backgrounds, we cannot distinguish whether the different severity of the phenotype of the vav heterozygous mice is due to the genetic background or because of a difference in signal transduction through the TCR/CD3 complex.
Figure 5.
IL-2 secretion dose response to SEE differs significantly between wild-type and vav−/− T cells. Experiments were performed as in Fig. 3 except for the use of 1 μg/ml SEE instead of the MCC peptide. Wild-type mouse splenocytes (129) were used as APCs. Data are representative of six independent experiments.
Figure 6.
MHC II accumulation during superantigen-mediated T cell stimulation differs significantly between vav+/+ and vav−/− cells and to a lesser extent between vav+/+ and vav+/− cells. I-Ek-GFP transfected A20 B cell lymphoma cells were loaded with 10 μM SEA or SEE and were used to stimulate either vav+/+, vav+/−, or vav−/− T cells. The I-Ek–GFP accumulation at the T cell/APC interface was analyzed as described in Fig. 2. The number of T cell/APC couples analyzed in each experiment for vav+/+, vav+/−, and vav−/− cells is n = 33, n = 30, and n = 35, respectively. The data are derived from three independent sets of experiments.
Summary.
We show here that with two different types of TCR ligands that vav is an important regulator of the cell surface rearrangements that correlate with productive T cell activation. The pronounced haploinsufficiency (29, 30) of vav in T cells activated by MHC/peptide suggests that in those cells vav is not only an important but also a central regulator. It should be noted that the observed phenotype could have been exacerbated by the reduced reactivity of the mixed background T cells in an unknown way. Interestingly, the phenotype of vav heterozygous T cells resembles that of a moderate block in costimulation. Costimulatory receptors, however, have been shown to be central regulators of cytoskeletal rearrangements in T cell activation (9) (C.W. et al., unpublished work). The data represented here thus support the notion that vav is a central regulator of the costimulation-controlled cytoskeletal rearrangements during T cell activation.
Acknowledgments
We thank Dr. Victor Tybulewicz for generously providing the vav knockout mice and for helpful discussions. We also thank Nelida Prado for help in animal care. C.W. was supported by a European Molecular Biology Organization long-term fellowship and the Howard Hughes Medicial Institute and A.B., by a Cancer Research Fund of the Damon Runyon–Walter Winchell Foundation Fellowship, DRG-1518. We also thank the Howard Hughes Medical Institute for supporting these studies.
Abbreviations
- APC
antigen-presenting cell
- TCR
T cell receptor
- MHC
major histocompatibility complex
- GFP
green fluorescent protein
- SEA and SEE
staphylococcal superantigen A and E
- MCC
moth cytochrome c
References
- 1.Davis M M, Boniface J J, Reich Z, Lyons D, Hampl J, Arden B, Chien Y. Annu Rev Immunol. 1998;16:523–544. doi: 10.1146/annurev.immunol.16.1.523. [DOI] [PubMed] [Google Scholar]
- 2.Owen J J, Cooper M D, Raff M C. Nature (London) 1974;249:361–363. doi: 10.1038/249361a0. [DOI] [PubMed] [Google Scholar]
- 3.Negulescu P A, Krasieva T B, Khan A, Kerschbaum H H, Cahalan M D. Immunity. 1996;4:421–430. doi: 10.1016/s1074-7613(00)80409-4. [DOI] [PubMed] [Google Scholar]
- 4.Dustin M L, Bromley S K, Kan Z, Peterson D A, Unanue E R. Proc Natl Acad Sci USA. 1997;94:3909–3913. doi: 10.1073/pnas.94.8.3909. [DOI] [PMC free article] [PubMed] [Google Scholar]
- 5.Wülfing C, Sjaastad M D, Davis M M. Proc Natl Acad Sci USA. 1998;95:6302–6307. doi: 10.1073/pnas.95.11.6302. [DOI] [PMC free article] [PubMed] [Google Scholar]
- 6.Monks C R, Kupfer H, Tamir I, Barlow A, Kupfer A. Nature (London) 1997;385:83–86. doi: 10.1038/385083a0. [DOI] [PubMed] [Google Scholar]
- 7.Monks C R, Freiberg B A, Kupfer H, Sciaky N, Kupfer A. Nature (London) 1998;395:82–86. doi: 10.1038/25764. [DOI] [PubMed] [Google Scholar]
- 8.Grakoui A, Bromley S K, Sumen C, Davis M M, Shaw A S, Allen P M, Dustin M L. Science. 1999;285:221–226. [PubMed] [Google Scholar]
- 9.Wülfing C, Davis M M. Science. 1998;282:2266–2270. doi: 10.1126/science.282.5397.2266. [DOI] [PubMed] [Google Scholar]
- 10.Holsinger L J, Graef I A, Swat W, Chi T, Bautista D M, Davidson L, Lewis R S, Alt F W, Crabtree G R. Curr Biol. 1998;8:563–572. doi: 10.1016/s0960-9822(98)70225-8. [DOI] [PubMed] [Google Scholar]
- 11.Fischer K D, Kong Y Y, Nishina H, Tedford K, Marengere L E, Kozieradzki I, Sasaki T, Starr M, Chan G, Gardener S, et al. Curr Biol. 1998;8:554–562. doi: 10.1016/s0960-9822(98)70224-6. [DOI] [PubMed] [Google Scholar]
- 12.Bauch A, Alt F W, Crabtree G R, Snapper S B. Adv Immunol. 2000;75:89–114. doi: 10.1016/s0065-2776(00)75002-4. [DOI] [PubMed] [Google Scholar]
- 13.Katzav S, Martin-Zanca D, Barbacid M. EMBO J. 1989;8:2283–2290. doi: 10.1002/j.1460-2075.1989.tb08354.x. [DOI] [PMC free article] [PubMed] [Google Scholar]
- 14.Crespo P, Schuebel K E, Ostrom A A, Gutkind J S, Bustelo X R. Nature (London) 1997;385:169–172. doi: 10.1038/385169a0. [DOI] [PubMed] [Google Scholar]
- 15.Han J, Das B, Wei W, Van Aelst L, Mosteller R D, Khosravi-Far R, Westwick J K, Der C J, Broek D. Mol Cell Biol. 1997;17:1346–1353. doi: 10.1128/mcb.17.3.1346. [DOI] [PMC free article] [PubMed] [Google Scholar]
- 16.Nobes C D, Hall A. Biochem Soc Trans. 1995;23:456–459. doi: 10.1042/bst0230456. [DOI] [PubMed] [Google Scholar]
- 17.Tarakhovsky A, Turner M, Schaal S, Mee P J, Duddy L P, Rajewsky K, Tybulewicz V L. Nature (London) 1995;374:467–470. doi: 10.1038/374467a0. [DOI] [PubMed] [Google Scholar]
- 18.Zhang R, Alt F W, Davidson L, Orkin S H, Swat W. Nature (London) 1995;374:470–473. doi: 10.1038/374470a0. [DOI] [PubMed] [Google Scholar]
- 19.Fischer K D, Zmuldzinas A, Gardner S, Barbacid M, Bernstein A, Guidos C. Nature (London) 1995;374:474–477. doi: 10.1038/374474a0. [DOI] [PubMed] [Google Scholar]
- 20.Turner M, Mee P J, Walters A E, Quinn M E, Mellor A L, Zamoyska R, Tybulewicz V L. Immunity. 1997;7:451–460. doi: 10.1016/s1074-7613(00)80367-2. [DOI] [PubMed] [Google Scholar]
- 21.Seder R A, Paul W E, Davis M M, Fazekas de St, Groth B. J Exp Med. 1992;176:1091–1098. doi: 10.1084/jem.176.4.1091. [DOI] [PMC free article] [PubMed] [Google Scholar]
- 22.Chiang Y J, Kole H K, Brown K, Naramura M, Fukuhara S, Hu R J, Jang I K, Gutkind J S, Shevach E, Gu H. Nature (London) 2000;403:216–220. doi: 10.1038/35003235. [DOI] [PubMed] [Google Scholar]
- 23.Bachmaier K, Krawczyk C, Kozieradzki I, Kong Y Y, Sasaki T, Oliveira-dos-Santos A, Mariathasan S, Bouchard D, Wakeham A, Itie A, et al. Nature (London) 2000;403:211–216. doi: 10.1038/35003228. [DOI] [PubMed] [Google Scholar]
- 24.Fang N, Koretzky G A. J Biol Chem. 1999;274:16206–16212. doi: 10.1074/jbc.274.23.16206. [DOI] [PubMed] [Google Scholar]
- 25.Klasen S, Pages F, Peyron J F, Cantrell D A, Olive D. Int Immunol. 1998;10:481–489. doi: 10.1093/intimm/10.4.481. [DOI] [PubMed] [Google Scholar]
- 26.Kim H H, Tharayil M, Rudd C E. J Biol Chem. 1998;273:296–301. doi: 10.1074/jbc.273.1.296. [DOI] [PubMed] [Google Scholar]
- 27.Girgis L, Davis M M, de St Groth B F. J Exp Med. 1999;189:265–278. doi: 10.1084/jem.189.2.265. [DOI] [PMC free article] [PubMed] [Google Scholar]
- 28.Bolliger L, Johansson B, Palmer E. Mol Immunol. 1997;34:819–827. doi: 10.1016/s0161-5890(97)00122-3. [DOI] [PubMed] [Google Scholar]
- 29.Fisher E, Scambler P. Nat Genet. 1994;7:5–7. doi: 10.1038/ng0594-5. [DOI] [PubMed] [Google Scholar]
- 30.Engelkamp D, van Heyningen V. Curr Opin Genet Dev. 1996;6:334–342. doi: 10.1016/s0959-437x(96)80011-6. [DOI] [PubMed] [Google Scholar]
- 31.Krummel, M. F., Sjaastad, M. D. & Wülfing, C. (2000) Science, in press. [DOI] [PubMed]


