

Abstract
Recent evidence suggests that proteins at equilibrium can exist in a manifold of conformational substates, and that these substates play important roles in protein function. Therefore, there is great interest in identifying regions in proteins that are in conformational exchange. Electron paramagnetic resonance spectra of spin-labeled proteins containing the nitroxide side chain (R1) often consist of two (or more) components that may arise from slow exchange between conformational substates (lifetimes > 100 ns). However, crystal structures of proteins containing R1 have shown that multicomponent spectra can also arise from equilibria between rotamers of the side chain itself. In this report, it is shown that these scenarios can be distinguished by the response of the system to solvent perturbation with stabilizing osmolytes such as sucrose. Thus, site-directed spin labeling (SDSL) emerges as a new tool to explore slow conformational exchange in proteins of arbitrary size, including membrane proteins in a native-like environment. Moreover, equilibrium between substates with even modest differences in conformation is revealed, and the simplicity of the method makes it suitable for facile screening of multiple proteins. Together with previously developed strategies for monitoring picosecond to millisecond backbone dynamics, the results presented here expand the timescale over which SDSL can be used to explore protein flexibility.
Keywords: site-directed spin labeling, osmolyte perturbation, R1 rotameric equilibria, protein conformational equilibria
Introduction
By virtue of their microscopic size and finite compressibility, proteins are inherently flexible structures, characterized by volume and structure fluctuations at equilibrium.1 It is now clear that structural fluctuations occurring on the picosecond to millisecond timescale are intimately involved in function, save for proteins with a purely structural role (see Henzler-Wildman and Kern2 for a recent review).
The dynamic modes are apparently hierarchical.3,4 In this view, a given state of a protein consists of an ensemble of conformational substates in equilibrium, each with a lifespan in the range of microsecond to millisecond before migrating to another substate (conformational exchange). These conformational substates are termed taxonomic substates because they are generally of small number and live sufficiently long to be described in molecular detail. In turn, each conformational substate consists of other substates called statistical substates because of their large number and short lifetimes in the picosecond to nanosecond range.5 The statistical substates contribute to protein entropy,6 and transitions among these statistical substates correspond to high-frequency motions of the backbone and side chains about their average positions.
In regard to protein function, the conformational substates may correspond, for example, to the open and closed states of molecular gates in ligand binding proteins,7 to specific conformations along a catalytic pathway in enzymes,8,9 or their existence may give rise to diversity of ligand recognition in antibodies10,11 and promiscuity in protein–protein recognition in signal transduction.12,13 Indeed, recent NMR studies provide compelling evidence that the conformational substates of ubiquitin in solution may represent the complete manifold of conformations adopted in promiscuous binding interactions.14 Flexibility on the picosecond to nanosecond timescale, due to transitions between statistical substates, plays a role in protein-ligand and protein–protein interactions,15–18 and in providing flexible hinge regions to allow transitions between conformational substates.19
The elucidation of the molecular mechanisms of protein function thus requires information on protein motions over a wide range of timescales, and it is essential to develop experimental strategies that allow one to observe both backbone motions and conformational exchange in systems at equilibrium. NMR spectroscopy has been particularly effective in this regard in studies of small proteins in solution,20 but equivalent measurements on high-molecular weight soluble proteins, membrane bound proteins, and transient complexes between them remain challenging, particularly when it is desired to screen a large number of such proteins.
Site-directed spin labeling (SDSL) has the potential to provide information on protein motions occurring on the above timescales without limitations regarding the size or complexity of the system. Moreover, soluble or membrane proteins can be investigated under strictly physiological conditions in a native-like environment. In SDSL, a nitroxide side chain is introduced in a site-specific manner. The most widely used is that designated R1 (see Fig. 1), although many others have been developed.21,22 Motions of the R1 nitroxide group on the picosecond to nanosecond timescale result in magnetic relaxation that determines the EPR spectrum. Thus, backbone fluctuations that occur on this timescale can contribute directly to the EPR spectrum, and SDSL has been shown to provide a measure of fast backbone dynamics.23,24 This capability should be particularly valuable for locating dynamically disordered domains within proteins, and for identifying natively unfolded proteins and monitoring their interactions with binding partners.25,26
Figure 1.
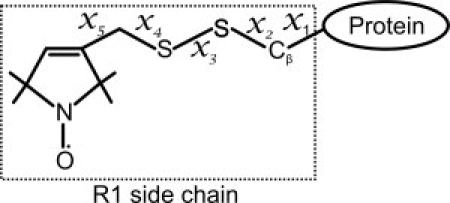
Structure of the R1 nitroxide side chain.
Although fast backbone motions are directly revealed in the EPR spectrum, detection of conformational exchange on the microsecond to millisecond timescale requires a fundamentally different approach, because such motions are too slow to produce relaxation effects that reveal themselves in the spectra. Rather, equilibria between conformational substates in exchange on this timescale are revealed as multicomponent (complex) EPR spectra, provided that R1 is in a region where it has distinct interactions with the local environment in the different substates. Examples of complex spectra and their analysis in terms of a two-state conformational equilibrium model are given in Kusnetzow et al.27 and Crane et al.28
Combined X-ray crystallography, mutagenesis, and EPR studies revealed that complex spectra can also arise from the existence of multiple rotamers of R1 at a given site.29–31 Therefore, to use SDSL as a tool to positively identify conformational exchange in an equilibrium mixture, it is essential to develop experimental strategies that can be used to distinguish protein conformational equilibria from R1 rotameric equilibria as origins of complex spectra.
One approach that can be used for this purpose is to measure the response of the spin-labeled protein to solvent perturbation by osmolytes, which are small organic molecules that either stabilize or destabilize proteins with respect to unfolding. Protecting osmolytes increase the stability of proteins, and include carbohydrates, free amino acids and their derivatives, and methylamines.32,33 It is well established that protecting osmolytes are excluded from the surface of proteins (preferential hydration), thereby raising the chemical potential of the protein in relation to the area exposed to solvent,34 although the relationship may not be simple.35 Because the unfolded state has a larger area in contact with solvent than the native state, it is destabilized relative to the native state. On the other hand, denaturing osmolytes (e.g., urea) are preferentially accumulated at the surface and have the opposite effect.36
The molecular origin of the osmolyte effect on protein stability appears to be result of interaction of the osmolyte with the peptide backbone, which is unfavorable (relative to water) for protecting osmolytes and favorable for denaturing osmolytes.37,38 It follows that osmolytes should also drive folding of partially unfolded states of proteins, and in fact, such solutes drive a largely unfolded sequence in the transporter BtuB to a folded state.39,40 In addition, recent studies have also shown that osmolytes attenuate structural fluctuations of proteins in their native state.41–44
In general, different conformational substates of a protein are expected to have different solvent accessible surface areas, even if the structural differences are more subtle than those between the folded and unfolded states. If so, osmolytes should shift the equilibrium among substates and have measurable effects on complex EPR spectra of R1. In contrast, complex spectra arising solely from rotameric equilibria of R1 are expected to be relatively insensitive to osmolytes due to the small difference, if any, in solvent exposed area of the protein for different rotamers. Thus, the response of multicomponent spectra to osmolyte perturbation may provide the desired tool to distinguish R1 rotameric equilibria from protein conformational equilibria; this study evaluates this proposal. The experimental strategy is to examine the effect of osmolyte perturbation on multicomponent EPR spectra of R1 located at sites where the origin can be assigned with confidence to side chain rotamers, and at sites in proteins known to be in conformational exchange. As will be discussed later, examples of these situations are found in T4 lysozyme (T4L), rat intestinal fatty acid-binding protein (rIFABP), myoglobin (Myb), and the photoreceptor rhodopsin.
Results
Separation of osmotic from viscosity effects
To examine the osmolyte effect by SDSL, sucrose was selected as a well-characterized stabilizing osmolyte known to be preferentially excluded from the protein surface,45,46 and known to increase stability and reduce conformational fluctuations in proteins.42–44 Complication arises in assigning observed effects of sucrose to osmolarity, because sucrose also increases the viscosity of the solution, slowing the overall rotational diffusion rate of the protein. For small proteins (Mw < 50 kDa), the rotary motion contributes substantially to nitroxide magnetic relaxation and hence the X-band EPR spectrum. Ideally, one would want to compare the EPR spectrum in sucrose solution with that of the same sample obtained in a reference medium of the same effective viscosity, but with no osmolarity.
Solutions of Ficoll 70 are of high viscosity but low osmolarity, and should serve as a suitable reference medium. Moreover, Ficoll 70 appears to be inert with respect to protein interactions.47,48 For the purpose of this study, the effective viscosities of Ficoll 70 and sucrose solutions are considered to be matched at concentrations that result in equal protein rotational correlation times measured by a spin label rigidly attached on T4L (i.e., a spin label with no motion relative to the protein). In the experiments reported later, the osmolyte solution contains sucrose at 30% w/w and spectra are recorded at 295 K. As described in Methods section, the effective viscosity of this solution is matched by Ficoll 70 at 25% w/w at 295 K (Supporting Information Figure S1), in which the osmolarity is very low (78 mmol/kg) compared with that of 30% w/w sucrose (1460 mmol/kg). The other soluble proteins studied here have a similar size and shape to T4L and this concentration of Ficoll 70 is also used to match effective viscosities for these cases. Thus, osmotic effects alone due to sucrose can be isolated by comparing the EPR spectrum of an R1 mutant in a 30% sucrose solution to that in a 25% Ficoll 70 solution.
Although Ficoll 70 is a suitable viscosity agent, it can also act as a crowding agent favoring the states of a protein with the smallest excluded volume.49–51 Such effects are generally detected via stabilization of the protein against denaturation and via changes in the secondary structure,50 the effect being due to the larger excluded volume of the denatured state relative to the native state.52 To determine if Ficoll has significant crowding effects on T4L, apo-Myb, and apo-rIFABP (Mw < 20 kDa), denaturation studies were carried out in buffer, in sucrose, and in Ficoll (data provided in Supporting Information). In addition, changes in the secondary structures were monitored via far-UV CD spectroscopy. Thermal denaturation of T4L and apo-Myb, and guanidine denaturation of apo-rIFABP were essentially identical with and without 25% Ficoll. On the other hand, 30% sucrose produced substantial increases in the stability of each protein (Supporting Information Figure S2), as expected for a protecting osmolyte. Addition of Ficoll 70 did not induce any changes in the secondary structures of T4L, apo-rIFABP, and apo-Myb (Supporting Information Figure S3). The aforementioned results demonstrate that crowding effects of Ficoll can be ignored in the systems and sites studied here. Further evidence showing a lack of crowding effects from Ficoll 70 will be provided later with respect to apo-Myb.
Contribution of protein rotary diffusion to nitroxide motion in T4L and the effect of sucrose and Ficoll on R1 internal motion
In general, at noninteracting, solvent-exposed helical sites (i.e., where interactions of the nitroxide with the protein are absent), the internal motion of R1 is weakly ordered, giving rise to single-component EPR spectra characteristic of z-axis anisotropic diffusion.22,53 The motion of the nitroxide in this state has contributions from R1 internal motions and the overall rotary diffusion of the protein. Increasing the viscosity of the solution with sucrose or Ficoll reduces the contribution from protein rotary diffusion, but is not expected to influence the internal motion of R1.54,55 To demonstrate this point, sites 72 and 131 in T4L were selected for introduction of R1. Both sites are located at solvent exposed surfaces of helices and both have single component EPR spectra reflecting the weakly ordered state.22,53,55 Moreover, both are located in a stable protein fold with no evidence for multiple conformational substates in equilibrium on the microsecond to millisecond timescale,56 although low-amplitude backbone fluctuations on the picosecond to nanosecond timescale might exist.23
The EPR spectra of 72R1 and 131R1 in buffer alone are shown in Figure 2 (Row a), and are similar to those published previously.57 For each mutant in either sucrose (Row b) or Ficoll (Row c), the spectra clearly reflect the change in motion due to attenuation of rotary diffusion. To completely eliminate the protein rotary diffusion, two immobilization strategies were used, both of which generate chemical crosslinks via native lysine residues. There are 13 native lysines in T4L, and multiple points of attachment and strong immobilization of the protein are anticipated, as has been observed in a number of proteins.58 In one strategy, the protein was covalently attached to a CNBr modified Sepharose solid support, which occurs by reaction of ɛ-amino groups of lysine with the activated substrate to form a Sepharose-bound isourea59; this method has been used previously to immobilize T4L for SDSL studies.60 In the glutaraldehyde crosslinking strategy, a Schiff's base is formed between ɛ-amino groups of lysine and aldehyde functions on monomeric and polymeric forms of glutaraldehyde61; the reaction has been used to immobilize proteins for NMR62 and EPR studies63 The EPR spectra of 72R1 and 131R1 immobilized by these methods are shown in Figure 2 (Rows d and e). In each case, a small spectral component corresponding to an immobilized state (arrow) was observed. This is very likely due to a fraction of the nitroxide being immobilized by direct interaction with the matrix near a site of attachment with Sepharose, or with another T4L molecule near a site of crosslinking in the case of glutaraldehyde. Replacing K135 near 131R1 with alanine reduces the amount of the immobilized component, supporting the earlier interpretations (see legend of Fig. 2).
Figure 2.
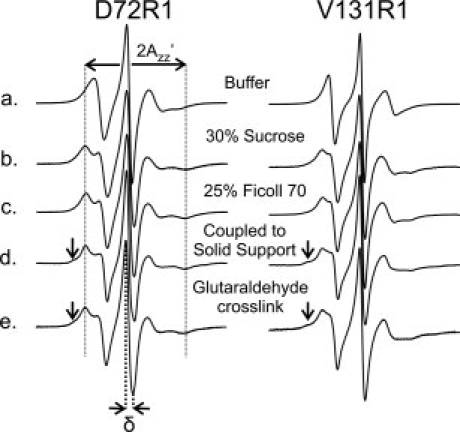
Contribution of protein rotational diffusion to the motion of 72R1 and 131R1. EPR spectra of residues 72R1 and 131R1 in T4L recorded under the indicated conditions. The central line width (δ) and the splitting of the resolved hyperfine extrema ( ) are defined on the spectra of 72R1. The arrows identify a minor spectral component. In the case of 131R1, neighboring lysine K135 was replaced with alanine for the spectra in (d) and (e) to avoid coupling near the nitroxide side chain. Previous studies have shown that this i + 4 mutation had little effect on the EPR spectrum of 131R1 in solution.55
As shown in Figure 2, the EPR spectra of T4L 72R1 in sucrose and in Ficoll 70 are indistinguishable from one another and from the major components of the spectra for the proteins immobilized on Sepharose or by crosslinking; the same is true for 131R1. The inverse of the central line width (δ−1) and the splitting of the hyperfine extrema () indicated in Figure 2 are measures of nitroxide mobility.24 For either residue, the maximum variation in these quantities is only about 15% for δ−1 and 4% for  .
.
To evaluate if either sucrose or Ficoll 70 influences the internal motions of R1, the spectra of residue 72R1 attached to the CNBr modified Sepharose support were recorded over a range of sucrose concentrations (0–30%) and with 25% Ficoll 70. Figure 3 shows that neither sucrose (up to 30%) nor Ficoll (25%) have a substantial influence on the internal motion of R1; δ−1 and between buffer and 30% sucrose differ by only 8 and 2%, respectively. The difference between buffer and 25% Ficoll is negligible. These results demonstrate that: (i) 30% sucrose and 25% Ficoll indeed remove the effect of protein rotary diffusion in a similar fashion and (ii) neither sucrose nor Ficoll substantially influence the internal motion of the R1 side chain.
Figure 3.
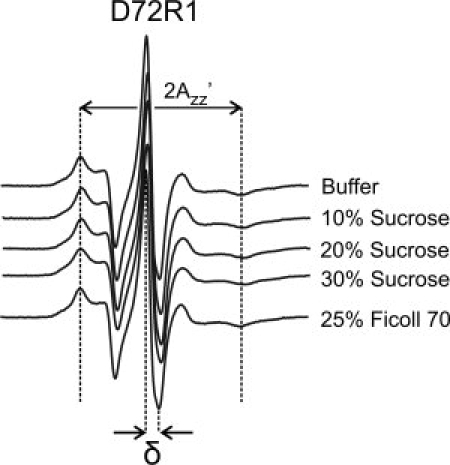
Effect of sucrose and Ficoll 70 on the internal motions of R1 at residue 72R1 of T4L. EPR spectra of 72R1 attached to the Sepharose solid support in buffer and the indicated concentrations of sucrose and Ficoll 70.
To further evaluate if R1 internal modes are largely unaffected by osmotic perturbation in stable protein folds (i.e., those without conformational fluctuations), the motion of R1 was explored at additional solvent-exposed and partially buried sites in T4L, where the nitroxide exhibits a single dynamic mode [cyan spheres in Fig. 4(A)]. The EPR spectra of some of these mutants in 30% sucrose were previously reported30,31,53,55 and the spectra obtained in this study are similar. Panels B and C of Figure 4 show a comparison of the spectra for each mutant in Ficoll and in sucrose, and it is evident that there are few differences in the spectra of R1 (if any at all). These mutants represent a range of protein local structures and side chain dynamics. The results show that the internal motion of R1 is not affected by osmolyte perturbation or microscopic viscosity in the presence of osmolytes.
Figure 4.
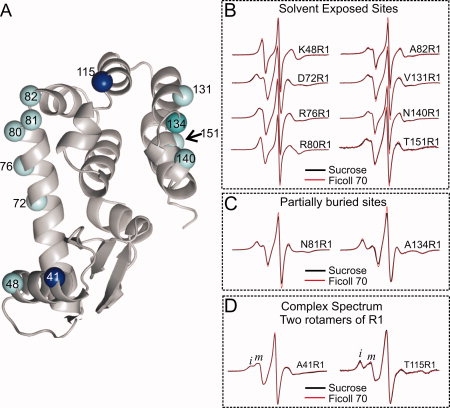
Effect of osmolyte perturbation on the motion of R1 in ordered regions of T4L. A: Ribbon diagram of T4L (PDB: 3LZM) showing sites where R1 was introduced. The spheres are color-coded to indicate sites where R1 has single-component (cyan) or multicomponent spectra arising from two rotamers of R1 (dark blue). B and C: EPR spectra of R1 at the indicated sites corresponding to cyan spheres in (A). In each case, the spectra in 30% w/w sucrose and in 25% w/w Ficoll 70 are superimposed. D: EPR spectra of residues 41R1 and 115R1 in sucrose and Ficoll 70. Letters i and m identify components of the spectra that correspond to relatively immobile and mobile states of R1.
Effect of osmolytes on R1 rotamer equilibria
Earlier studies based on X-ray crystallography and mutagenesis indicated that the complex spectra of T4L mutants 41R1 and 115R1 [dark blue spheres in Fig. 4(A)] arise from the presence of two rotamers of the R1 side chain.30,31 The spectra of 41R1 and 115R1 in Ficoll are shown in Figure 4(D) (red trace) in which two components are resolved, corresponding to relatively immobile (i) and mobile (m) states of the side chain. The spectra in sucrose (black traces) are essentially identical, indicating that rotameric equilibria of R1 at these sites are insensitive to osmolyte perturbation.
Although structural data are not available, it is likely that the two-component spectra of the 129R1, 136R1, and 139R1 mutants of holo-Myb [Fig. 5(A)] also arise from multiple rotamers with differential interactions in the structure, rather than from multiple protein conformations. Indeed, mutation of nearby residues E136 and K140 to Ala strongly reduces the immobilized component of the 139R1 spectrum (Supporting Information Figure S4). Moreover, residues 129, 136, and 139 are located in the N-terminal region of helix H, which has been identified as one of the most stable regions of the holo-Myb molecule64 and apparently does not undergo conformational exchange in solution.65 As shown in Figure 5(B), there is no significant difference between the spectra of 129R1, 136R1, and 139R1 in Ficoll (red trace) and sucrose (black trace). Collectively, the aforementioned results show that rotameric equilibria of R1, like the internal motion, are insensitive to osmolyte perturbation.
Figure 5.
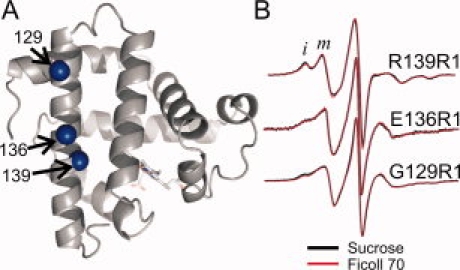
Effect of osmolyte perturbation on the motion of R1 in ordered regions of holo-Myb. A: Ribbon diagram of holo-Myb (PDB ID: 2MBW) showing spheres at sites where R1 was introduced. B: The corresponding EPR spectra of 129R1, 136R1, and 139R1 in 30% w/w sucrose and 25% w/w Ficoll 70 are superimposed. Letters i and m identify components of the spectra that correspond to relatively immobile and mobile states of R1.
Effect of osmolytes on conformational equilibria
To study the effect of osmolyte perturbation on proteins with previously characterized conformational exchange, apo-rIFABP, apo-Myb, and light-activated rhodopsin were selected as model systems. For each of these proteins, experimental evidence suggests that the conformational exchange occurs on the microsecond to millisecond timescale in discrete regions of the molecules.27,65–67 However, the amplitudes and types of motions represented by each protein system are very different. Apo-rIFABP provides an example of low-amplitude fluctuations of a short helix,66 whereas light-activated rhodopsin involves a large-scale rigid body displacement (6 Å) of a helix in a transition between conformational substates.68 In apo-Myb, a short region (corresponding to helix F in the holo form) is believed to undergo conformational exchange as inferred from NMR line broadening, but no direct information is available on the structures of the substates involved.65
Apo-rat intestinal fatty acid-binding protein
rIFABP is a β-clam protein that binds fatty acids in an internal cavity formed by opposing and roughly orthogonal β sheets.66 NMR studies have identified three distinct regions of the apo-protein that undergo conformational exchange on the microsecond to millisecond timescale66 and that exhibit structural heterogeneity in solution (PDB ID: 1AEL). These flexible regions are thought to constitute a dynamic portal, which regulates the entry and exit of the fatty acids.7,69 Figure 6(A) shows a superposition of two of the NMR derived structures from the ensemble, with sequences identified to be in conformational exchange highlighted (i.e., helix αII, and βC-βD and βD-βE turns).
Figure 6.
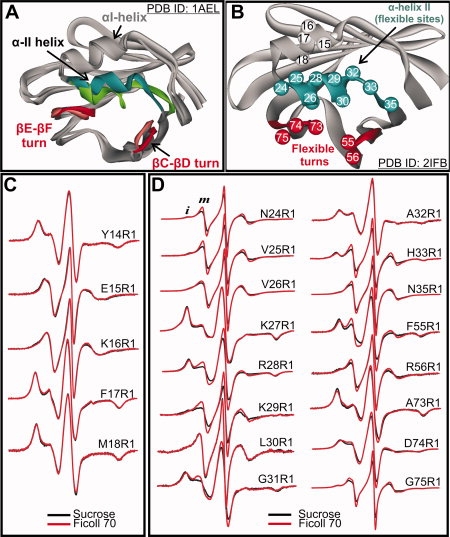
Effect of osmolyte perturbation on the motion of R1 in ordered and flexible regions of apo-rIFABP. A: Ribbon diagram of apo-rIFABP showing 2 of the 20 NMR structures consistent with structural constraints (Hodsdon and Cistola66; PDB: 1AEL). The flexible regions are highlighted (green and blue for α-helix II and red for the βC-βD and βE-βF turns). B: Ribbon diagram of the holo protein (PDB ID: 2IFB) showing the positions where R1 was introduced. C: EPR spectra of R1 at sites in α-helix I in 30% w/w sucrose and 25% w/w Ficoll. D: EPR spectra of R1 at sites in the flexible regions of apo-rIFABP in 30% w/w sucrose and 25% w/w Ficoll. Letters i and m identify components that correspond to relatively immobile and mobile states of R1, respectively.
Based on this information, R1 was introduced at sites throughout αII, (24–35) in the βC/βD turn (55 and 56) and in the βE/βF turn (73–75) [Fig. 6(B)]. As a reference, R1 was also introduced at sites 14–18 in helix αI, which is spatially adjacent to αII, but not thought to be in conformational exchange.66 The EPR spectra recorded in Ficoll at the sites investigated are shown in Figure 6 (Panels C and D, red traces). With few exceptions, the EPR spectra in αII, the βC/βD and the βE/βF turns are complex, with components corresponding to relatively immobile and mobile states of R1. The nitroxide mobility for R1 residues in αII, measured by the inverse central line width (δ−1), reveals the basic periodicity expected for a helix (see Fig. 7). Although there are an insufficient number of sites in αI to judge periodicity, the mobility is consistent with expectations based on the crystal structure (PDB ID: 1IFC), (i.e., solvent exposed residues 15R1 and 16R1 have relatively high mobility, whereas the buried or partially buried residues 14R1, 17R1, and 18R1 are immobilized).
Figure 7.
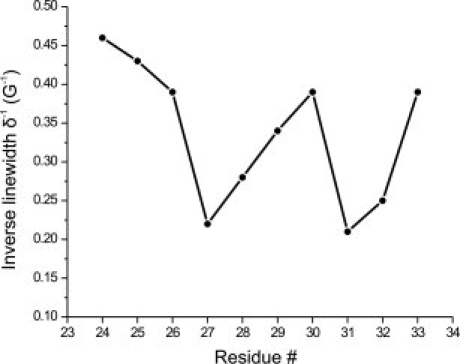
Inverse central line width versus sequence for R1 residues in the αII-helix of apo-rIFABP.
The spectra of R1 at sites within helix αI show no response to osmotic perturbation [Fig. 6(C)], consistent with the single conformation of αI determined by NMR relaxation.66 On the other hand, the majority of the residues in the αII helix and in the βC/βD and βE/βF turns showed substantial sensitivity to osmolyte perturbation [Fig. 6(D), black traces]. In each case, sucrose increased the fraction of immobile components relative to the more mobile ones, reflecting a shift in the equilibrium between the states that give rise to these components. Similar effects were observed when sarcosine and betaine were used as the osmotic perturbants (data not shown).
To evaluate these results more quantitatively, some of the spectra showing significant differences between Ficoll and sucrose were fit to a two-component model to estimate the relative populations and the apparent equilibrium constant K = [m]/[i] (Supporting Information Figure S5 and Table S2). In Ficoll, K ranges from 0.41 (at 31R1) to 2.33 (at 56R1). Addition of sucrose decreased K by 25–57%, corresponding to free-energy shifts (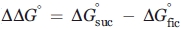 ) of +169 to +492 cal/mol. In addition to the changes in K predicted by the osmolyte effect, sucrose also caused small changes in the effective correlation time (τ) and order parameter (S) of the mobile component, but essentially no change in those parameters for the immobile component (Supporting Information Table S2 and Discussion).
Apo-myoglobin
The holo- and apo-forms of myoglobin have similar tertiary structures in solution65,73 with the exception of residues 82–101, which form the F helix and flanking residues in the holo form (PDB ID: 2MBW), but are apparently in conformational exchange on the microsecond to millisecond timescale in the apo-protein.74 To evaluate the effect of osmolyte perturbation on this flexible region of apo-Myb, the R1 side chain was introduced at five sites within the region, and the spectra were recorded in sucrose and in Ficoll. As a series of controls, the R1 chain was also incorporated at sites in the helices A, B, D, E, and in the N-terminal region of helix H [Fig. 8(A)], which are not thought to be in conformational exchange in apo-Myb.65 The corresponding EPR spectra are shown in Figure 8(B,C). The motion of all R1 residues located in ordered regions of apo-Myb were insensitive to osmolyte perturbation [Fig. 8(B)]. The spectra of R1 at every site located within the helix F region have two dominant components, reflecting relatively immobilized (i) and highly mobile (m) states of the R1 side chain. The highly mobile state is similar to the EPR spectrum of R1 in unstructured protein sequences.75,76 Thus, these results suggest equilibrium between a folded and a partially or fully unfolded state of helix F of apo-Myb.
Figure 8.
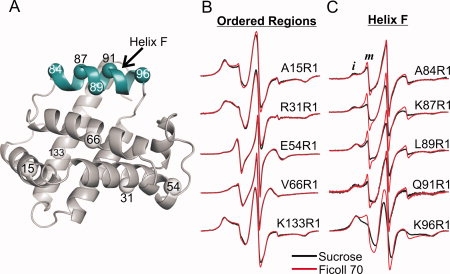
Effect of osmolyte perturbation on the motion of R1 in ordered and flexible sequences of apo-Myb. A: Ribbon diagram of holo-Myb (PDB ID: 2MBW) showing spheres at the sites where R1 was introduced. The sequence in conformational exchange in the apo form is highlighted in cyan. B: EPR spectra of R1 at sites in ordered regions of apo-Myb in 30% w/w sucrose and 25% w/w Ficoll 70. C: EPR spectra of R1 at sites in helix F in 30% w/w sucrose and 25% w/w Ficoll 70 are compared. Letters i and m identify spectral components that correspond to relatively immobile and mobile states of R1, respectively.
In contrast to the results for R1 in the ordered regions, sucrose has a significant effect on the relative populations of i and m states of R1 along helix F, substantially reducing the more mobile state with a concomitant increase in the immobilized population [Fig. 8(C)]. Qualitatively, the aforementioned results are similar to the effect observed in the flexible αII helix in rIFABP, where sucrose shifts the equilibrium toward the more immobilized state(s). The spectra for 84R1, 87R1, 89R1, and 91R1 in sucrose and in Ficoll were fit to a two-component model (Supporting Information Figure S6). The apparent equilibrium constants K = [m]/[i] in Ficoll ranged from 0.20 to 0.35. Addition of sucrose decreased K by 34–46% (Supporting Information Table S3), corresponding to free energy differences () of +236 to +348 cal/mol, similar to the range in apo-rIFABP.
As the aforementioned results suggest equilibrium between a folded and a partially or fully unfolded state of helix F in apo-Myb, Ficoll could, in principle, exert crowding effects, although it has essentially no effect on the thermal stability of apo-Myb (Supporting Information Figure S2) or on the far UV circular dichroism spectra (Supporting Information Figure S3). To directly examine whether Ficoll influences the localized conformational isomerization of helix F, apo-Myb with R1 at sites 87, 89, or 91 was immobilized on a Sepharose solid support in which any crowding effects of Ficoll could be isolated. As shown by the data in Figure 9, the addition of Ficoll had no effect on the spectra, whereas the addition of sucrose showed the same effect as in solution relative to Ficoll.
Figure 9.
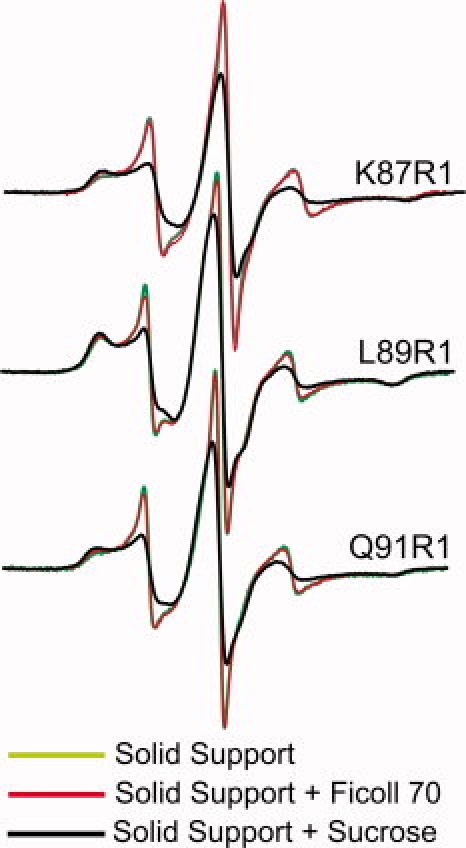
Effect of sucrose and Ficoll on the conformational isomerization of helix F in apo-Myb attached to a solid Sepharaose support. The EPR spectra of R1 at the indicated sites in buffer, in 25% w/w Ficoll 70, and in 30% w/w sucrose are superimposed.
Light-activated rhodopsin
SDSL studies on rhodopsin in dodecyl maltoside micelles were the first to identify a rigid body outward tilting motion of the transmembrane helix 6 (TM6) as a dominant element of the activation switch in this membrane-associated G-protein coupled receptor70,71 [Fig. 10(A)]. The helix motion was identified most clearly by residue 250R1 located on the inner surface of TM627 [Fig. 10(A)]. In the inactive state, the spectrum of 250R1 reveals strong immobilization of the nitroxide [Fig. 10(B), blue trace] as expected from the location buried in the center of the helix bundle. On light activation and the ensuing outward motion of TM6, constraints on the motion of the nitroxide are removed and the spectrum reflects an increase in mobility [Fig. 10(C), red trace]. This interpretation of the spectral change of 250R1 is supported by a study in which R1 was placed at each site (one at a time) through the cytoplasmic ends of TM5 and TM6 and the interconnecting loop.70 Moreover, quantitative distance measurements using SDSL and DEER spectroscopy68 confirmed the movement, and showed the amplitude to be about 6 Å; recent crystal structures also provide support for the model.72 Residue 250R1 has been extensively used as a “sensor” for this helix motion,77,78 and is similarly applied in this study.
Figure 10.
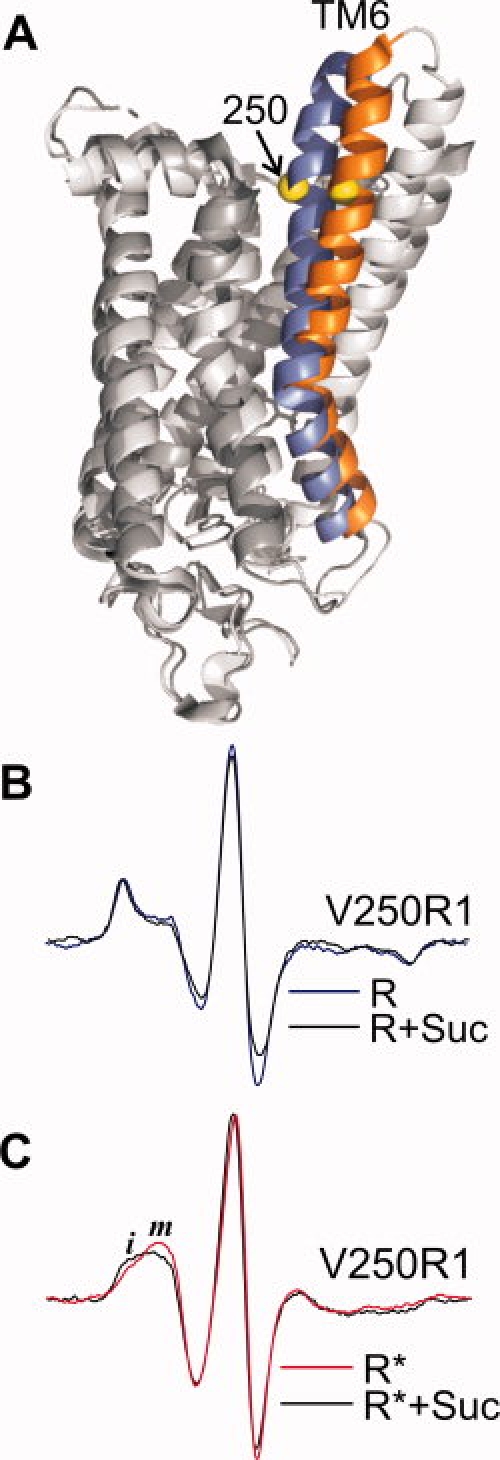
Osmolyte perturbation effect on a conformational equilibrium in photoactivated rhodopsin. A: Ribbon models of rhodopsin in the inactive state (PDB ID: 1GZM) and in the presumed active state (PDB ID: 3DQB) superimposed. The positions of the transmembrane helix 6 (TM6) in the inactive and active states are identified in blue and orange, respectively. The yellow sphere identifies residue 250 where R1 was introduced. B: EPR spectra of residue 250R1 in the inactive state (R) (blue trace) and in 30% w/w sucrose (black trace). C: EPR spectra of residue 250R1 in the photoactivated state (R*) in buffer (red trace) and in 30% w/w sucrose (black trace) are superimposed. Letters i and m identify spectral components that correspond to relatively immobile and mobile states of R1, respectively.
Although the spectrum of 250R1 shows an increase in mobility on activation, consistent with TM6 motion, the spectrum has been shown to have two components corresponding to strongly immobilized and mobile states of R127 [arrows, Fig. 10(C)]. The two components have been suggested to arise from equilibrium of the protein between two substates; one similar to the inactive state and the other with TM6 in the outward tilted position.27 Within the context of this model, addition of an osmolyte would be expected to shift the equilibrium toward the substate with the helix inward, because that is the least solvated state, and the EPR spectrum would reflect this shift as an increase in the more immobilized population. For rhodopsin in micelles of dodecyl maltoside the high-molecular weight of the combined protein and micelle (≈100 kDa) results in an overall rotational diffusion that is sufficiently slow to render unnecessary concerns about changes in solution viscosity due to sucrose addition. Thus, an osmotic effect of sucrose is directly revealed without the need for comparison in Ficoll solution.
Figure 10(B,C) (black traces) shows that the addition of sucrose to the inactive state of rhodopsin has little effect on the motion of 250R1, but substantially shifts the population toward the more immobilized component in the active state. This demonstrates that the local protein conformation around 250R1 is shifted by the osmolyte toward a more compact state, and the simplest interpretation is that TM6 equilibrium is shifted towards the helix “in” state. This is consistent with the expected effect of osmolyte perturbation acting directly on the protein, but could also have a contribution from a slight increase in micelle chain packing due to sucrose addition (López and Hubbell, unpublished). Irrespective of the detailed mechanism, the result demonstrates that a conformationally flexible region of the protein is modulated by osmolyte perturbation.
Discussion
Suitability of Ficoll 70 as an agent to selectively reduce rotational diffusion
In the studies of the small (15–19 kDa) model proteins investigated here (i.e., T4L, rIFABP, and Myb), a 25% Ficoll 70 solution was used to match the effective viscosity of a solution with that of a 30% sucrose solution. Although Ficoll can exert molecular crowding effects,50,51 it does not appear to do so for the proteins investigated in this study (Supporting Information Figures S2 and S3). Indeed, at concentrations up to 25%, Ficoll has no measurable effect on the conformational equilibria of helix F residues in apo-Myb (see Fig. 9). However, if Ficoll 70 or another similar agent is used to increase viscosity in other systems, it is important to test for potential crowding effects, particularly in proteins that have a tendency to oligomerize. For sufficiently high-molecular weight proteins (>50 kDa) and membrane associated proteins, it is unnecessary to use an agent to match the effective viscosity of sucrose due to the already slow diffusion of the protein. Because the Ficoll molecule (∼70 kDa) is considerably larger than each of the model proteins, the microscopic viscosity at the protein surface in a Ficoll solution is essentially the same as in pure buffer. Thus, one would not expect Ficoll to influence the internal motion of R1, and the data presented in Figures 2 and 3 strongly support this conclusion. Together, the results demonstrate that for the small proteins investigated here, Ficoll 70 can be used as a simple viscosity agent to reduce the protein rotational diffusion rate with no additional effects on the protein or R1 side chain motion.
Effect of sucrose on the dynamics of R1 in well-ordered protein sequences
In comparing the effect of sucrose with that of Ficoll to isolate osmolyte perturbation effects, it is assumed that there is no effect of microscopic viscosity on the internal dynamics of R1, at least in the narrow range of viscosities studied. As discussed previously, the microscopic viscosity near the protein surface in 25% Ficoll is essentially the same as buffer, and consequently has no effect on R1 internal dynamics. Sucrose at 30% also has little effect on R1 internal motions as illustrated by the data in Figure 3. This is not surprising if one considers the nitroxide as a small molecule, diffusing on the surface of the protein. Stokes–Einstein behavior predicts that  , where τ, η, and r are the correlation time, the viscosity of the medium, and the hydrodynamic radius of the diffusing species, respectively. As the radius of the protein is at least an order of magnitude larger than that of the nitroxide, the effect of viscosity is ≈1000 times smaller on the R1 internal motion compared with the rotational diffusion of the protein.
In principle, an increase in the solution viscosity could damp the rate of ns backbone fluctuations (“slaved processes”; Beece et al.79; Fenimore et al.80); such effects would be manifested as an increase in the central line width (δ) of the EPR spectrum. However, the EPR spectra of R1 at solvent exposed sites in ordered sequences throughout T4L, apo-rIFABP, and apo-Myb show little if any difference between sucrose and Ficoll [Figs. 4(B), 6(C), and 8(B)] solutions that differ in microscopic viscosity by about a factor of 3. The amplitude of backbone fluctuations or the change in viscosity might be too small to yield an observable effect in ordered sequences. For complex spectra of R1 at sites in conformational exchange, the rate of motion (1/τ) of the most mobile component is reduced to some extent by sucrose, as determined by spectral simulations (Supporting Information Tables S2–S3). Although it is possible that this apparent reduction of rate of the more mobile state is the results of sucrose damping flexible backbone motions, it is also possible that it arises from heterogeneity of the mobile state (i.e., the “mobile” state could actually consist of a manifold of states with similar, but not identical, dynamic properties). Population shifts among states in this heterogeneous mixture due to osmolyte perturbation would appear as changes in rate, and hence as changes in 1/τ when interpreted in the simple two-state model.
The frequency of slow conformational exchange is also predicted to be slaved to solvent fluctuations80 and hence to be dependent on microscopic viscosity. However, if this effect is present, it cannot be detected because the exchange rate is slow on the EPR timescale and therefore will not affect the spectra of the individual states involved.
Osmolyte perturbation on R1 rotameric equilibria and protein conformational equilibria
Complex EPR spectra reflecting multiple dynamic modes of the R1 side chain are very common in SDSL studies. Before this study, determining the origins of complex EPR spectra was challenging because multiple dynamic modes of the nitroxide can result from simple R1 rotameric equilibria in a static protein structure, but also from conformational exchange. The data presented in this report suggest a simple solution to this problem, namely the response of the protein to osmolyte perturbation as reflected in the EPR spectrum. Although there are a limited number of examples, the data in Figures 4D and 5 show that rotameric equilibria of R1 are insensitive to osmolyte perturbation, as anticipated from the small differences in solvent exposed area between rotamers of R1. On the other hand, R1 located at many sites within regions that are known to undergo microsecond to millisecond conformational exchange show substantial sensitivity to osmolyte perturbation (Figs. 6, 8, and 10).
The osmolyte-induced shifts in conformational equilibria in apo-IFABP and apo-Myb are small because they involve localized changes in relatively short helices where the difference in solvent exposed area between the conformers is not large. Bolen and coworker37 have shown that for global unfolding the major contribution to osmolyte stabilization is the positive free energy of transfer of the peptide group from water to osmolyte solution, which is about 56 cal/mol for 1M sucrose81 (≈30% w/w). Consider a simple two-state conformational fluctuation of a short helix of 10 residues, approximately the length of the helices examined in rIFABP and Myb, where state (i) is folded and state (m) is partially unfolded. If the transition (i) → (m) resulted in the exposure of five additional peptide groups to solvent, the difference in the standard state free energy change for the transition in water and sucrose,  would be 5 × 56 = 280 cal/mol from the peptide contribution alone, within the range 169–492 cal/mol estimated for the apo-rIFABP and apo-Myb transitions based on a two-state model. The conclusion that the peptide backbone dominates the osmolyte effect is based on global unfolding where the contribution from side chains to the free energy is small.37,82 However for local structural changes, the side chain contribution could be substantial and the aforementioned calculation would only be an order-of-magnitude estimate.
The aforementioned discussion regarding the mechanism of the osmolyte effect on conformational equilibria pertains to the helical fluctuations in apo-rIFABP and apo-Myb. The situation with the receptor rhodopsin might be different. In this case, the titling of TM6 outward by 6 Å opens a cleft in the center of the helix bundle68 that can be filled with water, but modeling shows that sucrose is too big to fully access the cavity. Thus, the addition of sucrose creates a chemical potential difference between water in the solution and in the cavity. As a result, water will flow out of the cavity until a new equilibrium is established with a uniform water chemical potential. Dehydration of the cavity leads to closure of the cleft by inward movement of TM6, as suggested by the data [Fig. 10(C)]. This is the “osmotic stress” mechanism discussed by Parsegian et al.,83 which has been shown to be applicable to water filled channels. As mentioned in the Results section, osmolyte effects on micelle chain packing could also contribute to the observed effect, and further studies are required to explore this possibility.
Summary and Conclusions
The data presented in this report show that osmolyte perturbation in combination with SDSL can be used to identify localized and subtle conformational fluctuations in proteins that have substates with microseconds or longer lifetimes. The major advantage of this method is simplicity; a protein fold can be sampled with a small number of R1 sensors on the outer surface where structural perturbations are minimal, and the response of the spin-labeled protein to sucrose or other osmolytes then is examined with a conventional EPR spectrometer. This new tool combined with earlier methods for sampling fast backbone dynamics24 expands the capability of SDSL for exploring protein dynamics. At the present stage, the method is qualitative. For example, it is not possible to determine the extent of conformational space sampled in the exchange process, nor can one deduce with certainty the number of such states involved. Nevertheless, a qualitative identification of the regions of a protein that are flexible and knowledge of the timescales of that flexibility are often what is needed to test models and to design additional experiments to determine the magnitude of changes involved using other methods (such as direct distance measurements using DEER spectroscopy84). Osmolyte perturbation is especially well-suited for identifying conformational exchange in high-molecular weight and membrane bound proteins for which the application of NMR methods is particularly challenging. It should be noted that in such cases the need for Ficoll as a reference state is unnecessary because the rotational diffusion is intrinsically slow.
Methods
Construction, expression, purification, and spin labeling of mutant proteins
T4 Lysozyme
The cysteine-less pseudo-wild type T4L construct (pHSe5) containing the substitutions C54T and C97A85 was a generous gift from F.W. Dahlquist (University of California, Santa Barbara, CA). The construction of cysteine mutants at positions 41, 48, 65, 72, 76, 80, 82, and 115 have been described elsewhere.30,31,55 Additional mutants were prepared using the overlap extension PCR method as described by Ho et al.86 All mutations were confirmed by DNA sequencing using the BigDye Terminator v3.1 Cycle Sequencing Kit (Applied Biosystems, CA). The mutants for T4L were transformed into Escherichia coli BL21 expression strain (Stratagene) and expressed and purified (>95% purity by SDS-PAGE) as described previously.55 Spin labeling was carried out at 4°C overnight via incubation with a 10-fold molar excess of (1-oxy-2,2,5,5,-tetramethylpyrrolinyl-3-methyl)-methanethiosulfonate (a gift of Kalman Hideg, University of Pecs, Hungary) in buffer (50 mM MOPS, 25 mM NaCl at pH 6.8). Excess spin-label reagent was removed using a HiTrap desalting column (GE Healthcare) and the protein concentrated using Amicon Ultra 10,000 MWCO (Millipore).
Apo-rIFABP
The plasmid pET11d (Novagen, Madison, WI) carrying the wild-type rat intestinal fatty acid binding protein was a generous gift from Alan K. Kleinfeld (Torrey Pines Institute for Molecular Studies, San Diego, CA). The cysteine substitutions at consecutive sites 14–35 and 55–56 were generated by using the QuickChange method; cysteine mutations for sites 73–75 were generated using the overlap extension PCR method.86 All mutations were confirmed by DNA sequencing. Mutant plasmids for rIFABP were transformed into the expression strain E. coli BL21(DE3). E. coli cells containing the rIFABP mutants constructs were inoculated in 20 mL of LB containing 100 μg/mL of ampicillin and the cells were allowed to grow overnight at 37°C. The overnight cultures were transferred to 1 L of fresh LB containing ampicillin and the cells were incubated at 37°C until OD600 = 1, at which point the expression was induced with 1 mM of IPTG and incubation continued at 37°C for 4 h. The cells were harvested by centrifugation at 6000 rpm and the cell pellets were resuspended in lysis buffer (50 mM Tris-Cl, 1 mM EDTA, 0.05% NaN3 at pH 8.0). The crude extract was then frozen at −20°C.
Purification of rIFABP mutants was done as described by Lowe et al.87 with some modifications. Following the ammonium fractionation step, the protein solution was loaded into a HiTrap SP HP column and a Hi Trap Q FF column connected in series (GE Healthcare) that were pre-equilibrated with low-salt buffer (20 mM phosphate buffer, 1 mM EDTA, 5 mM DTT at pH 7.3). The rIFABP fraction was collected under isocratic conditions because the proteins do not bind to any of the two columns used in this step. The rIFABP fractions were pooled and injected into a Superdex 75 gel filtration column (GE Healthcare). Sample purity was greater than 95% as judged by SDS-PAGE electrophoresis. For spin labeling, DTT was removed by using Hi Trap desalting column (GE Healthcare) equilibrated with spin labeling buffer (20 mM phosphate buffer, 1 mM EDTA at pH 7.3). The eluted protein was incubated immediately with 10-fold molar excess of MTSL reagent and allowed to react overnight at 4°C. Unreacted spin labeling reagent was removed with the same desalting column. The spin-label protein was concentrated with Amicon Ultra 10,000 MWCO. At this point, the protein contains endogenous fatty acids.87 To generate the apo form of rIFABP, the protein was delipidated with Lipidex 1000 as described by Glatz and Veerkamp.88
Myoglobin
The plasmid pET17b (Novagen, Madison, WI) carrying the wild-type sequence of sperm whale myoglobin was provided by Steven Boxer (Stanford University). The individual cysteine substitutions were introduced by using the QuickChange method (Stratagene, La Jolla, CA). All mutations were confirmed by DNA sequencing.
Apo-Myb mutants were expressed, purified, and lyophilized as described by Jennings et al.89 A fraction of the lyophilized protein was dissolved and unfolded in a solution containing 10 mM sodium acetate and 6M urea at pH 6.1 as described by Eliezer et al.90 After 30 min of incubation, the solution was diluted seven-fold using 10 mM sodium acetate at pH 6.1. At this point, a 10-fold molar excess of spin-labeling reagent (MTSL) was added and the solution was incubated for 2 h at 4°C. The solution was dialyzed extensively against 10 mM sodium acetate at pH 6.1 to remove any remaining HPLC solvent and any unreacted spin-labeling reagent. The spin-labeled protein was concentrated using Amicon Ultra 10,000 MWCO.
Holo-Myb mutants were purified as described by Springer et al.91 Spin labeling was carried out at 4°C overnight via incubation of a 10-fold molar excess of (1-oxy-2,2,5,5,-tetramethylpyrrolinyl-3-methyl)-methanethiosulfonate in spin-labeling buffer (50 mM MOPS, 25 mM NaCl at pH 6.8). Excess spin-label reagent was removed using HiTrap desalting column (GE Healthcare) and the protein was concentrated using Amicon Ultra 10,000 MWCO (Millipore).
Rhodopsin
The construction, expression, purification, and spin labeling of the rhodopsin mutant V250C in dodecyl maltoside has been described in detail elsewhere.27
Protein immobilization on CNBr sepharose beads
CNBr-acivated Sepharose 4B was purchased from GE Healthcare. The lyophilized media was suspended and washed several times with 1 mM HCl pH 2.0 following manufacturer instructions. HCl was removed with several medium volumes of coupling buffer (0.1M NaHCO3, 0.5M NaCl pH 8.3) except for apo-Myb, where 10 mM sodium acetate pH 6.1 was used instead. The spin-labeled proteins (2–4 mg) were diluted (Vf ∼ 400 μL) in the appropriate coupling buffer and added to the beads in a 2:1 protein solution/medium ratio. The coupling reaction was incubated overnight at 4°C. Any uncoupled protein was eluted with coupling buffer and the coupling efficiency was assessed by UV280 absorption. The coupling reaction typically yielded an estimated adsorption of 10 mg of protein per milliliter of medium. The immobilized protein was equilibrated with the appropriate buffer selected for EPR studies.
Protein immobilization using glutaraldehyde crosslinking
Four hundred micromolar of spin-label protein was incubated with 25-fold molar excess of ice-cold glutaraldehyde solution (Electron Microscopy Sciences, Hatfield, PA) at 4°C. The mixture was immediately loaded into a sealed 0.6 I.D. X 0.84 OD glass capillary tube (VitroCom, Inc., NJ) and the crosslinking reaction was allowed to proceed at room temperature. The crosslinked protein forms a gel with a yellowish color after ∼15 min of incubation time.
EPR spectroscopy
For spin-labeled T4L, Myb, and rIFABP, the EPR spectra were recorded in a Bruker ELEXSYS 580 fitted with a high-sensitivity resonator at 298 K using an incident microwave power of 20 mW and modulation amplitude of 1 Gauss. Samples of at least 6 μL were loaded in sealed glass capillary tubes (0.6 ID X 0.84 OD; VitroCom, Inc., NJ). Spectra were recorded at X-band frequency with a scan width of 100 Gauss. Solution spectra were measured either in 30% w/w sucrose or 25% w/w Ficoll 70 with a final protein concentration of 200–400 μM. To obtain EPR spectra of spin-labeled proteins immobilized on sepharose, ∼ 50 μL of the gel slurry containing the coupled protein was loaded into glass capillary tubes (1.5 ID X 1.8 ID; VitroCom, Inc., NJ).
The rhodopsin samples in dodecyl maltoside were loaded into a small volume aqueous flat cell (Wilmad Glass, Co., Inc.) and equilibrated in the dark for 30 min before the spectrum for the inactive state was collected. The protein was illuminated for 30 s in situ (λ > 514 nm) to obtain the active state, as described by Kusnetzow et al.27 Spectra of residue 250R1 were recorded at a modulation amplitude of 4 Gauss.
Matching the effective viscosities of Ficoll and sucrose solutions
The spin label 1–oxyl-2,5,5-trimethyl-2,4 diphenyl-2,5-dihydro-1H-pyrrol-3-ylmethyl methanethiosulfonate (a gift of Kalman Hideg, University of Pecs, Hungary) has been shown to give a nitroxide side chain (Supporting Information Figure S1, Panel A) that is fully immobilized with respect to the protein when reacted with a surface cysteine residue.92 This side chain was introduced at site 72 in T4L where there are minimal contributions from backbone fluctuations.22 To a good approximation, the motion of the nitroxide for this label then measures the rotational motion of the protein as a whole. For EPR spectra of a nitroxide whose motion is close to the rigid limit, the rotational correlation time (τR) can be estimated as
| (1) |
where is the observed outer hyperfine splitting,  is the value of hyperfine splitting in the absence of protein rotational motion, and a and b are constants.93 Thus, τR is measured by and the concentration of Ficoll that gives the same as a 30% w/w sucrose solution at 295 K has an equal effective viscosity with respect to protein rotary diffusion. EPR spectra were recorded in the presence of 30% w/w sucrose (∼0.988M) and as a function of Ficoll 70 in the range of 0–30% w/w. The hyperfine splittings were determined by individually fitting the low- and the high-field peaks to a mixture of gaussian and lorentzian lineshapes using the Xepr program (Bruker, Germany) and by measuring the magnetic field separation between the low- and high-field peaks to get . The hyperfine splitting in 30% w/w sucrose was 32.92 ± 0.02 G. A plot of versus Ficoll concentration (Supporting Information Figure S1, Panel B) showed that a solution containing 25% w/w Ficoll has a hyperfine splitting value of 32.94 ± 0.02 G, identical to that of sucrose within the experimental error. An overlay of the EPR spectra of R8 at site 72 in 30% w/w sucrose and 25% w/w Ficoll shows them to be essentially identical (Supporting Information Figure S1, Panel C).
Determination of osmolarity of sucrose and Ficoll 70 solutions
The osmolarity of 30% w/w sucrose and 25% w/w Ficoll 70 solutions were measured using a Wescor 5500 vapor pressure osmometer (Wescor, UT) according to manufacturer instructions.
Acknowledgments
The authors thank Michael Bridges for helpful discussions and careful reading of the manuscript, and Shirley Oga for generating all the myoglobin mutants and for recording the EPR spectra of a number of the mutants. They also thank Dr. Joseph Horwitz for technical assistance in the use of the CD spectrometer and Evan Brooks for providing technical assistance in generating the α-helix I mutants in rIFABP. Figures 4A, 5A, 8A, and 10A were generated using the PyMOL Molecular Graphics System.94
Glossary
Abbreviations:
- CNBr
cyanogen bromide
- MOMD
microscopic order/macroscopic disorder
- Myb
myoglobin
- rIFABP
rat intestinal fatty acid-binding protein
- SDSL
site-directed spin labeling
- T4L
T4 lysozyme.
References
- 1.Cooper A. Thermodynamic fluctuations in protein molecules. Proc Natl Acad Sci USA. 1976;73:2740–2741. doi: 10.1073/pnas.73.8.2740. [DOI] [PMC free article] [PubMed] [Google Scholar]
- 2.Henzler-Wildman K, Kern D. Dynamic personalities of proteins. Nature. 2007;450:964–972. doi: 10.1038/nature06522. [DOI] [PubMed] [Google Scholar]
- 3.Frauenfelder H, Parak F, Young RD. Conformational substates in proteins. Annu Rev Biophys Chem. 1988;17:451–479. doi: 10.1146/annurev.bb.17.060188.002315. [DOI] [PubMed] [Google Scholar]
- 4.Frauenfelder H, Sligar SG, Wolynes PG. The energy landscapes and motions of proteins. Science. 1991;254:1598–1603. doi: 10.1126/science.1749933. [DOI] [PubMed] [Google Scholar]
- 5.Frauenfelder H, McMahon BH, Austin RH, Chu K, Groves JT. The role of structure, energy landscape, dynamics, and allostery in the enzymatic reaction of myoglobin. Proc Natl Acad Sci USA. 2001;98:2370–2374. doi: 10.1073/pnas.041614298. [DOI] [PMC free article] [PubMed] [Google Scholar]
- 6.Palmer AG., III NMR probes of molecular dynamics: overview and comparison with other techniques. Annu Rev Biophys Biomol Struct. 2001;30:129–155. doi: 10.1146/annurev.biophys.30.1.129. [DOI] [PubMed] [Google Scholar]
- 7.Hodsdon ME, Cistola DP. Discrete backbone disorder in the nuclear magnetic resonance structure of the apo intestinal fatty acid-binding proteimplications for the mechanism of ligand entry. Biochemistry. 1997;36:1450–1460. doi: 10.1021/bi961890r. [DOI] [PubMed] [Google Scholar]
- 8.Huang YJ, Montelione GT. Proteins flex to function. Nature. 2005;498:36–37. doi: 10.1038/438036a. [DOI] [PubMed] [Google Scholar]
- 9.Eisenmesser EZ, Millet O, Labeikovsky W, Korzhnev DM, Wolf-Watz M, Bosco DA, Skalicky JJ, Kay LE, Kern D. Intrinsic dynamics of an enzyme underlies catalysis. Nature. 2005;438:117–121. doi: 10.1038/nature04105. [DOI] [PubMed] [Google Scholar]
- 10.James LC, Roversi P, Tawfik DS. Antibody multispecificity mediated by conformational diversity. Science. 2003;299:1362–1367. doi: 10.1126/science.1079731. [DOI] [PubMed] [Google Scholar]
- 11.Keskin O. Binding induces conformational changes of proteins correlate with their intrinsic fluctuations: a case study of antibodies. BMC Struct Biol. 2007;7:31–42. doi: 10.1186/1472-6807-7-31. [DOI] [PMC free article] [PubMed] [Google Scholar]
- 12.Woodside DG. Dancing with multiple partners. Sci STKE. 2002;2002:PE14. doi: 10.1126/stke.2002.124.pe14. [DOI] [PubMed] [Google Scholar]
- 13.Ma B, Shatsky M, Wolfson HJ, Nussinov R. Multiple diverse ligands binding at a single protein site: a matter of pre-existing populations. Protein Sci. 2002;11:184–197. doi: 10.1110/ps.21302. [DOI] [PMC free article] [PubMed] [Google Scholar]
- 14.Lange OF, Lakomek N, Farès C, Schröder GF, Walter KFA, Becker S, Meiler J, Grubümller H, Griesinger C, de Groot BL. Recognition dynamics up to microseconds revealed from an RDC-derived ubiquitin ensemble in solution. Science. 2008;320:1471–1475. doi: 10.1126/science.1157092. [DOI] [PubMed] [Google Scholar]
- 15.Kraulis PJ, Domaille PJ, Campbell-Burk SL, Van Aken T, Laue ED. Solution structure and dynamics of Ras p21GDP determined by heteronuclear three- and four- dimensional spectroscopy. Biochemistry. 1994;33:3515–3531. doi: 10.1021/bi00178a008. [DOI] [PubMed] [Google Scholar]
- 16.Palmer AG., III Probing molecular motion by NMR. Curr Opin Struct Biol. 1997;7:732–737. doi: 10.1016/s0959-440x(97)80085-1. [DOI] [PubMed] [Google Scholar]
- 17.Duggan BM, Dyson HJ, Wright PE. Inherent flexibility in a potent inhibitor of blood coagulation, recombinant anticoagulant protein c2. Eur J Biochem. 1999;265:539–584. doi: 10.1046/j.1432-1327.1999.00781.x. [DOI] [PubMed] [Google Scholar]
- 18.Adams PD, Loh AP, Oswald RE. Backbone dynamics of an oncogenic mutant of Cdc42Hs shows increased flexibility at the nucleotide binding site. Biochemistry. 2004;43:9968–9977. doi: 10.1021/bi0490901. [DOI] [PubMed] [Google Scholar]
- 19.Henzler-Wildman KA, Lei M, Thai V, Kerns SJ, Karplus M, Kern D. A hierarchy of timescales in protein dynamics is linked to enzyme catalysis. Nature. 2007;450:913–918. doi: 10.1038/nature06407. [DOI] [PubMed] [Google Scholar]
- 20.Mittermaier A, Kay LE. New tools provide new insights in NMR studies of protein dynamics. Science. 2006;312:224–228. doi: 10.1126/science.1124964. [DOI] [PubMed] [Google Scholar]
- 21.Mchaourab HS, Kálai T, Hideg K, Hubbell WL. Motions of spin-labeled side chains in T4 lysozyme: effect of side chain structure. Biochemistry. 1999;38:2947–2955. doi: 10.1021/bi9826310. [DOI] [PubMed] [Google Scholar]
- 22.Columbus L, Kálai T, Jekö J, Hideg K, Hubbell WL. Molecular motion of spin labeled side chains in α-helices: analysis by variation of side chain structure. Biochemistry. 2001;40:3828–3846. doi: 10.1021/bi002645h. [DOI] [PubMed] [Google Scholar]
- 23.Columbus L, Hubbell WL. A new spin on protein dynamics. Trends Biochem Sci. 2002;27:288–295. doi: 10.1016/s0968-0004(02)02095-9. [DOI] [PubMed] [Google Scholar]
- 24.Columbus L, Hubbell WL. Mapping backbone dynamics in solution with site-directed spin labeling: GCN4-58 bZip free and bound to DNA. Biochemistry. 2004;43:7273–7287. doi: 10.1021/bi0497906. [DOI] [PubMed] [Google Scholar]
- 25.Fink AL. Natively unfolded proteins. Curr Opin Struct Biol. 2005;15:35–41. doi: 10.1016/j.sbi.2005.01.002. [DOI] [PubMed] [Google Scholar]
- 26.Sugase K, Dyson HJ, Wright PE. Mechanism of coupled folding and binding of an intrinsically disordered protein. Nature. 2007;447:1021–1025. doi: 10.1038/nature05858. [DOI] [PubMed] [Google Scholar]
- 27.Kusnetzow A, Altenbach C, Hubbell WL. Conformational states and dynamics of rhodopsin in micelles and bilayers. Biochemistry. 2006;45:5538–5550. doi: 10.1021/bi060101v. [DOI] [PMC free article] [PubMed] [Google Scholar]
- 28.Crane JM, Suo YY, Lilly AA, Mao CF, Hubbell WL, Randall LL. Sites of interaction of a precursor polypeptide on the export chaperone SecB mapped by site-directed spin labeling. J Mol Biol. 2006;363:63–74. doi: 10.1016/j.jmb.2006.07.021. [DOI] [PMC free article] [PubMed] [Google Scholar]
- 29.Langen R, Oh KJ, Cascio D, Hubbell WL. Crystal structures of spin labeled T4 lysozyme mutants: implications for the interpretation of EPR spectra in terms of structure. Biochemistry. 2000;39:8396–8405. doi: 10.1021/bi000604f. [DOI] [PubMed] [Google Scholar]
- 30.Guo Z, Cascio D, Hideg K, Kálái T, Hubbell WL. Structural determinants of nitroxide motion in spin-labeled proteins: tertiary contact and solvent-inaccessible sites in helix G of T4 lysozyme. Protein Sci. 2007;16:1069–1086. doi: 10.1110/ps.062739107. [DOI] [PMC free article] [PubMed] [Google Scholar]
- 31.Guo Z, Cascio D, Hideg K, Hubbell WL. Structural determinants of nitroxide motion in spin-labeled proteins: solvent-exposed sites in helix B of T4 lysozyme. Protein Sci. 2008;17:228–239. doi: 10.1110/ps.073174008. [DOI] [PMC free article] [PubMed] [Google Scholar]
- 32.Yancey PH, Clark ME, Hand SC, Bowlus RD, Somero GN. Living with water stress: evolution of osmolyte systems. Science. 1982;217:1214–1222. doi: 10.1126/science.7112124. [DOI] [PubMed] [Google Scholar]
- 33.Yancey PH. Organic osmolytes as compatible, metabolic and counteracting cytoprotectants in high osmolarity and other stresses. J Exp Biol. 2005;208:2819–2830. doi: 10.1242/jeb.01730. [DOI] [PubMed] [Google Scholar]
- 34.Arakawa T, Timasheff SN. The stabilization of proteins by osmolytes. Biophys J. 1985;47:411–414. doi: 10.1016/S0006-3495(85)83932-1. [DOI] [PMC free article] [PubMed] [Google Scholar]
- 35.Auton M, Ferreon AC, Bolen DW. Metrics that differentiate the origins of osmolyte effects on protein stability: a test of the surface tension proposal. J Mol Biol. 2006;361:983–992. doi: 10.1016/j.jmb.2006.07.003. [DOI] [PubMed] [Google Scholar]
- 36.Timasheff S, Xie G. Preferential interactions of urea with lysozyme and their linkage to protein denaturation. Biophys Chem. 2003;105:421–448. doi: 10.1016/s0301-4622(03)00106-6. [DOI] [PubMed] [Google Scholar]
- 37.Liu Y, Bolen BD. The peptide backbone plays a dominant role in protein stabilization by naturally occurring osmolytes. Biochemistry. 1995;34:12884–12891. doi: 10.1021/bi00039a051. [DOI] [PubMed] [Google Scholar]
- 38.Bolen WD, Rose GD. Structure and energetic of the hydrogen-bonded backbone in protein folding. Annu Rev Biochem. 2008;77:339–362. doi: 10.1146/annurev.biochem.77.061306.131357. [DOI] [PubMed] [Google Scholar]
- 39.Fanucci GE, Lee JY, Cafiso DS. Spectroscopic evidence that osmolytes used in crystallization buffers inhibit a conformational change in a membrane protein. Biochemistry. 2003;42:13106–13112. doi: 10.1021/bi035439t. [DOI] [PubMed] [Google Scholar]
- 40.Kim M, Xu Q, Fanucci GE, Cafiso DS. Solutes modify a conformational transition in a membrane transport protein. Biophys J. 2006;90:2922–2929. doi: 10.1529/biophysj.105.078246. [DOI] [PMC free article] [PubMed] [Google Scholar]
- 41.Butler SL, Falke JJ. Effects of protein stabilizing agents on thermal backbone motions: a disulfide trapping study. Biochemistry. 1996;35:10595–10600. doi: 10.1021/bi961107v. [DOI] [PMC free article] [PubMed] [Google Scholar]
- 42.Kendrick BS, Chang BS, Arakawa T, Peterson B, Randolph TW, Manning MC, Carpenter JF. Preferential exclusion of sucrose from recombinant interleukin-1 receptor antagonist: role in restricted conformational mobility and compaction of the native state. Proc Natl Acad Sci USA. 1997;94:11917–11922. doi: 10.1073/pnas.94.22.11917. [DOI] [PMC free article] [PubMed] [Google Scholar]
- 43.Cioni P, Bramanti E, Strambini GB. Effects of sucrose on the internal dynamics of azurin. Biophys J. 2005;88:4213–4222. doi: 10.1529/biophysj.105.060517. [DOI] [PMC free article] [PubMed] [Google Scholar]
- 44.Chen LY, Ferreira JAB, Costa SMB, Cabrita GJM, Otzen DE, Melo EP. Compaction of ribosomal protein S6 by sucrose occurs only under native conditions. Biochemistry. 2006;45:2189–2199. doi: 10.1021/bi051490g. [DOI] [PubMed] [Google Scholar]
- 45.Lee JC, Timasheff S. The stabilization of proteins by sucrose. J Biol Chem. 1981;256:7193–7201. [PubMed] [Google Scholar]
- 46.Lee JC, Gekko K, Timasheff S. Measurements of preferential solvent interaction by densimetric techniques. Methods Enzymol. 1981;61:26–49. doi: 10.1016/0076-6879(79)61005-4. [DOI] [PubMed] [Google Scholar]
- 47.Luby-Phelps K, Castle PE, Taylor DL, Lanni F. Hindered diffusion of inert tracer particles in the cytoplasm of mouse 3T3 cells. Proc Natl Acad Sci USA. 1987;84:4910–4913. doi: 10.1073/pnas.84.14.4910. [DOI] [PMC free article] [PubMed] [Google Scholar]
- 48.Zhou HX, Rivas G, Minton AP. Macromolecular crowding and confinement: biochemical, biophysical, and potential physiological consequences. Annu Rev Biophys. 2008;37:375–397. doi: 10.1146/annurev.biophys.37.032807.125817. [DOI] [PMC free article] [PubMed] [Google Scholar]
- 49.Wenner JR, Bloomfield VA. Crowding effects on EcoRV kinetics and binding. Biophys J. 1999;77:3234–3241. doi: 10.1016/S0006-3495(99)77154-7. [DOI] [PMC free article] [PubMed] [Google Scholar]
- 50.Stagg L, Zhang SQ, Cheung MS, Wittung-Stafshede P. Molecular crowding enhances native structure and stability of α/β protein flavodoxin. Proc Natl Acad Sci USA. 2007;104:18976–18981. doi: 10.1073/pnas.0705127104. [DOI] [PMC free article] [PubMed] [Google Scholar]
- 51.Roque A, Ponte I, Suau P. Macromolecular crowding induces a molten globule state in the c-terminal domain of histone H1. Biophys J. 2007;93:2170–2177. doi: 10.1529/biophysj.107.104513. [DOI] [PMC free article] [PubMed] [Google Scholar]
- 52.Minton AP. Excluded volume as a determinant of macro-molecular structure and reactivity. Biopolymers. 1981;20:2093–2120. [Google Scholar]
- 53.Fleissner M, Cascio D, Hubbell WL. Structural origins of weakly ordered nitroxide motion in spin labeled proteins. Protein Sci. 2009;18:893–908. doi: 10.1002/pro.96. [DOI] [PMC free article] [PubMed] [Google Scholar]
- 54.Timofeev VP, Tsetlin VI. Analysis of mobility protein side chains by spin label technique. Biophys Struct Mech. 1983;10:93–108. [Google Scholar]
- 55.Mchaourab HS, Lietzow MA, Hideg K, Hubbell WL. Motion of spin-labeled side chain in T4 lysozyme. Correlation with protein structure and dynamics. Biochemistry. 1996;35:7692–7704. doi: 10.1021/bi960482k. [DOI] [PubMed] [Google Scholar]
- 56.Anderson DE, Lu J, McIntosh L, Dahlquist FW. The folding, stability, and dynamics of T4 lysozyme: a perspective using nuclear magnetic resonance. In: Clore GM, Gronenbron AM, editors. NMR of proteins. Boca Raton, FL: CRC; 1993. pp. 258–304. [Google Scholar]
- 57.Liang Z, Lou Y, Freed J, Columbus L, Hubbell W. A multifrequency electron spin resonance study of T4 lysozyme dynamics using the slowly relaxing local structure model. J Phys Chem B. 2004;108:17649–17659. [Google Scholar]
- 58.Wilchek M, Miron T. Oriented versus random protein immobilization. J Biochem Biophys Methods. 2003;55:67–70. doi: 10.1016/s0165-022x(02)00178-1. [DOI] [PubMed] [Google Scholar]
- 59.Lowe CR, Dean PDG. Affinity chromatography. London: John Wiley; 1974. [Google Scholar]
- 60.Guo Z. 2003. Correlation of spin label side-chain dynamics with protein structure: studies of T4 lysozyme with site-directed mutagenesis and X-ray crystallography. Ph.D. Thesis. University of California, Los Angeles. [Google Scholar]
- 61.Migneault I, Dartiguenave C, Bertrand MJ, Waldron KC. Glutaraldehyde: behavior in aqueous solution, reaction with proteins, and application to enzyme crosslinking. Biotechniques. 2004;37:790–801. doi: 10.2144/04375RV01. [DOI] [PubMed] [Google Scholar]
- 62.Persson E, Halle B. Nanosecond to microsecond protein dynamics probed by magnetic relaxation dispersion of buried water molecules. J Am Chem Soc. 2008;130:1774–1787. doi: 10.1021/ja0775873. [DOI] [PubMed] [Google Scholar]
- 63.Thomas DD, Hidalgo C. Rotational motion of the sarcoplasmic reticulum Ca2+-ATPase. Proc Natl Acad Sci USA. 1978;75:5488–5492. doi: 10.1073/pnas.75.11.5488. [DOI] [PMC free article] [PubMed] [Google Scholar]
- 64.Cavagnero S, Thériault Y, Narula SS, Dyson HJ, Wright P. Amide proton hydrogen exchange rates for sperm whale myoglobin obtained from 15N-1H NMR spectra. Protein Sci. 2000;9:186–193. doi: 10.1110/ps.9.1.186. [DOI] [PMC free article] [PubMed] [Google Scholar]
- 65.Eliezer D, Wright P. Is apomyoglobin a molten globule? Structural characterization by NMR. J Mol Biol. 1996;263:531–538. doi: 10.1006/jmbi.1996.0596. [DOI] [PubMed] [Google Scholar]
- 66.Hodsdon ME, Cistola DP. Ligand binding alters the backbone mobility of intestinal fatty acid-binding protein as monitored by 15N NMR relaxation and 1H exchange. Biochemistry. 1997;36:2278–2290. doi: 10.1021/bi962018l. [DOI] [PubMed] [Google Scholar]
- 67.Knierim B, Hofmann KP, Ernst OP, Hubbell WL. Sequence of late molecular events in the activation of rhodopsin. Proc Natl Acad Sci USA. 2007;104:20290–20295. doi: 10.1073/pnas.0710393104. [DOI] [PMC free article] [PubMed] [Google Scholar]
- 68.Altenbach C, Kusnetzow AK, Ernst OP, Hofmann KP, Hubbell WL. High-resolution distance mapping in rhodopsin reveals the pattern of helix movement due to activation. Proc Natl Acad Sci USA. 2008;105:7439–7444. doi: 10.1073/pnas.0802515105. [DOI] [PMC free article] [PubMed] [Google Scholar]
- 69.Eads J, Sacchettini JC, Kromminga A, Gordon JI. Escherichia coli-derived rat intestinal fatty acid-binding protein with bound myristate at 1.5 Å resolution and I-FABPArg106→Gln with bound oleate at 1.74 Å resolution. J Biol Chem. 1993;268:26375–26385. [PubMed] [Google Scholar]
- 70.Altenbach C, Yang K, Farrens DL, Farahbakhsh ZT, Khorana HG, Hubbell WL. Structural features and light-dependent changes in the cytoplasmic interhelical E-F loop region of rhodopsa site-directed spin-labeling study. Biochemistry. 1996;35:12470–12478. doi: 10.1021/bi960849l. [DOI] [PubMed] [Google Scholar]
- 71.Farrens DL, Altenbach C, Yang K, Hubbell WL, Khorana HG. Requirement of rigid-body motion of transmembrane helices for light activation of rhodopsin. Science. 1996;274:768–770. doi: 10.1126/science.274.5288.768. [DOI] [PubMed] [Google Scholar]
- 72.Scheerer P, Park JH, Hildebrand PW, Kim YJ, Krauβ N, Choe H, Hofmann KP, Ernst OP. Crystal structure of opsin in its G-protein-interacting conformation. Nature. 2008;455:497–502. doi: 10.1038/nature07330. [DOI] [PubMed] [Google Scholar]
- 73.Lecompte JT, Kao YH, Cocco MJ. The native state of apomyoglobin described by proton NMR spectroscopy: the A-B-G-H interface of wild-type sperm whale apomyoglobin. Proteins. 1996;25:267–285. doi: 10.1002/(SICI)1097-0134(199607)25:3<267::AID-PROT1>3.0.CO;2-D. [DOI] [PubMed] [Google Scholar]
- 74.Eliezer D, Yao Y, Dyson HJ, Wright P. Structural and dynamic characterization of partially folded states of apomyoglobin and implications for protein folding. Nat Struct Biol. 1998;5:148–155. doi: 10.1038/nsb0298-148. [DOI] [PubMed] [Google Scholar]
- 75.Qu KB, Vaughn JL, Sienkiewicz A, Scholes CP, Fetrow JS. Kinetics and motional dynamics of spin-labeled yeast Iso-1-cytochrome c. I. Stopped-flow electron paramagnetic resonance as a probe for protein folding/unfolding of the C-terminal helix spin-labeled at cysteine 102. Biochemistry. 1997;36:2884–2897. doi: 10.1021/bi962155i. [DOI] [PubMed] [Google Scholar]
- 76.Langen R, Cai K, Altenbach C, Khorana HG, Hubbell WL. Structural features of the C-terminal domain of bovine rhodopsa site-directed spin-labeling study. Biochemistry. 1999;38:7918–7924. doi: 10.1021/bi990010g. [DOI] [PubMed] [Google Scholar]
- 77.Kim JM, Altenbach C, Kono M, Oprian DD, Hubbell WL, Khorana HG. Structural origins of constitutive activation in rhodopsrole of the K296/E113 salt bridge. Proc Natl Acad Sci USA. 2004;101:12508–12513. doi: 10.1073/pnas.0404519101. [DOI] [PMC free article] [PubMed] [Google Scholar]
- 78.Kim JM, Altenbach C, Thurmond RL, Khorana HG, Hubbell WL. Structure and function in rhodopsrhodopsin mutants with a neutral amino acid at E134 have a partially activated conformation in the dark state. Proc Natl Acad Sci USA. 1997;94:14273–14278. doi: 10.1073/pnas.94.26.14273. [DOI] [PMC free article] [PubMed] [Google Scholar]
- 79.Beece D, Einstein L, Frauenfelder H, Good D, Marden MC, Reinisch L, Reynolds AH, Sorensen B, Yue KT. Solvent viscosity and protein dynamics. Biochemistry. 1980;19:5147–5157. doi: 10.1021/bi00564a001. [DOI] [PubMed] [Google Scholar]
- 80.Fenimore PW, Frauenfelder H, McMahon BH, Parak FG. Slaving: solvent fluctuations dominate protein dynamics and functions. Proc Natl Acad Sci USA. 2002;99:16047–16051. doi: 10.1073/pnas.212637899. [DOI] [PMC free article] [PubMed] [Google Scholar]
- 81.Auton M, Bolen WD. Additive transfer free energies of the peptide backbone unit that are independent of the model compound and the choice of concentration scale. Biochemistry. 2004;43:1329–1342. doi: 10.1021/bi035908r. [DOI] [PubMed] [Google Scholar]
- 82.Wang A, Bolen WD. A naturally occurring protective system in urea-rich cells: mechanism of osmolyte protection of proteins against urea denaturation. Biochemistry. 1997;36:9101–9108. doi: 10.1021/bi970247h. [DOI] [PubMed] [Google Scholar]
- 83.Parsegian VA, Rand RP, Rau DC. Macromolecules and water: probing with osmotic stress. Methods Enzymol. 1995;259:43–94. doi: 10.1016/0076-6879(95)59039-0. [DOI] [PubMed] [Google Scholar]
- 84.Jeschke G. Distance measurements in the nanometer range by pulse EPR. ChemPhysChem. 2002;3:927–932. doi: 10.1002/1439-7641(20021115)3:11<927::AID-CPHC927>3.0.CO;2-Q. [DOI] [PubMed] [Google Scholar]
- 85.Matsumura M, Matthews BW. Control of enzyme activity by an engineered disulfide bond. Science. 1989;243:792–794. doi: 10.1126/science.2916125. [DOI] [PubMed] [Google Scholar]
- 86.Ho SN, Hunt HD, Horton RM, Pullen JK, Pease LR. Site-directed mutagenesis by overlap extension using the polymerase chain reaction. Gene. 1989;77:51–59. doi: 10.1016/0378-1119(89)90358-2. [DOI] [PubMed] [Google Scholar]
- 87.Lowe JB, Sacchettini JC, Laposata M, McQuillan JJ, Gordon JI. Expression of rat intestinal fatty acid-binding protein in Escherichia coli. J Biol Chem. 1987;262:5931–5937. [PubMed] [Google Scholar]
- 88.Glatz JFC, Veerkamp JH. Removal of fatty acids from serum albumin by Lipidex 1000 chromatography. J Biochem Biophys Methods. 1983;8:57–61. doi: 10.1016/0165-022x(83)90021-0. [DOI] [PubMed] [Google Scholar]
- 89.Jennings PA, Stone MJ, Wright PE. Overexpression of myoglobin and assignments of it amide, Cα and Cβ resonances. J Biomol NMR. 1995;6:271–276. doi: 10.1007/BF00197808. [DOI] [PubMed] [Google Scholar]
- 90.Eliezer D, Jennings PA, Dyson JH, Wright PE. Populating the equilibrium molten globule state of apomyoglobin under conditions suitable for structural characterization by NMR. FEBS Lett. 1997;417:92–96. doi: 10.1016/s0014-5793(97)01256-8. [DOI] [PubMed] [Google Scholar]
- 91.Springer B, Sligar SG. High-level expression of sperm whale myoglobin in Escherichia coli. Proc Natl Acad Sci USA. 1987;84:8961–8965. doi: 10.1073/pnas.84.24.8961. [DOI] [PMC free article] [PubMed] [Google Scholar]
- 92.Sale K, Sár C, Sharp KA, Hideg K, Fajer PG. Structural determination of spin label immobilization and orientation: a Monte Carlo minimization approach. J Magn Reson. 2002;156:104–112. doi: 10.1006/jmre.2002.2529. [DOI] [PubMed] [Google Scholar]
- 93.Freed JH. Theory of slow tumbling ESR spectra for nitroxides. In: Berliner LJ, editor. Spin labeling: theory and applications. New York: Academic Press; 1976. pp. 53–132. [Google Scholar]
- 94.DeLano WL. The PyMOL user's manual. Palo Alto, CA: DeLano Scientific; 2002. [Google Scholar]