

Abstract
Metabolic adaptation, and in particular the modulation of carbon assimilatory pathways during disease progression, is thought to contribute to the pathogenicity of Candida albicans. Therefore, we have examined the global impact of glucose upon the C. albicans transcriptome, testing the sensitivity of this pathogen to wide-ranging glucose levels (0.01, 0.1, and 1.0%). We show that, like Saccharomyces cerevisiae, C. albicans is exquisitely sensitive to glucose, regulating central metabolic genes even in response to 0.01% glucose. This indicates that glucose concentrations in the bloodstream (approximate range 0.05–0.1%) have a significant impact upon C. albicans gene regulation. However, in contrast to S. cerevisiae where glucose down-regulates stress responses, some stress genes were induced by glucose in C. albicans. This was reflected in elevated resistance to oxidative and cationic stresses and resistance to an azole antifungal agent. Cap1 and Hog1 probably mediate glucose-enhanced resistance to oxidative stress, but neither is essential for this effect. However, Hog1 is phosphorylated in response to glucose and is essential for glucose-enhanced resistance to cationic stress. The data suggest that, upon entering the bloodstream, C. albicans cells respond to glucose increasing their resistance to the oxidative and cationic stresses central to the armory of immunoprotective phagocytic cells.
INTRODUCTION
Effective responses to environmental change are fundamentally important for the survival of microbes. Environmental adaptation is particularly relevant for pathogenic microbes, which must counteract the defense systems of their host as well as tune their metabolism and stress homeostatic mechanisms to the complex microenvironments they encounter in the host.
Candida albicans is a major fungal pathogen of humans (Odds, 1988; Calderone, 2002). It exists as a commensal organism in the urogenital and gastrointestinal tracts and on the skin. It causes mucosal infections such as oral candidiasis and vaginitis in otherwise healthy individuals. Furthermore, it causes potentially fatal infections of the bloodstream and internal organs in severely immunocompromised patients. Therefore, C. albicans can thrive in diverse and complex niches within its human host.
The ability of this yeast to respond effectively to its microenvironment must contribute to its success as a pathogen. Two main observations reinforce this view. First, the disruption of certain metabolic or stress genes attenuates the virulence of C. albicans. For example, mutations that inactivate the glyoxylate cycle, gluconeogenesis, glycolysis, or fatty acid β-oxidation reduce virulence, albeit slightly in some cases (Lorenz and Fink, 2001; Barelle et al., 2006; Piekarska et al., 2006; Ramirez and Lorenz, 2007; Zhou and Lorenz, 2008). Therefore, this yeast requires metabolic flexibility, particularly in its pathways of carbon assimilation if it is to display normal levels of virulence even in the classical mouse model of disseminated candidiasis. Similarly, the inactivation of catalase, superoxide dismutase or the Hog1 stress-activated protein kinase (SAPK) attenuates the virulence of C. albicans (Wysong et al., 1998; Alonso-Monge et al., 1999; Hwang et al., 2002; Martchenko et al., 2004; Fradin et al., 2005). Therefore, both stress signaling and stress protective functions also contribute to the virulence of C. albicans.
The second main observation that revealed the environmental flexibility of C. albicans arose through studies of gene regulation. Genome-wide expression profiling has revealed that C. albicans modulates its metabolism and activates specific stress responses upon host contact. For example, glycolytic genes are down-regulated and glyoxylate cycle and fatty acid β-oxidation genes are up-regulated when C. albicans cells are exposed to blood, macrophages, or granulocytes (Fradin et al., 2003, 2005; Rubin-Bejerano et al., 2003; Lorenz et al., 2004). Furthermore, oxidative stress functions are up-regulated after phagocytosis by granulocytes (Fradin et al., 2005). Similar observations were made using more complex ex vivo and in vivo infection models (Thewes et al., 2007; Zakikhany et al., 2007). The metabolic and stress adaptation of C. albicans during the infection process has been confirmed by profiling the molecular behavior of single yeast cells by using diagnostic green fluorescent protein (GFP) fusions (Barelle et al., 2006; Enjalbert et al., 2007). However, this single-cell approach has revealed that C. albicans populations infecting the kidney are highly heterogeneous with respect to their molecular behavior. For example, only a small proportion of C. albicans cells infecting renal tissue activate the oxidative stress response (Enjalbert et al., 2007). Also, some C. albicans cells infecting kidney seem to assimilate carbon via glycolysis, whereas others seem to exploit the anabolic pathways of carbon metabolism (Barelle et al., 2006).
One must define the molecular responses of C. albicans to specific environmental stimuli if one is to understand the heterogeneous behavior of this pathogen within the complex microenvironments in vivo. We reasoned that the differential exposure of individual C. albicans cells to glucose might contribute to their heterogeneous metabolic behavior in vivo. Therefore in this study we have examined the responses of C. albicans to glucose by genome-wide expression profiling. We have compared the responses of this pathogen to those of the relatively benign yeast Saccharomyces cerevisiae because glucose responses are well characterized in this species.
Glucose has profound effects upon the metabolism and physiology of S. cerevisiae. In particular, metabolic pathways for the assimilation of alternative carbon sources are repressed in response to glucose. In addition, fermentative metabolism is up-regulated, and respiratory metabolism is down-regulated. Ribosome biogenesis and other growth related functions are up-regulated in cells exposed to glucose, whereas stress responses are down-regulated. S. cerevisiae has evolved complex and partially redundant signaling mechanisms to regulate its glucose responses (for reviews, see Gancedo, 1998, 2008; Carlson, 1999; Johnston, 1999; Thevelein and de Winde, 1999; Rolland et al., 2001). These include the Ras-cAMP-protein kinase A and the Snf3-Rgt2 and the Snf1-Glc7-Reg1 signaling pathways (Gancedo, 2008). In particular, the Ras-cAMP-protein kinase A pathway plays a key role in the activation of ribosome biogenesis as well as in the down-regulation of stress responses (Gounalaki and Thireos, 1994; Gorner et al., 1998; Stanhill et al., 1999; Garreau et al., 2000).
The S. cerevisiae cell is exquisitely sensitive to low concentrations of glucose, up-regulating glycolysis and down-regulating alternative pathways of carbon assimilation in response to glucose concentrations as low as 0.01% (Yin et al., 1996, 2003). This exquisite glucose sensitivity may have evolved because this yeast has adapted to cope with sudden transitions from famine to feast in the wild (Johnston, 1999). In contrast, the fungal pathogen C. albicans is thought to have evolved on warm-blooded animals (Odds, 1988). In the human host, blood glucose concentrations are maintained within homeostatic limits (0.05–0.1% glucose, equivalent to ∼3–5 mM glucose) that are well below the concentrations that are often applied in experimental yeast cultures (1–2% glucose). Furthermore, in contrast to S. cerevisiae (Postma et al., 1989), C. albicans has been classified as a Crabtree-negative yeast on the basis that it retains respiratory activity during growth at high glucose concentrations (Aoki and Ito-Kuwa, 1982; Niimi et al., 1988). Therefore, we reasoned that glucose responses might have diverged significantly in these pathogenic and benign yeasts. In this article, we show that there are broad similarities between C. albicans and S. cerevisiae with regard to the impact of glucose on their transcriptomes but that there are fundamental differences with respect to the impact of glucose upon stress responses in these yeasts.
MATERIALS AND METHODS
Strains and Growth Conditions
Strains used in this study are in Table 1. Strains were grown at 30°C in either YPD or YPLactate (2% Bacto-peptone and 1% yeast extract containing either 2% d-glucose or 2% lactate).
Table 1.
Strains used in this study
| Strain | Genotype | Source |
|---|---|---|
| SC5314 | Clinical isolate from the blood: Clade 1 | MacCallum et al. (2009) |
| AM2003-016 | Clinical isolate from the oropharynx: Clade 1 | MacCallum et al. (2009) |
| AM2003/0182 | Clinical isolate from the blood: Clade 2 | MacCallum et al. (2009) |
| AM2004/0028 | Clinical isolate from the oropharynx: Clade 2 | MacCallum et al. (2009) |
| b30708/5 | Clinical isolate from the blood: Clade 3 | MacCallum et al. (2009) |
| T101 | Clinical isolate from the oropharynx: Clade 3 | MacCallum et al. (2009) |
| s20122.073 | Clinical isolate from the blood: Clade 4 | MacCallum et al. (2009) |
| AM2003-020 | Clinical isolate from the oropharynx: Clade 4 | MacCallum et al. (2009) |
| CAI4 | ura3::λ imm434/ura3:: λ imm434 | Fonzi and Irwin (1993) |
| RM1000 | ura3::λ imm434/ura3:: λ imm434, his1::hisG/his1::hisG | Wilson et al. (1999) |
| THE1 | Ade2::hisG/ade2::hisG, ura3:: λ imm434/ura3:: λ imm434, ENO1/eno1::ENO1-tetR-ScHAP4AD-3XHA-ADE2 | Nakayama et al. (2000) |
| Δhog1 | ura3::λ imm434/ura3:: λ imm434, his1::hisG/his1::hisG, hog1:: loxP-URA3-loxP, hog1::loxP-HIS1-loxP | Smith et al. (2004) |
| Δcap1 | ura3::λ imm434/ura3::λimm434, his1::hisG/his1::hisG, arg4::hisG/arg4::hisG, cap1::hisG/cap1::hisG-URA3-hisG | Enjalbert et al. (2006) |
| Δcap1 Δhog1 | ura3::λ imm434/ura3::λimm434, his1::hisG/his1::hisG, arg4::hisG/arg4::hisG, hog1::loxP-ARG4-ura3-loxP/hog1::loxP-HIS1-loxP, cap1::hisG/cap1::hisG-URA3-hisG | Enjalbert et al. (2006) |
| ras1-2/ras1-3 | ura3::λ imm434/ura3::λ imm434, ras1Δ::hisG/ras1Δ::hph-URA3-hph | Feng et al. (1999) |
| WH324 | ura3::λ imm434/ura3:: λ imm434, aox1a:::hisG/aox1b:::hisG | Huh and Kang (2001) |
| C20 | ura3::λ imm434/ura3:: λ imm434, tps1Δ::hisG/tps1Δ::hisG | Zaragoza et al. (1998) |
Transcript Profiling
Transcript profiling was performed with the C. albicans strain THE1 (Table 1) by using procedures described for S. cerevisiae by Yin et al. (2003). C. albicans cells were grown to mid-log phase (OD600 = 0.5) overnight in YPLactate at 30°C, reinoculated into 200 ml of fresh YPLactate at OD600 = 0.05, and regrown at 30°C to mid-log phase (OD600 = 0.5). Cultures were divided into four 50-ml cultures, and glucose was added to a final concentration of 0%, 0.01% (=0.56 mM), 0.1% (=5.6 mM), or 1% (=56 mM). Cells were harvested 30 min later and frozen rapidly in liquid N2. RNA was prepared as described previously (Hauser et al., 1998), and cyanine (Cy)3- and Cy5-labeled cDNA probes were prepared and hybridized against C. albicans microarrays (Eurogentec, Seraing, Belgium) as described previously (Enjalbert et al., 2006). Slides were scanned using a ScanArray Lite scanner (PerkinElmer Life and Analytical Sciences, Beaconsfield, United Kingdom) and quantified using QuantArray software, version 2.0. Data analysis and normalization were performed using GeneSpring (Silicon Genetics, Redwood City, CA), and statistical analyses were performed using Significance Analysis of Microarrays (SAM) (Tusher et al., 2001) with a false discovery rate of <10%. Expression ratios were calculated relative to control cells exposed to 0% glucose. Data from at least three independent biological replicates were used for analysis.
C. albicans gene annotations were obtained from CandidaDB (http://genolistpasteur.fr/CandidaDB; d'Enfert et al., 2005) and the Candida Genome Database (http://candidagenome.org; Braun et al., 2005). Functional categories for C. albicans genes were assigned using gene ontology resources at the Saccharomyces Genome Database (SGD; www.yeastgenome.org/GOcontents.shtml). The complete data set is available in the Supplementary Data and in ArrayExpress (www.ebi.ac.uk/microarray/; experiment accession E-MEXP-1151).
Northern Analysis
Northern blotting was performed to validate the transcript profiling data. RNA was isolated from C. albicans THE1 cells, fractionated on 1.5% agarose/formaldehyde gels and subjected to Northern blotting as described previously (Brown et al., 2001). Gene-specific probes were polymerase chain reaction (PCR)-amplified from genomic DNA (the primers are specified in Supplemental Data) and radiolabeled using the Ready-to-go dCTP labeling kit (GE Healthcare, Chalfont St. Giles, Buckinghamshire, United Kingdom). Signals were quantified by phosphorimaging relative to TEF3 mRNA levels, as described previously (Brown et al., 2001).
Western Blotting
Protein extracts were prepared from C. albicans cells examined at an OD600 of 0.4 and subjected to Western blotting, as described previously (Smith et al., 2004). Hog1 activation was detected using a phospho-specific phospho-p38 mitogen-activated protein (MAP) kinase (Thr180/Tyr182) antibody (New England Biolabs, Hitchin, Hertfordshire, United Kingdom), followed by an horseradish peroxidase (HRP)-labeled anti-rabbit immunoglobulin (Ig)G secondary antibody (Bethyl Laboratories, Montgomery, TX) by using ECL Plus Western blotting reagents (GE Healthcare). Membranes were then stripped and reprobed with an anti-Hog1 (y-215) antibody (sc-9079, Santa Cruz Biotechnology, Santa Cruz, CA) followed by HRP-linked anti-rabbit IgG antibody (catalog no. 7074; New England Biolabs) to control for loading.
Stress Phenotypes
For all stress assays, C. albicans strains were first grown overnight at 30°C in YPLactate to mid-log phase (OD600 = 0.5). Cells were then subcultured into fresh YPLactate and regrown to mid-log phase (OD600 = 0.5). For oxidative stress, cultures were then split: one half receiving 1% glucose and control cells receiving 0% glucose. Cells were grown for a further 60 min and then exposed to 0, 0.4, 5, 10, 25, or 50 mM H2O2 for 60 min. Cell viability was assayed (colony-forming units [CFUs]) relative to unstressed controls. Data represent means from three independent experiments.
For osmotic stress, YPLactate cultures were split, some cells being exposed to 1% glucose and control cells being exposed to 0% glucose. Cells were grown for a further 60 min, and then exposed for 60 min to 0.5 or 1 M NaCl, 0.6 M KCl, or 0.6 or 1.2 M sorbitol. Cell viability was then assayed (CFUs). Data are means from three independent experiments.
Methods for miconazole treatment were adapted from Abbott and Odds (1989). Mid-log C. albicans cells grown on YPLactate were harvested by centrifugation, washed twice in distilled H2O (d H2O), and resuspended in dH2O. Four milliliters of suspension (∼8 × 10⁶ cells/ml) were added to 4 ml of 0.2 M citrate buffer, pH 6.2. The cells were treated for 10 min with either 10 μg/ml miconazole (final concentration; Sigma Chemical. Poole, Dorset, United Kingdom) or the carrier dimethyl sulfoxide (DMSO). Then either lactate or glucose were added to a final concentration of 1%, or 0% for control cells, and the cells incubated for a further 10 min at 30°C, whereupon viable cell numbers were determined as CFUs. The data represent means from three independent experiments.
Trehalose and Reactive Oxygen Species (ROS)
Intracellular ROS levels were quantified using published procedures (Chattopadhyay et al., 2006; Cash et al., 2007), with modifications. Cells were grown to mid-exponential phase on YPLactate as described above for transcript profiling. Glucose was then added to a final concentration of a 1%, and an equivalent amount of water was added to control cultures. Fifty microliters of dichlorodihydrofluorescein diacetate (catalog no. D6883; Sigma Chemical) in DMSO (2 mg/ml) was then added to the 50-ml cultures, which were incubated for a further 15 min at 30°C. Cells were then harvested, washed twice with a cold water, and sheared with glass beads in 0.1 M Tris-HCl, pH 7.5. Cell extracts were centrifuged at 13,000 × g, supernatants diluted 10-fold in water, and fluorescence was measured at 485 and 520 nm. Fluorescence measurements were normalized to the protein concentration as measured by the Bradford assay (Bradford, 1976).
Intracellular trehalose levels were assayed using methods described by Neves et al. (1994). Cells were grown to mid-exponential phase on YPLactate as described above. Then cells were exposed to 1% glucose for 1 h, harvested, and washed with ice-cold water. Trehalose was extracted from 50 mg of cells by boiling for 1 h in 1 ml of 0.25 M Na2CO3. Then, 200 μl of extract was neutralized with 100 μl of 0.5 M citric acid, and 150 μl of this neutralized extract was incubated for 2 h with 0.1 U of trehalase (catalog no. T8778; Sigma Chemical) in 1 mM EDTA in total volume of 200 μl. The glucose released by trehalose hydrolysis was then assayed with a commercial kit (catalog no. GAHK20; Sigma Chemical).
RESULTS
C. albicans Is Exquisitely Sensitive to Glucose
Previously, we examined the responses of S. cerevisiae to low (0.01%), medium (0.1%), and high (1%) levels of glucose (Yin et al., 2003). These genome-wide analyses revealed that S. cerevisiae is exquisitely sensitive to glucose, modulating metabolic gene expression even in response to low glucose concentrations. Glycolytic genes were up-regulated, and gluconeogenic and tricarboxylic acid (TCA) cycle genes were down-regulated even when only 0.01% glucose was added to the growth medium. Ribosome biogenesis, in contrast, was activated only in response to medium or high levels of glucose.
The first objective in our current study was to test the working hypothesis that C. albicans and S. cerevisiae respond differently to glucose. Therefore, to examine glucose responses in C. albicans we used an analogous experimental approach to our previous study in S. cerevisiae. In brief, RNA was prepared from C. albicans cells 30 min after the addition of 0, 0.01, 0.1, or 1% glucose to cultures growing exponentially on lactate. We chose this time point to replicate the conditions used successfully in our genome-wide analysis of glucose responses in S. cerevisiae (Yin et al., 2003). The C. albicans RNA was subjected to microarray analysis, measuring the effects of the zero, low, medium, and high glucose concentrations relative to the control containing zero glucose. Transcripts were analyzed further if they displayed a statistically significant and reproducible change of ≥1.5-fold in three independent replicate experiments as well as passing the statistical filter imposed by SAM, with a false discovery rate of <10% (Tusher et al., 2001). In total, 347 C. albicans genes were up-regulated, and 344 genes were down-regulated in response to at least one of the glucose concentrations examined (∼5% of the genome) (Supplemental Data). Of these genes, 170 genes were up-regulated and 180 genes were down-regulated by 0.01% glucose, indicating that approximately half of glucose-regulated genes are responsive to low glucose. These transcript profiling data were validated by northern analyses of selected C. albicans transcripts. For example, this confirmed that the transcript levels for HXT62 (putative hexose transporter) and QDR1 (homologue of a plasma membrane transporter required for multidrug resistance in S. cerevisiae) increased in response to 0.01, 0.1, and 1% glucose, whereas the control IPF3584 transcript (unknown function) was unresponsive to glucose, and the PCK1 transcript (gluconeogenesis) was repressed by all three glucose concentrations (data not shown). Therefore, like S. cerevisiae, the C. albicans transcriptome is exquisitely sensitive to glucose, responding to concentrations as low as 0.01%.
C. albicans and S. cerevisiae Display Significant Differences in Their Transcriptomic Responses to Glucose
To compare the glucose responses of C. albicans and S. cerevisiae more directly, we selected genes that have orthologues in both yeasts (Supplemental Data; Enjalbert et al., 2006). We then examined the behavior of orthologues involved in central carbon metabolism, listing the responses of individual genes to each condition (Supplemental Data) and then calculating the mean response of a particular pathway to each glucose concentration (Figure 1A). The behavior of specific metabolic pathways is presented in Figure 1B. In C. albicans, glycolytic genes were up-regulated, and gluconeogenic, glyoxylate cycle, TCA cycle and fatty acid β-oxidation genes were down-regulated after exposure to low, medium or high concentrations of glucose. Therefore, the expression of central metabolic pathways in C. albicans was regulated even in response to low glucose (0.01%).
Figure 1.

Impact of glucose upon the expression of genes involved in central carbon metabolism in C. albicans and S. cerevisiae. Cells were grown to mid-exponential phase in YPLactate, exposed to no (0%), low (0.01%), medium (0.1%), or high (1%) glucose for 30 min, and then subjected to transcript profiling. For C. albicans THE1 cells, -fold expression for these four conditions was measured relative to a 0% glucose control. Data for S. cerevisiae are taken from Yin et al. (2003) who normalized these data to the 0% glucose condition. Color coding is scaled from the largest fold increases (purple), through no change (yellow) to the largest fold decreases (cyan) observed in each complete data set (color heat scale in Supplemental Data). (A) Regulation of glycolytic transcripts. (B) Average responses for transcripts encoding glycolytic, TCA cycle, gluconeogenic and glyoxylate cycle, fatty acid β-oxidation, and ribosomal proteins: closed squares, C. albicans; open squares, S. cerevisiae.
Although carbon metabolism genes behaved similarly in C. albicans and S. cerevisiae, ribosomal protein genes responded differently in these species. In S. cerevisiae, ribosomal protein gene expression is up-regulated after glucose addition (Mager and Planta, 1991), and this was confirmed by the transcript profiling study of Yin et al. (2003). However, no significant increase in ribosomal protein gene expression was observed in C. albicans under equivalent conditions (Figure 1B). Almost certainly, differences in the growth of these species on YPLactate account for this contrasting behavior. S. cerevisiae grew relatively slowly on YPLactate, the doubling time halving after addition of glucose to a concentration of 1%. As expected, ribosomal protein gene expression accelerated with growth in this yeast (Yin et al., 2003). In contrast, C. albicans THE1 cells grew equally well on YP medium containing lactate or glucose (Td = ∼110 min). Therefore, there was no increase in ribosomal protein gene expression in this pathogen under these conditions (Figure 1B). It is possible that these differences in the growth of C. albicans and S. cerevisiae on YPLactate might account for some other differences that we observed in their transcriptional responses to glucose.
We then examined the glucose responses of C. albicans and S. cerevisiae more broadly by categorising glucose-regulated genes on the basis of their gene ontology (Saccharomyces Genome Database; http://db.yeastgenome.org/cgi-bin/SGD/GO/goTermFinder) and asking which functional categories were significantly up- or down-regulated by glucose (Figure 2). The functional categories glycolysis, fermentation, and hexose transport were up-regulated in C. albicans and S. cerevisiae. Also, gluconeogenesis, tricarboxylic acid cycle, aerobic metabolism, and fatty acid metabolism were down-regulated in both species. In contrast, the functional categories ribosome biogenesis and protein synthesis behaved differently in C. albicans and S. cerevisiae, displaying no significant regulation or being down-regulated in the pathogen, but up-regulated in the benign yeast (Figure 2). Not surprisingly, the behavior of these functional categories reflected the behavior of the individual genes in these categories (Figure 1).
Figure 2.

Effect of glucose upon the regulation of various functional categories in C. albicans and S. cerevisiae. Regulated genes of known function were assigned to functional categories according to information from the Saccharomyces and Candida Genome Databases. Transcript profiling data for S. cerevisiae are taken from Yin et al. (2003). (A) Functional categories that showed statistically significant enrichment in up-regulated (red) or down-regulated genes (green) are shown: light orange or green, p value <10−2; midorange or green, p value <10−3; and dark red or green, p value <10−4.
The analysis of functional categories revealed some other interesting differences between C. albicans and S. cerevisiae (Figure 2). In response to glucose, energy reserve metabolism was significantly up-regulated in C. albicans at all three glucose concentrations but was only elevated at 0.1% glucose in S. cerevisiae. Further analysis of this functional category revealed that trehalose metabolism genes were up-regulated in C. albicans (e.g., TPS1, TPS2, and TPS3), unlike in S. cerevisiae (Figure 3). Trehalose is a well-known stress protectant (Wiemken, 1990). Therefore, this observation was consistent with the up-regulation of response to oxidative stress and response to drug in C. albicans but not in S. cerevisiae (Figure 2). To look at this in more detail, we examined behavior of individual genes in these functional categories.
Figure 3.
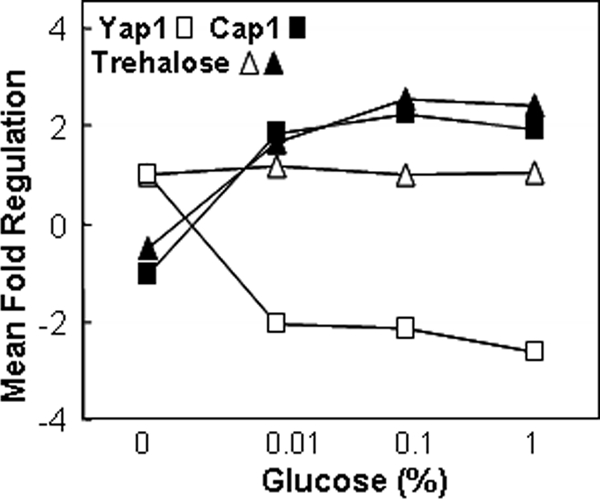
Effect of glucose upon mRNAs encoding YAP1, CAP1 or trehalose synthetic enzymes. Closed squares, CAP1 mRNA; open squares, YAP1 mRNA; triangles, average responses of TPS1-3 transcripts; closed symbols, C. albicans; open symbols, S. cerevisiae.
With respect to response to drug, three C. albicans genes belonging to the ATP binding cassette superfamily of transporters (e.g., CDR1, CDR2, and SNQ2) and a member of the major facilitator family (QDR1) were up-regulated in response to all of the glucose concentrations tested. All of these genes are involved in responses to antifungal drugs or mutagens (Servos et al., 1993; Decottignies et al., 1995; Sanglard et al., 1995, 1997; Nunes et al., 2001). TAC1, the transcriptional activator of CDR1 and CDR2 in C. albicans (Coste et al., 2004), was not significantly up-regulated in response to glucose. With the exception of PDR5 (the S. cerevisiae homologue of CDR1), which was slightly up-regulated in response to 0.1 and 1% glucose, the expression of the corresponding S. cerevisiae genes was unchanged in response to glucose (Yin et al., 2003).
Three C. albicans genes important for the response to oxidative stress were induced by glucose. TRX1 and TTR1 encode thio- and glutaredoxins involved in oxidative stress protection. The up-regulation of CAP1 by glucose (Figure 3) was particularly noteworthy because this gene encodes a transcriptional activator required for resistance to oxidative stress as well as multidrug resistance (Alarco & Raymond, 1999). YAP1 (the S. cerevisiae homologue of C. albicans CAP1) was down-regulated twofold by glucose (Figure 3). The contrasting behavior of these key transcription factors provided a mechanistic explanation for the up-regulation of oxidative stress functions by glucose in C. albicans but not in S. cerevisiae.
Response to osmotic stress was not represented in our GO output because insufficient genes from this functional category were regulated by glucose. This was partly because this functional category contains a relatively large proportion of signaling functions that are regulated at post-transcriptional, rather than transcriptional levels. Therefore, upon further examination we realized that genes critical for the osmotic stress response in C. albicans were up-regulated by glucose. These included the ENA22, which encodes a sodium cation transporter, and the GPD1 and GPD2, which encode glycerol-3-phosphate dehydrogenase isoenzymes required for synthesis of the osmolyte, glycerol (Supplemental Data).
The above-mentioned observations provided the first clue that C. albicans might differ significantly from S. cerevisiae with regard to the impact of glucose upon stress responses. Stress responses are down-regulated by glucose in S. cerevisiae (Gorner et al., 1998; Garreau et al., 2000). In contrast, our transcript profiling data suggested that in C. albicans some stress responses might be up-regulated by glucose. We tested this by examining the impact of glucose upon the resistance of C. albicans to various stresses.
Glucose Increases the Resistance of C. albicans to an Azole Antifungal
Our microarray experiments revealed a rapid increase in the levels of key transcripts involved in antifungal drug resistance in cells exposed to glucose. Therefore, we wanted to test whether glucose causes a corresponding increase in the resistance of C. albicans to azole antifungals. We selected miconazole because, unlike most azole antifungals, this drug exerts cidal effects upon C. albicans (Abbott and Odds, 1989). This allowed us to test whether exposure to glucose protects C. albicans from miconazole-induced killing. Cells were grown under equivalent conditions to the transcript profiling experiments (exponential phase in YPLactate), treated with glucose for an hour, and then exposed to 10 μg/ml miconazole for an hour, and cell viability was assayed (Figure 4). Compared with control cells that were treated with water or fresh lactate, cells exposed to glucose displayed highly significant protection against miconazole-induced killing. Therefore, as well as inducing the expression of genes involved in drug resistance, glucose increases the resistance of C. albicans to miconazole.
Figure 4.
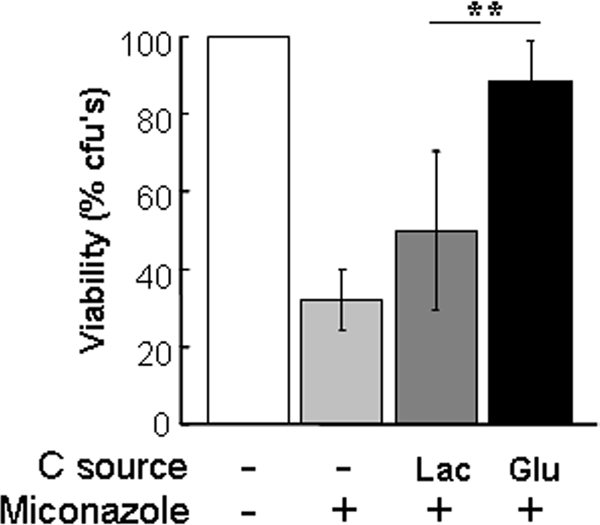
Exposure to glucose increases the resistance of C. albicans to an azole antifungal agent. C. albicans THE1 cells were grown to mid-exponential phase in YPLactate, exposed to 1% glucose or lactate for 1 h and then subjected to 10 μg/ml miconazole, and their cell viability was assayed. Means and SDs from triplicate experiments are shown: *p < 0.05 and **p < 0.01 (Student's t test).
Glucose Increases the Osmotic Stress Resistance of C. albicans
Our microarray analyses revealed that some osmotic stress genes are induced by glucose in C. albicans. Therefore, to test whether glucose affects osmotic stress tolerance, C. albicans was grown on lactate, exposed to glucose, and then treated with various concentrations of sorbitol, NaCl or KCl. The viability of these cells was compared with control cells that were not exposed to glucose (Figure 5). Glucose did not affect the resistance of C. albicans to sorbitol. However, resistance to both NaCl and KCl was increased after glucose exposure. Therefore, glucose seems to affect cationic stress resistance, rather than osmotic stress resistance, in this pathogenic yeast.
Figure 5.
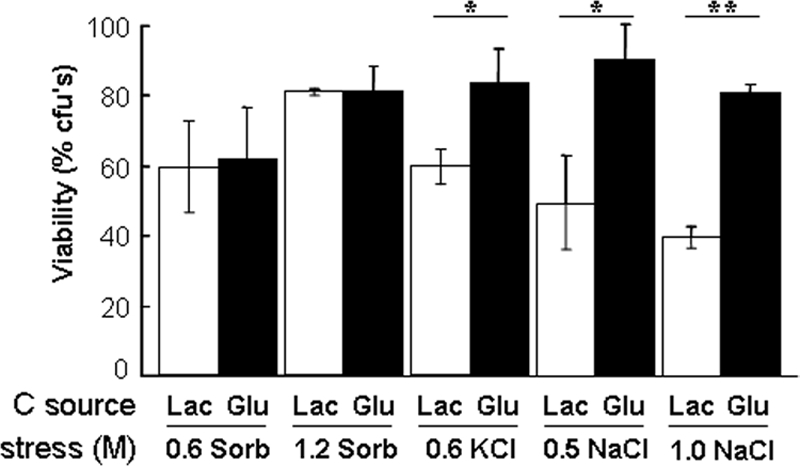
Glucose increases the resistance of C. albicans to cationic stress. C. albicans THE1 cells were grown to mid-exponential phase in YPLactate, exposed to 1% glucose or lactate for 1 h, and then subjected to an NaCl, KCl, or sorbitol stress, and their cell viability was assayed. Means and SDs from triplicate experiments are shown: *p < 0.05 and **p < 0.01 (Student's t test).
This observation was consistent with our finding that a small set of osmotic stress genes was induced by glucose in our microarray experiments. This set included ENA22, a homologue of the S. cerevisiae ENA2 gene that encodes a sodium transporter that contributes to salt tolerance (Rodriguez-Navarro et al., 1994).
Glucose Increases the Resistance of C. albicans to Oxidative Stress
We then tested whether the effects of glucose upon the expression of oxidative stress genes have an impact upon the resistance of C. albicans to this type of environmental insult. Again, C. albicans cells were grown to exponential phase in YPLactate, exposed with glucose for an hour, and then the cells treated with to various doses of hydrogen peroxide for an hour. The viability of these cells was compared with equivalent cells that were not exposed to glucose (Figure 6). Glucose significantly increased the resistance of C. albicans to high doses of oxidative stress (>10 mM hydrogen peroxide).
Figure 6.
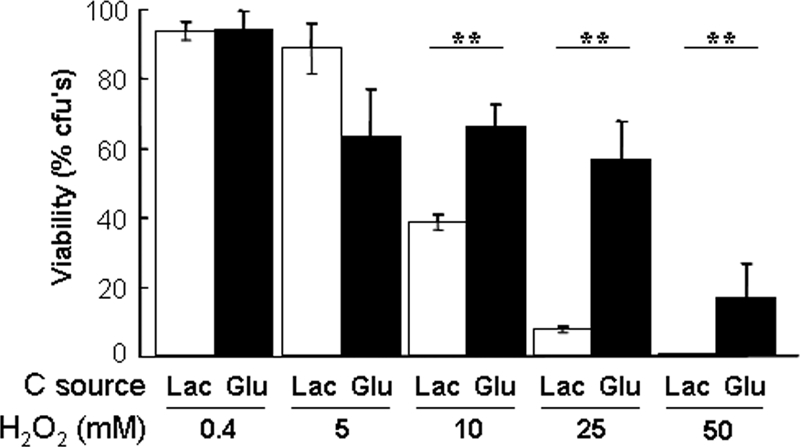
Glucose increases the resistance of C. albicans to acute doses of hydrogen peroxide. C. albicans THE1 cells were grown to mid-exponential phase in YPLactate, exposed to 1% glucose or lactate for 1 h, and then subjected to different concentrations of H2O2, and their cell viability was assayed. Means and SDs from triplicate experiments are shown: *p < 0.05 and **p < 0.01 (Student's t test).
The above-mentioned experiments were performed using the same C. albicans strain that was used for the transcript profiling experiments (THE1, Table 1). Therefore, to test whether glucose-enhanced stress resistance is a general trait in C. albicans, we examined the impact of glucose upon the peroxide resistance of eight clinical isolates representing the four major epidemiological clades of C. albicans (MacCallum et al., 2009). Whether originally isolated from bloodstream or the oropharynx (Table 1), all of these strains displayed significant glucose-enhanced peroxide resistance (Figure 7), indicating that the positive impact of glucose upon stress resistance is a general trait in this pathogen.
Figure 7.
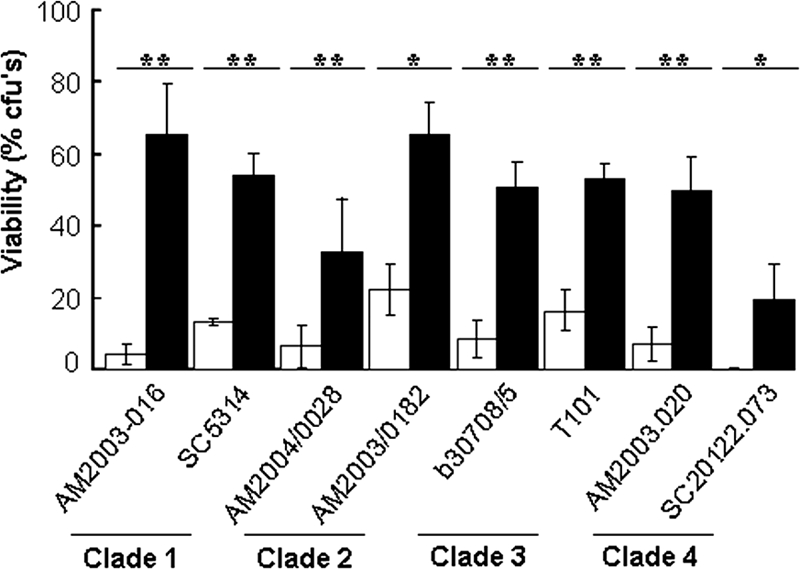
Glucose-enhanced resistance to peroxide stress is a general trait in C. albicans. Strains from the four major epidemiological clades, whether isolated from the blood or oropharynx (Table 1), display enhanced resistance to oxidative stress (50 mM H2O2 for 1 h) after exposure to 1% glucose for 1 h: glucose-treated cells, closed bars; control cells grown on lactate, open bars. Means and SDs from triplicate experiments are shown: *p < 0.05 and **p < 0.01 (Student's t test).
Roles of Cap1, Hog1, and Ras1 in Glucose-Enhanced Peroxide Stress Resistance
The bZIP transcription factor Cap1 activates oxidative stress genes via YRE elements in their promoters and is required for oxidative stress resistance in C. albicans (Alarco and Raymond, 1999; Nicholls et al., 2004). Also, CAP1 transcript levels are elevated in glucose-treated C. albicans cells (Figure 3), suggesting that Cap1 contributes to glucose-enhanced oxidative stress resistance (Figure 6). Therefore, we tested whether Cap1 is required for this phenomenon. Congenic C. albicans wild type (CAI4 and RM1000) and cap1 strains were pretreated with glucose and then exposed to a high dose of peroxide (25 mM). The inactivation of Cap1 did not affect the ability of glucose to increase peroxide resistance (Figure 8). Therefore, although Cap1 might contribute to this effect, it is not required for glucose-enhanced peroxide resistance.
Figure 8.

Role of regulators in glucose-enhanced resistance to peroxide stress. Isogenic strains (Table 1) were grown to mid-exponential phase in YPLactate, treated with 1% glucose or lactate for 1 h, exposed to 25 mM H2O2 for 1 h, and then cell viability was assayed. Means and SDs from triplicate experiments are shown: *p < 0.05 and **p < 0.01 (Student's t test).
The Hog1 SAPK also contributes to oxidative stress resistance in C. albicans (Alonso-Monge et al., 2003; Smith et al., 2004). Therefore, we tested whether Hog1 is required for glucose-enhanced peroxide resistance. The peroxide resistance of congenic wild-type and hog1 strains was compared, revealing that Hog1 is not essential glucose-enhanced peroxide resistance, although hog1 cells displayed reduced resistance to this oxidative stress. These conclusions were confirmed by the cap1 hog1 double mutant. Although this mutant was more sensitive to oxidative stress, it still retained the glucose-enhanced peroxide resistance phenotype (Figure 8), confirming that neither Hog1 nor Cap1 is essential for this effect.
In S. cerevisiae, the Ras-cAMP signaling pathway is activated by glucose, leading to the down-regulation of oxidative stress resistance, through down-regulation of the transcription factors Yap1, Msn2, and Msn4 (Gounalaki and Thireos, 1994; Stanhill et al., 1999). The functions of Msn2/4 homologues have diverged in C. albicans and are not involved in oxidative stress responses in this pathogen (Nicholls et al., 2004; Ramsdale et al., 2008). Also, the C. albicans homologue of S. cerevisiae Yap1 was not required for glucose-enhanced peroxide resistance (Figure 8). Nevertheless, Ras-cAMP signaling has been reported to affect the expression of stress genes and influence stress sensitivity in C. albicans (Harcus et al., 2004; Bahn et al., 2007; Wilson et al., 2007). Therefore, it was conceivable that Ras-cAMP signaling might mediate the effects of glucose on peroxide resistance in C. albicans. Hence, we tested whether this effect was dependent upon Ras1 (Figure 8). Ras1 cells were more sensitive to this oxidative stress. However, glucose still increased the resistance of these ras1 cells to peroxide, indicating that this effect was not dependent upon Ras-cAMP signaling.
Roles of Reactive Oxygen Species and Trehalose in Glucose-enhanced Peroxide Stress Resistance
The alternative oxidases encoded by AOX1a and AOX1b contribute to a cyanide-resistant respiratory pathway in C. albicans (Huh and Kang, 2001). It has been suggested that this pathway helps to protect C. albicans against endogenous reactive oxygen species generated by mitochondrial respiratory activity (Huh and Kang, 2001). Therefore, we reasoned that the addition of glucose might cause a respiratory burst that could lead to the production of reactive oxygen species via the alternative oxidases Aox1a and Aox1b. According to this model, this would trigger an oxidative stress response that would protect against subsequent expose to high levels of peroxide. We tested this model by examining the impact of glucose exposure upon the intracellular accumulation of reactive oxygen species. In three independent experiments C. albicans RM1000 cells exposed to 1% glucose displayed approximately twofold lower levels of intracellular reactive oxygen species compared with control cells (Figure 9A). Furthermore, the inactivation of Aox1a and Aox1b did not block glucose-enhanced peroxide resistance (Figure 8). These data suggest that glucose-enhanced peroxide resistance is not mediated via the generation of reactive oxygen species through a respiratory burst after glucose exposure.
Figure 9.

Relationship between glucose-enhanced stress resistance, trehalose, and ROS levels. (A) Impact of glucose upon intracellular ROS levels (fluorescence units per mg protein) in lactate grown C. albicans RM1000 cells, open bars, no glucose; closed bars, 1% glucose for 1 h. Data from three independent experiments are shown. Means and SDs from triplicate assays are shown. (B) Exogenous trehalose (1%) does not confer enhanced resistance to peroxide stress (50 mM H2O2). Also, Tps1 inactivation (tps1, Table 1) does not block glucose-enhanced peroxide stress resistance. Means and SDs from triplicate experiments are shown: *p < 0.05 and **p < 0.01 (Student's t test).
It is well known that trehalose acts as a stress protectant in S. cerevisiae (Wiemken, 1990). Furthermore, trehalose is thought to act as a stress protectant in C. albicans (Alvarez-Peral et al., 2002; Van Dijck et al., 2002; Argüelles, 2006) and has been shown to protect against severe oxidative stress (Alvarez-Peral et al., 2002). Also, glucose exposure led to increased levels of trehalose biosynthetic mRNAs in C. albicans (TPS1-3; Figure 3). Therefore, we wondered whether trehalose metabolism might contribute to glucose-enhanced peroxide resistance. We measured intracellular trehalose levels in exponential lactate-grown C. albicans cells that were exposed to 0 or 1% glucose for 1 h. No significant difference in trehalose levels was observed in three independent experiments. RM1000 cells exposed to 1% glucose contained 0.034 ± 0.006 nmol trehalose/mg cells, whereas control cells exposed to 0% glucose had 0.032 ± 0.006 nmol trehalose/mg cells. Similar data were obtained for a second C. albicans strain (THE1; data not shown). Therefore, despite the increase in TPS mRNA levels, no significant increase in trehalose levels was observed in C. albicans after 1 h of glucose exposure.
We then tested whether the addition of exogenous trehalose protects lactate-grown C. albicans against peroxide stress. No significant protection was observed (Figure 9B). Finally, we tested whether the inactivation of Tps1, which is required for trehalose accumulation (Zaragoza et al., 1998), causes the loss of the glucose-enhanced peroxide resistance phenotype. This was not the case (Figure 9B). We conclude that, although trehalose acts as a peroxide stress protectant in C. albicans (Alvarez-Peral et al., 2002), glucose-enhanced peroxide resistance is not mediated through trehalose accumulation.
Hog1 Is Required for Glucose-enhanced Osmotic Stress Resistance
Exposure to glucose increases the resistance of C. albicans to osmotic stress (Figure 5). In S. cerevisiae and C. albicans, adaptation to osmotic stress occurs through the evolutionarily conserved Hog1 SAPK pathway (Brewster et al., 1993; San Jose et al., 1996; Smith et al., 2004). Therefore, we tested whether glucose stimulates osmotic stress resistance via this signaling pathway. A C. albicans hog1 single mutant and hog1 cap1 double mutant did not display the glucose-enhanced osmotic stress resistance that was observed for the isogenic parental strain RM1000 (Figure 11). In contrast, as expected, an isogenic cap1 mutant retained this glucose-enhanced osmotic stress resistant phenotype. Therefore, Hog1 is required for glucose-enhanced osmotic stress resistance.
Figure 11.
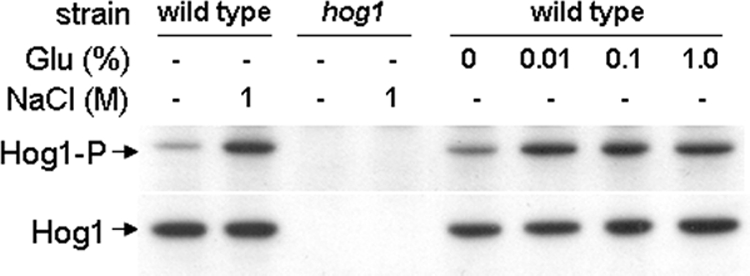
Hog1 is phosphorylated in response to glucose. Western blot of phosphorylated Hog1 detected with an antibody specific for the phosphorylated version of Hog1 (top) reprobed for total Hog1 as an internal loading to control (bottom). C. albicans cells were untreated, exposed to glucose, or treated with NaCl as a positive control: wild type, THE-1; Δhog1 (see Table 1).
If Hog1 mediates the effects of glucose upon osmotic stress resistance, then one would expect this MAP kinase to become activated after glucose exposure. Therefore, we examined the phosphorylation status of Hog1 in glucose-treated C. albicans cells by Western blotting with a phospho-specific anti-Hog1 antibody (Figure 11). As a control, we reprobed these blots for total Hog1. We also confirmed that increased Hog1 phosphorylation occurred in response to osmotic stress in wild-type cells and that the bands corresponding to both total and phosphorylated Hog1 were absent in a hog1 mutant (Figure 11). Significantly, increased Hog1 phosphorylation was observed in glucose-treated cells, indicating that Hog1 is activated in response to glucose. These observations are consistent with the idea that the Hog1 pathway is activated in response to glucose, thereby protecting C. albicans cells against subsequent exposure to an osmotic stress.
DISCUSSION
C. albicans and S. cerevisiae inhabit contrasting niches; therefore, these pathogenic and relatively benign yeasts are likely to experience different patterns of glucose exposure in the wild. Hence, we predicted that these yeast might have evolved different responses to glucose. We tested this prediction by examining the global responses of C. albicans to low (0.01%), medium (0.1%), and high concentrations of glucose (1%) and comparing these responses to those of S. cerevisiae under equivalent conditions (Yin et al., 2003). Several notable conclusions may be drawn from our observations.
First, we conclude that, like S. cerevisiae, C. albicans is exquisitely sensitive to low concentrations of glucose in the environment. Dramatic changes in the C. albicans transcriptome were observed within 30 min of cells being exposed to 0.01% glucose. This concentration is significantly lower than the levels that are homeostatically maintained in human blood (3–5 mM; equivalent to ∼0.06–0.1% glucose) (Figures 1 and 2). Therefore, C. albicans is able to detect and respond to the levels of glucose present in the blood during disseminated hematological infections. Not surprisingly, diabetic patients have an increased risk of systemic Candida infections (Odds, 1988), and dietary glucose enhances C. albicans colonization and invasion (Vargas et al., 1993).
Second, we found that C. albicans cells modulate the expression of metabolic genes even when they are exposed only to 0.01% glucose. Like S. cerevisiae (Yin et al., 2003), C. albicans down-regulates genes involved in gluconeogenesis, the TCA and glyoxylate cycles, and alternative pathways of carbon assimilation, whereas glycolytic and fermentation genes are up-regulated (Figure 1). Therefore, C. albicans regulates the metabolic genes involved in carbon assimilation even in response to low glucose signals.
These observations seem to contradict earlier reports that C. albicans is a glucose-insensitive Crabtree-negative yeast. This definition was based on the observation that C. albicans continues to respire in the presence of glucose (Aoki and Ito-Kuwa, 1982; Niimi et al., 1988). However, it is clear that C. albicans is glucose-sensitive because even low levels of glucose trigger major changes in the transcriptome (Figures 1 and 2; Supplemental Data). Our conclusion is supported by analyses of specific glucose-regulated genes (Leuker et al., 1997; Munro et al., 2001; Barelle et al., 2006; Ramirez and Lorenz, 2007) and by a microarray study of carbon starvation in C. albicans (Lorenz et al., 2004). Furthermore, C. albicans morphogenesis can be stimulated by glucose concentrations of between 0.025 and 0.25% (Hudson et al., 2004; Maidan et al., 2005). Although these morphogenetic changes are not relevant to our current study (because our cultures were grown at 30 not 37°C), these other studies reinforce the view that C. albicans is a glucose-sensitive yeast.
Third, C. albicans and S. cerevisiae display fundamental differences with regard to the impact of glucose upon their stress responses. Glucose down-regulates stress responses in S. cerevisiae. In this yeast, glucose activates Ras-cAMP signaling, leading to protein kinase A-mediated phosphorylation of the transcription factors Msn2 and Msn4, thereby inhibiting their nuclear accumulation and preventing the activation of stress genes that carry the cognate general stress response element in their promoters (Garreau et al., 2000; Gorner et al., 2002). Ras-cAMP signaling also regulates YAP1 (Gounalaki and Thireos, 1994; Stanhill et al., 1999), which encodes an activator protein-1–like transcription factor that contributes to the global transcriptional response to oxidative stress and is essential for resistance to such stresses (Stephen et al., 1995; Cohen et al., 2002). Glucose also represses the expression of some stress genes such as ENA1 (Alepuz et al., 1997). Ena1 is a P-type ATPase Na+ pump, the inactivation of which increases the sensitivity of S. cerevisiae cells to cationic stresses (Haro et al., 1991). Therefore in S. cerevisiae, stress responses are down-regulated by glucose via several signaling mechanisms (Figure 11). In contrast we found that some C. albicans stress genes are up-regulated by glucose (Figures 2 and 3) and that these transcriptomic changes are reflected in an increased resistance to osmotic stress, oxidative stress, and an azole antifungal drug (Figures 4–6).
Figure 12.
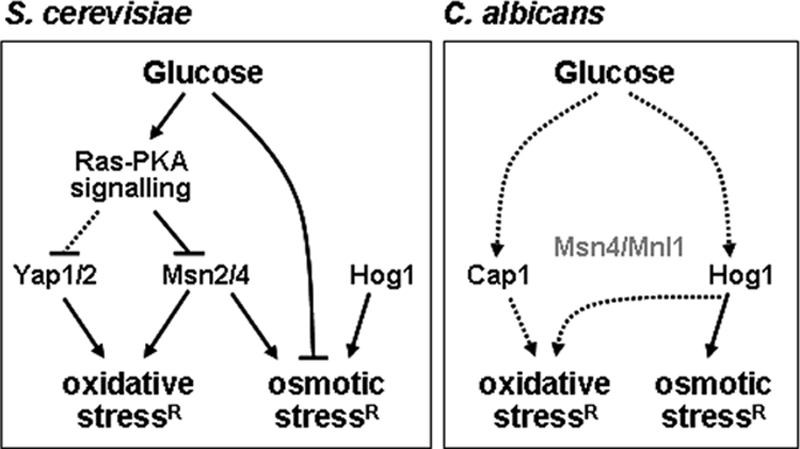
Model comparing the effects of glucose upon stress responses in C. albicans and S. cerevisiae. In S. cerevisiae, glucose represses stress responses by down-regulating the general stress response through Msn2 and Msn4, down-regulating the oxidative stress response through Yap1, and by repressing the expression of some stress genes (see text). In C. albicans, Cap1 and Hog1 may contribute to glucose-enhanced oxidative stress resistance (see text). Hog1 is phosphorylated in response to glucose and is required for glucose-enhanced cationic stress resistance. The Msn2/4-like proteins Msn4 and Mnl1 do not contribute to oxidative or osmotic stress resistance in C. albicans (Nicholls et al., 2004). In the C. albicans panel, solid arrows infer that a factor is required for an effect, whereas dotted arrows infer that a factor contributes to, but is not essential for that effect. Gray text infers no obvious role.
How does glucose mediate these changes to stress sensitivity in C. albicans? Ras1 is not essential for these effects (Figure 8), reinforcing the view that glucose signaling in this pathogen differs significantly from its distant benign relative, S. cerevisiae. Furthermore, the effects of glucose upon stress resistance are not mediated by an alternative oxidase-mediated respiratory burst (Figures 8 and 9A). Nor is glucose-enhanced stress resistance mediated by trehalose metabolism (Figures 9B). Instead, Cap1 and Hog1 probably mediate the impact of glucose upon oxidative stress and drug resistance. The expression of CAP1, which is required for oxidative stress and drug resistance (Alarco and Raymond, 1999), was up-regulated by glucose (Figure 3). Hog1, which also contributes to oxidative stress resistance (Alonso-Monge et al., 2003; Smith et al., 2004), was activated by glucose (Figure 11). We favor the idea that Cap1 and Hog1 fulfil partially redundant roles in mediating glucose-enhanced oxidative stress resistance (Figure 11), because this would explain why neither Cap1 nor Hog1 is essential for this effect (Figure 8).
The impact of glucose upon osmotic stress resistance seems to be mediated through Hog1. Glucose stimulates the phosphorylation and activation of C. albicans Hog1 (Figure 11). Furthermore, the inactivation of Hog1 blocks glucose-enhanced osmotic stress resistance (Figure 11). Previously, we showed that in C. albicans, the ENA21 GPD2, TPS2, and TPS3 genes are up-regulated in response to osmotic stress and that Hog1 is required for their activation (Enjalbert et al., 2006). Therefore, it is already known that Hog1 mediates the up-regulation of genes encoding cation transporters and enzymes involved in glycerol and trehalose biosynthesis in response to an osmotic stress. We now suggest that cation transporters and glycerol and trehalose biosynthetic enzymes are up-regulated in response to glucose through Hog1, thereby protecting C. albicans from subsequent exposure to cationic stress.
It is well known that Cap1 and Hog1 are required for osmotic and oxidative stress resistance (San Jose et al., 1996; Alarco and Raymond, 1999; Alonso-Monge et al., 2003; Smith et al., 2004). However, we noted that cap1 and hog1 cells did not display decreased resistance to the osmotic and oxidative stresses examined in this study compared with their isogenic controls (Figures 8 and 10). Differences in the stress resistance assays may account for this apparent contradiction. Previous studies assayed resistance by monitoring growth on plates over days in the presence of stress. In contrast, to investigate the immediate effects of glucose, we assayed cell viability after 1 h of exposure to each stress. We suggest that although Cap1 and Hog1 are required for the adaptive responses that allow C. albicans cells to recover and grow in the presence of osmotic and oxidative stresses, these regulators may not be essential for the immediate responses of C. albicans to these stresses.
Figure 10.
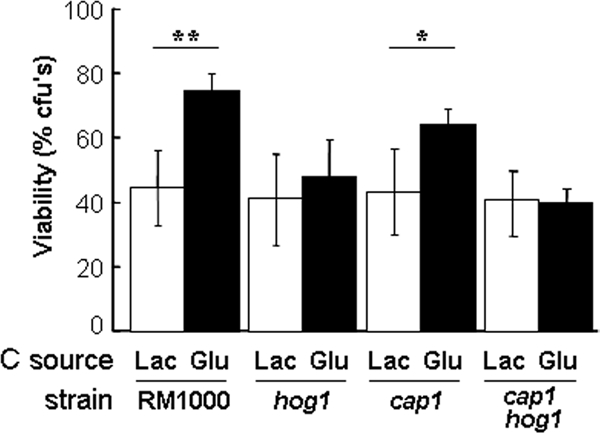
Role of regulators in glucose-enhanced resistance to cationic stress. C. albicans strains (Table 1) were grown in YPLactate, treated with glucose or lactate for 1 h, exposed to 1M NaCl for 1 h, and then cell viability was assayed. Means and SDs from triplicate experiments are shown: *p < 0.05 and **p < 0.01 (Student's t test).
Our findings indicate that C. albicans has evolved molecular mechanisms that link glucose responses to oxidative and osmotic stress resistance. We suggest that this might be of relevance to the infection process. For example, when invasive C. albicans cells enter the bloodstream they will become prone to attack by blood-borne phagocytes. These phagocytes generate an oxidative burst that is a primary line of defense against Candida infections (Sasada and Johnston, 1980; Murphy, 1991; Vasquez-Torres and Balish, 1997). Neutrophil killing also depends upon the influx of cations into the phagocytic vacuole (Reeves et al., 2002). However, upon entry into the bloodstream, C. albicans cells will also become exposed to glucose. Our data indicate that this glucose exposure will increase the resistance of these C. albicans cells to oxidative and cationic stresses and hence may protect them against immediate attack from phagocytic leukocytes. This is entirely consistent with the interesting recent hypothesis that “microorganisms may have evolved to anticipate environmental stimuli by adapting to their temporal order of appearance” (Mitchell et al., 2009).
Our findings also help to account for the high degree of metabolic heterogeneity of C. albicans populations growing in infected tissue (Barelle et al., 2006). The majority of C. albicans cells infecting the mouse kidney express glycolytic genes, suggesting that they assimilate carbon primarily via glycolysis. However, a significant proportion of these cells exhibit gluconeogenic growth (Barelle et al., 2006). Our data suggest that the differential exposure of C. albicans cells to glucose within these complex microenvironments probably contributes to this metabolic heterogeneity.
Supplementary Material
ACKNOWLEDGMENTS
We thank Janet Quinn, Donna MacCallum, Carlos Gancedo and Sa-Ouk Kang for providing C. albicans mutants, and Patrick van Dijck for providing the trehalose assay protocol. We are also grateful for financial support from the UK Biotechnology and Biological Sciences Research Council (BBS/B/06670 and BBS/S/B/2003/10842), the Wellcome Trust (063204 and 080088), the European Commission (MRTN-CT-2003-504148 and PITN-GA-2008-214004) and Pfizer.
Footnotes
This article was published online ahead of print in MBC in Press (http://www.molbiolcell.org/cgi/doi/10.1091/mbc.E09-01-0002) on September 16, 2009.
REFERENCES
- Abbott A. B., Odds F. C. Abrogation by glucose of the ATP suppression induced by miconazole in Candida albicans. J. Antimicrob. Chemother. 1989;24:905–919. doi: 10.1093/jac/24.6.905. [DOI] [PubMed] [Google Scholar]
- Alarco A. M., Raymond M. The bZip transcription factor Cap1p is involved in multidrug resistance and oxidative stress response in Candida albicans. J. Bacteriol. 1999;181:700–708. doi: 10.1128/jb.181.3.700-708.1999. [DOI] [PMC free article] [PubMed] [Google Scholar]
- Alepuz P. M., Cunningham K. W., Estruch F. Glucose repression affects ion homeostasis in yeast through the regulation of the stress-activated ENA1 gene. Mol. Microbiol. 1997;26:91–98. doi: 10.1046/j.1365-2958.1997.5531917.x. [DOI] [PubMed] [Google Scholar]
- Alonso-Monge R., Navarro-Garcia F., Molero G., Diez-Orejas R., Gustin M., Pla J., Sanchez M., Nombela C. Role of the mitogen-activated protein kinase Hog1p in morphogenesis and virulence of Candida albicans. J. Bacteriol. 1999;181:3058–3068. doi: 10.1128/jb.181.10.3058-3068.1999. [DOI] [PMC free article] [PubMed] [Google Scholar]
- Alonso-Monge R., Navarro-Garcia F., Roman E., Negredo A. I., Eisman B., Nombela C., Pla J. The Hog1 mitogen-activated protein kinase is essential in the oxidative stress response and chlamydospore formation in Candida albicans. Eukaryot. Cell. 2003;2:351–361. doi: 10.1128/EC.2.2.351-361.2003. [DOI] [PMC free article] [PubMed] [Google Scholar]
- Alvarez-Peral F. J., Oscar Zaragoza O., Pedreno Y., Argüelles J.-C. Protective role of trehalose during severe oxidative stress caused by hydrogen peroxide and the adaptive oxidative stress response in Candida albicans. Microbiology. 2002;148:2599–2606. doi: 10.1099/00221287-148-8-2599. [DOI] [PubMed] [Google Scholar]
- Aoki S., Ito-Kuwa S. Respiration of Candida albicans in relation to its morphogenesis. Plant Cell Physiol. 1982;23:721–726. [Google Scholar]
- Argüelles J.-C. Thermotolerance and trehalose accumulation induced by heat shock in yeast cells of Candida albicans. FEMS Microbiol. Lett. 2006;146:65–71. doi: 10.1111/j.1574-6968.1997.tb10172.x. [DOI] [PubMed] [Google Scholar]
- Bahn Y.-S., Molenda M., Staab J. F., Lyman C. A., Gordon L. J., Sundstrom P. Genome-wide transcriptional profiling of the cyclic AMP-dependent signaling pathway during morphogenic transitions of Candida albicans. Eukaryot. Cell. 2007;6:2376–2390. doi: 10.1128/EC.00318-07. [DOI] [PMC free article] [PubMed] [Google Scholar]
- Barelle C. J., Priest C. L., MacCallum D. M., Gow N. A., Odds F. C., Brown A.J.P. Niche-specific regulation of central metabolic pathways in a fungal pathogen. Cell. Microbiol. 2006;8:961–971. doi: 10.1111/j.1462-5822.2005.00676.x. [DOI] [PMC free article] [PubMed] [Google Scholar]
- Bradford M. M. A rapid and sensitive method for the quantitation of microgram quantities of protein utilizing the principle of protein-dye binding. Anal. Biochem. 1976;72:248–254. doi: 10.1016/0003-2697(76)90527-3. [DOI] [PubMed] [Google Scholar]
- Braun B. R., et al. A human-curated annotation of the Candida albicans genome. PLoS Genet. 2005;1:36–57. doi: 10.1371/journal.pgen.0010001. [DOI] [PMC free article] [PubMed] [Google Scholar]
- Brewster J. L., de Valoir T., Dwyer N. D., Winter E., Gustin M. C. An osmosensing signal transduction pathway in yeast. Science. 1993;259:1760–1763. doi: 10.1126/science.7681220. [DOI] [PubMed] [Google Scholar]
- Brown A.J.P., et al. Transcript analysis of 1,003 novel yeast genes using high-throughput northern hybridisations. EMBO J. 2001;20:3177–3186. doi: 10.1093/emboj/20.12.3177. [DOI] [PMC free article] [PubMed] [Google Scholar]
- Cash T. P., Pan Y., Simon M. C. Reactive oxygen species and cellular oxygen sensing. Free Radic. Biol. Med. 2007;43:1219–1225. doi: 10.1016/j.freeradbiomed.2007.07.001. [DOI] [PMC free article] [PubMed] [Google Scholar]
- Calderone R. A. Candida and Candidiasis. Washington, DC: ASM Press; 2002. [Google Scholar]
- Carlson M. Glucose repression in yeast. Curr. Opin. Microbiol. 1999;2:202–207. doi: 10.1016/S1369-5274(99)80035-6. [DOI] [PubMed] [Google Scholar]
- Chattopadhyay M. K., Tabor C. W., Tabor H. Polyamine deficiency leads to accumulation of reactive oxygen species in a spe2Delta mutant of Saccharomyces cerevisiae. Yeast. 2006;23:751–761. doi: 10.1002/yea.1393. [DOI] [PubMed] [Google Scholar]
- Cohen B. A., Pilpel Y., Mitra R. D., Church G. M. Discrimination between paralogs using microarray analysis: application to the Yap1p and Yap2p transcriptional networks. Mol. Biol. Cell. 2002;13:1608–1614. doi: 10.1091/mbc.01-10-0472. [DOI] [PMC free article] [PubMed] [Google Scholar]
- Coste A. T., Karababa M., Ischer F., Bille J., Sanglard D. TAC1, transcriptional activator of CDR Genes, is a new transcription factor involved in the regulation of Candida albicans ABC transporters CDR1 and CDR2. Eukaryot. Cell. 2004;3:1639–1652. doi: 10.1128/EC.3.6.1639-1652.2004. [DOI] [PMC free article] [PubMed] [Google Scholar]
- Decottignies A., Lambert L., Catty P., Degand H., Eppings E. A., Moye-Rowley S. W., Balzi E., Goffeau A. Identification and characterisation of SNQ2, a new multidrug ATP binding cassette transporter of yeast plasma membrane. J. Biol. Chem. 1995;270:18150–18157. doi: 10.1074/jbc.270.30.18150. [DOI] [PubMed] [Google Scholar]
- Enjalbert B., Smith D. A., Cornell M. J., Alam I., Nicholls S., Brown A.J.P., Quinn J. Role of the Hog1 Stress-activated protein kinase in the global transcriptional response to stress in the fungal pathogen Candida albicans. Mol. Biol. Cell. 2006;17:1018–1032. doi: 10.1091/mbc.E05-06-0501. [DOI] [PMC free article] [PubMed] [Google Scholar]
- Enjalbert B., MacCallum D., Odds F. C., Brown A.J.P. Niche-specific activation of the oxidative stress response by the pathogenic fungus Candida albicans. Infect. Immun. 2007;75:2143–2151. doi: 10.1128/IAI.01680-06. [DOI] [PMC free article] [PubMed] [Google Scholar]
- d'Enfert C., et al. CandidaDB: a genome database for Candida albicans pathogenomics. Nucleic Acids Res. 2005;33:D353–D357. doi: 10.1093/nar/gki124. [DOI] [PMC free article] [PubMed] [Google Scholar]
- Feng Q., Summers E., Guo B., Fink G. R. Ras signaling is required for serum-induced hyphal differentiation in Candida albicans. J. Bacteriol. 1999;181:6339–6346. doi: 10.1128/jb.181.20.6339-6346.1999. [DOI] [PMC free article] [PubMed] [Google Scholar]
- Fonzi W. A., Irwin M. Y. Isogenic strain construction and gene mapping in. Candida albicans. Genetics. 1993;134:717–728. doi: 10.1093/genetics/134.3.717. [DOI] [PMC free article] [PubMed] [Google Scholar]
- Fradin C., Kretschmar M., Nichterlein T., Gaillardin C., d'Enfert C., Hube B. Stage-specific gene expression of Candida albicans in human blood. Mol. Microbiol. 2003;47:1523–1543. doi: 10.1046/j.1365-2958.2003.03396.x. [DOI] [PubMed] [Google Scholar]
- Fradin C., De Groot P., MacCallum D., Schaller M., Klis F., Odds F. C., Hube B. Granulocytes govern the transcriptional response, morphology and proliferation of Candida albicans in human blood. Mol. Microbiol. 2005;56:397–415. doi: 10.1111/j.1365-2958.2005.04557.x. [DOI] [PubMed] [Google Scholar]
- Gancedo J. M. Yeast carbon catabolite repression. Microbiol. Mol. Biol. Rev. 1998;62:334–361. doi: 10.1128/mmbr.62.2.334-361.1998. [DOI] [PMC free article] [PubMed] [Google Scholar]
- Gancedo J. M. The early steps of glucose signaling in yeast. FEMS Microbiol. Rev. 2008;32:673–704. doi: 10.1111/j.1574-6976.2008.00117.x. [DOI] [PubMed] [Google Scholar]
- Garreau H., Hasa R. N., Renault G., Estruch F., Boy-Marcotte E., Jacquet M. Hyperphosphorylation of Msn2 and Msn4 in response to heat shock and the diauxic shift is inhibited by cAMP in Saccharomyces cerevisiae. Microbiology. 2000;146:2113–2120. doi: 10.1099/00221287-146-9-2113. [DOI] [PubMed] [Google Scholar]
- Gorner W., Durchschlag E., Martinez-Pastor M. T., Estruch F., Ammerer G., Hamilton B., Ruis H., Schuller C. Nuclear localisation of the C2H2 zinc finger protein Msn2p is regulated by stress and protein kinase A activity. Genes Dev. 1998;12:586–597. doi: 10.1101/gad.12.4.586. [DOI] [PMC free article] [PubMed] [Google Scholar]
- Gorner W., Durchschlag E., Wolf J., Brown E. L., Ammerer G., Hamilton B., Ruis H., Schuller C. Acute glucose starvation activates the nuclear localization signal of a stress-specific yeast transcription factor. EMBO J. 2002;21:135–144. doi: 10.1093/emboj/21.1.135. [DOI] [PMC free article] [PubMed] [Google Scholar]
- Gounalaki N., Thireos G. Yap1p, a yeast transcriptional activator that mediates multidrug resistance, regulates the metabolic stress response. EMBO J. 1994;13:4036–4041. doi: 10.1002/j.1460-2075.1994.tb06720.x. [DOI] [PMC free article] [PubMed] [Google Scholar]
- Harcus D., Nantel A., Marcil A., Rigby T., Whiteway M. Transcription profiling of cyclic AMP signaling in Candida albicans. Mol. Biol. Cell. 2004;15:4490–4499. doi: 10.1091/mbc.E04-02-0144. [DOI] [PMC free article] [PubMed] [Google Scholar]
- Haro R., Garciadeblas B., Rodriguez-Navarro R. A novel P-type ATPase from yeast involved in sodium transport. FEBS Lett. 1991;291:189–191. doi: 10.1016/0014-5793(91)81280-l. [DOI] [PubMed] [Google Scholar]
- Hauser N. C., Vingron M., Scheideler M., Krems B., Hellmuth K., Entian K.-D., Hoheisel J. D. Transcriptional profiling on all open reading frames of Saccharomyces cerevisiae. Yeast. 1998;14:1209–1221. doi: 10.1002/(SICI)1097-0061(19980930)14:13<1209::AID-YEA311>3.0.CO;2-N. [DOI] [PubMed] [Google Scholar]
- Hudson D. A., Sciascia Q. L., Sanders R. J., Norris G. E., Edwards P.J.B., Sullivan P. A., Farley P. C. Identification of the dialysable serum inducer of germ-tube formation in Candida albicans. Microbiology. 2004;150:3041–3049. doi: 10.1099/mic.0.27121-0. [DOI] [PubMed] [Google Scholar]
- Huh W.-K., Kang S.-O. Charaterization of the gene family encoding alternative oxidase from Candida albicans. Biochem. J. 2001;356:595–604. doi: 10.1042/0264-6021:3560595. [DOI] [PMC free article] [PubMed] [Google Scholar]
- Hwang C. S., Rhie G. E., Oh J. H., Huh W. K., Yim H. S., Kang S. O. Copper- and zinc-containing superoxide dismutase (Cu/ZnSOD) is required for the protection of Candida albicans against oxidative stresses and the expression of its full virulence. Microbiol. 2002;148:3705–3713. doi: 10.1099/00221287-148-11-3705. [DOI] [PubMed] [Google Scholar]
- Johnston M. Feasting, fasting and fermenting. Trends Genet. 1999;15:29–33. doi: 10.1016/s0168-9525(98)01637-0. [DOI] [PubMed] [Google Scholar]
- Leuker C. E., Sonneborn A., Delbruck S., Ernst J. F. Sequence and promoter regulation of the PCK1 gene encoding phosphoenolpyruvate carboxykinase of the fungal pathogen Candida albicans. Gene. 1997;192:235–240. doi: 10.1016/s0378-1119(97)00069-3. [DOI] [PubMed] [Google Scholar]
- Lorenz M. C., Fink G. R. The glyoxylate cycle is required for fungal virulence. Nature. 2001;412:83–86. doi: 10.1038/35083594. [DOI] [PubMed] [Google Scholar]
- Lorenz M. C., Bender J. A., Fink G. R. Transcriptional response of Candida albicans upon internalization by macrophages. Eukaryot. Cell. 2004;3:1076–1087. doi: 10.1128/EC.3.5.1076-1087.2004. [DOI] [PMC free article] [PubMed] [Google Scholar]
- MacCallum D. M., Castillo L., Nather K., Munro C. A., Brown A.J.P., Gow N. A., Odds F. C. Property differences among the four major Candida albicans strain clades. Eukaryot. Cell. 2009;8:373–387. doi: 10.1128/EC.00387-08. [DOI] [PMC free article] [PubMed] [Google Scholar]
- Mager W. H., Planta R. J. Coordinate expression of ribosomal protein genes in yeast as a function of cellular growth rate. Mol. Cell. Biochem. 1991;104:181–187. doi: 10.1007/BF00229818. [DOI] [PubMed] [Google Scholar]
- Maidan M. M., Thevelein J. M., Van Dijck P. Carbon source induced yeast-to-hypha transition in Candida albicans is dependent on the presence of amino acids and on the G-protein-coupled receptor Gpr1. Biochem. Soc. Trans. 2005;33:291–293. doi: 10.1042/BST0330291. [DOI] [PubMed] [Google Scholar]
- Martchenko M., Alarco A. M., Harcus D., Whiteway M. Superoxide dismutases in Candida albicans: transcriptional regulation and functional characterization of the hyphal-induced SOD5 gene. Mol. Biol. Cell. 2004;15:456–467. doi: 10.1091/mbc.E03-03-0179. [DOI] [PMC free article] [PubMed] [Google Scholar]
- Mitchell A., Romano G. H., Groisman B., Yona A., Dekel E., Kupiec M., Dahan O., Pilpel Y. Adaptive prediction of environmental changes by microorganisms. Nature. 2009;460:220–224. doi: 10.1038/nature08112. [DOI] [PubMed] [Google Scholar]
- Munro C. A., Winter K., Buchan A., Henry K., Becker J. M., Brown A.J.P., Bulawa C. E., Gow N.A.R. Chs1 of Candida albicans is an essential chitin synthase required for synthesis of the septum and for cell integrity. Mol. Microbiol. 2001;39:1414–1426. doi: 10.1046/j.1365-2958.2001.02347.x. [DOI] [PubMed] [Google Scholar]
- Murphy J. M. Mechanisms of natural resistance to human pathogenic fungi. Ann. Rev. Microbiol. 1991;45:509–538. doi: 10.1146/annurev.mi.45.100191.002453. [DOI] [PubMed] [Google Scholar]
- Nakayama H., Mio T., Nagahashi S., Kokado M., Arisawa M., Aoki Y. Tetracycline-regulatable system to tightly control gene expression in the pathogenic fungus Candida albicans. Infect. Immun. 2000;68:6712–6719. doi: 10.1128/iai.68.12.6712-6719.2000. [DOI] [PMC free article] [PubMed] [Google Scholar]
- Neves M. J., Terenzi H. F., Leone F. A., Jorge J. A. Quantification of trehalose in biological samples with a conidial trehalase from the thermophilic fungus Humicola grisea var. thermoidea. World J. Microbiol. Biotechnol. 1994;10:17–19. doi: 10.1007/BF00357555. [DOI] [PubMed] [Google Scholar]
- Nicholls S., Straffon M., Enjalbert B., Nantel A., Macaskill S., Whiteway M., Brown A.J.P. Msn2/4-like transcription factors play no obvious roles in the stress responses of the fungal pathogen, Candida albicans. Eukaryot. Cell. 2004;3:1111–1123. doi: 10.1128/EC.3.5.1111-1123.2004. [DOI] [PMC free article] [PubMed] [Google Scholar]
- Niimi M., Kamiyama A., Tokunaga M. Respiration of medically important Candida species and Saccharomyces cerevisiae in relation to glucose effect. J. Med. Vet. Mycol. 1988;26:195–198. [PubMed] [Google Scholar]
- Nunes P. A., Tenreiro S., Sa-Correia I. Resistance and adaptation to quinidine in Saccharomyces cerevisiae: role of QDR1 (YIL120w), encoding a plasma membrane transporter of the major facilitator superfamily required for multidrug resistance. Antimicrob. Agents Chemother. 2001;45:1528–1534. doi: 10.1128/AAC.45.5.1528-1534.2001. [DOI] [PMC free article] [PubMed] [Google Scholar]
- Odds F. C. Candida and Candidosis. 2nd ed. London, United Kingdom: Bailliere Tindall; 1988. [Google Scholar]
- Piekarska K., Mol E., van den Berg M., Hardy G., van den Burg J., van Roermund C., MacCallum D., Odds F. C., Distel B. Peroxisomal fatty acid β-oxidation is not essential for virulence of Candida albicans. Eukaryot. Cell. 2006;5:1847–1856. doi: 10.1128/EC.00093-06. [DOI] [PMC free article] [PubMed] [Google Scholar]
- Postma E., Verduyn C., Scheffers W. A., Van Dijken J. P. Enzymic analysis of the Crabtree effect in glucose-limited chemostat cultures of Saccharomyces cerevisiae. Appl. Environ. Microbiol. 1989;55:468–477. doi: 10.1128/aem.55.2.468-477.1989. [DOI] [PMC free article] [PubMed] [Google Scholar]
- Ramirez M. A., Lorenz M. C. Mutations in alternative carbon utilization pathways in Candida albicans attenuate virulence and confer pleiotropic phenotypes. Eukaryot. Cell. 2007;6:280–290. doi: 10.1128/EC.00372-06. [DOI] [PMC free article] [PubMed] [Google Scholar]
- Ramsdale M., Selway L., Stead D., Walker J., Yin Z., Nicholls S. M., Shiels E. M., Brown A.J.P. MNL1 regulates weak acid induced stress responses of the fungal pathogen Candida albicans. Mol. Biol. Cell. 2008;19:4393–4403. doi: 10.1091/mbc.E07-09-0946. [DOI] [PMC free article] [PubMed] [Google Scholar]
- Reeves E. P., Lu H., Jacobs H. L., Messina C. G. M., Bolsover S., Gabella G., Potma E. O., Warley A., Roes J., Segal A. W. Killing activity of neutrophils is mediated through activation of proteases by K+ flux. Nat. Rev. Microbiol. 2002;416:291–297. doi: 10.1038/416291a. [DOI] [PubMed] [Google Scholar]
- Rodriguez-Navarro A., Quintero F. J., Garciadablas B. Na(+)-ATPases and Na+/H+ antiporters in fungi. Biochim. Biophys. Acta. 1994;1187:203–205. doi: 10.1016/0005-2728(94)90111-2. [DOI] [PubMed] [Google Scholar]
- Rolland F., Winderickx J., Thevelein J. M. Glucose sensing mechanisms in eukaryotic cells. Trends Biochem. Sci. 2001;26:310–317. doi: 10.1016/s0968-0004(01)01805-9. [DOI] [PubMed] [Google Scholar]
- Rubin-Bejerano I., Fraser I., Grisafi P., Fink G. R. Phagocytosis by neutrophils induces an amino acid deprivation response in Saccharomyces cerevisiae and Candida albicans. Proc. Natl. Acad. Sci. USA. 2003;100:11007–11012. doi: 10.1073/pnas.1834481100. [DOI] [PMC free article] [PubMed] [Google Scholar]
- San Jose C., Monge R. A., Perez-Diaz R., Pla J., Nombela C. The mitogen-activated protein kinase homolog HOG1 gene controls glycerol accumulation in the pathogenic fungus Candida albicans. J. Bacteriol. 1996;178:5850–5952. doi: 10.1128/jb.178.19.5850-5852.1996. [DOI] [PMC free article] [PubMed] [Google Scholar]
- Sanglard D., Kuchler K., Ischer F., Pagani J. L., Monod M., Bille J. Mechanisms of resistance to azole antifungal agents in Candida albicans isolates from AIDS patients involve specific multidrug transporters. Antimicrob. Agents Chemother. 1995;39:2378–2386. doi: 10.1128/aac.39.11.2378. [DOI] [PMC free article] [PubMed] [Google Scholar]
- Sanglard D., Ischer F., Monod M. Cloning of Candida albicans genes conferring resistance to azole antifungal agents: characterization of CDR 2, a new multidrug ABC transporter gene. Microbiology. 1997;143:405–416. doi: 10.1099/00221287-143-2-405. [DOI] [PubMed] [Google Scholar]
- Sasada M., Johnston R. B. Macrophage microbicidal activity: correlation between phagocytosis-associated oxidative metabolism and the killing of Candida by macrophages. J. Exp. Med. 1980;152:85–98. doi: 10.1084/jem.152.1.85. [DOI] [PMC free article] [PubMed] [Google Scholar]
- Servos J., Haase E., Brendel M. Gene SNQ 2 of Saccharomyces cerevisiae, which confers resistance to 4-nitroquinilone-N-oxide and other chemicals, encodes a 169 kDa protein homologous to the ATP-dependent permeases. Mol. Gen. Genet. 1993;236:214–218. doi: 10.1007/BF00277115. [DOI] [PubMed] [Google Scholar]
- Smith D. A., Nicholls S., Morgan B. A., Brown A.J.P., Quinn J. A conserved stress-activated protein kinase regulates a core stress response in the human pathogen Candida albicans. Mol. Biol. Cell. 2004;15:4179–4190. doi: 10.1091/mbc.E04-03-0181. [DOI] [PMC free article] [PubMed] [Google Scholar]
- Stanhill A., Schick N., Engelberg D. The yeast Ras/cyclic AMP pathway induces invasive growth by suppressing the cellular stress response. Mol. Cell. Biol. 1999;19:7529–7538. doi: 10.1128/mcb.19.11.7529. [DOI] [PMC free article] [PubMed] [Google Scholar]
- Stephen D. W., Rivers S. L., Jamieson D. J. The role of the YAP1 and YAP2 genes in the regulation of the adaptive oxidative stress responses of Saccharomyces cerevisiae. Mol. Microbiol. 1995;16:415–423. doi: 10.1111/j.1365-2958.1995.tb02407.x. [DOI] [PubMed] [Google Scholar]
- Thevelein J. M., de Winde J. H. Novel sensing mechanisms and targets for cAMP-protein kinase A pathway in the yeast Saccharomyces cerevisiae. Mol. Microbiol. 1999;33:904–918. doi: 10.1046/j.1365-2958.1999.01538.x. [DOI] [PubMed] [Google Scholar]
- Thewes S., Kretschmar M., Park H., Schaller M., Filler S. G., Hube B. In vivo and ex vivo comparative transcriptional profiling of invasive and non-invasive Candida albicans isolates identifies genes associated with tissue invasion. Mol. Microbiol. 2007;63:1606–1628. doi: 10.1111/j.1365-2958.2007.05614.x. [DOI] [PubMed] [Google Scholar]
- Tusher V. G., Tibshirani R., Chu G. Significance analysis of microarrays applied to the ionizing radiation response. Proc. Natl. Acad. Sci. USA. 2001;98:5116–5121. doi: 10.1073/pnas.091062498. [DOI] [PMC free article] [PubMed] [Google Scholar]
- Van Dijck P., De Rop L., Szlufcik K., Van Ael E., Thevelein J. M. Disruption of the Candida albicans TPS2 gene encoding trehalose-6-phosphate phosphatase decreases infectivity without affecting hypha formation. Infect. Immun. 2002;4:1772–1782. doi: 10.1128/IAI.70.4.1772-1782.2002. [DOI] [PMC free article] [PubMed] [Google Scholar]
- Vargas S. L., Patrick C. C., Ayers G. D., Hughes W. T. Modulating the effects of dietary carbohydrate supplementation on Candida albicans colonization and invasion in a neutropenic mouse model. Infect. Immun. 1993;61:619–626. doi: 10.1128/iai.61.2.619-626.1993. [DOI] [PMC free article] [PubMed] [Google Scholar]
- Vasquez-Torres A., Balish E. Macrophages in resistance to candidiasis. Microbiol. Mol. Biol. Rev. 1997;61:170–192. doi: 10.1128/mmbr.61.2.170-192.1997. [DOI] [PMC free article] [PubMed] [Google Scholar]
- Wiemken A. Trehalose in yeast, stress protectant rather than reserve carbohydrate. Antonie van Leeuwenhoek. 1990;58:209–217. doi: 10.1007/BF00548935. [DOI] [PubMed] [Google Scholar]
- Wilson R. B., Davis D., Mitchell A. P. Rapid hypothesis testing with Candida albicans through gene disruption with short homology regions. J. Bacteriol. 1999;181:1868–1874. doi: 10.1128/jb.181.6.1868-1874.1999. [DOI] [PMC free article] [PubMed] [Google Scholar]
- Wilson D., Tutulan-Cunita A., Jung W., Hauser N. C., Hernandez R., Williamson T., Piekarska K., Rupp S., Young T., Stateva L. Deletion of the high-affinity cAMP phosphodiesterase encoded by PDE2 affects stress responses and virulence in Candida albicans. Mol. Microbiol. 2007;65:841–856. doi: 10.1111/j.1365-2958.2007.05788.x. [DOI] [PubMed] [Google Scholar]
- Wysong D. R., Christin L., Sugar A. M., Robbins P. W., Diamond R. D. Cloning and sequencing of a Candida albicans catalase gene and effects of disruption of this gene. Infect. Immun. 1998;66:1953–1961. doi: 10.1128/iai.66.5.1953-1961.1998. [DOI] [PMC free article] [PubMed] [Google Scholar]
- Yin Z., Smith R. J., Brown A.J.P. Multiple signalling pathways trigger the exquisite sensitivity of yeast gluconeogenic mRNAs to glucose. Mol. Microbiol. 1996;20:751–761. doi: 10.1111/j.1365-2958.1996.tb02514.x. [DOI] [PubMed] [Google Scholar]
- Yin Z., Wilson S., Hauser N. C., Tournu H., Hoheisel J. D., Brown A.J.P. Glucose triggers different global responses in yeast depending on the strength of the signal, and transiently stabilises ribosomal protein mRNAs. Mol. Microbiol. 2003;48:713–724. doi: 10.1046/j.1365-2958.2003.03478.x. [DOI] [PubMed] [Google Scholar]
- Zakikhany K., Naglik J. R., Schmidt-Westhausen A., Holland G., Schaller M., Hube B. In vivo transcript profiling of Candida albicans identifies a gene essential for interepithelial dissemination. Cell. Microbiol. 2007;9:2938–2954. doi: 10.1111/j.1462-5822.2007.01009.x. [DOI] [PubMed] [Google Scholar]
- Zaragoza O., Blazquez M. A., Gancedo C. Disruption of the Candida albicans TPS1 gene encoding trehalose-6-phosphate synthase impairs formation of hyphae and decreases infectivity. J. Bacteriol. 1998;180:3809–3815. doi: 10.1128/jb.180.15.3809-3815.1998. [DOI] [PMC free article] [PubMed] [Google Scholar]
- Zhou H., Lorenz M. C. Carnitine acetyltransferases are required for growth on non-fermentable carbon sources but not for pathogenesis in Candida albicans. Microbiology. 2008;154:500–509. doi: 10.1099/mic.0.2007/014555-0. [DOI] [PubMed] [Google Scholar]
Associated Data
This section collects any data citations, data availability statements, or supplementary materials included in this article.