

Abstract
Purpose
The proteasome is a multisubunit cellular organelle that functions as a nonlysosomal threonine protease. Proteasomes play a critical role in the degradation of proteins, regulating a variety of cellular processes, and they are also the target for antineoplastic proteasome inhibitors. Genetic variation in proteasome subunits could influence both proteasome function and response to drug therapy.
Experimental Design
We resequenced genes encoding the three active proteasome β subunits using 240 DNA samples from four ethnic groups and the β5 subunit gene in 79 DNA samples from multiple myeloma patients who had been treated with the proteasome inhibitor bortezomib. Resequencing was followed by functional studies of polymorphisms identified in the coding region and 3′-flanking region (3′-FR) of PSMB5, the gene encoding the target for clinically useful proteasome inhibitors.
Results
Resequencing of 240 DNA samples identified a series of novel ethnic-specific polymorphisms that are not represented in public databases.The PSMB5 3′-FR1042 G allele significantly increased transcription during reporter gene studies, observations confirmed by genotype-phenotype correlations between single nucleotide polymorphisms (SNP) in PSMB5 and mRNA expression in the 240 lymphoblastoid cell lines from which the resequenced DNA was obtained. Studies with patient DNA samples identified additional novel PSMB5 polymorphisms, including a SNP and an insertion in the 3′-FR. Reporter-gene studies indicated that these two novel polymorphisms might decrease transcription.
Conclusions
These results show that nonsynonymous coding SNPs in the PSMB5 gene did not show significant effects on proteasome activity, but SNPs did influence transcription. Future studies might focus on regulatory region polymorphisms.
Protein degradation regulates a variety of critical cellular processes, including cell division, signal transduction, and apoptosis (1-4). The proteasome is a multisubunit cellular organelle that functions as a nonlysosomal threonine protease. It plays a critical role in protein degradation and is the target for antineoplastic proteasome inhibitors (1-5). The 26S proteasome consists of a 20S barrel-shaped core particle and two 19S regulatory complexes that cap the 20S core particle. The 20S core particle is a multisubunit enzyme complex that consists of four heptameric rings arranged in α7β7β7α7 fashion, surrounding a central cavity where the catalytic sites are found (6-8). Three of the seven β subunits, β1, β2, and β5, are proteolytically active with different substrate specificities. The β1 subunit catalyzes a postglutamyl peptidyl hydrolytic-like activity; the β2 subunit catalyzes a trypic-like activity; and the β5 subunit catalyzes a chymotryptic-like activity (9).
Proteasome inhibitors have been tested for the treatment of a variety of types of cancers. One of those drugs, bortezomib, with activity directed mainly against the β5 subunit, has been approved for the treatment of refractory multiple myeloma (10, 11). However, clinical response to bortezomib therapy varies widely (12-14). Because the proteasome has critical importance for cellular processes and because it is also a drug target, it would be important to identify common sequence variation in genes encoding the three active β subunits and to determine the possible functional implications of that sequence variation. However, no systematic pharmacogenomic studies have been done of genes encoding human proteasome β subunits. Therefore, in the present study, we did comprehensive resequencing studies of PSMB1, PSMB2, and PSMB5 genes encoding the three active β subunits, followed by functional characterization of nonsynonymous coding single nucleotide polymorphisms (cSNP) in PSMB5 (the gene encoding the β5 subunit), the major proteasome inhibitor therapeutic target, as well as a correlation of level of PSMB5 expression with gene sequence variation. We also resequenced the PSMB5 gene using DNA from patients with multiple myeloma who had been treated with bortezomib, using both tumor and germ line DNA, resulting in the identification of additional novel PSMB5 polymorphisms. This series of studies represents a step toward understanding sequence variation in genes encoding the three active proteasome β subunits, as well as the potential implications of that DNA sequence variation for individual differences in response to treatment with proteasome inhibitors and/or contribution to disease pathophysiology.
Materials and Methods
DNA samples
DNA samples from 60 Caucasian American, 60 African American, 60 Han Chinese American, and 60 Mexican American subjects (sample sets HD100CAU, HD100AA, HD100CHI, and HD100MEX) were obtained from the Coriell Cell Repository. These DNA samples have been widely used for human gene resequencing studies (15-20). Immortalized lymphoblastoid cell lines from these same subjects are available from the Coriell Institute, and those cell lines were also used in the experiments described subsequently. All of these DNA samples and cell lines had been obtained and anonymized by the National Institute of General Medical Sciences before deposit, and all subjects had provided written consent for the use of their DNA and cells for experimental purposes. In addition, 79 DNA samples from patients with multiple myeloma were isolated from either bone marrow or peripheral blood. Specifically, these 79 clinical DNA samples were obtained from 61 multiple myeloma patients who had been treated with the proteasome inhibitor bortezomib. These patients had also provided written consent for the use of their samples for research purposes. The clinical DNA samples included 11 paired bone marrow and peripheral blood samples from the same patient. A total of 39 DNA samples were isolated from bone marrow plasma cells, and 40 samples were isolated from peripheral blood obtained from these patients. All of these experiments were reviewed and approved by Mayo Clinic Institutional Review Board.
Human PSMB1, PSMB2, and PSMB5 gene resequencing
DNA samples were used to perform PCR amplifications to resequence genes encoding the three active proteasome β subunits. PCR primer sequences and amplification conditions are listed in Supplementary Table S1. Resequencing was done using dye termination sequencing chemistry as described previously (18-20). Amplicons were sequenced on both strands in the Mayo Molecular Biology Core Facility with an ABI 377 DNA sequencer. To exclude PCR-induced artifacts, independent amplifications were done for samples in which a SNP was observed only once or for any sample with an ambiguous chromatogram. The chromatograms were analyzed with Mutation Surveyor (SoftGenetics).
Transient transfection and expression
The wild-type (WT) cDNA sequence for PSMB5 was cloned into pcDNA3.1/V5-HisTOPO TA to use as a template for site-directed mutagenesis done using circular PCR to create variant allozyme expression constructs that encoded PSMB5 Cys24, Cys212, and Met238. The sequences of primers used to perform site-directed mutagenesis are also listed in Supplementary Table S1. Sequences of all constructs were confirmed by sequencing the insert in both directions. These constructs were transiently transfected into HeLa cells using the TransFast reagent (Promega) at a charge ratio of 1:1. Cells were harvested after 48 h, and proteasomes were isolated and used to perform proteasome activity assays.
Proteasome isolation
26S proteasomes were isolated as described elsewhere (21) from cells transfected with constructs for the PSMB5 WT and three variant allozymes, as well as from lymphoblastoid cells that naturally expressed these nonsynonymous cSNPs. Specifically, cells were collected and resuspended in 4 volumes of homogenization buffer [50 mmol/L Tris-HCl (pH 7.5), 250 mmol/L MgCl2, 2 mmol/L ATP, 1 mmol/L DTT, 0.5 mmol/L EDTA] containing freshly prepared 0.025% digitonin. The resuspended cells were incubated on ice for 5 min, and were then centrifuged at 20,000 × g at 4°C for 15 min. The supernatants were separated, and protein concentrations were determined. The cytosolic 26S proteasomes obtained in this fashion were used to perform enzyme activity and inhibition studies.
Proteasome activity and inhibition studies
Proteasome activity and inhibition assays were done as described previously (21). Specifically, cytosolic 26S proteasomes isolated as described above were incubated at 37°C with assay buffer [50 mmol/L Tris-HCl (pH 7.5), 40 mmol/L KCl, 5 mmol/L MgCl2, 0.5 mmol/L ATP, 1 mmol/L DTT, and 0.05 mg/mL bovine serum albumin], and increasing concentrations of the fluorogenic substrate Suc-LLVY-amc (0, 12.5, 25, 50, and 100 μmol/L) and fluorescence was measured with a Safire2 plate reader (Tecan). For inhibition studies, concentrations of the proteasome inhibitor MG262 ranging from 10 to 60 nmol/L were premixed with assay buffer 10 min before the addition of substrate. All assays were done at least three times, and results were expressed as mean ± SE for three determinations.
Proteasome inhibitor cytotoxicity studies
Inhibitors of the proteasome β5 subunit are used clinically to treat cancer because of their cytotoxic properties. Therefore, cytotoxicity studies were done using the β5 subunit inhibitor MG262 with lymphoblastoid cells having known genotypes for the PSMB5 gene. Specifically, increasing concentrations of MG262 (10, 20, 25, and 30 nmol/L) were incubated with the cell lines in 96-well plates for 3 d, followed by MTS assays as a measure of cytotoxicity. Each experiment was repeated three times, and results were expressed as GI50 values, the concentration of MG262 that inhibited growth by 50%.
Expression array genotype-phenotype correlation
Expression array analyses were done using Affymetrix U133 Plus 2.0 GeneChips. Specifically, RNA was isolated from the same lymphoblastoid cells from which the DNA used to resequence PSMB1, PSMB2, and PSMB5 had been obtained. Expression array data were normalized using the GCRMA method (22), and levels of PSMB5 expression in all 240 cell lines were used to perform genotype-phenotype correlation studies. Before performing the genetic association studies, Hardy-Weinberg equilibrium was analyzed for each SNP using a stratified Hardy-Weinberg equilibrium test. Because there were significant differences among ethnic groups in minor allele frequencies for a given SNP, the genotype-phenotype association analyses were done by ethnic group for SNPs with a minor allele frequency of >5% within that ethnic group. The association of each SNP with expression level was evaluated using a linear model in which SNP genotypes were evaluated with the use of two indicators as covariates (e.g., a 2-degree-of-freedom test for each SNP). In addition to the 2-degree-of-freedom test, a 1-degree-of-freedom test for trend was also used, with SNP genotypes coded as 0, 1, or 2 according to the number of rare variants present. PSMB5 expression values were analyzed on a log 2 scale, and the data were adjusted for gender, race, and the time of cell storage at the Coriell Institute.
Luciferase reporter gene assays
To create reporter gene constructs, ~500 bp of PSMB5 3′-flanking region (3′-FR) sequence was amplified from either the Coriell or the patient genomic DNA samples. Forward and reverse primers for these amplifications contained ACC65I and XhoI restriction sites, respectively, to make it possible to subclone the amplicons into pGL-3 Basic (Promega) upstream of the firefly luciferase gene open-reading frame. Specifically, reporter gene constructs were created by the amplification of a portion of the PSMB5 3′-FR that included either SNPs or a 17-bp insertion using DNA samples that contained these polymorphisms, followed by the cloning of amplicons into pGL-3 Basic, with or without subsequent site-directed mutagenesis. All of these reporter gene constructs were used to transfect HEK293T and COS-1 cells, and luciferase activity was determined as described previously (23). All of the primers used to create the reporter gene constructs are also listed in Supplementary Table S1.
Data analysis
DNA sequence obtained during the gene resequencing studies was compared with PSMB1, PSMB2, and PSMB5 genomic and cDNA genomic consensus sequences (PSMB1 NM_144662 and NT_007583.11; PSMB2, NM_002794 and NT_004511.17; and PSMB5, D29011 and NT_026437.11). IC50 and GI50 values for WT and variant allozymes, as well as the luciferase activity data for WT and variant constructs, were compared by ANOVA done with the Prism program. Linkage disequilibrium among PSMB1, PSMB2, and PSMB5 polymorphisms was determined by calculating D′ values for all possible pairwise combinations of polymorphisms. This method for determining linkage disequilibrium is independent of allele frequency (2, 24). Haplotypes for alleles that contained only one heterozygous polymorphism were determined unequivocally, and other haplotypes were inferred computationally as described by Schaid et al. (25).
Results
PSMB1, PSMB2, and PSMB5 gene resequencing
PSMB1, PSMB2, and PSMB5 were resequenced using 240 DNA samples obtained from 60 African American, 60 Caucasian American, 60 Han Chinese American, and 60 Mexican American subjects. The areas resequenced included all exons, exon-intron splice junctions, and ~1 to 2 kb of 5′-FR for each gene. These resequencing data have been deposited in the NIH database PharmGKB. Fig. 1 shows the locations of the polymorphisms observed, and individual polymorphisms are listed in Table 1. Twenty-six polymorphisms were identified in PSMB1, including two nonsynonymous cSNPs; 40 polymorphisms, but no nonsynonymous SNPs, were identified in PSMB2; and 21 polymorphisms were identified in PSMB5, including three nonsynonymous cSNPs. None of the nonsynonymous cSNPs changed amino acids located within the catalytic sites for any of the subunits (9). The vast majority of these polymorphisms were not available in public databases. For example, 21 of 26 polymorphisms that we identified in PSMB1, 36 of 40 polymorphisms in PSMB2, and 14 of 21 in PSMB5—including two novel nonsynonymous cSNPs—were not publicly available. Allele frequencies for the nonsynonymous cSNPs differed greatly among ethnic groups (Table 1). For example, the PSMB5 Arg24Cys polymorphism was present in all ethnic groups except Han Chinese American; PSMB5 Try212Cys was observed only in one Mexican American subject; and the PSMB5 Val238Met polymorphism was observed only in a Han Chinese American subject (Table 1). It should also be noted that we arbitrarily selected the least common allele in the African American data as the variant allele but, in several cases, that was the most common allele in other populations. All of the polymorphisms identified during the resequencing effort were in Hardy-Weinberg equilibrium (P > 0.05).
Fig.1.
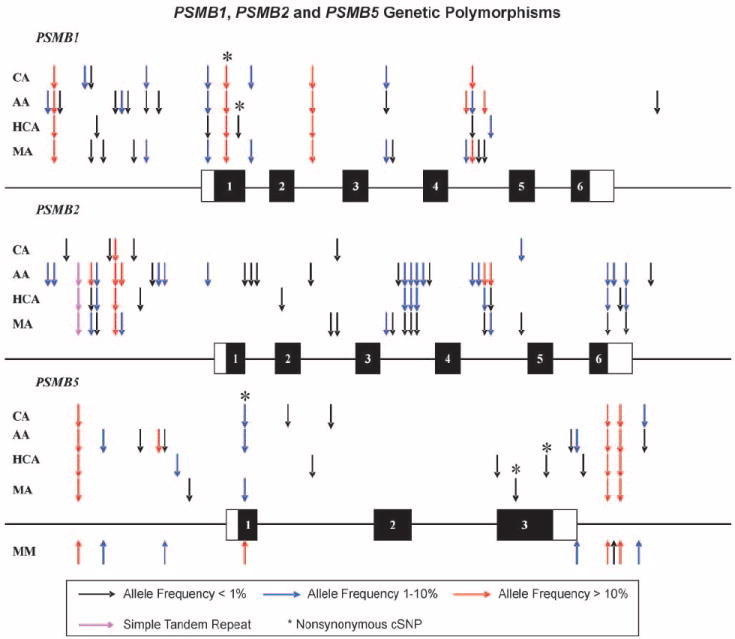
Human PSMB1, PSMB2, and PSMB5 genetic polymorphisms; a schematic representation of the (A) PSMB1, (B) PSMB2, and (C) PSMB5 gene structures. Arrows, locations of polymorphisms. Rectangles, exons; black rectangles, open reading frame; open rectangles, untranslated regions. AA, African American subjects; CA, Caucasian American subjects; HCA, Han Chinese American subjects; MA, Mexican American subjects. SNPs identified in PSMB5 for DNA samples from multiple myeloma (MM) patients are also listed. *, SNPs altering encoded amino acids.
Table 1.
Human PSMB1, PSMB2, and PSMB5 genetic polymorphisms
| Location | Nucleotide | Sequence change | Amino acid change | Frequency of variant allele |
||||
|---|---|---|---|---|---|---|---|---|
| African American | Caucasian American | Han Chinese American | Mexican American | |||||
| PSMB1 | ||||||||
| 5′-FR | -1199 | A→G | 0.017 | 0.000 | 0.000 | 0.000 | ||
| 5′-FR | -1043 | A→G | 0.133 | 0.308 | 0.767 | 0.342 | ||
| 5′-FR | -933 | C→G | 0.008 | 0.000 | 0.000 | 0.000 | ||
| 5′-FR | -779 | A→C | 0.000 | 0.017 | 0.000 | 0.000 | ||
| 5′-FR | -767 to -769 | GAT deletion | 0.000 | 0.008 | 0.000 | 0.008 | ||
| 5′-FR | -696 | G→T | 0.000 | 0.000 | 0.008 | 0.000 | ||
| 5′-FR | -695 | C→T | 0.000 | 0.000 | 0.000 | 0.008 | ||
| 5′-FR | -621 | A→C | 0.008 | 0.000 | 0.000 | 0.000 | ||
| 5′-FR | -573 | G→A | 0.017 | 0.000 | 0.000 | 0.000 | ||
| 5′-FR | -213 | A→C | 0.008 | 0.000 | 0.000 | 0.000 | ||
| 5′-FR | -192 | G→C | 0.000 | 0.000 | 0.000 | 0.008 | ||
| 5′-FR | -126 | C→A | 0.008 | 0.050 | 0.000 | 0.042 | ||
| 5′-FR | -62 | C→T | 0.008 | 0.000 | 0.000 | 0.000 | ||
| 5′-UTR | -6 | C→T | 0.100 | 0.025 | 0.008 | 0.042 | ||
| Exon 1 | 31 | C→G | Pro11Ala | 0.300 | 0.383 | 0.800 | 0.417 | |
| Exon 1 | 73 | C→T | Pro25Ser | 0.000 | 0.000 | 0.008 | 0.000 | |
| Intron 1 | -27 | G→A | 0.000 | 0.033 | 0.000 | 0.025 | ||
| Intron 2 | 49 | A→G | 0.233 | 0.550 | 0.200 | 0.475 | ||
| Intron 3 | 15 | A→G | 0.008 | 0.042 | 0.000 | 0.042 | ||
| Intron 3 | 23 | A→G | 0.000 | 0.000 | 0.000 | 0.008 | ||
| Intron 4 | 35 | Deletion of G | 0.208 | 0.000 | 0.000 | 0.017 | ||
| Intron 4 | 128 | T→C | 0.042 | 0.167 | 0.008 | 0.308 | ||
| Intron 4 | 136 | A→G | 0.000 | 0.000 | 0.000 | 0.008 | ||
| Intron 4 | 154 | A→G | 0.133 | 0.000 | 0.000 | 0.008 | ||
| Intron 4 | -30 | A→G | 0.000 | 0.000 | 0.017 | 0.000 | ||
| 3′-FR | 862 | C→A | 0.008 | 0.000 | 0.000 | 0.000 | ||
| PSMB2 | ||||||||
| 5′-FR | -1041 | A→G | 0.033 | 0.000 | 0.000 | 0.000 | ||
| 5′-FR | -976 to -975 | Deletion of TA | 0.033 | 0.000 | 0.000 | 0.000 | ||
| 5′-FR | -859 | T→G | 0.000 | 0.008 | 0.000 | 0.000 | ||
| 5′-FR | -826 | (TC)n | ||||||
| n = 2 | 0.782 | 1.000 | 0.917 | 0.967 | ||||
| n = 3 | 0.182 | 0.000 | 0.083 | 0.017 | ||||
| n = 4 | 0.036 | 0.000 | 0.000 | 0.000 | ||||
| 5′-FR | -716 | A→G | 0.125 | 0.000 | 0.008 | 0.017 | ||
| 5′-FR | -707 to -706 | Deletion of CT | 0.092 | 0.000 | 0.017 | 0.008 | ||
| 5′-FR | -555 | G→A | 0.000 | 0.008 | 0.000 | 0.000 | ||
| 5′-FR | -477 | G→T | 0.192 | 0.917 | 0.208 | 0.492 | ||
| 5′-FR | -425 | G→A | 0.117 | 0.000 | 0.000 | 0.017 | ||
| 5′-FR | -405 | T→C | 0.000 | 0.008 | 0.000 | 0.000 | ||
| 5′-FR | -381 | G→C | 0.000 | 0.000 | 0.008 | 0.000 | ||
| 5′-FR | -224 | G→A | 0.008 | 0.000 | 0.000 | 0.000 | ||
| 5′-FR | -197 | C→A | 0.033 | 0.000 | 0.000 | 0.000 | ||
| 5′-FR | -146 | Deletion of A | 0.025 | 0.000 | 0.000 | 0.000 | ||
| 5′-UTR | -109 | Deletion of T | 0.017 | 0.000 | 0.000 | 0.000 | ||
| Intron 1 | 20 | G→T | 0.008 | 0.000 | 0.000 | 0.000 | ||
| Intron 1 | 43 | G→C | 0.008 | 0.000 | 0.000 | 0.000 | ||
| Intron 1 | -27 | T→C | 0.008 | 0.000 | 0.000 | 0.000 | ||
| Exon 2 | 133 | C→T | 0.000 | 0.000 | 0.008 | 0.000 | ||
| Intron 2 | 57 | A→C | 0.008 | 0.000 | 0.000 | 0.000 | ||
| Intron 2 | 123 | C→G | 0.000 | 0.000 | 0.000 | 0.008 | ||
| Intron 2 | 145 | G→A | 0.000 | 0.008 | 0.000 | 0.008 | ||
| Intron 3 | 6 | T→G | 0.000 | 0.000 | 0.000 | 0.017 | ||
| Intron 3 | 7446 | A→G | 0.000 | 0.000 | 0.000 | 0.008 | ||
| Intron 3 | 7763 to 7766 | Deletion of CAGA | 0.008 | 0.000 | 0.000 | 0.000 | ||
| Intron 3 | 7772 | C→G | 0.092 | 0.000 | 0.017 | 0.008 | ||
| Intron 3 | 7776 | C→T | 0.092 | 0.000 | 0.017 | 0.008 | ||
| Intron 3 | 7937 | T→C | 0.092 | 0.000 | 0.017 | 0.008 | ||
| Intron 3 | -68 | C→T | 0.017 | 0.000 | 0.000 | 0.000 | ||
| Intron 3 | -30 | T→C | 0.008 | 0.000 | 0.000 | 0.000 | ||
| Intron 4 | 30 | Deletion of G | 0.017 | 0.000 | 0.000 | 0.000 | ||
| Intron 4 | 65 | T→C | 0.058 | 0.000 | 0.000 | 0.000 | ||
| Intron 4 | 72 | T→C | 0.125 | 0.000 | 0.017 | 0.008 | ||
| Intron 4 | 93 | G→A | 0.117 | 0.000 | 0.008 | 0.017 | ||
| Intron 4 | -26 | T→C | 0.000 | 0.025 | 0.000 | 0.008 | ||
| 3′-UTR | 611 | A→G | 0.092 | 0.000 | 0.017 | 0.008 | ||
| 3′-UTR | 641 | T→C | 0.033 | 0.000 | 0.000 | 0.000 | ||
| 3′-UTR | 683 | G→A | 0.000 | 0.000 | 0.008 | 0.000 | ||
| 3′-UTR | 684 | C→T | 0.092 | 0.000 | 0.017 | 0.008 | ||
| 3′-FR | 758 | T→C | 0.008 | 0.000 | 0.000 | 0.000 | ||
| Location | Nucleotide | Sequence change | Amino acid change |
Frequency of variant allele |
||||
| African American | Caucasian American | Han Chinese American | Mexican American | Multiple myeloma samples | ||||
| PSMB5 | ||||||||
| 5′-FR | -693 | C→T | 0.117 | 0.658 | 0.825 | 0.717 | 0.538 | |
| 5′-FR | -534 | G→A | 0.067 | 0.000 | 0.000 | 0.000 | 0.013 | |
| 5′-FR | -438 | G→A | 0.008 | 0.000 | 0.000 | 0.000 | 0.000 | |
| 5′-FR | -384 | T→C | 0.000 | 0.000 | 0.000 | 0.000 | 0.000 | |
| 5-FR | -310 | T→C | 0.158 | 0.000 | 0.000 | 0.000 | 0.013 | |
| 5′-FR | -187 | C→G | 0.008 | 0.000 | 0.000 | 0.000 | 0.000 | |
| 5′-FR | -178 to -177 | Insertion of C | 0.000 | 0.000 | 0.042 | 0.000 | 0.000 | |
| 5′-FR | -57 | G→T | 0.000 | 0.000 | 0.000 | 0.008 | 0.000 | |
| Exon 1 | 70 | C→T | Arg24Cys | 0.025 | 0.083 | 0.000 | 0.017 | 0.114 |
| Intron 1 | 230 | A→T | 0.000 | 0.008 | 0.000 | 0.000 | 0.000 | |
| Intron 1 | 269 | G→T | 0.000 | 0.000 | 0.008 | 0.000 | 0.000 | |
| Intron 1 | 331 | C→G | 0.000 | 0.008 | 0.000 | 0.000 | 0.000 | |
| Exon 3 | 588 | G→C | 0.000 | 0.000 | 0.008 | 0.000 | 0.000 | |
| Exon 3 | 635 | A→G | Tyr212Cys | 0.000 | 0.000 | 0.000 | 0.008 | 0.000 |
| Exon 3 | 712 | G→A | Val238Met | 0.000 | 0.000 | 0.008 | 0.000 | 0.000 |
| 3′-UTR | 821 | C→T | 0.008 | 0.000 | 0.000 | 0.000 | 0.000 | |
| 3′-UTR | 847 | G→A | 0.075 | 0.000 | 0.000 | 0.000 | 0.013 | |
| 3′-UTR | 938 to 939 | AT deletion | 0.000 | 0.000 | 0.008 | 0.000 | 0.000 | |
| 3′-FR | 1042 | G→A | 0.200 | 0.683 | 0.932 | 0.792 | 0.608 | |
| 3′-FR | 1094 | G→A | 0.000 | 0.000 | 0.000 | 0.000 | 0.006 | |
| 3′-FR | 1103 | G→A | 0.175 | 0.533 | 0.825 | 0.700 | 0.487 | |
| 3′-FR | 1209 | Insertion of GAGAAGGAGAGAGAGGC | 0.000 | 0.000 | 0.000 | 0.000 | 0.013 | |
| 3′-FR | 1131 to 1133 | AGT deletion | 0.008 | 0.025 | 0.000 | 0.000 | 0.000 | |
NOTE: Polymorphism locations, alterations in nucleotide and amino acid sequences, and minor allele frequencies for the polymorphisms observed during the gene resequencing studies are listed for each of the four ethnic groups studied. The least common allele in African American samples has been designated as the minor allele. Polymorphisms identified in the PSMB5 gene in multiple myeloma patient samples were also listed. The table also indicates whether the polymorphism is represented in dbSNP. Highlighted and bold-faced SNPs are found in dbSNP. Polymorphisms in exons and UTRs and FRs have been numbered with respect to the “A” in the “ATG” translation initiation codon, with positive numbers located 3- and negative numbers 5- to that position. Nucleotides located within introns are numbered based on their distance from splice junctions, using negative or positive numbers, respectively, for distance to 5′- and 3′-splice sites.
We also used our gene resequencing data to calculate nucleotide diversity, a quantitative measure of genetic variation, adjusted for the number of alleles studied. Two standard measures of nucleotide diversity are π, average heterozygosity per site, and θ, a population mutation measure that is theoretically equal to the neutral mutation parameter (26). These values for PSMB1, PSMB2, and PSMB5 are listed in Supplementary Table S2. For all three genes, DNA from African American subjects showed greater apparent diversity in sequence than DNA obtained from other ethnic groups, probably reflecting the greater antiquity of these sequences (27). In addition, values for Tajima’s D, a test of the neutral mutation hypothesis (28), were also estimated for each population (Supplementary Table S2). Under conditions of neutrality, Tajima’s D should equal zero; none of these values differed significantly from zero in any of the populations studied.
PSMB1, PSMB2, and PSMB5 haplotype and linkage disequilibrium analyses
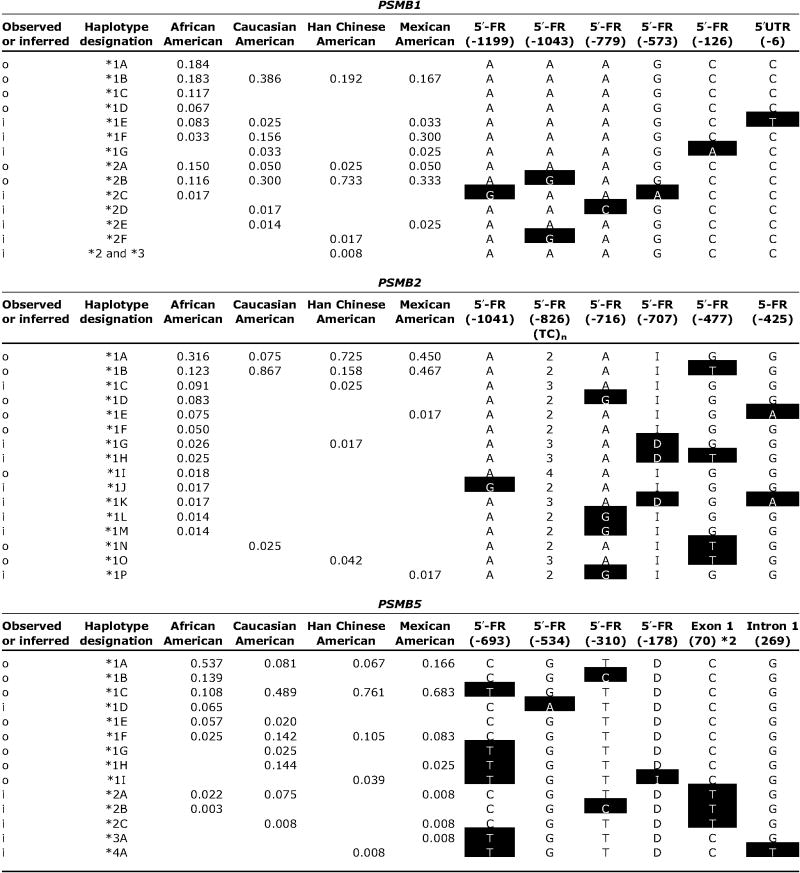
Haplotype and pairwise linkage disequilibrium analyses were done for all three genes because it is becoming increasingly clear that the determination of haplotype may be more helpful than the assay of individual SNPs for use in association studies (29). A total of 14 haplotypes were identified for PSMB1, including 6 observed and 8 inferred haplotypes; 16 haplotypes were identified in PSMB2, including 8 observed and 8 inferred; and there were 14 PSMB5 haplotypes, 8 of which were observed (Table 2). Haplotype frequencies also differed among ethnic groups. African American subjects had more unique haplotypes than other ethnic groups. For example, four unique PSMB1 haplotypes were observed for African American subjects, including one that was the most common haplotype in this ethnic group, with a frequency of ~18%; however, that haplotype was not observed in other ethnic groups (Table 2). Similar observations were made for PSMB5, with African American subjects having three haplotypes that were unique when compared with the other ethnic groups (Table 2). Haplotype designations were assigned based on the amino acid sequences of the encoded allozyme, with the WT amino acid sequence designated as *1. Subsequent number designations referred to variant haplotypes that contained nonsynonymous cSNPs, beginning at the NH2 terminus and proceeding to the COOH terminus of the encoded protein. Letters were then added for haplotypes that included variant nucleotides that did not alter amino acid sequence, ranked from most common to least common. Linkage disequilibrium analysis was also done for all pairwise combinations of SNPs in these three genes by calculating D′ values (2, 24). D′ values can range from +1.0, when two polymorphisms are maximally associated, to zero, when they are randomly associated. However, no clearly defined haplotype blocks were observed in any of these relatively short genes when those data were displayed graphically (data not shown).
Table 2.
PSMB1, PSMB2, and PSMB5 haplotypes
 |
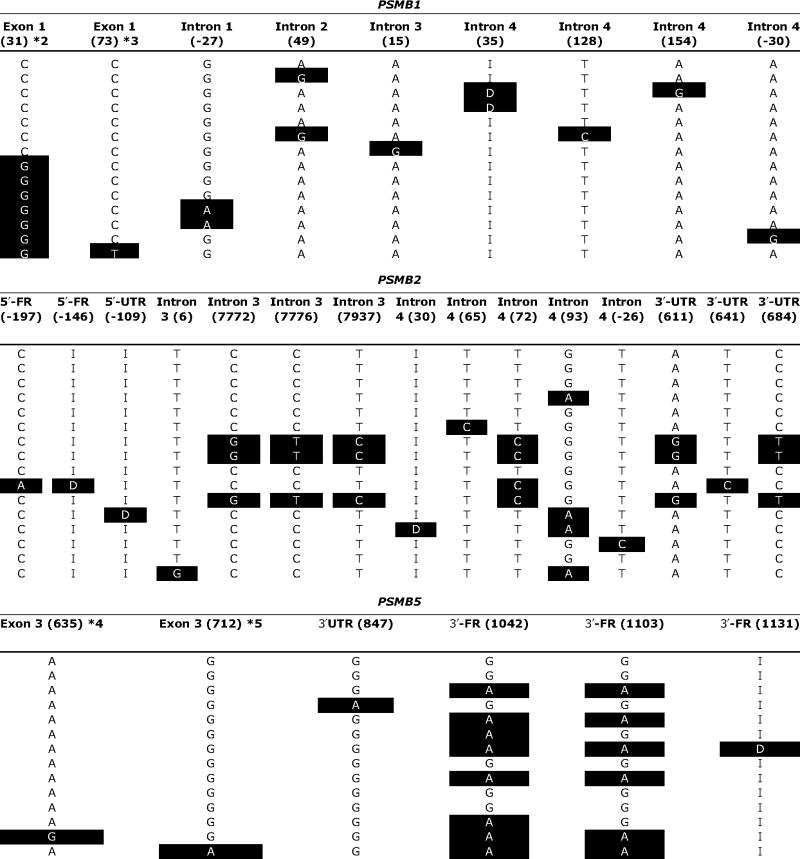 |
NOTE: Nucleotide positions are numbered as described in Table 1. Variant nucleotides compared to the reference sequence, that is, the most common sequence in African American subjects, are highlighted as white on black. Initial haplotype designations (*1, *2, *3, etc.) were made on the basis of amino acids that vary, with the WT sequence designated *1. Subsequent assignments (letter designations) were made within ethnic groups, based on decreasing frequencies. o, unequivocal haplotypes; i, inferred haplotypes; I, insertion; D, deletion.
Proteasome activity and inhibitor studies
Because the β5 subunit is the major therapeutic target for proteasome inhibitors used in the clinic (10, 11), and because three nonsynonymous cSNPs were observed in that gene with minor allele frequencies that differed among ethnic groups, functional characterization of those three nonsynonymous cSNPs was done after transient transfections of HeLa cells. HeLa cells have been used extensively to study proteasome activity (21, 30). In addition, lymphoblastoid cell lines that naturally expressed these nonsynonymous cSNPs, either homozygous or heterozygous, were also used to perform functional studies. Specifically, proteasomes isolated from HeLa cells transfected with four different constructs and from lymphoblastoid cell lines were used to perform assays with the fluorogenic substrate Suc-LLVY-amc to measure the chymotrypsin-like activity of the β5 subunit. There were no significant differences among the four allozymes (WT plus three variants) studied with regard to levels of enzyme activity with either type of cell extract (data not shown).
Because the β5 subunit is the target for clinically used proteasome inhibitors, we also did inhibition studies using a specific β5 proteasome inhibitor, MG262. Those experiments were done with proteasomes isolated from HeLa cells transiently transfected with constructs for PSMB5 variant allozymes, as well as proteasomes isolated from lymphoblastoid cells that naturally expressed these allozymes. Because the PSMB5 WT gene sequence for the African American samples was different from that for the other three ethnic groups, we used two WT samples, one for African American and the other for the remaining ethnic groups. Concentrations of MG262 that ranged from 10 to 60 nmol/L were tested, but IC50 values did not differ significantly among proteasomes isolated from either transfected cells or from cells that naturally expressed these allozymes (Fig. 2A and B).
Fig. 2.
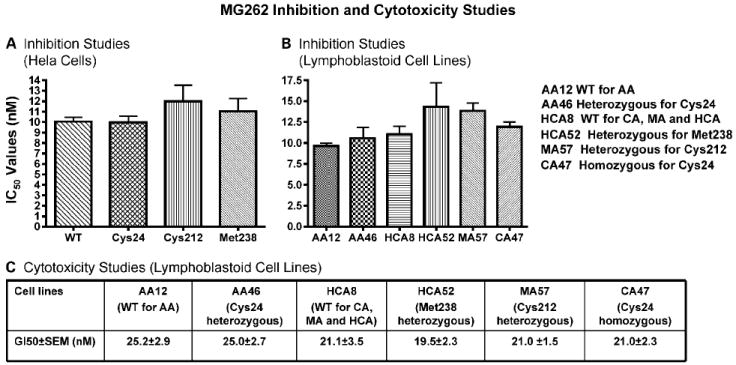
MG262 inhibition studies and cytotoxicity studies. MG262 was used to perform (A) inhibition studies with cell extracts from HeLa cells transfected with expression constructs for PSMB5 WT and variant allozymes, (B) inhibition studies with lymphoblastoid cell extracts from cells expressing WT and variant PSMB5 allozymes, and (C) cytotoxicity studies with lymphoblastoid cells expressing WT and variant allozymes. Columns, mean for three independent determinations; bars, SE.
Proteasome inhibitors are used clinically because of their cytotoxic properties; therefore, we also did MG262 cytotoxicity studies with the lymphoblastoid cell lines from which the proteasomes with known PSMB5 genotypes had been isolated. GI50 values calculated from the cytotoxicity data also failed to show significant differences among cells expressing these allozymes (Fig. 2C). All of these functional genomic results indicated that the three nonsynonymous PSMB5 cSNPs did not seem to have significant effects on proteasome enzyme activity, inhibition by MG262, or MG262-induced cytotoxicity. However, a β5 proteasome inhibitor, bortezomib, has been approved by the Food and Drug Administration to treat refractory multiple myeloma. To determine whether there might be additional sequence variation in the PSMB5 gene in patients with multiple myeloma that might influence response to proteasome inhibitor therapy, we also resequenced PSMB5 using 79 DNA samples obtained from 61 patients with multiple myeloma who had been treated with bortezomib. Those samples included both DNA isolated from bone marrow myeloma cells and from peripheral blood.
PSMB5 resequencing using DNA from multiple myeloma patients
The same primers that had been used to amplify PSMB5 from Coriell Institute DNA samples were used to amplify the gene using DNA from multiple myeloma patients. A total of 9 PSMB5 polymorphisms were identified in these 79 DNA samples (Table 1; Fig. 1). When we compared the resequencing results for 11 individuals for whom we had two DNA samples, one from bone marrow myeloma cells and the other isolated from peripheral blood, no differences in PSMB5 sequence were observed between the two sources of DNA. However, we observed novel PSMB5 polymorphisms in these DNA samples, including a 3′-FR 1094 G/A polymorphism and an insertion of GAGAAGGAGAGAGAGGC at nucleotide 1209, also located in the 3′-FR of the gene, neither of which had been identified in the 240 Coriell DNA samples that we had resequenced (Table 1). The 1094 G/A polymorphism was present in one DNA sample extracted from bone marrow myeloma cells, and the nucleotide 1209 insertion was present in peripheral blood DNA obtained from the two patients. Both of these novel polymorphisms were located in an area that shared 73% sequence identity with the mouse gene, indicating that it might be of functional significance. Therefore, we created luciferase reporter gene constructs that contained these two polymorphisms to test their possible effect on the regulation of transcription. We also attempted to determine whether a genotype-phenotype correlation might exist among SNPs in the PSMB5 gene and clinical response to bortezomib therapy of multiple myeloma as the phenotype. However, perhaps because of the relatively small number of samples, no significant associations were observed.
PSMB5 genotype-phenotype correlation for expression
To determine whether any of the SNPs that we had identified in PSMB5 might be associated with the level of gene expression, RNA isolated from the same 240 lymphoblastoid cells from which DNA had been isolated to perform the gene resequencing was used to perform expression array studies using Affymetrix U133 Plus 2.0 GeneChips. PSMB5 expression varied ~2-fold among these 240 cell lines (Fig. 3A). We then correlated PSMB5 genotype in these cells with level of expression using seven SNPs with minor allele frequencies >5% in at least one ethnic group. One SNP at position 1042 in the PSMB5 3′-FR showed a significant correlation with level of expression for all cell lines, with G at that position being associated with elevated expression (Fig. 3B). However, this association was statistically significant only in CA subjects, perhaps because of differences in allele frequencies among ethnic groups, with P = 0.00038 for normalized data adjusted for covariates. The P value for CA subjects remained significant even after correction for multiple comparisons (P = 0.012). The G nucleotide at position 1042 was the WT sequence in the African American population, but G was the variant sequence in the other three populations studied (see Table 1). This polymorphism was located very close to the area of PSMB5 that shares >70% sequence identity with the mouse gene sequence. Therefore, we created luciferase constructs that contained the 1042 SNP as well as the unique 3′-FR polymorphisms identified in the patient samples to test their possible effect on transcription.
Fig. 3.
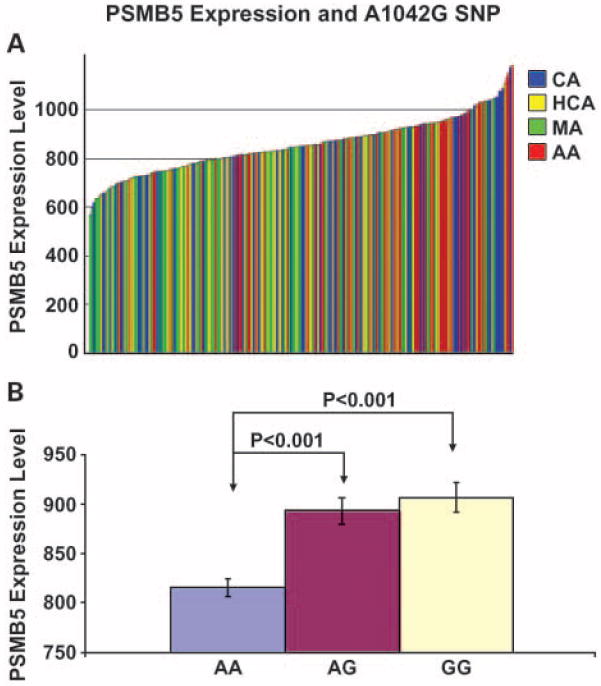
PSMB5 expression and association with the A1042G SNP in 240 lymphoblastoid cell lines A, PSMB5 expression in 240 lymphoblastoid cells. PSMB5 expression was assayed with Affymetrix U133 Plus2 GeneChips. Expression levels were normalized with GCRMA. Columns, individual cell line; colors, ethnic groups. B, PSMB5 A1042G SNP genotypes were correlated with corresponding normalized expression array data for each of the 240 cell lines shown in A. Columns, mean; bars SE.
Luciferase reporter gene assays
Luciferase reporter gene constructs were created; these constructs contained the two novel 3′-FR polymorphisms that we had identified in samples from patients with multiple myeloma as well as the SNP at nucleotide 1042 that was associated with level of mRNA expression in the lymphoblastoid cell lines. WT and these three variant constructs were transiently transfected into HEK293T and COS-1 cells with Renilla luciferase (Promega) as a control for transfection efficiency. Patterns of luciferase activity for variant constructs were very similar in the two cell lines studied (Fig. 4A and B). Luciferase activity was significantly elevated in both cell lines after transfection with the construct containing a G at position 1042 (P < 0.001), consistent with the results of the genotype-phenotype correlation study in the lymphoblastoid cell lines. These results were compatible with the conclusion that the SNP at nucleotide 1042 can influence PSMB5 expression. The two polymorphisms identified in samples from patients with multiple myeloma, 1094A and the insertion at position 1209, showed slightly decreased activity in both cell lines when compared with the WT sequence (Fig. 4A and B); however, those differences were not statistically significant.
Fig. 4.
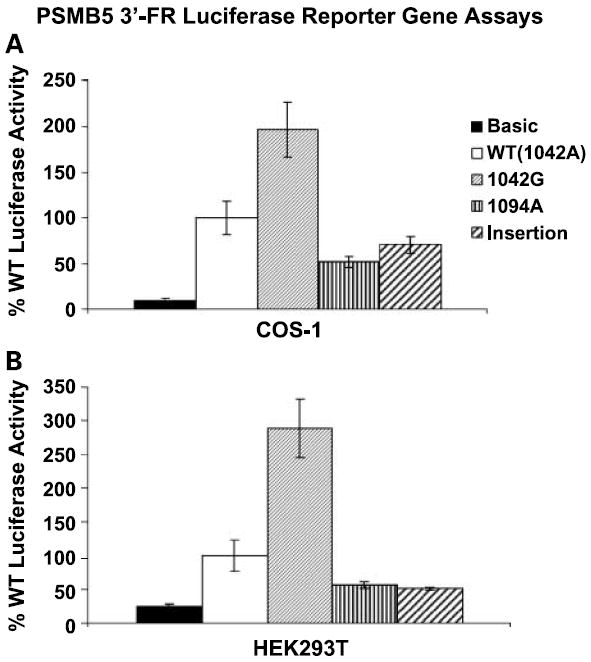
PSMB5 3′-FR luciferase reporter gene studies Reporter gene studies were done with (A) COS-1and (B) HEK293T cells transfected with reporter gene constructs containing WT sequence as well as variant sequence at nucleotides 1042 and 1094 and the insertion at position 1209. Luciferase activity was corrected for Renilla luciferase activity and is expressed as a percent of the WT activity. Columns, mean for three independent experiments; bars, SE.
Discussion
The proteasome plays a major role in the degradation of proteins that regulate critical cellular processes and it is also the target for antineoplastic proteasome inhibitors such as bortezomib (1, 3, 4, 10, 31). Because of the importance of the proteasome and because it is a drug target, we set out to determine whether sequence variation in genes encoding the three active proteasome β subunits might influence proteasome activity or expression. This sequence variation might also contribute to individual variation in disease pathophysiology or response to drug therapy. The proteasome inhibitor bortezomib is used to treat refractory multiple myeloma and non – small cell lung cancer. There are large variations in response to this drug (12-14). For example, only ~35% to 50% of multiple myeloma patients respond to bortezomib therapy (32). Obviously, multiple factors can influence drug response, including genetic factors, age, gender, and environmental factors. In the treatment of cancer, both tumor DNA and germ line DNA are important for explaining variation in response to drug therapy. Therefore, we resequenced the genes encoding the three active proteasome β subunits using DNA samples from four ethnic groups and characterized the functional effects of sequence variation in PSMB5, the gene encoding the β5 subunit, the major clinical target for proteasome inhibitors (10, 31).
We identified a series of SNPs in genes encoding the three active proteasome β subunits (Table 1), and the majority of these SNPs were not available in any public database. The β5 subunit of the proteasome has chymotryptic-like protease activity, and this subunit is the target for clinical proteasome inhibitors such as bortezomib (9, 10, 13, 31, 33). Therefore, we focused our functional genomic studies, including activity assays, inhibition studies, and cytotoxicity studies done with the specific proteasome inhibitor, MG262, on three non-synonymous cSNPs in the PSMB5 gene (Fig. 2A-C). All of these results were compatible with the conclusion that these non-synonymous cSNPs in PSMB5 did not significantly affect proteasome function. Obviously, we cannot rule out the possibility that these polymorphisms might alter the proteolysis of specific substrates, including endogenous substrates, or the response to inhibitors other than MG262. However, genetic polymorphisms can also influence transcription, RNA splicing, and mRNA stability. Therefore, we next turned our attention to transcription. Specifically, we did genotype-phenotype correlation analyses using expression array data (Fig. 3A) and our PSMB5 gene resequencing data for all 240 lymphoblastoid cell lines. That study identified one SNP, a polymorphic nucleotide at position 1042 in the 3′-FR of PSMB5 (near a region conserved in the mouse) that was significantly associated with level of expression in the lymphoblastoid cell lines (Fig. 3B). These genotype-phenotype association results were supported by data from reporter gene assays (Fig. 4).
Finally, because patients with refractory multiple myeloma are treated with bortezomib (13, 33), we also resequenced PSMB5 using 79 DNA samples from both tumor cells and peripheral blood obtained from patients with multiple myeloma who had been treated with this drug. We were not able to detect significant associations between SNPs in PSMB5 and response to bortezomib therapy in this group of patients, although these results must be viewed as preliminary because of the relatively small number of samples studied and the heterogeneous nature of this disease. However, resequencing of these 79 patient DNA samples resulted in the identification of two additional novel PSMB5 polymorphisms, both located in the 3′-FR of the gene in the same conserved region where the functionally significant 1042 SNP was located. Therefore, we created luciferase reporter gene constructs to test the possible implications for transcription of these two novel polymorphisms together with the nucleotide 1042 SNP. As anticipated on the basis of the genotype-phenotype correlation analysis done with the lymphoblastoid cell lines, a G at nucleotide 1042 significantly increased luciferase activity (Fig. 4). Although the 1094 SNP and the insertion at nucleotide 1209 that we had identified by resequencing DNA samples from the patients showed slightly decreased luciferase activity when compared with the WT sequence, those differences were not statistically significant (Fig. 4).
In summary, we have done a comprehensive series of studies of the pharmacogenomics of genes encoding the three active proteasome subunits. Those experiments resulted in the identification of a large number of novel SNPs and haplotypes in both control subjects and patients with multiple myeloma that were not represented in the HapMap or other public databases. Functional characterization of nonsynonymous cSNPs and SNPs in the 3′-FR of the PSMB5 gene showed that the common nucleotide 1042 SNP in the 3′-FR of the gene significantly increased transcription, confirming the results of genotype-phenotype correlation studies between SNPs and PSMB5 expression in 240 lymphoblastoid cell lines. These results significantly increase our knowledge of common genetic variation in these important genes and represent a step toward future translational pharmacogenomic studies of patients treated with proteasome inhibitors.
Supplementary Material
Acknowledgments
We thank Luanne Wussow for her assistance with the preparation of the manuscript.
The PSMB1, PSMB2, and PSMB5 gene sequence data reported in this article have been deposited in the NIH-supported database PharmGKB with accession numbers PS205879, PS205881, and PS205880.
Grant support: NIH grants GM61388 (The Pharmacogenetics Research Network) and CA102701 (The Pancreatic Cancer Specialized Programs of Research Excellence), an American Society for Pharmacology and Experimental Therapeutics-Astellas Award, and a PhRMA Foundation Center of Excellence in Clinical PharmacologyAward.
Footnotes
Disclosure of Potential Conflicts of Interest No potential conflicts of interest were disclosed.
Note: Supplementary data for this article are available at Clinical Cancer Research Online (http://clincancerres.aacrjournals.org/).
References
- 1.Adams J. The proteasome: structure, function, and role in the cell. CancerTreat Rev. 2003;29(Suppl 1):3–9. doi: 10.1016/s0305-7372(03)00081-1. [DOI] [PubMed] [Google Scholar]
- 2.Hendrick PW. Genetics of populations. 2. Sudbury (MA): Jones and Bartlett Publ.; 2000. pp. 396–405. [Google Scholar]
- 3.Mani A, Gelmann EP. The ubiquitin-proteasome pathway and its role in cancer. J Clin Oncol. 2005;23:4776–89. doi: 10.1200/JCO.2005.05.081. [DOI] [PubMed] [Google Scholar]
- 4.Matthews W, Driscoll J, Tanaka K, Ichihara A, Goldberg AL. Involvement of the proteasome in various degradative processes in mammalian cells. Proc Natl Acad Sci U S A. 1989;86:2597–601. doi: 10.1073/pnas.86.8.2597. [DOI] [PMC free article] [PubMed] [Google Scholar]
- 5.Glickman MH, Ciechanover A. The ubiquitin-proteasome proteolytic pathway: destruction for the sake of construction. Physiol Rev. 2002;82:373–428. doi: 10.1152/physrev.00027.2001. [DOI] [PubMed] [Google Scholar]
- 6.Coux O, Tanaka K, Goldberg AL. Structure and functions of the 20S and 26S proteasomes. Annu Rev Biochem. 1996;65:801–47. doi: 10.1146/annurev.bi.65.070196.004101. [DOI] [PubMed] [Google Scholar]
- 7.Groll M, Ditzel L, Lowe J, et al. Structure of 20S proteasome from yeast at 2.4 A resolution. Nature. 1997;386:463–71. doi: 10.1038/386463a0. [DOI] [PubMed] [Google Scholar]
- 8.Groll M, Bajorek M, Kohler A, et al. A gated channel into the proteasome core particle. Nat Struct Biol. 2000;7:1062–7. doi: 10.1038/80992. [DOI] [PubMed] [Google Scholar]
- 9.Heinemeyer W, Fischer M, Krimmer T, Stachon U, Wolf DH. The active sites of the eukaryotic 20 S proteasome and their involvement in subunit precursor processing. J Biol Chem. 1997;272:25200–9. doi: 10.1074/jbc.272.40.25200. [DOI] [PubMed] [Google Scholar]
- 10.Adams J. The development of proteasome inhibitors as anticancer drugs. Cancer Cell. 2004;5:417–21. doi: 10.1016/s1535-6108(04)00120-5. [DOI] [PubMed] [Google Scholar]
- 11.Ahmad K. Proteasome inhibitor for treatment of multiple myeloma. Lancet Oncol. 2005;6:546. doi: 10.1016/s1470-2045(05)70264-3. [DOI] [PubMed] [Google Scholar]
- 12.Richardson PG, Barlogie B, Berenson J, et al. A phase 2 study of bortezomib in relapsed, refractory myeloma. N Engl J Med. 2003;348:2609–17. doi: 10.1056/NEJMoa030288. [DOI] [PubMed] [Google Scholar]
- 13.Jagannath S, Barlogie B, Berenson J, et al. A phase 2 study of two doses of bortezomib in relapsed or refractory myeloma. Br J Haematol. 2004;127:165–72. doi: 10.1111/j.1365-2141.2004.05188.x. [DOI] [PubMed] [Google Scholar]
- 14.Richardson PG, Sonneveld P, Schuster MW, et al. Bortezomib or high-dose dexamethasone for relapsed multiple myeloma. N Engl J Med. 2005;352:2487–98. doi: 10.1056/NEJMoa043445. [DOI] [PubMed] [Google Scholar]
- 15.Ji Y, Salavaggione OE, Wang L, et al. Human phenylethanolamine N-methyltransferase pharmacogenomics: gene resequencing and functional genomics. J Neurochem. 2005;95:1766–76. doi: 10.1111/j.1471-4159.2005.03453.x. [DOI] [PubMed] [Google Scholar]
- 16.Ma CX, Adjei AA, Salavaggione OE, et al. Human aromatase: gene resequencing and functional genomics. Cancer Res. 2005;65:11071–82. doi: 10.1158/0008-5472.CAN-05-1218. [DOI] [PubMed] [Google Scholar]
- 17.Martin YN, Salavaggione OE, Eckloff BW, Wieben ED, Schaid DJ, Weinshilboum RM. Human methylenetetrahydrofolate reductase pharmacogenomics: gene resequencing and functional genomics. Pharmacogenet Genomics. 2006;16:265–77. doi: 10.1097/01.fpc.0000194423.20393.08. [DOI] [PubMed] [Google Scholar]
- 18.Mukherjee B, Salavaggione OE, Pelleymounter LL, et al. Glutathione S-transferase ω1and ω2 pharmacogenomics. Drug Met Dispos. 2006;34:1237–46. doi: 10.1124/dmd.106.009613. [DOI] [PubMed] [Google Scholar]
- 19.Wang L, Salavaggione E, Pelleymounter L, Eckloff B, Wieben E, Weinshilboum R. Human 3β-hydroxysteroid dehydrogenase types1and 2: gene sequence variation and functional genomics. J Steroid Biochem Mol Biol. 2007;107:88–99. doi: 10.1016/j.jsbmb.2007.03.037. [DOI] [PMC free article] [PubMed] [Google Scholar]
- 20.Wood TC, Salavagionne OE, Mukherjee B, et al. Human arsenic methyltransferase (AS3MT) pharmacogenetics: gene resequencing and functional genomics studies. J Biol Chem. 2006;281:7364–73. doi: 10.1074/jbc.M512227200. [DOI] [PubMed] [Google Scholar]
- 21.Deshaies RJ. Methods in enzymology ubiquitin and protein degradation, part A. San Diego, CA: Elsevier; 2005. pp. 364–78. [Google Scholar]
- 22.Wu Z, Irizarry RA, Gentleman R, Martinez-Murillo F, Spencer F. A model-based background adjustment for oligonucleotide expression arrays. J Am Stat Assoc. 2004;99:909. [Google Scholar]
- 23.Wang L, Thomae B, Eckloff B, Wieben E, Weinshilboum R. Human histamine N-methyltransferase pharmacogenetics: gene resequencing, promoter characterization, and functional studies of a common 5′-flanking region single nucleotide polymorphism (SNP) Biochem Pharmacol. 2002;64:699–710. doi: 10.1016/s0006-2952(02)01223-6. [DOI] [PubMed] [Google Scholar]
- 24.Hartl DL, Clark AG. Organization of genetic variation Principles of population genetics. 3. Chapter 3. Sunderland (MA): Sinauer Associates, Inc.; 2000. pp. 95–107. [Google Scholar]
- 25.Schaid DJ, Rowland CM, Tines DE, Jacobson RM, Poland GA. Score tests for association between traits and haplotypes when linkage phase is ambiguous. Am J Hum Genet. 2002;70:425–34. doi: 10.1086/338688. [DOI] [PMC free article] [PubMed] [Google Scholar]
- 26.Fullerton SM, Clark AG, Weiss KM, et al. Apolipoprotein E variation at the sequence haplotype level: implications for the origin and maintenance of a major human polymorphism. Am J Hum Genet. 2000;67:881–900. doi: 10.1086/303070. [DOI] [PMC free article] [PubMed] [Google Scholar]
- 27.Kaessmann H, Heissig F, von Haeseler A, Paabo S. DNA sequence variation in a non-coding region of low recombination on the human X chromosome. Nat Genet. 1999;22:78–81. doi: 10.1038/8785. [DOI] [PubMed] [Google Scholar]
- 28.Tajima F. Statistical method for testing the neutral mutation hypothesis by DNA polymorphism. Genetics. 1989;123:585–95. doi: 10.1093/genetics/123.3.585. [DOI] [PMC free article] [PubMed] [Google Scholar]
- 29.Brodde OE, Leineweber K. β2-adrenoceptor gene polymorphisms. Pharmacogenet Genomics. 2005;15:267–75. doi: 10.1097/01213011-200505000-00001. [DOI] [PubMed] [Google Scholar]
- 30.Kisselev AF, Goldberg AL. Proteasome inhibitors: from research tools to drug candidates. Chem Biol. 2001;8:739–58. doi: 10.1016/s1074-5521(01)00056-4. [DOI] [PubMed] [Google Scholar]
- 31.Adams J. Proteasome inhibition in cancer: development of PS-341. Semin Oncol. 2001;28:613–9. doi: 10.1016/s0093-7754(01)90034-x. [DOI] [PubMed] [Google Scholar]
- 32.Richardson PG, Mitsiades C, Hideshima T, Anderson KC. Bortezomib: proteasome inhibition as an effective anticancer therapy. Annu Rev Med. 2006;57:33–47. doi: 10.1146/annurev.med.57.042905.122625. [DOI] [PubMed] [Google Scholar]
- 33.Hideshima T, Chauhan D, Podar K, Schlossman RL, Richardson P, Anderson KC. Novel therapies targeting the myeloma cell and its bone marrow microenvironment. Semin Oncol. 2001;28:607–12. doi: 10.1016/s0093-7754(01)90033-8. [DOI] [PubMed] [Google Scholar]
Associated Data
This section collects any data citations, data availability statements, or supplementary materials included in this article.