

Abstract
Context
Fetuin-A is a hepatic secretory protein that binds the insulin receptor in muscle and fat and inhibits insulin action, in vitro. In prior cross-sectional studies in humans, higher fetuin-A was associated with insulin resistance. However, the longitudinal association of fetuin-A with incident diabetes mellitus is unknown.
Objective
To determine whether fetuin-A levels are associated with incident diabetes in older persons
Design, Setting, and Participants
Observational study among 3,075 well-functioning persons aged 70 to 79 years. In this case-cohort study, we retrospectively measured fetuin-A in baseline serum among 406 randomly selected participants without prevalent diabetes, and all participants who developed incident diabetes during 6-years of follow-up.
Main Outcome Measure
Incident diabetes mellitus.
Results
Incident diabetes developed in 135 participants (10.1 cases/1,000 person-years) over 6-years. Participants with fetuin-A levels within the highest tertile (>0.97 g/L) had more than two times higher risk of incident diabetes (adjusted Hazard Ratio [HR] 2.41; 95% Confidence Interval [CI] 1.28–4.53; P<0.01) compared to subjects in the lowest tertile (≤0.76 g/L) in models adjusted for age, sex, race, waist circumference, body weight, physical activity, blood pressure, fasting glucose, HDL cholesterol, triglycerides, and CRP levels. The association was not affected by adipocytokine levels, but was moderately attenuated by adjustment for visceral adiposity (adjusted HR of highest vs. lowest tertile 1.72; 95% CI 0.98–3.05; P=0.06).
Conclusions
Among well functioning older persons, serum fetuin-A is a novel risk factor for incident diabetes that is independent of markers of insulin resistance commonly available in clinical practice, and may be partially mediated through visceral adiposity.
INTRODUCTION
Diabetes mellitus type 2 has become a global epidemic, and the increased prevalence of obesity(1) is a major contributing factor.(2–4) However, diabetes does not develop in all obese individuals, and there is a strong genetic contribution to risk.(5) Despite significant recent advances,(6) mechanisms responsible for individual differences in clinical phenotype remain largely unknown. Recent research has identified proteins secreted from adipose tissue that regulate glucose metabolism, termed adipocytokines.(7–9) Study of these proteins have provided new insights to the biology of glucose regulation, and may also lead to identification of novel candidate therapeutic targets.
In contrast to adipocytokines, fetuin-A (also called Alpha-2 Heremans Schmid Glycoprotein [AHSG]) is a produced in hepatocytes and secreted into serum, where it is found in high concentrations.(10) In vitro, fetuin-A reversibly binds the insulin receptor tyrosine kinase in muscle and fat and decreases down-stream signal cascades, resulting in insulin resistance in these target tissues.(11–14) In cross-sectional studies in humans, higher fetuin-A levels were associated with insulin resistance.(15–17) However, to our knowledge, the temporal relationship of fetuin-A levels with incident diabetes has not been evaluated.
In the present study, we measured serum fetuin-A levels in serum obtained at the baseline visit among participants in the Health, Aging, and Body Composition (Health ABC) study who were free of diabetes. Participants were followed longitudinally for the occurrence of incident diabetes. We hypothesized that higher fetuin-A levels would be associated with incident diabetes, and that the associations would be independent of previously recognized diabetes risk factors that are commonly ascertained in clinical practice.
METHODS
Participants
At the baseline study visit (April 1997 to June 1998), Health ABC enrolled 3,075 well-functioning men and women aged 70–79 years, recruited from a sample of Medicare beneficiaries at two clinical sites (Pittsburgh, PA, and Memphis TN). To be eligible, participants reported no difficulty in walking a quarter mile, climbing 10 steps, or performing basic activities of daily living. Venous blood samples were obtained after overnight (8-hour) fasts, and stored at −70° Celsius. Participants underwent a day-long evaluation that included medical history, physical activity assessment, physical examination, and radiographic tests. All participants provided written informed consent, and the study was approved by the institutional review boards at the University of Pittsburgh and the University of Tennessee Health Sciences Center, Memphis. In addition, the present study was approval for this study from the Human Research Protection Program at the University of California San Diego.
Selection of Sub - Cohort Participants and Incident Diabetes Cases
We utilized a case-cohort study design for this study.(18) Preliminary data in a separate cohort of similar age demonstrated that persons with prevalent diabetes had fetuin-A levels were 0.04 g/L higher on average, compared to persons without diabetes (28% standardized effect size).(17) Assuming a similar strength of association for incident diabetes, and knowing a priori that 135 incident diabetes cases accrued during follow-up in the Health ABC cohort, we calculated that we required a sub-cohort of approximately 384 subjects without prevalent diabetes to provide 80% power with a two-sided α = 0.05. Because the 19% of Health ABC participants had prevalent diabetes at baseline, we took a random sample of 500 subjects, assuming that approximately 100 (20%) would be excluded due to prevalent disease, thereby conservatively providing the required number of non-diabetic sub-cohort participants required for comparison.
Thus, we randomly selected 500 subjects from the parent Health ABC study, stratified equally in four sex and race strata (Figure 1). Random numbers were generated on a continuous standard uniform distribution U(0,1) and were assigned to each participant within each of the 4 race/sex strata. The participants were then sorted in ascending order by that assigned random number. 125 participants were chosen in order from each stratum until we reached the total sub-cohort sample size of 500. In the ultimate sample, 94 subjects (19%) had prevalent diabetes at baseline, defined as any one or more of the following: (1) self-report of diabetes diagnosis, (2) use of hypoglycemic medications, (3) fasting glucose level ≥ 126 mg/dL, or (4) 2-hour post-challenge plasma glucose level ≥ 200 mg/dL. These subjects were excluded and the resulting sample of 406 participants constituted the sub-cohort for this study. All Health ABC participants were contacted by telephone every 6 months and attended annual clinic visits in which they reported interval diagnosis of diabetes. Medication use was recorded at each annual visit. Fasting blood samples were obtained for glucose measurement at the second, fourth, and sixth annual visits. Incident diabetes was defined by new diabetes diagnosis between baseline and study close-out (August 31, 2005), defined by self report, new use of diabetes medications, or a fasting glucose level ≥ 126 mg/dL. Any subject who was free of diabetes at baseline and developed incident diabetes during follow-up represented a case for this study (Figure 1). Cases could arise from either from the randomly selected sub-cohort or among the remainder of the Health ABC study participants as per typical case-cohort study design.(18) We observed 135 cases of incident diabetes over the 6-year observation period (incidence rate 10.1 per 1,000 person years). Among these, 22 (17 %) were already sampled within the sub-cohort. Therefore, the total study sample for this analysis consisted of 519 individuals.
Figure 1.
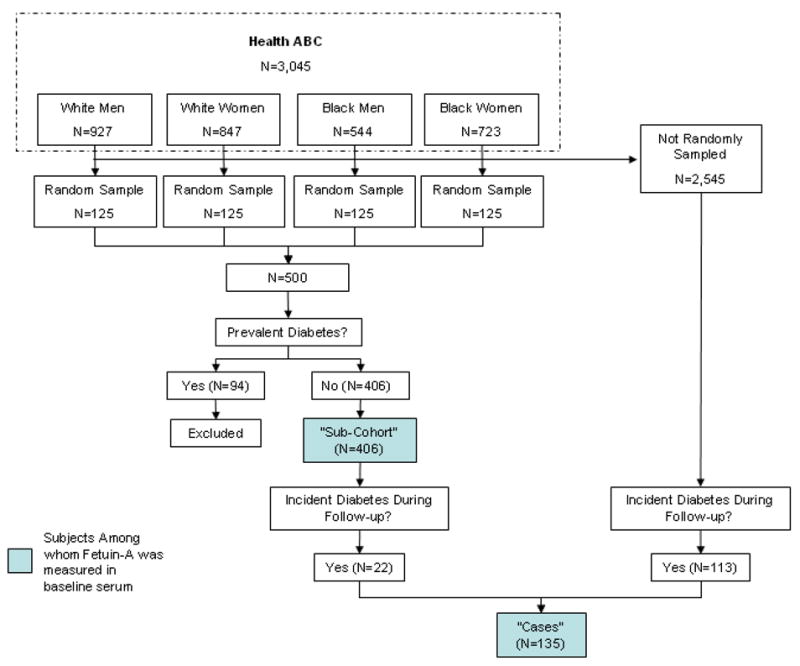
Case Cohort Study Design
Measurements
Fetuin-A
Fetuin-A was measured in baseline serum among the 519 participants selected for this study in 2007 (7–9 years later) using a human fetuin-A enzyme linked immunosorbent assay (ELISA) kit (Epitope Diagnositics, San Deigo, CA). The assay uses a two-site “sandwich” technique with two polyclonal antibodies that bind to different epitopes of human fetuin-A. Measurements were performed at the Laboratory for Clinical Biochemistry Research (LCBR) at the University of Vermont. Fetuin-A was measured twice in the same sample among each participant and results were averaged. Intra-assay and inter-assay coefficients of variation were < 5%. Among a 5% blind duplicate assessment at the LCBR, the intra-individual CVs ranged from 13.5 % and 20%.
Other Measurements
Age, sex, and race were determined by self-report. Physical activity was assessed using self-report of walking and exercise, and assigned kilocalories per week to activities. Height and weight were measured wearing light clothes and no shoes, and body mass index was calculated (kg/m2). Waist circumference was measured using a flexible tape on bare skin at the level of maximal circumference midway between the lower ribs and anterior superior iliac spine. Regional adiposity was measured by computed tomography (CT) using the Somatom Plus 4 (Seimens, Erlanger, Germany) Picker PQ 2000S (Marconi Medical Systems, Cleveland, OH), or 9800 Advantage (General Electric, Milwaukee, WI) scanners and standardized protocols. Visceral and subcutaneous adiposity were measured at the mid-point between the 4th to 5th lumbar vertebrae with participants in the supine position. Fat area was calculated by multiplying the number of pixels of fat tissue by pixel area using interactive data language development software (RSI, Boulder, CO). Visceral adiposity was planimetrically distinguished from subcutaneous adiposity using the internal abdominal wall fascial plane. Seated systolic and diastolic blood pressures were measured using manual sphygmomanometers by trained study personnel. Fasting and 2-hour post-challenge plasma glucose levels were determined by an automated glucose oxidase reaction (YSI 2300 glucose analyzer; Yellow Springs Instruments, Yellow Springs, OH). High density lipoprotein and triglyceride concentrations were measured using a Vitros 950 analyzer (Johnson & Johnson, New Brunswick, NJ). High sensitivity CRP was measured by ELISA (Calbiochem, San Diego, CA) and was standardized to the World Health Organization’s First International Reference Standard. IL-6 was measured with the HS600 Quantikine kit and the HSTA50 kit was used to measure TNFα. Reliability, determined by blind duplicates revealed average coefficients of variation of 8.0%, 10.3% and 15.8%, respectively. Adiponectin and leptin were measured in duplicate by radioimmunoassay (Linco Research Inc., St. Charles, MO) with intra-assay coefficients of variation < 3.6% and < 7.5%, respectively. Plasminogen activator inhibitor-1 (PAI-1) was measured by two-site ELISA according to previously published methods,(19) and had a coefficients of variation < 3.5%. Creatinine was measured by colorimetry (Johnson & Johnson, New Brunswick, NJ) and estimated glomerular filtration rate (eGFR) was calculated by the four variable Modification of Diet in Renal Disease (MDRD) equation.(20)
Statistical Analyses
Because age, sex, and race-specific normal ranges of fetuin-A are unknown, and because the distribution of fetuin-A was positively skewed, we elected to categorize subjects into tertiles, based on the distribution of fetuin-A in the sub-cohort. Baseline differences in demographic and clinical variables were compared across fetuin-A tertiles by analysis of variance (ANOVA) or the Kruskal-Wallis test for continuous variables, and the Chi-Square test or Fisher’s Exact test for categorical variables.
To accommodate the stratified sampling design, diabetes incidence rates were estimated using all incident cases in the Health ABC cohort; to estimate the corresponding person-years at risk, we weighted follow-up times for the sub-cohort by the inverse of their probabilities of selection, which were known exactly and differed slightly by sex and race. The association of fetuin-A with incident diabetes was evaluated by a modified Cox regression that accounted for of the case-cohort sampling design.(21, 22) Cases that came from within the sub-cohort served as controls (weight close to 0) before their individual failures, and as cases (weight = 1) thereafter. Jackknife estimates of variance were employed, which are equivalent to robust variance estimators from standard Cox models.(23) Initial models were stratified on gender and race, and age adjusted. Subsequent models were adjusted for measures of insulin resistance that are commonly available in clinical practice (age, gender, race, physical activity, systolic and diastolic blood pressure, fasting glucose, waist circumference, body weight, HDL cholesterol, triglycerides, and CRP levels). Subsequent models evaluated candidate mediators of the observed association, which were selected a priori (visceral adiposity, PAI-1, adiponectin, leptin, TNFα, and IL-6). Multiplicative interaction terms were created to determine whether the association was similar by race, gender, and obesity status (BMI ≥ 30kg/m2).(24) Proportional hazards assumptions were evaluated by formal hypothesis testing and by visual inspection of log-minus-log plots and Schoenfeld residuals versus survival time. No violations were observed. Two-tailed P-values < 0.05 were considered statistically significant. Analyses were performed with SAS V 9.1 (SAS Institute, Cary, NC) and SPlus V 6.1 (Insightful Corp, Seattle, WA).
RESULTS
Among the 406 participant randomly selected sub-cohort without diabetes, the mean age was 73 years. The sample was 50% female and black, reflecting stratified sampling. The mean BMI was 27 kg/m2. The distribution of fetuin-A was positively skewed (Figure 2), with a median of 0.87 g/L (interquartile range [IQR] 0.71 – 1.04g/L). When compared to persons with fetuin-A levels among the lowest third of the sub-cohort, persons with higher fetuin-A levels were more often white, had higher serum triglyceride levels, and had more visceral adiposity. Other measures of body composition, blood pressure, lipid parameters and adipocytokine levels were similar across tertile groups. Bivariate associations were similar among subjects who developed incident diabetes during follow-up (Table 1).
Figure 2.

Distribution of Fetuin-A among a Random Sample of Health ABC Participants (N=406)
Table 1.
Baseline Measures by Fetuin-A Tertiles Among Sub-Cohort Participants and Incident Diabetes Cases
| Random Sub-Cohort |
Incident Diabetes Cases |
|||||||
|---|---|---|---|---|---|---|---|---|
| Fetuin-A Tertiles | Low | Middle | High | P-value | Low | Middle | High | P-value |
| Number of Participants | 134 | 138 | 134 | 23 | 37 | 52 | ||
| Fetuin-A Range (g/L) | ≤0.76 | 0.77 – 0.97 | > 0.97 | ≤0.76 | 0.77 – 0.97 | > 0.97 | ||
| Demographics | ||||||||
| Age (years) ± SD | 73 ± 3 | 74 ± 3 | 74 ± 3 | 0.33 | 73 ± 3 | 73 ± 3 | 73 ± 3 | 0.35 |
| Female (%) | 64 (48) | 64 (46) | 73 (55) | 0.36 | 14 (61) | 21 (57) | 26 (50) | 0.65 |
| Black (%) | 80 (60) | 68 (49) | 55 (41) | < 0.01 | 14 (61) | 21 (57) | 18 (35) | 0.04 |
| Measurements | ||||||||
| Physical activity (kcal/week) ± SD* | 1043 ± 1446 | 1279 ± 2084 | 964 ± 1750 | 0.30 | 752 ± 1081 | 1234 ± 1738 | 840 ± 991 | 0.39 |
| Body weight (kg) ± SD | 73 ± 14 | 76 ± 14 | 75 ± 15 | 0.36 | 81 ± 14 | 84 ± 15 | 83 ± 16 | 0.12 |
| Waist circumference (cm) ± SD | 96 ± 13 | 98 ± 13 | 99 ± 12 | 0.21 | 102 ± 12 | 107 ± 12 | 106 ± 12 | 0.03 |
| Body mass index (kg/m2) ± SD | 27 ± 5 | 27 ± 5 | 27 ± 5 | 0.52 | 30 ± 5 | 30 ± 4 | 30 ± 5 | 0.25 |
| Visceral adiposity (cm2) ± SD | 114 ± 53 | 134 ± 58 | 136 ± 57 | < 0.01 | 161 ± 60 | 175 ± 61 | 179 ± 68 | <0.001 |
| Subcutaneous adiposity (cm2) ± SD | 269 ± 126 | 280 ± 118 | 290 ± 125 | 0.41 | 328 ± 118 | 346 ± 123 | 330 ± 126 | 0.25 |
| Systolic blood pressure (mmHg) ± SD | 136 ± 22 | 136 ± 23 | 136 ± 23 | 0.98 | 137 ± 20 | 139 ± 22 | 135 ± 18 | 0.99 |
| Diastolic blood pressure (mmHg) ± SD | 72 ± 14 | 73 ± 12 | 72 ± 12 | 0.69 | 76 ± 8 | 72 ± 14 | 71 ± 11 | 0.81 |
| Fasting Glucose (mg/dL) ± SD* | 93 ± 10 | 92 ± 10 | 92 ± 10 | 0.77 | 99 ± 10 | 107 ± 26 | 104 ± 16 | 0.63 |
| 2-Hour post challenge glucose (mg/dL) ± SD* | 116 ± 29 | 122 ± 32 | 122 ± 31 | 0.28 | 146 ± 29 | 145 ± 33 | 148 ± 31 | 0.07 |
| HDL cholesterol (mg/dL) ± SD* | 57 ± 18 | 57 ± 17 | 55 ± 17 | 0.43 | 53 ± 17 | 49 ± 11 | 50 ± 15 | 0.18 |
| Triglycerides (mg/dL) ± SD* | 110 ± 45 | 124 ± 67 | 135 ± 65 | < 0.01 | 144 ± 76 | 149 ± 74 | 160 ± 95 | <0.001 |
| C-reactive protein (mg/dL) ± SD* | 2.7 ± 3.8 | 2.5 ± 2.7 | 2.1 ± 2.8 | 0.10 | 3.9 ± 5.4 | 3.6 ± 4.2 | 3.5 ± 7.4 | 0.17 |
| Interleukin-6 (pg/mL) ± SD* | 2.4 ± 2.0 | 2.4 ± 2.0 | 2.2 ± 1.6 | 0.36 | 2.0 ± 0.9 | 2.4 ± 1.6 | 2.2 ± 1.3 | 0.92 |
| Tumor necrosis factor α (pg/mL) ± SD* | 3.2 ± 1.5 | 3.5 ± 2.1 | 3.3 ± 1.3 | 0.11 | 3.2 ± 1.0 | 3.8 ± 2.7 | 3.3 ± 1.3 | 0.13 |
| Adiponectin (ug/mL) ± SD* | 12 ± 6 | 12 ± 7 | 12 ± 6 | 0.93 | 9 ± 5 | 9 ± 4 | 10 ± 5 | 0.93 |
| Leptin (ng/mL) ± SD* | 14 ± 13 | 15 ± 14 | 16 ± 15 | 0.68 | 21 ± 16 | 26 ± 19 | 16 ± 11 | 0.66 |
| Plasminogen activator inhibitor-1 (ng/mL) ± SD* | 25 ± 25 | 25 ± 18 | 27 ± 20 | 0.20 | 32 ± 21 | 39 ± 23 | 39 ± 32 | 0.07 |
| Estimated GFR (ml/min/1.73m2) ± SD | 75 ± 16 | 74 ± 15 | 73 ± 16 | 0.55 | 73 ± 12 | 71 ± 22 | 70 ± 14 | 0.22 |
p-values obtained after natural log transformation
Values represent n (%) or mean ± SD
Between baseline and the end of the study, 60 of the 406 sub-cohort participants died. Fetuin-A levels did not differ significantly between survivors and non-survivors (mean levels 0.93 ± 0.40 and 0.96 ± 0.38, respectively. P = 0.56). Follow-up data were available for > 98% of the remaining participants, and only 1 % of visits were missed each year.
Among survivors, we observed 135 cases of incident diabetes (10.1 cases per 1,000 person-years). Of these, 71 (53%) were due to a fasting glucose ≥ 126 mg/dL, 22 (16%) were due to new use of anti-diabetic medication, and 42 (31%) were due to self-reported new physician’s diagnosis. We observed a graded increase in the incidence of diabetes with increased fetuin-A levels (Table 2). Participants within the highest tertile had more than twice the incidence rate compared to the lowest tertile in unadjusted analysis (13.3 vs. 6.5 per 1,000 person-years, P < 0.01). We observed minimal change in this estimate after adjustment for demographics and other clinical predictors. Results were similar when BMI replaced waist circumference and body weight as covariates in the model. Results were also similar within men and women, blacks and whites, and among persons with or without obesity (P-values for interaction all > 0.27).
Table 2.
Association of Fetuin-A Tertiles with Incident Diabetes Among Older Persons
| Tertile 1 |
Tertile 2 |
Tertile 3 |
||
|---|---|---|---|---|
| HR; (95% CI);P-value | HR; (95% CI);P-value | HR; (95% CI);P-value | P for Trend | |
| Fetuin-A Range (g/L) | ≤0.76 | 0.77 – 0.97 | > 0.97 | |
| Number of Incident Diabetes Events | 28 | 47 | 60 | |
| Incidence Rates (per 1,000 person years) | 6.5 | 10.3 | 13.3 | |
| Unadjusted | Reference | 1.60; (0.94–2.73); 0.08 | 2.19; (1.31–3.65); < 0.01 | < 0.01 |
| Demographic Adjusted * | Reference | 1.64; (0.96–2.80); 0.07 | 2.23; (1.34–3.73); < 0.01 | < 0.01 |
| Multivariable Adjusted † | Reference | 1.82; (0.94–3.53); 0.07 | 2.41; (1.28–4.53); < 0.01 | < 0.01 |
Adjusted for age, sex, and race.
Adjusted for demographic variables, waist circumference, body weight, physical activity score, systolic and diastolic blood pressure, fasting glucose, triglycerides, HDL cholesterol, and CRP.
In additional analysis, candidate mediators were added individually to the model to determine if they attenuated the association of fetuin-A with incident diabetes. We observed no significant attenuation on the basis of available measures of adipocytokines, but observed moderate attenuation by visceral adiposity, which diminished the association by roughly one third. Whereas the point estimate for hazards among the highest tertile remained 1.7 fold higher than the lowest tertile, and the association was no longer statistically significant (P=0.06) with adjustment for visceral adiposity (Table 3).
Table 3.
Evaluation of Candidate Mediators of the Association of Fetuin-A with Incident Diabetes
| Tertile 1 |
Tertile 2 |
Tertile 3 |
||
|---|---|---|---|---|
| HR; (95% CI); P-value | HR; (95% CI); P-value | HR; (95% CI); P-value | P for Trend | |
| Fetuin-A Range (g/L) | ≤0.76 | 0.77 – 0.97 | > 0.97 | |
| Unadjusted | Reference | 1.60; (0.94–2.73); 0.08 | 2.19; (1.31–3.65); < 0.01 | < 0.01 |
| Demographic Adjusted * | Reference | 1.64; (0.96–2.80); 0.07 | 2.23; (1.34–3.73); < 0.01 | < 0.01 |
| Demographic Adjusted * + Visceral Adiposity | Reference | 1.32; (0.73–2.36); 0.36 | 1.72; (0.98–3.05); 0.06 | 0.05 |
| Demographic Adjusted* + PAI-1, Adiponectin, and Leptin | Reference | 1.71; (0.95–3.10); 0.08 | 1.94; (1.09–3.45); 0.03 | 0.02 |
| Demographic Adjusted* + TNFα + IL-6 | Reference | 1.61; (0.90–2.89); 0.11 | 2.38; (1.37–4.15); < 0.01 | < 0.01 |
| Fully Adjusted for All Candidate Mediators † | Reference | 1.83; (0.80–4.17); 0.15 | 2.44; (1.14–5.22); 0.02 | 0.02 |
Adjusted for age, sex, and race.
Adjusted for age, sex, race, visceral adiposity, PAI-1, adiponectin, leptin, TNFα, and IL-6
DISCUSSION
In this study, we make the novel observation that higher serum fetuin-A levels are associated with incident diabetes mellitus in humans. The association was independent of physical activity, inflammatory biomarkers, and other commonly available measures of insulin resistance, and was similar irrespective of sex, race, and obesity status. Approximately one third of this association appeared to be mediated by the quantity of visceral adiposity. Yet, fetuin-A remained associated with a 1.7 fold risk of diabetes after adjustment for visceral adiposity, an association that was not statistically significant (P=0.06).
In 1989, fetuin-A was reported as an endogenous inhibitor of insulin receptors, through binding insulin receptor tyrosine kinase in adipocytes and skeletal muscle, resulting in decreased rates of auto-phosphorylation and down-stream insulin signaling cascades.(11, 12) This function was conserved across all species homologs evaluated to date in vitro(25–28) and has been confirmed in vivo in rats.(28) The human fetuin-A gene resides on chromosome 3q27, previously identified as a metabolic syndrome and diabetes susceptibility locus.(29, 30) Fetuin-A knock-out mice are insulin sensitive, are resistant to weight gain, have less adiposity, lower free fatty acid and lower triglyceride levels compared to wild-type controls.(13, 14) We(17) and others(15, 16) have previously demonstrated that higher fetuin-A levels are associated with insulin resistance/metabolic syndrome in cross-sectional studies. However, despite compelling in vitro and animal data, to our knowledge the association of fetuin-A with incident diabetes has not previously been evaluated. The data presented here are novel in demonstrating the longitudinal link between fetuin-A and incident diabetes in humans. Moreover, the data suggest that that not only adipocyte derived factors and pancreatic hormones, but also hepatocyte derived proteins such as fetuin-A may regulate glucose metabolism in humans.
The association of fetuin-A with incident diabetes was partially attenuated with adjustment for visceral adiposity. Previous studies have demonstrated that fetuin-A stimulates adipogenesis in cell culture models,(31) and conversely, fetuin-A knock-out mice have less adiposity than wild-type controls.(14) We hypothesize that the direct correlation of fetuin-A with visceral adiposity observed in this study is a consequence of higher fetuin-A levels, and that accumulation of visceral adiposity may lie on causal pathway between fetuin-A and incident diabetes. However, despite statistical adjustment for visceral adiposity, the association of fetuin-A with incident diabetes was only partially attenuated, suggesting that mechanisms other than accumulated visceral adiposity likely also contribute to the link between fetuin-A and incident diabetes.
On the basis of these data, blockade of fetuin-A’s binding to the insulin receptor might be considered a novel therapeutic target for prevention or treatment of insulin resistant states. However, fetuin-A levels have an inverse association with vascular calcification. Beyond the insulin sensitive phenotype, the fetuin-A knock-out mouse develops wide-spread soft-tissue calcification.(32, 33) Our group,(34) and others(35–37) have demonstrated that lower fetuin-A levels are associated cross-sectionally with vascular and cardiac valvular calcification in humans, and are associated with mortality after myocardial infarction(38) and in end-stage renal disease.(37–41) Therefore, any novel therapeutic that blocks fetuin-A should be closely evaluated for safety, particularly with respect to cardiovascular consequences.
Our study has limitations. Participation required age 70 to 79, and black or white race. The findings may not generalize to younger persons or other race/ethnicities. Two-hour oral glucose tolerance tests are more sensitive than fasting glucose for diagnosis of diabetes.(42–44) This measure was available at baseline, providing accurate classification of diabetes status at entry. However, it was not available at follow-up visits which could have resulted in some incident diabetes cases being misclassified as normal, and therefore should have biased our results towards the null hypothesis. Blind duplicate intra-individual coefficients of variation of fetuin-A were higher in this study than in previous manuscripts.(34, 45) Again, measurement error misclassification should also have biased our results towards the null. Last, fetuin-A was measured at only one time point. Whether or not longitudinal trajectories of fetuin-A provide additional, or more specific, information regarding future diabetes risk is an important topic for future research.
In conclusion, fetuin-A is independently associated with incident diabetes in older persons. Future studies should evaluate whether the results may generalize to middle age persons where the incidence rate is highest.(46) If confirmed in future studies, fetuin-A may ultimately prove useful as a target for therapeutics, and its study may provide novel insights to glucose metabolism in humans.
Acknowledgments
The authors thank the other investigators, the staff, and the participants of the Health ABC study for their valuable contributions, and Dr. Frances A. Tylavsky for her critical review of the manuscript. This study was supported by an American Diabetes Association (ADA) – ASP Young Investigator Innovation Award in Geriatric Endocrinology sponsored by the Atlantic Philanthropies, ADA, the John A. Hartford Foundation, and ASP, an American Heart Association Fellow to Faculty Transition Award (JHI) and contracts N01-AG-6-2101, N01-AG-6-2103 and N01-AG-6-2106 from the National Institutes on Aging (NIA). The research was also supported in part by the Intramural Research Program of the NIH, National Institute on Aging. The funding sources played no role in the design and conduct of the study; collection, management, analysis, or interpretation of the data, nor in the preparation of the manuscript. The National Institutes of Aging reviewed and approved this manuscript prior to submission.
Dr. Ix conceived of the study question, designed the study, interpreted data, drafted the manuscript, and obtained funding. Ms. Wassel-Fyr performed the statistical analysis, interpreted data, and provided critical revision of the manuscript. Dr. Kanaya assisted in study design, data interpretation, provided critical revisions of the manuscript. Dr. Vittinghoff assisted in study design, supervised the statistical analysis, and provided critical revisions of the manuscript. Dr. Johnson assisted with acquisition of the data, obtained funding, and provided critical revisions of the manuscript. Dr. Koster assisted in interpretation of the data and provided critical revisions of the manuscript. Dr. Cauley assisted with data acquisition, obtaining funding, and provided critical revisions of the manuscript. Dr. Harris assisted with data acquisition, obtaining funding, and provided critical revisions of the manuscript. Dr. Cummings assisted in study design, data acquisition, obtaining funding, and provided critical revisions of the manuscript. Dr. Shlipak assisted in study design, acquisition of data, drafting of the manuscript, and supervision of the study.
Footnotes
COMPETING FINANCIAL INTERESTS: None
References
- 1.Flegal KM, Carroll MD, Ogden CL, et al. Prevalence and trends in obesity among US adults, 1999–2000. Jama. 2002 Oct 9;288(14):1723–7. doi: 10.1001/jama.288.14.1723. [DOI] [PubMed] [Google Scholar]
- 2.Mokdad AH, Bowman BA, Ford ES, et al. The continuing epidemics of obesity and diabetes in the United States. Jama. 2001 Sep 12;286(10):1195–200. doi: 10.1001/jama.286.10.1195. [DOI] [PubMed] [Google Scholar]
- 3.King H, Aubert RE, Herman WH. Global burden of diabetes, 1995–2025: prevalence, numerical estimates, and projections. Diabetes Care. 1998 Sep;21(9):1414–31. doi: 10.2337/diacare.21.9.1414. [DOI] [PubMed] [Google Scholar]
- 4.Howard BV, Rodriguez BL, Bennett PH, et al. Prevention Conference VI: Diabetes and Cardiovascular disease: Writing Group I: epidemiology. Circulation. 2002 May 7;105(18):e132–7. doi: 10.1161/01.cir.0000013953.41667.09. [DOI] [PubMed] [Google Scholar]
- 5.Perseghin G, Ghosh S, Gerow K, et al. Metabolic defects in lean nondiabetic offspring of NIDDM parents: a cross-sectional study. Diabetes. 1997 Jun;46(6):1001–9. doi: 10.2337/diab.46.6.1001. [DOI] [PubMed] [Google Scholar]
- 6.Saxena R, Voight BF, Lyssenko V, et al. Genome-wide association analysis identifies loci for type 2 diabetes and triglyceride levels. Science. 2007 Jun 1;316(5829):1331–6. doi: 10.1126/science.1142358. [DOI] [PubMed] [Google Scholar]
- 7.McNeely MJ, Boyko EJ, Weigle DS, et al. Association between baseline plasma leptin levels and subsequent development of diabetes in Japanese Americans. Diabetes Care. 1999 Jan;22(1):65–70. doi: 10.2337/diacare.22.1.65. [DOI] [PubMed] [Google Scholar]
- 8.Festa A, D’Agostino R, Jr, Tracy RP, et al. Elevated levels of acute-phase proteins and plasminogen activator inhibitor-1 predict the development of type 2 diabetes: the insulin resistance atherosclerosis study. Diabetes. 2002 Apr;51(4):1131–7. doi: 10.2337/diabetes.51.4.1131. [DOI] [PubMed] [Google Scholar]
- 9.Lindsay RS, Funahashi T, Hanson RL, et al. Adiponectin and development of type 2 diabetes in the Pima Indian population. Lancet. 2002 Jul 6;360(9326):57–8. doi: 10.1016/S0140-6736(02)09335-2. [DOI] [PubMed] [Google Scholar]
- 10.Ix JH, Chertow GM, Shlipak MG, et al. Fetuin-A and kidney function in persons with coronary artery disease--data from the Heart and Soul Study. Nephrol Dial Transplant. 2006 Aug;21(8):2144–51. doi: 10.1093/ndt/gfl204. [DOI] [PMC free article] [PubMed] [Google Scholar]
- 11.Rauth G, Poschke O, Fink E, et al. The nucleotide and partial amino acid sequences of rat fetuin. Identity with the natural tyrosine kinase inhibitor of the rat insulin receptor. Eur J Biochem. 1992 Mar 1;204(2):523–9. doi: 10.1111/j.1432-1033.1992.tb16663.x. [DOI] [PubMed] [Google Scholar]
- 12.Auberger P, Falquerho L, Contreres JO, et al. Characterization of a natural inhibitor of the insulin receptor tyrosine kinase: cDNA cloning, purification, and anti-mitogenic activity. Cell. 1989 Aug 25;58(4):631–40. doi: 10.1016/0092-8674(89)90098-6. [DOI] [PubMed] [Google Scholar]
- 13.Mathews ST, Singh GP, Ranalletta M, et al. Improved insulin sensitivity and resistance to weight gain in mice null for the Ahsg gene. Diabetes. 2002 Aug;51(8):2450–8. doi: 10.2337/diabetes.51.8.2450. [DOI] [PubMed] [Google Scholar]
- 14.Mathews ST, Rakhade S, Zhou X, et al. Fetuin-null mice are protected against obesity and insulin resistance associated with aging. Biochem Biophys Res Commun. 2006 Nov 17;350(2):437–43. doi: 10.1016/j.bbrc.2006.09.071. [DOI] [PubMed] [Google Scholar]
- 15.Stefan N, Hennige AM, Staiger H, et al. Alpha2-Heremans-Schmid glycoprotein/fetuin-A is associated with insulin resistance and fat accumulation in the liver in humans. Diabetes Care. 2006 Apr;29(4):853–7. doi: 10.2337/diacare.29.04.06.dc05-1938. [DOI] [PubMed] [Google Scholar]
- 16.Mori K, Emoto M, Yokoyama H, et al. Association of serum fetuin-A with insulin resistance in type 2 diabetic and nondiabetic subjects. Diabetes Care. 2006 Feb;29(2):468. doi: 10.2337/diacare.29.02.06.dc05-1484. [DOI] [PubMed] [Google Scholar]
- 17.Ix JH, Shlipak MG, Brandenburg VM, et al. Association between human fetuin-A and the metabolic syndrome: data from the Heart and Soul Study. Circulation. 2006 Apr 11;113(14):1760–7. doi: 10.1161/CIRCULATIONAHA.105.588723. [DOI] [PMC free article] [PubMed] [Google Scholar]
- 18.Prentice RL. A case-cohort design for epidemiologic cohort studies and disease prevention trials. Biometrika. 1986;73:1–11. [Google Scholar]
- 19.Declerck PJ, Alessi MC, Verstreken M, et al. Measurement of plasminogen activator inhibitor 1 in biologic fluids with a murine monoclonal antibody-based enzyme-linked immunosorbent assay. Blood. 1988;71:220–5. [PubMed] [Google Scholar]
- 20.Levey AS, Bosch JP, Lewis JB, et al. A more accurate method to estimate glomerular filtration rate from serum creatinine: a new prediction equation. Modification of Diet in Renal Disease Study Group. Ann Intern Med. 1999 Mar 16;130(6):461–70. doi: 10.7326/0003-4819-130-6-199903160-00002. [DOI] [PubMed] [Google Scholar]
- 21.Barlow WE, Ichikawa L, Rosner D, et al. Analysis of case-cohort designs. J Clin Epidemiol. 1999 Dec;52(12):1165–72. doi: 10.1016/s0895-4356(99)00102-x. [DOI] [PubMed] [Google Scholar]
- 22.Therneau TM, Li H. Computing the Cox model for case cohort designs. Lifetime Data Analysis. 1999;5(2):99–112. doi: 10.1023/a:1009691327335. [DOI] [PubMed] [Google Scholar]
- 23.Lin DYWL. The robust inference for the Cox proportional hazards model. Journal of the American Statistical Association. 1989;84:1074–78. [Google Scholar]
- 24.Clinical Guidelines on the Identification, Evaluation, and Treatment of Overweight and Obesity in Adults: The Evidence Report. National Institutes of Health. Obesity Research. 1998;6(Suppl 2):51S. [PubMed] [Google Scholar]
- 25.Srinivas PR, Wagner AS, Reddy LV, et al. Serum alpha 2-HS-glycoprotein is an inhibitor of the human insulin receptor at the tyrosine kinase level. Mol Endocrinol. 1993 Nov;7(11):1445–55. doi: 10.1210/mend.7.11.7906861. [DOI] [PubMed] [Google Scholar]
- 26.Mathews ST, Srinivas PR, Leon MA, et al. Bovine fetuin is an inhibitor of insulin receptor tyrosine kinase. Life Sci. 1997;61(16):1583–92. doi: 10.1016/s0024-3205(97)00737-6. [DOI] [PubMed] [Google Scholar]
- 27.Grunberger GMS, Deutsch DD. Insulin Signaling: From Cultured Cells to Animal Models, Frontiers in Animal Diabetes Research. New York: Taylor and Francis; 2002. Tyrosine Kinase Inhibitors. [Google Scholar]
- 28.Cintron VJ, Ko MS, Chi KD, et al. Genetic mapping and functional studies of a natural inhibitor of the insulin receptor tyrosine kinase: the mouse ortholog of human alpha2-HS glycoprotein. Int J Exp Diabetes Res. 2001;1(4):249–63. doi: 10.1155/EDR.2000.249. [DOI] [PMC free article] [PubMed] [Google Scholar]
- 29.Vionnet N, Hani EH, Dupont S, et al. Genomewide search for type 2 diabetes-susceptibility genes in French whites: evidence for a novel susceptibility locus for early-onset diabetes on chromosome 3q27-qter and independent replication of a type 2-diabetes locus on chromosome 1q21–q24. Am J Hum Genet. 2000 Dec;67(6):1470–80. doi: 10.1086/316887. [DOI] [PMC free article] [PubMed] [Google Scholar]
- 30.Kissebah AH, Sonnenberg GE, Myklebust J, et al. Quantitative trait loci on chromosomes 3 and 17 influence phenotypes of the metabolic syndrome. Proc Natl Acad Sci U S A. 2000 Dec 19;97(26):14478–83. doi: 10.1073/pnas.97.26.14478. [DOI] [PMC free article] [PubMed] [Google Scholar]
- 31.Cayatte AJ, Kumbla L, Subbiah MT. Marked acceleration of exogenous fatty acid incorporation into cellular triglycerides by fetuin. J Biol Chem. 1990 Apr 5;265(10):5883–8. [PubMed] [Google Scholar]
- 32.Schafer C, Heiss A, Schwarz A, et al. The serum protein alpha 2-Heremans-Schmid glycoprotein/fetuin-A is a systemically acting inhibitor of ectopic calcification. J Clin Invest. 2003 Aug;112(3):357–66. doi: 10.1172/JCI17202. [DOI] [PMC free article] [PubMed] [Google Scholar]
- 33.Westenfeld R, Schafer C, Smeets R, et al. Fetuin-A (AHSG) prevents extraosseous calcification induced by uraemia and phosphate challenge in mice. Nephrol Dial Transplant. 2007 Jun;22(6):1537–46. doi: 10.1093/ndt/gfm094. [DOI] [PubMed] [Google Scholar]
- 34.Ix JH, Chertow GM, Shlipak MG, et al. Association of fetuin-A with mitral annular calcification and aortic stenosis among persons with coronary heart disease: data from the Heart and Soul Study. Circulation. 2007 May 15;115(19):2533–9. doi: 10.1161/CIRCULATIONAHA.106.682450. [DOI] [PMC free article] [PubMed] [Google Scholar]
- 35.Kaden JJ, Reinohl JO, Blesch B, et al. Systemic and local levels of fetuin-A in calcific aortic valve stenosis. Int J Mol Med. 2007 Aug;20(2):193–7. [PubMed] [Google Scholar]
- 36.Moe SM, Reslerova M, Ketteler M, et al. Role of calcification inhibitors in the pathogenesis of vascular calcification in chronic kidney disease (CKD) Kidney Int. 2005 Jun;67(6):2295–304. doi: 10.1111/j.1523-1755.2005.00333.x. [DOI] [PubMed] [Google Scholar]
- 37.Wang AY, Woo J, Lam CW, et al. Associations of serum fetuin-A with malnutrition, inflammation, atherosclerosis and valvular calcification syndrome and outcome in peritoneal dialysis patients. Nephrol Dial Transplant. 2005 Aug;20(8):1676–85. doi: 10.1093/ndt/gfh891. [DOI] [PubMed] [Google Scholar]
- 38.Lim P, Collet JP, Moutereau S, et al. Fetuin-A Is an Independent Predictor of Death after ST-Elevation Myocardial Infarction. Clin Chem. 2007 Oct;53(10):1835–40. doi: 10.1373/clinchem.2006.084947. [DOI] [PubMed] [Google Scholar]
- 39.Stenvinkel P, Wang K, Qureshi AR, et al. Low fetuin-A levels are associated with cardiovascular death: Impact of variations in the gene encoding fetuin. Kidney Int. 2005 Jun;67(6):2383–92. doi: 10.1111/j.1523-1755.2005.00345.x. [DOI] [PubMed] [Google Scholar]
- 40.Ketteler M, Bongartz P, Westenfeld R, et al. Association of low fetuin-A (AHSG) concentrations in serum with cardiovascular mortality in patients on dialysis: a cross-sectional study. Lancet. 2003 Mar 8;361(9360):827–33. doi: 10.1016/S0140-6736(03)12710-9. [DOI] [PubMed] [Google Scholar]
- 41.Hermans MM, Brandenburg V, Ketteler M, et al. Association of serum fetuin-A levels with mortality in dialysis patients. Kidney Int. 2007 Jul;72(2):202–7. doi: 10.1038/sj.ki.5002178. [DOI] [PubMed] [Google Scholar]
- 42.Wahl PW, Savage PJ, Psaty BM, et al. Diabetes in older adults: comparison of 1997 American Diabetes Association classification of diabetes mellitus with 1985 WHO classification. Lancet. 1998 Sep 26;352(9133):1012–5. doi: 10.1016/S0140-6736(98)04055-0. [DOI] [PubMed] [Google Scholar]
- 43.Resnick HE, Shorr RI, Kuller L, et al. Prevalence and clinical implications of American Diabetes Association-defined diabetes and other categories of glucose dysregulation in older adults: the health, aging and body composition study. J Clin Epidemiol. 2001 Sep;54(9):869–76. doi: 10.1016/s0895-4356(01)00359-6. [DOI] [PubMed] [Google Scholar]
- 44.Will new diagnostic criteria for diabetes mellitus change phenotype of patients with diabetes? Reanalysis of European epidemiological data. DECODE Study Group on behalf of the European Diabetes Epidemiology Study Group. Bmj. 1998 Aug 8;317(7155):371–5. doi: 10.1136/bmj.317.7155.371. [DOI] [PMC free article] [PubMed] [Google Scholar]
- 45.Ix JH, Shlipak MG, Sarnak MJ, et al. Fetuin-A is not associated with mortality in chronic kidney disease. Kidney Int. 2007 Dec;72(11):1394–9. doi: 10.1038/sj.ki.5002549. [DOI] [PubMed] [Google Scholar]
- 46.“Incidence of Diabetes in the United States. National Diabetes Information Clearing House (NDIC). <http://diabetesniddknihgov/dm/pubs/statistics/#11>. 2007;(May 22, 2007).