

Abstract
Accurate free energy estimation is essential for RNA structure prediction. The widely used Turner's energy model works well for nested structures. For pseudoknotted RNAs, however, there is no effective rule for estimation of loop entropy and free energy. In this work we present a new free energy estimation method, termed the pseudoknot predictor in three-dimensional space (pk3D), which goes beyond Turner's model. Our approach treats nested and pseudoknotted structures alike in one unifying physical framework, regardless of how complex the RNA structures are. We first test the ability of pk3D in selecting native structures from a large number of decoys for a set of 43 pseudoknotted RNA molecules, with lengths ranging from 23 to 113. We find that pk3D performs slightly better than the Dirks and Pierce extension of Turner's rule. We then test pk3D for blind secondary structure prediction, and find that pk3D gives the best sensitivity and comparable positive predictive value (related to specificity) in predicting pseudoknotted RNA secondary structures, when compared with other methods. A unique strength of pk3D is that it also generates spatial arrangement of structural elements of the RNA molecule. Comparison of three-dimensional structures predicted by pk3D with the native structure measured by nuclear magnetic resonance or X-ray experiments shows that the predicted spatial arrangement of stems and loops is often similar to that found in the native structure. These close-to-native structures can be used as starting points for further refinement to derive accurate three-dimensional structures of RNA molecules, including those with pseudoknots.
Keywords: RNA structure prediction, pseudoknots, RNA free energy estimation, RNA structure modeling, RNA secondary and tertiary structure
INTRODUCTION
Biological functions of RNA range from carrying genetic information, participating in protein synthesis, catalyzing biochemical reactions, and regulating gene expressions, to acting as a structural molecule in cellular organelles (Gesteland et al. 2006). To understand how RNA molecules perform these tasks, knowledge of the three-dimensional structures of RNA is often required. Although the most reliable sources of RNA structural information are experimental measurements from X-ray crystallography, nuclear magnetic resonance (NMR) spectroscopy, and cryoelectron microscopy, experimental structures of RNAs are technically challenging to obtain and are costly in both time and effort. As a result, knowledge of RNA structures lags far behind that of RNA sequences. Computational prediction of RNA structures, therefore, can provide an alternative source of information for gaining biological insights.
Prediction of secondary structures of small and non-pseudo-knotted RNAs has been very successful (Mathews et al. 1999). Predicted secondary structures of RNA molecules can provide valuable information, as they could reveal the functions of RNA molecules (Gonzalez-Diaz et al. 2007) and help in the understanding of RNA folding —since RNAs often fold hierarchically (Brion and Westhof 1997). They can also be used for RNA comparison (Gan et al. 2003), and for predicting three-dimensional RNA structures (Shapiro et al. 2007). There are two general strategies in predicting RNA secondary structures. The most successful one is through comparative sequence analysis (Doshi et al. 2004; Gardner and Giegerich 2004), which utilizes homology information and incorporates many complex factors in determining RNA structures implicitly. However, the approach of comparative sequence analysis requires the availability of many related RNA sequences, thus it is not always feasible. The other approach is through minimization of free energies (MFE). This is based on the thermodynamic hypothesis, which states that the conformation with the lowest free energy is the native RNA structure (Tinoco et al. 1971).
The most widely used secondary structure prediction programs are based on the second strategy. Among these, Mfold (Zuker 2003), RNAfold (Hofacker et al. 1994), and RNA structure (Mathews et al. 2004) are based on dynamic programming and guarantee the generation of a structure with the lowest free energy, within the accuracy limitations of the free energy rules employed, and with the condition that the RNA secondary structures are nested and contain no pseudoknot. When pseudoknotted RNAs are excluded, Mfold, for example, can correctly predict an average of 69% of known base pairs in a test involving a large data set containing tRNA, 5S, 16S, 32S, Group I and II introns, RNase P, and SRP RNAs (Mathews et al. 1999).
However, prediction of RNA secondary structure with pseudoknots is far more challenging. For example, when the test set includes pseudoknotted RNAs, the accuracy of Mfold prediction deteriorates to 54%–68% (van Batenburg et al. 1995; Rivas and Eddy 1999; Dirks and Pierce 2003; Ruan et al. 2004; Ren et al. 2005; Reeder et al. 2007; Zhao et al. 2008). The difficulties are twofold. First, there are exponentially many ways that pseudoknots can form. It has been shown that the general problem of predicting RNA secondary structures containing pseudoknots is NP hard (Akutsu 2000; Lyngsø and Pedersen 2000). Methods based on dynamic programming cannot solve this problem, aside from a few special cases (Rivas and Eddy 1999; Reeder et al. 2007). Second, there is no known effective free energy model that can describe accurately the free energy of loops in pseudoknotted RNA molecules.
Recently, several methods have been designed to predict the secondary structures of RNAs with pseudoknots. These include NUPACK (Dirks and Pierce 2003), pknotsRE (Rivas and Eddy 1999), pknotsRG-mfe (Reeder et al. 2007), ILM (Ruan et al. 2004), TdFold (Zhao et al. 2008), STAR (van Batenburg et al. 1995), HotKnots (Ren et al. 2005), FlexStem (Chen et al. 2008), and Kinefold (Isambert and Siggia 2000). These either employed approximation algorithms and generated predicted structures that were within a certain approximation ratio with the optimal structure (Rivas and Eddy 1999; Dirks and Pierce 2003; Ruan et al. 2004; Reeder et al. 2007; Zhao et al. 2008), or employed empirical algorithms that were more stochastic in nature (van Batenburg et al. 1995; Isambert and Siggia 2000; Ren et al. 2005; Chen et al. 2008). The average accuracy was improved to 76%–80% for small pseudoknots (<150 nucleotides [nt]). For large pseudoknots, the problem was still very challenging, and the accuracy ranged from 36% to 55%.
All of these methods represented the development of new algorithms in generating candidate secondary structures. They all employed the well-established Turner's energy rule and its modifications (Serra et al. 1995; Xia et al. 1998; Mathews et al. 1999) to estimate the free energy of pseudoknotted RNA secondary structures (Dirks and Pierce 2003). However, the lack of progress in calculating free energies associated with pseudoknotted loops posed a significant limit on what these methods could achieve.
There has been a long line of research studying the free energy rules of pseudoknots, with the entropic cost as the main focus, since the enthalpic contribution can be accurately obtained using Turner's energy rule. Gultyaev et al. (1999) adjusted the parameters of equations derived from polymer theory such that they were consistent with known data on pseudoknots. They compiled a table of recommended free energy values for H-type pseudoknots with different stem–loop lengths (Gultyaev et al. 1999). Using the Gaussian chain approximation and neglecting the excluded volume effects, Aalberts and Hodas (2005) developed a model to estimate the free energy of pseudoknots of the ABAB-type. Isambert and Siggia (2000) treated pseudoknots in two stages by modeling short-scale structures as “net” and large-scale structures as “Gaussian crosslinked gel” in their Kinefold method. They calculated the short-scale conformational entropy analytically from the Gaussian chain model, and obtained the large-scale entropy by algebraic integrations. According to these authors, the excluded volume effects were incorporated crudely by adjusting the value of an exponent (Isambert and Siggia 2000). Based on the work of Rivas and Eddy (1999), Dirks and Pierce (2003) developed a free energy rule for pseudoknots using a phenomenological linear equation in which the coefficients were trained by using known data of pseudoknots. This model has become the standard for pseudoknot free energy calculation and has been often regarded as an extension to Turner's energy rule due to its Turner-style formulation, as well as the linear functional form necessary for dynamic programming algorithm. Although this free energy rule is used frequently, it is not realistic since it does not model the important excluded volume effect.
Another important work on modeling RNA free energies was a constraint generation method presented by Andronescu et al. (2007), which employed an iterative scheme to train hundreds of free energy parameters on large sets of structural and thermodynamic data. Based on the parameters optimized by this method, significant improvements in prediction accuracy over the other methods have been achieved. Aside from these thermodynamical measurement based methods, there were alternative probabilistic methodologies for modeling RNA secondary structures. Among them, CONTRAfold was based on conditional log–linear models and generalized upon stochastic context-free grammars by using discriminative training and feature-rich scoring (Do et al. 2006). The work of the CONTRAfold method demonstrated that statistical learning procedures provide an effective alternative to the physics-based approach in deriving parameters for RNA secondary structure prediction.
Despite these successes, calculating the free energy of loop regions in RNA pseudoknots is still an unsolved problem. In our opinion, this is intrinsically a three-dimensional problem. For loops embedded in pseudoknots, commonly used secondary structural features—such as the number of base pairs bordering the pseudoknots, loop asymmetricity, and the penalty for overlapping pseudoknots—do not necessarily capture the most relevant information. It is necessary to develop a new free energy rule based on three-dimensional spatial models rather than models solely restricted to secondary structures. Based on self-avoiding random walks of chain conformations on lattice models, Lucas and Dill (2003), and Kopeikin and Chen (2005, 2006) developed theoretical models of pseudoknots and simple RNA tertiary folds. These models have been used in studies of folding stability, thermal transitions, and the general shape of the free energy landscape of RNA folding. A limitation of these models is that they are lattice based and cannot represent realistic RNA conformations. The first ab initio free energy model for realistic H-type pseudoknots that was easy to implement was the Vfold model developed recently (Cao and Chen 2006, 2009; Chen 2008). Since the loop conformation depends on the nearby helical stems through chain connectivity and stem–loop volume exclusion, a template was first constructed from experimentally measured atomic coordinates of RNA stem structures. The number of conformations of loops was then enumerated by generating self-avoiding walks on a diamond lattice that connect the stem ends. An important development in these works was the three-dimensional templates created for estimating the loop entropy of pseudoknotted RNA structures, as they already contained rich information. The Vfold method worked very well for studying RNA thermodynamics and for RNA structure predictions (Cao and Chen 2006, 2009; Chen 2008). However, although it is not difficult to build templates for H-type pseudoknots and create a look-up table for entropic costs of forming stem–loop structures with different lengths, it is not feasible to do so for all possible pseudoknots.
It is our goal here to go beyond previous approaches and develop a general framework for computing the free energies of RNA molecules with arbitrary secondary structures, including those with complex pseudoknots. Our approach is based on considerations of the spatial nature of RNA molecules and is not restricted to any specific type of pseudoknot, such as the H-type pseudoknot, but is applicable to all types of pseudoknots. Physically, the entropy of a loop of a specific length is determined to a large extent by the end-to-end distance and the spatial interference from nearby stems or loops. This is true for loops of all nature, regardless of whether or not it is a hairpin loop, an internal or bulge loop, a multibranch loop, or a pseudoknotted loop (Kopeikin and Chen 2005, 2006; Zhang et al. 2008; Cao and Chen 2009). From this consideration and our previous work (Zhang et al. 2008), we have developed an efficient and accurate method to calculate the loop entropy of RNA structures with pseudoknots. By first growing multiple RNA chains in three-dimensional space, our method searches among all possible arrangements of helical stems for the optimal three-dimensional structure. The loop entropy of RNA structures in each spatial arrangement of helical stems is then computed by accurately estimating the fraction of the number of loop conformations with respect to the number of random coils of the same length based on a six-state discrete RNA chain model (Zhang et al. 2008). We call our method the pseudoknot predictor in three-dimensional space (pk3D). Our method is feasible because the constraints from chain connectivity and the avoidance of geometric collisions allow early pruning of a vast number of unlikely spatial arrangements, which occur early in the branches of a search tree. As a result, the actual number of spatial arrangements is relatively small.
The pk3D method takes the secondary structure candidates of given RNA sequences as input and computes their free energies using more realistic physical methods; it also outputs the approximate shapes of the corresponding three-dimensional structures. We note that our pk3D and previous methods for predicting RNA tertiary structure, such as MC-Fold and the MC-Sym pipeline (Parisien and Major 2008), are different: First, MC-Fold and the MC-Sym pipeline use a statistical potential function, whereas ours is a physics-based potential function; Second, our focus is not to predict exact tertiary structures using pk3D; instead, we aim to develop the pk3D method for constructing approximate three-dimensional shapes of a given secondary structure, and for accurate calculation of its free energy. The approximate three-dimensional shapes generated by the pk3D method can be further used with additional structural refinement methods to obtain accurate and more-detailed conformations. Third, the pk3D method is computationally much faster than MC-Fold and the MC-Sym pipeline, which is essential for large-scale studies of RNA molecules.
Since the pk3D method is designed to treat pseudoknots of any complexity, we need a candidate list as input that maximizes the diversity of pseudoknot topology. All previous methods for prediction of secondary structure were not particularly designed for this. Therefore, we have developed a method, called the pseudoknot predictor in two-dimensional space (pk2D), to create candidate secondary structures of RNAs for given sequences. The pk2D program first uses dynamic programming based local alignment to create a pool of helical stems, and then employs an approximation algorithm that can identify a large number of close-to-optimal solutions of stem combinations without conflicts, which is a well-known NP-complete problem (Akutsu 2000; Lyngsø and Pedersen 2000). Details of both pk2D and pk3D are given in the Materials and Methods section.
The remainder of this paper is organized as follows: First, we discuss the performance of pk2D, namely, its ability to generate a good candidate list for further evaluation. Second, we test the ability of pk3D in selecting native structures from decoy structures. Third, we make blind predictions and compare pk3D with several widely used programs that can predict RNA secondary structures with pseudoknots. Finally, in the Results and Discussions section, we show with several examples the performance of pk3D in generating approximate three-dimensional shapes of the predicted RNA structures. We summarize the paper in the Conclusion section. The data set and detailed algorithms are given in the Materials and Methods section, and can be downloaded from gila.bioengr.uic.edu/lab/tools/pk3d/.
RESULTS AND DISCUSSIONS
Our overall goal was to develop a new approach to assess the free energy of loops in pseudoknotted RNA molecules and to generate coarse three-dimensional structures. We first examine how this method can aid in prediction of RNA secondary structures with pseudoknots.
Generating candidate secondary structures with pseudoknots: Performance of pk2D
The accuracy of our secondary structure prediction method depended on the quality of the candidate list, which in this work was created using the specially designed program pk2D. pk2D can generate a long list of candidate secondary structures with enriched diversity in pseudoknot topology.
To assess the quality of the candidate structures created by pk2D and to explore the optimal number of candidate structures for prediction of correct spatial fold, we first tested the performance of pk2D. For each sequence in a testing set of a total of 43 pseudoknotted RNA molecules (see the Materials and Methods section), we created a pool of stems using local alignment through dynamic programming. These stems were then processed by the pk2D program, which generated secondary structures consisting of stems without conflicts. We took the top m structures from these secondary structures, which were ranked by the sum of the stem free energies using Turner's rule. Note that in pk2D, the free energy contribution from loops is neglected temporarily, as it will be treated comprehensively using a physical framework in pk3D. We found that on average, more than 95% of the structures in the candidate list generated by pK2D contained at least one pseudoknot. We then compared the candidates with the true known native structure, and calculated the sensitivity and the positive predictive value (PPV) of each candidate. The structure closest to the true native structure was then identified (see the Materials and Methods section).
On average, the best candidate was ranked 23rd by pk2D. The average sensitivities of the best structure in the candidate list for this set of RNA molecules were 0.92, 0.93, 0.93, and 0.95 for m = 30, 60, 100, and 500, respectively, and the PPVs of the best structure were 0.85, 0.86, 0.87, and 0.90, respectively. These results show that the quality of the candidate list is adequate, even though only the stem free energy is accounted for in pk2D. For further structure prediction, we found a candidate list of 30–50 was sufficient.
Selecting native structure from the candidate set by free energy with the improved loop entropy method: Performance of pK3D
The free energy of RNA loops, especially in pseudoknots, is difficult to evaluate. In pk3D, the free energy of loops is estimated based on a physical model, and on the assumption that the loop entropy is determined to a large extent by the end-to-end distance and the spatial interference of nearby stems. This assumption is reasonable and is applicable to all nested and pseudoknotted loops, regardless of complexity. It provides a unifying framework for the treatment of loop entropy. Details of the pk3D method are given in the Materials and Methods section.
We first tested the ability of pk3D in selecting native secondary structures out of the other candidate structures (called decoys). For each of the 43 sequences in the data set, we took the top m secondary structures output by pk2D as decoys. These decoys had diverse structures, and about 95% of them were pseudoknotted. We then manually inserted the native structure into this list and used Turner's energy rule and pk3D, respectively, to further evaluate the free energies. When using Turner's energy rule, we used the Dirks and Pierce (2003) extension for calculating the loop entropy of pseudoknots. The optimal structure with the lowest free energy in each case was then compared with the native structure, and the corresponding sensitivity and PPV were calculated. The results averaged over the whole test set are shown in Table 1.
TABLE 1.
The ability of the extended Turner rule and pk3D to select the native structure from decoys

As shown in Table 1, the performance in selecting native structures from decoys for this test set is slightly better using pk3D (∼2% improvement) than when using Turner's energy rule. Although the improvement is modest, this result is promising, considering that the current form of the free energy rule in pk3D is very simple, as the entropy of both nested and pseudoknotted loops are indexed by only two parameters, i.e., the loop length and the end-to-end distance. Since pk3D is intrinsically a spatial method, it can easily incorporate more complex factors, such as the docking of loops onto nearby helices, which would be impossible for methods based on secondary structures.
Secondary structure prediction: Comparing pk3D with other methods
In this test, we made a blind secondary structure prediction using pk3D and compared its performance with those of other methods, including HotKnots (Ren et al. 2005), pknotsRG (Rivas and Eddy 1999), NUPACK (Dirks and Pierce 2003), and ILM (Ruan et al. 2004). For each given RNA sequence, we first created the pool of stem regions, which was used to generate m number of candidate secondary structures by pk2D ranked by the sum of the stem energy. We then applied the pk3D algorithm to further evaluate the free energies of these candidates. The secondary structure with the lowest free energy was predicted to be the native one.
The overall accuracy of our prediction depended on the size of the input candidate list for pk3D. It has been shown that by carefully calibrating the size of sampled space, the accuracy of secondary structure prediction can be improved (Chen et al. 2008). Here, the evaluation of the free energy stopped when pk3D found 30 “valid” secondary structures, or else finished evaluation of all of the top m = 500 candidates. The secondary structure was assumed to be “valid” if a corresponding three-dimensional structure, satisfying all chain constraints and free of geometric collisions, was found. This strategy of selecting proper candidate size was tested and was found to give the best performance for the current set of RNA sequences.
The optimal structure with the lowest free energy was then compared with the true native structure, and the corresponding sensitivity and PPV were calculated. The prediction results by pk3D and by several other methods are listed in Table 2. Overall, pk3D gave the best sensitivity and comparable PPV. On average, the pk3D method had a sensitivity that was 6%–7% higher than that of pknotsRG and NUPACK, and 10% higher than that of HotKnots. In terms of PPV, HotKnots, and pknotsRG had the best performance, although pk3D's PPV was quite comparable. In both cases, ILM had poor performance, possibly because we were unable to supply the best parameters to the ILM algorithm.
TABLE 2.
The accuracy of prediction of secondary structures of 43 small pseudoknotted RNA molecules using five different algorithms

We also compared our results with a recently published new model (Vfold) for predicting structures of general H-type pseudoknots with interhelix loops (Cao and Chen 2009). The Vfold model computes the conformational entropy and folding free energy based on a complete conformational ensemble and rigorous treatment for the excluded volume effects. In a test of 18 H-type pseudoknots, the model gave an average value of 0.91 for both sensitivity and PPV, about 5% higher than the other methods, including Hotknots, ILM, pknotsRE, STAR, pknotsRG, and NUPACK. The 18-pseudoknot testing set used is a subset of what is used in this study (Table 2). We calculated the performance of pk3D on this subset of 18-pseudoknotted RNA molecules and found that the average sensitivity and PPV were 0.89 and 0.84, respectively. Our result lags behind that of Vfold slightly, although this was expected, as our method was developed for general pseudoknots of arbitrary complexity, whereas the Vfold method is currently restricted to H-type pseudoknots. It is interesting to note that Vfold and pk3D performed very similarly on this test set, with the difference mostly from Hs-PrP. For Hs-PrP, Vfold gave a sensitivity of 0.45 and a PPV of 0.5, whereas pk3D failed and gave two zeroes. For another RNA molecule, Bt-PrP, Vfold, and pk3D gave the same sensitivity (0.42 for both) and a very similar PPV (0.33 versus 0.31). Except for these two cases, both methods gave very high sensitivity and PPV (usually close to 1.0) for the remaining pseudoknotted RNAs. The similar performance of Vfold and pk3D is understandable, since they calculate the loop entropy based on the same physical consideration, i.e., the loop entropy is determined primarily by the loop length, the end-to-end distance, and the interference from nearby structures.
In the following sections, we discuss the details of the free energy evaluation of pk3D using several specific examples.
tmRNA-Ec-PK4: Importance of spatial arrangement of stems
The RNA molecule tmRNA-Ec-PK4 contains a H-type pseudoknot. However, in addition it has a 1 × 1 internal loop embedded within each of its two stems (Fig. 1). As shown in Table 2, pk3D predicts exactly the true native structure, with both sensitivity and PPV values of 1.00. The prediction by NUPACK is also at 100% accuracy, but HotKnots, pknotsRG, and ILM miss more than one-third of the base pairs, with the sensitivity of prediction at 0.68 and a PPV ranging between 0.81 and 1.00.
FIGURE 1.
The secondary structure of the native state of tmRNA-Ec-PK4. Secondary structures in this paper were drawn using PseudoViewer (http://wilab.inha.ac.kr/pseudoviewer/) unless otherwise indicated.
We have examined all 500 candidate structures generated by pk2D and found that ∼95% of them contain pseudoknots. The native structure was captured automatically by pk2D and was within this candidate list. All of the 499 candidates, other than the native structure, were easily recognized by pk3D as spatially infeasible, and were therefore ruled out immediately. Only the true native secondary structure had a feasible spatial arrangement with a reasonable free energy. In this case, the prediction of the native structure was simple, as it was sufficient to examine spatial feasibility of stems and there was no need to calculate the loop free energy in detail. This example illustrates the important role of the spatial arrangement of double helices and its geometric constraints in reduction of the feasible space of RNA structures.
mRNA-Hs-PrP: Importance of candidate structures
The native structure of this sequence is a simple H-type pseudoknot (Fig. 2A). However, despite the simplicity of its native structure, all of the tested methods except ILM failed in this test, with 0.0 in both sensitivity and PPV. The ILM method also gave a poor prediction with very low sensitivity (0.36) and PPV (0.25).
FIGURE 2.

The native and predicted secondary structures of mRNA-Hs-Prp pseudoknotted RNA. (A) The native structure taken from the PseudoBase cite (http://www.ekevanbatenburg.nl/PKBASE/PKB.HTML). (B) The best candidate secondary structure in the candidate list that is most similar to the native secondary structure. Compared with the native structure, it overestimates the number of base pairs (SE = 1, PPV = 0.65) and has an uncommon pseudoknotted structure.
For pk3D, the problem was that the native structure was not among the list of candidates, and all of the 500 candidates were readily rejected as spatially infeasible, since the specific combination of stem–loop lengths in each could not be satisfied without violation of geometric constraints when modeled in three-dimensional space. Even the best candidate closest to the native structure had an uncommon pseudoknot and overestimated the number of base pairings (about 35% overestimation) (Fig. 2B). The important fact is, when the native structure is manually inserted into the candidate list, it is correctly identified by pk3D as the only spatially feasible secondary structure, with a reasonable free energy.
For both tmRNA-Ec-PK4 and mRNA-Hs-PrP, when the native structures were present in the candidate lists, they were both selected as the only spatially feasible secondary structures among all candidates. The blind prediction by pk3D of tmRNA-Ec-PK4 was successful, but not for mRNA-Hs-PrP. Here, the bottleneck was not the free energy estimation of loops in pseudoknotted RNAs, rather, it was the generation of a candidate list that included the native structure. These two examples show that the pk3D algorithm is sensitive to the quality of the candidate list, and improvement in its generation has the promise to significantly increase the overall accuracy of pk3D prediction.
TMV.R and HDV: More complex structures
The native structure of the 3′ terminal region of the tobacco mosaic virus RNA (TMV.R) contains two pseudoknots; one is a simple H-type, and the other is an H-type with a long hairpin and a 1 ×5 internal loop embedded within (Fig. 3A). The structure of the hepatitis delta virus (HDV) genomic ribozyme is an H-type pseudoknot with two embedded substructures, a simple hairpin, and an imperfect hairpin with a bulge (Fig. 3B). pk3D performed similarly for TMV.R and HDV as in the previous two cases, that is, all candidates generated by pk2D were deemed as infeasible, as the native structures were not captured by pk2D, and thus not included in the candidate list. When the native structures of TMV.R and HDV were inserted manually into the corresponding candidate list, both were found as the only spatially feasible structures and correct predictions were made, with 100% prediction accuracy in both cases.
FIGURE 3.

The native secondary structures of (A) the 3′ terminal region of the tobacco mosaic virus (TMV.R), and (B) the hepatitis delta virus genomic ribozyme (HDV), respectively.
RNA spatial arrangement and three-dimensional structure prediction
The approach of pk3D toward secondary structure prediction is spatial in nature. First, stem regions with some stability are combinatorically assembled; second, spatial considerations are enforced in the form of loop entropy estimation, and the vast majority of candidate structures with stems compatible by secondary structure, but spatially infeasible are eliminated. Here, the loop entropy calculation in pk3D is fundamentally different from that in Turner's energy rule. As we are only at the very beginning of understanding the governing principles of RNA three-dimensional structures, it is premature to adopt Turner-style empirical rules and invent additional phenomenological equations. Instead, pk3D builds spatial models of stem regions, rejects infeasible candidates, searches among feasible arrangements of stems for the optimal one, and numerically estimates the loop entropy by calculating the fraction of closed loops with respect to random coils of the same length based on the sequential Monte Carlo algorithm (Zhang et al. 2008). With this strategy, each feasible secondary structure will be automatically assigned a representative spatial arrangement of helices, containing coarse-grain information of its tertiary structure. In essence, pk3D is a secondary structure predictor that also generates tertiary information, even though it only gives a coarse-grained shape of the three-dimensional conformation of the RNA molecule, due to the discrete nature of the state model used in the algorithm. This coarse-grained spatial conformation is still very useful: not only does it make it possible to estimate the pseudoknotted loop entropy, but it also can serve as a starting point for further structural refinement.
Here, we use several examples to describe how pk3D predicts the general shape of the native conformations. These examples were not selected from the 43-sequence testing set, since it was difficult to find the corresponding Protein Data Bank (PDB) structures from these sequences with which to compare our predictions. Instead, we directly obtained several typical RNA structures from the PDB, including nested and pseudoknotted with varying complexity. We extracted the sequences, and used the combination of pk2D and pk3D to predict their native structures.
Predicting the spatial structure of a H-type pseudoknot within the gene 32 mRNA of bacteriophage T2
The PDB structure 2TPK contains a simple H-type pseudoknot within the gene 32 mRNA of bacteriophage T2. Figure 4, A and B, shows its native secondary and tertiary structures as derived from NMR experiments, respectively. Its secondary structure is predicted by pk3D correctly with an accuracy of 1.0. The predicted tertiary structure (Fig. 4C) shares the major common structural features with the native structure. These include: (1) the two helices are coaxially stacked on each other and run continuously in space, forming a long, quasicontinuous helix, which helps to stabilize the overall RNA structure; and (2) the nucleotide A8 constitutes a loop of only 1 nt, which connects the far two ends of the two helices, rendering a typical H-type pseudoknot structure.
FIGURE 4.

The secondary and tertiary structures of a fragment of gene 32 mRNA of bacteriophate T2. (A) The native secondary structure. (B) The native tertiary structure, data taken from the PDB databank (PDB 2tpk; http://www.wwpdb.org/). (C) The tertiary structure predicted by pk3D. Note that in both B and C, loops are shown in yellow dashed lines to illustrate chain connectivity and to facilitate structural comparison. The orange spheres show the position of the A8 nucleotide, which forms a short loop of length 1. All tertiary structures were drawn using PyMOL (http://pymol.org/).
Similar results were obtained using pk3D for the pseudoknot of SRV-1 RNA involved in ribosomal frameshifting (PDB 1E95), and the P2B-P3 pseudoknot from human telomerase RNA (PDB 1YMO). Both are simple H-type pseudoknots but have different loop lengths (their figures are similar and therefore are not shown).
The acceptor arm of TYMV tRNA-like structure
The pseudoknotted T arm and acceptor arm of the tRNA-like structure of turnip yellow mosaic virus (TYMV, PDB 1A60) is a combination of a H-type pseudoknot and a coaxially stacked hairpin structure. Its secondary structure is predicted correctly by pk3D with an accuracy of 1.0. By comparing the NMR measured structure with the predicted spatial structure (Fig. 5B,C, respectively), it can be seen that the overall spatial relationship between the three helices is the same: the two pseudoknotted helices are coaxially stacked on each other; on the top of them is also stacked the hairpin helix. These three helices assemble into a very long, quasicontinuous helix in both measured and predicted spatial structures.
FIGURE 5.

The native secondary structure and tertiary structure of the T arm and acceptor arm of the tRNA-like structure of the turnip yellow mosaic virus. (A) The native secondary structure. (B) The native tertiary structure taken from the PDB databank (PDB 1A60; http://www.wwpdb.org/). (C) The tertiary structure predicted by pk3D, which reproduces correctly the spatial arrangement of three stems, as well as their coaxial stacking observed in the experimental structure. The helices in B and C are colored using the same scheme. The loops are shown in yellow dashed lines to illustrate the chain connectivity.
PDB 1S9S-A core encapsidation signaling RNA of the Moloney murine leukemia virus
The 101-nt molecule of the core encapsidation signal of the Moloney murine leukemia virus (PDB 1S9S) is important for efficient genome packaging. It is a nonpseudoknotted RNA containing six helices. Among these helices, five are coaxially stacked and form a single long, quasicontinuous helix. The first helix, on the other hand, is flexible and is connected to the other helices via a flexible 5-nt loop. The secondary structure, the first spatial model of the NMR structure, and the structure predicted by pk3D are shown in Fig. 6A–C, respectively.
FIGURE 6.

The native secondary structure and tertiary structure of the core encapsidation signaling RNA of the Molney murine leukemia virus. (A) The native secondary structure. (B) The native tertiary structure taken from the first NMR model in the PDB databank (PDB 1S9S; http://www.wwpdb.org/). (C) The tertiary structure predicted by pk3D. The helices are numbered from 1 to 6, in the direction from the 5′ end to the 3′ end, and are colored in the order of red, green, blue, yellow, magenta, and cyan, respectively. The orange spheres in B show the positions of the phosphorus atoms in the first nucleotide G1 for all of the first 20 models given by the NMR experiments. The diverse positions demonstrate the experimentally observed large flexibility of the first helix. The gray segment in the upper-right region in B connecting the fourth and fifth helices shows the conformation of the bulge loop G62-A65 determined by the experiments.
The spatial arrangement of the last five helices in the measured and predicted structures is in general agreement. The position of the first helix in the predicted structure is different from that of the NMR measured model. This is due to the highly flexible nature of the loop that connects the first helix with the rest of the molecule. In fact, NMR measurement shows that the first helix has very flexible positions, and the different models of the structure, as deposited in the PDB databank, show that this helix can be located in a wide range of positions with respect to the other helices (D'Souza et al. 2004). The spatial position of the first helix predicted by pk3D is well within the experimentally measured range.
The orientation of the fifth helix (colored in magenta) is different for the experimentally measured and computationally predicted structures. In the NMR-measured structure, this helix is loosely stacked on the fourth helix (colored in yellow), and the central axes of these two helices form a large angle, apparently due to the intervening 4-nt bulge (Fig, 6A,B, G62–A65) between these two helices. In contrast, in the predicted structure, the fifth and the fourth helices are coaxially stacked closely together. This discrepancy is due to the fact that there is a competition between the favorable coaxial stacking energy bonus and the loop entropy. A flush coaxially stacked structure is favored by the stacking energy bonus, whereas the loosely stacked structure, as given by the NMR experiment, is consistent with the larger entropy of the bulge loop. This disparity between measured and calculated structures indicates the need to model accurately the delicate balance between these two energetic factors. Our algorithm will likely improve once the balance between these two factors is fine tuned.
Protein S15 binding fragment of 16S rRNA
In bacterial ribosomes, protein S15 binds to 16S rRNA and forms a key element required by the assembly of the small subunit of ribosome. This element is also important for the intersubunit association. The relevant rRNA fragment is a nonpseudoknotted structure with five helices (Fig. 7A, PDB 1DK1). An interesting feature of this structure is that it has a three-way junction, which is constrained by a conserved base triple and the associated stacking interactions, and is locked into place by magnesium ions and side chains from bound protein (Fig. 7B; Nikulin et al. 2000).
FIGURE 7.

The native secondary structure and tertiary structure of the protein S15 binding fragment of 16S rRNA. (A) Its native secondary structure. (B) Its native tertiary structure as observed in X-ray crystallography (PDB 1DK1; http://www.wwpdb.org/). The helices are numbered from 1 to 5 in the direction from the 5′ end to the 3′ end, and are colored in the order of magenta, green, yellow, blue, and cyan, respectively. The three-way junction is colored in red, which contains a base triple and the metal binding site. In addition, local strands in this junction are in the parallel direction instead of the canonical antiparallel direction. (C) The tertiary structure predicted by pk3D, plotted in the same color code as in B. The spatial arrangement of helices 3–5 are predicted correctly. The overall position of helix 1 is only roughly correct, tilted at a different angle.
The predicted spatial structure of this RNA molecule reproduces the spatial positions of all helices correctly, except helix-1 and helix-2 (Fig 7C, colored in magenta and green, respectively). The position of helix-1 in the predicted structure is only roughly correct, whereas helix-2 locates far away from its correct position. This discrepancy is not surprising, since the junction region involving helix-1 and helix-2 is stabilized by the combination of a base triple, magnesium ions, and bound protein (Nikulin et al. 2000). In addition, the chain is locally parallel in the junction region (Nikulin et al. 2000). None of these factors are accounted for explicitly in our model, or in any other RNA models used in existing RNA structure predictors.
Hepatitis delta virus ribozyme precursor
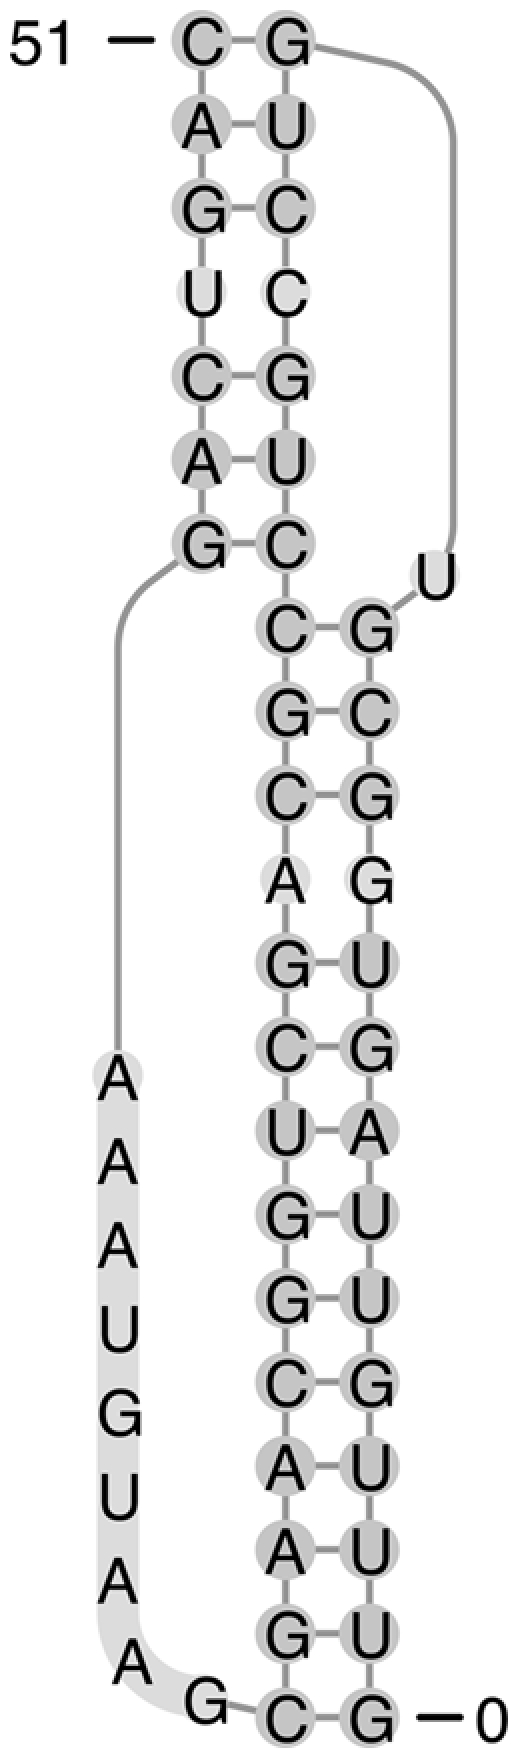
The HDV ribosome precursor is among the most complicated pseudoknotted RNA molecules discovered so far. Its secondary structure and three-dimensional structure obtained from X-ray crystallography (PDB 1SJ3) are shown in Figure 8, A and B, respectively. Its tertiary structure contains two long quasicontinuous double helices. The first consists of two coaxially stacked short helices, helices P1 and P1.1. The second also contains two coaxially stacked helices, P2 and P3. The two long, quasicontinuous helices are parallel to each other, and each resembles locally an H-type pseudoknotted structure. That is, each appears as a long, quasicontinuous pseudoknotted helix formed by one long, continuous strand and two separate shorter strands. In addition, a hairpin structure (P4) is loosely stacked on helix P1.1, rendering an extended long helix (P1 + P1.1 + P4) (Ke et al. 2004).
FIGURE 8.

The native secondary structure and tertiary structure of the hepatitis delta virus (HDV) ribozyme precursor. (A) Its native secondary structure. (B) The tertiary structure (PDB 1SJ3; http://www.wwpdb.org/). (C) The tertiary structure predicted by pk3D. The helices in B and C are colored in the same code. The loops are shown in orange dashed lines to illustrate chain connectivity. The structure generated by pk3D contains most features of the X-ray structure.
Out of the top 100 candidates, the pk3D correctly selected the native secondary structure as the optimal one, and at the same time predicted the spatial arrangement of the helices and the loops. Note that in this example, pk2D failed to find the native secondary structure automatically as a candidate. Therefore, we manually inserted the native secondary structure into the candidate list created by pk2D, to test the ability of pk3D to identify the native structure out of decoys and the ability to predict three-dimensional shapes. The overall predicted tertiary conformation is shown in Figure 8C. It can be seen that the structure generated by pk3D contains most features of the X-ray structure: the two quasicontinuous long helices are reproduced, and they consist of the same two shorter coaxially stacked helices as in the experimentally determined structure (P1 + P1.1, P2 + P3, respectively); plus, these two long helices are parallel to each other, also consistent with the experiments.
There were subtle, but important, structural features of this RNA molecule that were correctly predicted by pk3D. In the HDV ribozyme precursor, there were three zero-length loops in the secondary structure (see the Materials and Methods section for a detailed definition of the zero-length loops). Among these, loop-1 connects helices P1 and P1.1, loop-2,3 connects helices P2 and P3, and loop-1,3 connects helices P1 and P3 (Fig. 8A). pk3D correctly selected the first two interfaces and coaxially stacked the corresponding helices; it also correctly left the interface around loop-1,3 alone without stacking helices P1 and P3. The overall result was the formation of two long, quasicontinuous helices (P1 + P1.1, and P2 + P3) connected by a simple loop-1,3 of zero length (Fig. 8C); in excellent agreement with the X-ray structure.
The two nucleotides (C21 and C22) within the hairpin loop of helix P3 extend out and form base pairs with G38 and G39, thus forming the helix P1.1. It is likely that this interaction is important to hold the overall RNA structure together. The pk3D program correctly reproduced this structural feature as well.
There is a structural aspect that pk3D does not predict correctly, i.e., the orientation of helix P4. According to the X-ray structure, helix P4 is positioned on the top of helix P1.1, stabilized by a base triple (G61–C44–C41), a noncanonical base pair (A43–G62), and the nearby metal ion (Ke et al. 2004). The existence of base triples, noncanonical base pairs, and interactions between nucleotides and metal ions were not considered explicitly in our current model, therefore, this failure was not surprising. In pk3D, the connection between P4 and P1.1, and between P4 and P2 are modeled as a simple 4-nt loop and a 5-nt loop, respectively (Fig. 8A). These two loops lead to much more freedom of positioning and orienting helix P4.
Summary of the performance of pk3D in tertiary structure prediction
Overall, the pk3D algorithm can be used to generate approximate spatial arrangements of helices and loops, in addition to estimating the free energies of loops and predicting native secondary structures. The overall tertiary shape is often very similar to the native structure of RNA molecule, regardless of whether or not pseudoknots are present or not. It works especially well when the involved loops are short. These short loops impose significant constraints on the number of feasible conformations, as seen in the predicted structure of the hepatitis delta virus ribozyme precursor (PDB 1SJ3). Nevertheless, when the tertiary structure involves significant contributions from nonregular elements, such as base triples, noncanonical base pairs, metal ions, or bound proteins, the pk3D algorithm usually fails to produce an accurate three-dimensional structure. In fact, these complex factors present great challenges to all current efforts in predicting RNA structures.
Although in such cases the specific positions and orientations of the helices involved are inaccurate, the general arrangement of the overall structures may still be correct, as is the case of the core encapsidation signaling RNA (1S9S), the protein S15 binding fragment of 16S rRNA (1DK1), and the hepatitis delta virus ribozyme precursor (1SJ3). Although the three-dimensional shapes provided by pk3D are approximate in nature, they can be fairly close to native. These structures can be very useful, for example, in providing the initial seed conformations for further structure refinement. This task can be performed by using all-atom MD simulation packages, such as AMBER, Charmm, or Gromacs. It is expected that these close-to-native conformations would lead to a significant speed up of structure predictions.
Timing information
For the testing set of 43 small RNA pseudoknots used in this study, the computation time used by pk3D for searching the optimal arrangement for each candidate secondary structure usually finishes within 10−3 –10−2 sec on an AMD Opteron-256 CPU. However, the time complexity of the pk3D algorithm is not directly related to the length of the RNA chain. Rather, it is determined by the total length of the loops in the “link,” as defined in the Materials and Methods section. For structures with many long links, the computation time may take up to several tens of seconds to finish. This limits the current version of the pk3D program to small RNAs (< 150 nt), since longer chains are likely to have larger links. We expect that this problem can be solved by dividing a large link into several small segments based on the loop length pattern and treating them separately. These structural fragments are innerconnected only by short loops, and hence, are more rigid and likely to fold separately. Further development of pk3D for long-chain RNA molecules will be in our future work.
CONCLUSION
Calculating the free energy of RNA loops, especially that of pseudoknotted loops, is an important unsolved problem. We have developed a novel method called pk3D to address this problem. Our method is based on the physical consideration that the entropy of an RNA loop is largely determined by its loop length, the end-to-end distance of the helices connected by the loop, and the steric interference from nearby helices. To calculate the loop entropy, our method searches among all possible spatial arrangements of helical stems for the optimal structure, and then estimates the number of loop conformations for the optimal structure using a six-state discrete model and the sequential Monte Carlo method. The excluded volume effect is explicitly treated by the algorithm. Our method treats both nested and pseudoknotted loops within a unifying physical framework, regardless of how complex the pseudoknot might be.
We have also developed the pk2D method, which finds an approximately optimal combination of low energy nonconflicting helical stems for a given sequence. The list of secondary structures created by pk2D is used as input to pk3D for further free energy evaluation. The spatial arrangement of stems and loops with the lowest free energy is then predicted to be the native conformation of the RNA sequence.
We have tested the performance of pk2D/3D on a data set of 43 small RNA molecules with pseudoknots. The quality of the list of candidate secondary structures created by pk2D was good: on average, the best candidate among the list had a sensitivity higher than 90% and a PPV close to 90% in terms of base pairs. In this test, the ability of pk3D to select the native structure from a large number of decoys was slightly better than that of the extended Turner's free energy rule. In the blind test of predicting the secondary structures of these 43 RNA molecules from sequences, pk3D was found to have the best prediction results in terms of sensitivity and comparable PPV of correctly predicted base pairs, when compared with several existing pseudoknot prediction methods.
Perhaps the most important contribution of this work is that pk3D can frequently produce a generally useful coarse three-dimensional model of the native RNA structure. We found that the arrangement of stems and loops in three-dimensional space was generally similar to that of the native structure. This rough three-dimensional model is useful as a starting point for further structural refinement, as it provides a close-to-native physical structure. It is expected that refinements starting from pK3D predicted structures will benefit significantly as a result of accelerated folding and packing.
The weak point of the current version of pk3D is that it does not perform well on long sequences, since the computation time is determined by the total length of the loops in the “links,” whose size is likely to increase with the chain length. However, as discussed earlier, this problem can be solved by dividing the links into several smaller segments or domains. With this simplification, the algorithm can, in addition, incorporate aspects of kinetic folding of RNA molecules, which is likely to be very important for large RNAs (Flamm and Hofacker 2008).
MATERIALS AND METHODS
Definition of pseudoknots and H-type pseudoknots
An RNA structure is called pseudoknotted if it contains interleaved stem regions. Formally, if we denote a base pair as an ordered pair of positions of upstream and downstream positions (i, j), where i < j; a structure is nonpseudoknotted if and only if for all pairs (i, j) and (k, l), nowhere the relationship i < k < j < l holds; otherwise, the structure is called pseudoknotted (Ren et al. 2005).
We also need to define the H-type pseudoknot explicitly to facilitate the discussions in the text. The H-type pseudoknot in this study is referred to as a structure formed by base pairing between a hairpin loop and the exterior loop of another hairpin. It consists of two helical stems and two loops, as well as a possible third loop/junction that connects the two helical stems (Cao and Chen 2009). An H-type pseudoknot may also contain embedded substructures, such as hairpins, internal loops, bulges, or their combinations. Here, the H-type pseudoknot is solely defined in terms of its secondary structure, regardless of whether or not the involved helical stems form quasicontinuous helices in three-dimensional space. Our definition of the H-type pseudoknot is more general than that used by Cao and Chen (2009). However, it should be emphasized that the pk2D and pk3D algorithms are not restricted to H-type pseudoknots and their more general versions. In our study, pseudoknots of arbitrary complexity are treated in one unifying physical framework.
Data set
All of our testings were based on a data set of 43 pseudoknotted structures unless indicated otherwise. They were taken from the 50 small pseudoknotted RNAs by Zhao et al. (2008), with seven sequences removed. These were removed because all of them had a long unstructured 5′ loop of >13 nt length, which is unstable and can easily form internal structures within itself, or with another part of the RNA molecule. The corresponding native structures resolved in the databank may exist as a result of additional interactions with proteins or other molecules to form stable complexes. Therefore, it was not appropriate to include these sequences in testing the performance of structure prediction of single chain RNAs. These seven sequences are frameshifting-EIAV, frameshifting-PLRV-S, viral-tRNA-like-APLV, viral-tRNA-like-CGMMV, viral-tRNA-like-ORSV-S1, viral-tRNA-like-OYMV, and viral-tRNA-like-SBWMV1.
Generating the pool of stem regions
For a given sequence S with nucleotides ordered from 5′ to 3′, we used the Smith–Waterman dynamic programming algorithm for local alignment to align it with its reverse sequence S′, with the same nucleotides ordered from 3′ to 5′. Both Watson–Crick and wobble base pairings were considered matches. This generated all possible stems with energy scores below a given threshold.
Generate candidate secondary structures with pk2D
All of the computed stable stems were processed by the algorithm pk2D, which found solutions of multiple compatible stems with overall low energies. These solutions provided by pk2D formed a list of candidate secondary structures, each containing several nonconflicting stems. That is, no nucleotide in any stem appeared in another stem of the same secondary structure. Finding nonconflicting stems with overall lowest energy is a known difficult NP-complete problem (Akutsu 2000; Lyngsø and Pedersen 2000). Numerous methods have been developed to address this challenging problem, including dynamic programming based methods (Rivas and Eddy 1999; Dirks and Pierce 2003; Reeder et al. 2007), heuristic methods (Ruan et al. 2004; Ren et al. 2005; Chen et al. 2008), the Monte Carlo method (Isambert and Siggia 2000), methods based on genetic algorithm (van Batenburg et al. 1995), and the strategy that reformulates this problem into a combinatorial graph problem and solves it using the technique of tree decomposition (Zhao et al. 2008).
Here, we use an approximation algorithm to generate candidate secondary structures. The problem of finding all consistent sets of candidate stems can be formulated as an Integer Programming (IP) problem. The objective of the IP problem is to minimize the sum of the free energy contributed by each selected stem. The constraints of the IP problem are formulated to encode the nonconflicting condition between the selected stems. We have adapted a method originally developed for protein structural alignment by Dundas et al. (2007) to solve this IP problem. This approach is based on an approximation algorithm for scheduling split interval graphs (Bar-Yehuda et al. 2002).
An approximate solution of the IP problem can be found by an iterative process, where the IP problem is first relaxed into a linear programming (LP) problem and solved using the commercial LP package BPMPD (Meszaros 1996). A conflict graph, G = (V, E), is then constructed where vertex vi represents stem i. An edge ei,j is drawn between two vertices, vi and vj, if the two corresponding stems are in conflict. Each vertex is assigned three values. The first value is the free energy of the stem σi. The second value xi is equal to the corresponding output from the LP solution. The third value is called the local conflict number:
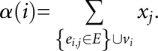 |
The vertex k with the minimum local conflict number αk is then identified. A new free energy score σinew = σi − σk is then assigned to vk and to all vertices that share an edge with vk. After this update, all vertices with σ ≤ 0 are pushed onto a stack S, and are removed from further consideration. A new LP problem is subsequently formulated using the remaining vertices. This process is iterated until all vertices have been pushed onto the stack.
Vertices on the stack are then continuously popped. The first popped vertex forms the candidate set of compatible stems. A subsequently popped vertex is then inserted into each existing candidate set if it does not cause conflict with stems already in the set. In addition, a new candidate set is formed with the currently popped vertex as the sole member. This process is repeated until all vertices are popped from the stack.
The above procedure is another version of the maximum weight independent set problem (Binkowski et al. 2004; Dundas et al. 2007). The set created by the first popped vertex is guaranteed to be within a factor of 1/2.89 from the optimal solution.
The candidate secondary structures generated by pk2D are ranked by the sum of stem energies, estimated by the standard Turner's energy rules. Note that the free energy contributions from loops are neglected temporarily at this stage, as they will be treated within a physical framework in pk3D. The top 500 secondary structures serve as the set of candidates for more accurate further free energy estimation. The overall procedure of pk2D is shown in Fig. 9A.
FIGURE 9.

The flow chart of the (A) pk2D and (B) pk3D algorithms.
Generating RNA conformations by growth using pk3D
The free energies of the secondary structures provided by pk2D are further estimated by incorporating loop entropies. Pk3D calculates the free energy for each candidate secondary structure based on the corresponding three-dimensional conformations, which are generated automatically using a growth method. The procedures are as follows:
Finding the link
For each secondary structure, its link is defined as the set of n −1 loops that connects all the n stems in the secondary structure, such that the overall length of the loops belonging to the link is the shortest. Recall that a stem may have as many as four loops. An example is shown in Figure 10, which depicts the secondary structure of the hepatitis delta virus (HDV) ribozyme precursor and its corresponding graph representation. Note that in our method we have generalized the concept of loops to include the special case when two stems are directly connected; the junction between these two stems is called a zero-length loop. The reason for this generalization is that, although its length is zero, it can lead to different relative spatial orientations between two involved helices, similar to the loops of nonzero length. The zero-length and non-zero-length loops are, therefore, treated in the same way in pk3D. In Figure 10, the loops plotted as thick, curved line segments define the link, which contains three zero-length loops and one loop of length 4. The overall length of the loops contained in the link is, therefore, 4. The usage of the link is inspired by the work described by Kopeikin and Chen (2006).
FIGURE 10.

(A) The secondary structure of the hepatitis delta virus ribozyme precursor and (B) its graph representation. The vertices in the graph correspond to helical stems and the edges correspond to loops. The weights of the edges are set to the lengths of the corresponding loops. Note that this graph is not in metric graph.
Since the number of stems (or vertices in the graph representation) in the RNA pseudoknots is small (usually, 4–8), we use a heuristic method to find the link for a given secondary structure. Although a heuristic method cannot guarantee an optimal solution, it works well in practice for small graphs. We first select the shortest loop, so the two stems at both ends are connected as one component. We then iteratively select the next shortest loop if it adds a new stem to the set of components that has been generated so far. This is repeated until n −1 loops are chosen, and all components are merged into one. For the candidate secondary structures generated for this data set of 43 RNA molecules, n is, typically, between 4 and 8.
Generating three-dimensional structures
After the link is identified, we generate the corresponding three-dimensional structures or conformations of the RNA molecule. This is accomplished by sequentially enumerating all possible conformations for loops (typically, with length <7) in the link using a six-state discrete model (Zhang et al. 2008) and by spatially arranging the connected stems in all six possible orientations, followed by selecting those that are physically plausible (e.g., without sharp turns). We start with the shortest loop. After spatially adding the connecting stem to this loop at all possible orientations (typically, two or four feasible out of all six), we continue by generating all possible conformations for the loop of the next shortest length.
During this process, whenever a new stem is added to a partial conformation, or when two partial components are merged, we examine if steric collisions occur and if the lengths of loops connecting this new stem to stems already added are sufficiently long to accommodate them spatially. For example, a loop length of 0 or 1 cannot extend in space to connect stems that are distant from each other. This examination usually rules out thousands of infeasible conformations.
This process is repeated until all stems are added and merged into one component. Altogether, we have theoretically 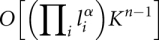 number of spatial conformations, where li is the length of the ith loop, and α is the scaling exponent for the number of loops with loop length li, which is estimated to be between 3 and 5 (Zhang et al. 2008). K is the number of the possible orientations of a stem when connected to an end of a loop. Typically, K = 2 or K = 4, and n − 1 is the number of loops in the link. In practice, because of the strong constraints of the loops and excluded volume effect, the number of feasible conformations is substantially smaller than this bound. Among the candidate secondary structures, about 90% are found to be spatially infeasible after simple examinations, and are eliminated from further considerations at very early stages.
Speeding up with look-up tables
In the current implementation, the number of conformations for each loop is solely determined by the loop length. To improve the runtime efficiency, we pre-compute the conformations of loops with lengths between 0 and 7, recording the starting and ending positions of each loop in a look-up table for loop conformations. This table can be further improved by introducing sequence-dependent information, which will be in our future work.
Further free energy estimation
For each spatial conformation constructed by pk3D, its free energy is calculated as the sum of the free energy of stems and loops. The substructures are divided into two groups and treated differently in pk3D. The first group contains stem, hairpin, bulge, and short internal loops (≤ 4 nt). The free energies of these substructures are calculated straightforwardly using Turner's energy rules. The second group consists of all the other loops, including the longer internal loops, all multibranch loops, and all pseudoknotted loops, whose physical models are explicitly constructed by pk3D through sequential Monte Carlo sampling. Based on the examination of the top 500 candidates for each of 43 sequences used in this study, we found that 75%–80% loops belong to the second group. Simple hairpin, bulge, and short internal loops only count for ∼20%. Therefore, the majority of the loops are treated by our new free energy calculation scheme. We also did another test in which both groups were treated by our new scheme. We found that the performance is still good, although there is a slight deterioration. The reason is that the loop entropy calculated by our new scheme is close to the empirical value from Turner's energy rule, as shown in our previous work (Zhang et al. 2008). In the current implementation, we treat two groups differently.
The model for the loop free energy calculation in pk3D is based on several physical assumptions. First, the enthalpy component is assumed to be zero. Second, as a first-order approximation, the loop entropy is assumed to be determined by its length and the end-to-end distance, which is determined by the connected helices. The volume exclusion effect between monomers within a loop is also explicitly accounted for. To improve the runtime efficiency, an entropy table is pre-built, with each entry indexed by a loop length and an end-to-end distance. Therefore, the entropy of a loop, regardless of whether or not it belongs to a pseudoknotted or nested structure, is indexed by these two parameters. The entropy value is calculated by estimating the fraction of the number of conformations of the closed loop over the number of conformations of the random coil of the same length using a six-state discrete model through sequential Monte Carlo sampling. This approach is described in more detail in our previous publications (Zhang et al. 2003, 2007; Lin et al. 2008a,b; Zhang et al. 2008). This strategy of calculating loop entropy treats both nested and pseudoknotted loops in a unified physical framework, regardless of how complex the structures are.
The excluded volume effect between helices and that between nucleic acids with the same loop are accounted for explicitly. Nevertheless, the excluded volume effects between stems and loops are not fully considered. The only reason for this is to improve performance. Although it can be accounted for explicitly and rigorously in our model, its incorporation will significantly decrease the runtime efficiency, as it is difficult to pre-build a template, and hence, a look-up table for all different types of combinations of loops and stems, and therefore, they have to be computed on the fly. In our current implementation, this excluded volume effect is partially represented by the sampled three-dimensional structural models when building the entropy look-up table, although detailed excluded volume effect specific to an individual candidate secondary structure are not yet taken into account. The excluded volume effects between different loops are of minor contribution to the overall free energy, hence, can be ignored without much consequence (Cao and Chen 2009).
Coaxial stacking can make important contributions to the overall stability of RNA molecules. An advantage of pk3D is that this effect can be modeled in a straightforward fashion, since the spatial arrangements among stems are generated explicitly. Specifically, when the head of stem A is close to the end of stem B, we find the location of the center cA and the normal vector nA of the base plane at the head of stem A, and the similarly defined cB and nB for stem B. Define Δ c = cB − cA as the intercenter vector pointing from cA to cB. Stems A and B are coaxially stacked if the length of Δc < 6 Å, and at the same time the angle between nA and nB, between Δ c and nA, and between Δ c and nB are all smaller than 30°. These criteria are slightly different from that proposed by Tyagi and Mathews (2007). When two stems are found to be coaxially stacked, the stacking free energy bonus is calculated using the parameter from Turner's rule as if the helix were uninterrupted.
For each secondary structure, pk3D generates many three-dimensionally feasible conformations and these conformations may have different stacking patterns in the loop/junction region. When multiple conformations are found, the conformation with the lowest estimated free energy is chosen as the representative three-dimensional structure, whose free energy is assigned to the corresponding secondary structure. The secondary structure in the candidate list with the lowest assigned free energy is then predicted to be the native secondary structure of the RNA molecule, and the associated three-dimensional conformation is assumed to be the native conformation. This predicted tertiary conformation could serve as a good starting point for further structure refinement. The overall procedure of pk3D is shown in Figure 9B.
Calculation of the sensitivity and PPV
We use real positive (RP) to denote the number of base pairs in the real structure; true positive (TP) to denote the number of correctly predicted base pairs; and false positive (FP) to denote the number of predicted base pairs that do not exist in the real structure. The sensitivity (SE) of the prediction of an algorithm is defined as TP/RP; the PPV is defined as TP/(TP + FP), and the F value is defined as (2 · SE · PPV)/(SE + PPV) (Mathews et al. 1999). We use the term “accuracy” to summarize performance in both sensitivity and PPV. The terms “lowest SE” and “lowest PPV” are defined as the SE and PPV of the structure that has the lowest calculated free energy, respectively. The terms “best SE” and “best PPV” are the SE and PPV of the candidate that is closest to true native structure, respectively, with the “closeness” measured by the F value.
ACKNOWLEDGMENTS
This work is supported by grants from the U.S. National Science Foundation (DMS-0800183 and DMS-0800257), National Institute of Health (GM68958 and GM079804), and Office of Naval Research (N00014-06-1-0100). J.Z. and W.W. acknowledge the National Natural Science Foundation of China (90403120, 10504012, and 10704033) and the National Basic Research Program of China (2006CB910302) for funding. This research is supported in part by the Project of Knowledge Innovation Program (PKIP) of the Chinese Academy of Sciences, Grant No. KJCX2.YW.W10. We also acknowledge the Shanghai Supercomputer Center for providing computing resources.
Footnotes
Article published online ahead of print. Article and publication date are at http://www.rnajournal.org/cgi/doi/10.1261/rna.1723609.
REFERENCES
- Aalberts DP, Hodas NO. Asymmetry in RNA pseudoknots: Observation and theory. Nucleic Acids Res. 2005;33:2210–2214. doi: 10.1093/nar/gki508. [DOI] [PMC free article] [PubMed] [Google Scholar]
- Akutsu T. Dynamic programming algorithms for RNA secondary structure prediction with pseudoknots. Discrete Appl Math. 2000;104:45–52. [Google Scholar]
- Andronescu M, Condon A, Hoos HH, Mathews DH, Murphy KP. Efficient parameter estimation for RNA secondary structure prediction. Bioinformatics. 2007;23:i19–i28. doi: 10.1093/bioinformatics/btm223. [DOI] [PubMed] [Google Scholar]
- Bar-Yehuda R, Halldorsson MM, Naor J, Shacknai H, Shapira I. Scheduling split intervals. 14th ACM-SIAM Symposium on Discrete Algorithms; 2002. pp. 732–741. [Google Scholar]
- Binkowski TA, DasGupta B, Liang J. Order independent structural alignment of circularly permuted proteins. Conf Proc IEEE Eng Med Biol Soc. 2004;4:2781–2784. doi: 10.1109/IEMBS.2004.1403795. [DOI] [PubMed] [Google Scholar]
- Brion P, Westhof E. Hierarchy and dynamics of RNA folding. Annu Rev Biophys Biomol Struct. 1997;26:113–137. doi: 10.1146/annurev.biophys.26.1.113. [DOI] [PubMed] [Google Scholar]
- Cao S, Chen SJ. Predicting RNA pseudoknot folding thermodynamics. Nucleic Acids Res. 2006;34:2634–2652. doi: 10.1093/nar/gkl346. [DOI] [PMC free article] [PubMed] [Google Scholar]
- Cao S, Chen SJ. Predicting structures and stabilities for H-type pseudoknots with interhelix loops. RNA. 2009;15:696–706. doi: 10.1261/rna.1429009. [DOI] [PMC free article] [PubMed] [Google Scholar]
- Chen SJ. RNA folding: Conformational statistics, folding kinetics, and ion electrostatics. Annv. Rev. Biophys. 2008;37:197–214. doi: 10.1146/annurev.biophys.37.032807.125957. [DOI] [PMC free article] [PubMed] [Google Scholar]
- Chen X, He S, Bu D, Zhang F, Wang Z, Chen R, Gao W. FlexStem: Improving predictions of RNA secondary structures with pseudoknots by reducing the search space. Bioinformatics. 2008;24:1994–2001. doi: 10.1093/bioinformatics/btn327. [DOI] [PubMed] [Google Scholar]
- D'Souza V, Dey A, Habib D, Summers MF. NMR structure of the 101-nucleotide core encapsidation signal of the Moloney murine leukemia virus. J Mol Biol. 2004;337:427–442. doi: 10.1016/j.jmb.2004.01.037. [DOI] [PubMed] [Google Scholar]
- Dirks RM, Pierce NA. A partition function algorithm for nucleic acid secondary structure including pseudoknots. J Comput Chem. 2003;24:1664–1677. doi: 10.1002/jcc.10296. [DOI] [PubMed] [Google Scholar]
- Do CB, Woods DA, Batzoglou S. CONTRAfold: RNA secondary structure prediction without physics-based models. Bioinformatics. 2006;22:e90–e98. doi: 10.1093/bioinformatics/btl246. [DOI] [PubMed] [Google Scholar]
- Doshi KJ, Cannone JJ, Cobaugh CW, Gutell RR. Evaluation of the suitability of free-energy minimization using nearest-neighbor energy parameters for RNA secondary structure prediction. BMC Bioinformatics. 2004;5:105. doi: 10.1186/1471-2105-5-105. [DOI] [PMC free article] [PubMed] [Google Scholar]
- Dundas J, Binkowski T, DasGupta B, Liang J. Topology independent protein structural alignment. BMC Bioinformatics. 2007;8:388. doi: 10.1186/1471-2105-8-388. [DOI] [PMC free article] [PubMed] [Google Scholar]
- Flamm C, Hofacker IL. Beyond energy minimization: Approaches to the kinetic folding of RNA. Monatsh Chem. 2008;139:447–457. [Google Scholar]
- Gan HH, Pasquali S, Schlick T. Exploring the repertoire of RNA secondary motifs using graph theory; implications for RNA design. Nucleic Acids Res. 2003;31:2926–2943. doi: 10.1093/nar/gkg365. [DOI] [PMC free article] [PubMed] [Google Scholar]
- Gardner PP, Giegerich R. A comprehensive comparison of comparative RNA structure prediction approaches. BMC Bioinformatics. 2004;5:140. doi: 10.1186/1471-2105-5-140. [DOI] [PMC free article] [PubMed] [Google Scholar]
- Gesteland RF, Cech TR, Atkins JF, editors. The RNA world. 3rd ed. Cold Spring Harbor Press; Cold Spring Harbor, NY: 2006. [Google Scholar]
- Gonzalez-Diaz H, Aguero-Chapin G, Varona J, Molina R, Delogu G, Santana L, Uriarte E, Podda G. 2D-RNA-coupling numbers: A new computational chemistry approach to link secondary structure topology with biological function. J Comput Chem. 2007;28:1049–1056. doi: 10.1002/jcc.20576. [DOI] [PubMed] [Google Scholar]
- Gultyaev AP, van Batenburg FH, Pleij CW. An approximation of loop free energy values of RNA H-pseudoknots. RNA. 1999;5:609–617. doi: 10.1017/s135583829998189x. [DOI] [PMC free article] [PubMed] [Google Scholar]
- Hofacker IL, Fontana W, Stadler PF, Bonhoeffer S, Tacker M, Schuster P. Fast folding and comparison of RNA secondary structures. Monatshefte Chemie. 1994;125:167–188. [Google Scholar]
- Isambert H, Siggia ED. Modeling RNA folding paths with pseudoknots: Application to hepatitis delta virus ribozyme. Proc Natl Acad Sci. 2000;97:6515–6520. doi: 10.1073/pnas.110533697. [DOI] [PMC free article] [PubMed] [Google Scholar]
- Ke A, Zhou K, Ding F, Cate JHD, Doudna JA. A conformational switch controls hepatitis delta virus ribozyme catalysis. Nature. 2004;429:201–205. doi: 10.1038/nature02522. [DOI] [PubMed] [Google Scholar]
- Kopeikin Z, Chen SJ. Statistical thermodynamics for chain molecules with simple RNA tertiary contacts. J Chem Phys. 2005;122:094909. doi: 10.1063/1.1857831. [DOI] [PMC free article] [PubMed] [Google Scholar]
- Kopeikin Z, Chen SJ. Folding thermodynamics of pseudoknotted chain conformations. J Chem Phys. 2006;124:154903. doi: 10.1063/1.2188940. [DOI] [PMC free article] [PubMed] [Google Scholar]
- Lin M, Chen R, Liang J. Statistical geometry of lattice chain polymers with voids of defined shapes: Sampling with strong constraints. J Chem Phys. 2008a;128:084903. doi: 10.1063/1.2831905. [DOI] [PMC free article] [PubMed] [Google Scholar]
- Lin M, Lu HM, Che R, Liang J. Generating properly weighted ensemble of conformations of proteins from sparse or indirect distance constraints. J Chem Phys. 2008b;129:094101. doi: 10.1063/1.2968605. [DOI] [PMC free article] [PubMed] [Google Scholar]
- Lucas A, Dill KA. Statistical mechanics of pseudoknot polymers. J Chem Phys. 2003;119:2414–2421. [Google Scholar]
- Lyngsø RB, Pedersen CNS. RNA pseudoknot prediction in energy-based models. J Comput Biol. 2000;7:409–427. doi: 10.1089/106652700750050862. [DOI] [PubMed] [Google Scholar]
- Mathews DH, Sabina J, Zuker M, Turner DH. Expanded sequence dependence of thermodynamic parameters improves prediction of RNA secondary structure. J Mol Biol. 1999;288:911–940. doi: 10.1006/jmbi.1999.2700. [DOI] [PubMed] [Google Scholar]
- Mathews DH, Disney MD, Childs JL, Schroeder SJ, Zuker M, Turner DH. Incorporating chemical modification constraints into a dynamic programming algorithm for prediction of RNA secondary structure. Proc Natl Acad Sci. 2004;101:7287–7292. doi: 10.1073/pnas.0401799101. [DOI] [PMC free article] [PubMed] [Google Scholar]
- Meszaros C. Fast Cholesky factorization for interior point methods of linear programming. Comput Math Appl. 1996;31:49–51. [Google Scholar]
- Nikulin A, Serganov A, Ennifar E, Tishchenko S, Nevskaya N, Shepard W, Portier C, Garber M, Ehresmann B, Ehresmann C, et al. Crystal structure of the S15–rRNA complex. Nat Struct Biol. 2000;7:273–277. doi: 10.1038/74028. [DOI] [PubMed] [Google Scholar]
- Parisien M, Major F. The MC-Fold and MC-Sym pipeline infers RNA structure from sequence data. Nature. 2008;452:51–55. doi: 10.1038/nature06684. [DOI] [PubMed] [Google Scholar]
- Reeder J, Steffen P, Giegerich R. pknotsRG: RNA pseudoknot folding including near-optimal structures and sliding windows. Nucleic Acids Res. 2007;35:W320–W324. doi: 10.1093/nar/gkm258. [DOI] [PMC free article] [PubMed] [Google Scholar]
- Ren J, Rastegari B, Condon A, Hoos HH. HotKnots: Heuristic prediction of RNA secondary structures including pseudoknots. RNA. 2005;11:1494–1504. doi: 10.1261/rna.7284905. [DOI] [PMC free article] [PubMed] [Google Scholar]
- Rivas E, Eddy SR. A dynamic programming algorithm for RNA structure prediction including pseudoknots. J Mol Biol. 1999;285:2053–2068. doi: 10.1006/jmbi.1998.2436. [DOI] [PubMed] [Google Scholar]
- Ruan J, Stormo GD, Zhang W. An interated loop matching approach to the prediction of RNA secondary structures with pseudoknots. Bioinformatics. 2004;20:58–66. doi: 10.1093/bioinformatics/btg373. [DOI] [PubMed] [Google Scholar]
- Serra MJ, Turner DH, Freier SM. Predicting thermodynamic properties of RNA. Methods Enzymol. 1995;259:243–261. doi: 10.1016/0076-6879(95)59047-1. [DOI] [PubMed] [Google Scholar]
- Shapiro BA, Yingling YG, Kasprzak W, Bindewald E. Bridging the gap in RNA structure prediction. Curr Opin Struct Biol. 2007;17:157–165. doi: 10.1016/j.sbi.2007.03.001. [DOI] [PubMed] [Google Scholar]
- Tinoco I, Uhlenbeck OC, Levine MD. Estimation of secondary structure in ribonucleic acids. Nature. 1971;230:363–367. doi: 10.1038/230362a0. [DOI] [PubMed] [Google Scholar]
- Tyagi R, Mathews DH. Predicting helical coaxial stacking in RNA multibranch loops. RNA. 2007;13:939–951. doi: 10.1261/rna.305307. [DOI] [PMC free article] [PubMed] [Google Scholar]
- van Batenburg FHD, Gultyaev AP, Pleij CWA. An APL-programmed genetic algorithm for the prediction of RNA secondary structure. J Theor Biol. 1995;174:269–280. doi: 10.1006/jtbi.1995.0098. [DOI] [PubMed] [Google Scholar]
- Xia T, SantaLucia J, Jr, Burkard ME, Kierzek R, Schroeder SJ, Jiao X, Cox C, Turner DH. Thermodynamic parameters for an expanded nearest-neighbor model for formation of RNA duplexes with Watson–Crick base pairs. Biochemistry. 1998;37:14719–14735. doi: 10.1021/bi9809425. [DOI] [PubMed] [Google Scholar]
- Zhang JF, Chen R, Tang C, Liang J. Origin of scaling behavior of protein packing density: A sequential Monte Carlo study of compact long chain polymers. J Chem Phsy. 2003;118:6102–6109. [Google Scholar]
- Zhang JF, Lin M, Chen R, Liang J, Liu J. Monte Carlo sampling of near-native structures of proteins with applications. Proteins. 2007;66:61–68. doi: 10.1002/prot.21203. [DOI] [PubMed] [Google Scholar]
- Zhang J, Lin M, Chen R, Wang W, Liang J. Discrete state model and accurate estimation of loop entropy of RNA secondary structures. J Chem Phys. 2008;128:125107. doi: 10.1063/1.2895050. [DOI] [PMC free article] [PubMed] [Google Scholar]
- Zhao J, Malmberg RL, Cai L. Rapid ab initio prediction of RNA pseudoknots via graph tree decomposition. J Math Biol. 2008;56:145–159. doi: 10.1007/s00285-007-0124-4. [DOI] [PubMed] [Google Scholar]
- Zuker M. Mfold web server for nucleic acid folding and hybridization prediction. Nucleic Acids Res. 2003;31:3406–3415. doi: 10.1093/nar/gkg595. [DOI] [PMC free article] [PubMed] [Google Scholar]