

Abstract
Background and purpose:
γ-Secretase inhibitors (GSIs) block NOTCH receptor cleavage and pathway activation and have been under clinical evaluation for the treatment of malignancies such as T-cell acute lymphoblastic leukaemia (T-ALL). The ability of GSIs to decrease T-ALL cell viability in vitro is a slow process requiring >8 days, however, such treatment durations are not well tolerated in vivo. Here we study GSI's effect on tumour and normal cellular processes to optimize dosing regimens for anti-tumour efficacy.
Experimental approach:
Inhibition of the Notch pathway in mouse intestinal epithelium was used to evaluate the effect of GSIs and guide the design of dosing regimens for xenograft models. Serum Aβ40 and Notch target gene modulation in tumours were used to evaluate the degree and duration of target inhibition. Pharmacokinetic and pharmacodynamic correlations with biochemical, immunohistochemical and profiling data were used to demonstrate GSI mechanism of action in xenograft tumours.
Key results:
Three days of >70% Notch pathway inhibition was sufficient to provide an anti-tumour effect and was well tolerated. GSI-induced conversion of mouse epithelial cells to a secretory lineage was time- and dose-dependent. Anti-tumour efficacy was associated with cell cycle arrest and apoptosis that was in part due to Notch-dependent regulation of mitochondrial homeostasis.
Conclusions and implications:
Intermittent but potent inhibition of Notch signalling is sufficient for anti-tumour efficacy in these T-ALL models. These findings provide support for the use of GSI in Notch-dependent malignancies and that clinical benefits may be derived from transient but potent inhibition of Notch.
Keywords: γ-secretase inhibitor, Notch, T-ALL, mitochondria, apoptosis
Introduction
Under normal physiological conditions, NOTCH receptors are activated by ligand binding and subsequent proteolytic cleavage events (Schroeter et al., 1998). The second cleavage event, mediated by γ-secretase, releases the intracellular domain of NOTCH (ICN). ICN then translocates to the nucleus where it binds to the transcription factor CSL (also called Rbpj or CBF-1) and modulates expression of NOTCH target genes (e.g. HES1, DTX1 and MYC) (Schroeter et al., 1998; Mumm et al., 2000; Palomero et al., 2006; Sharma et al., 2006; Weng et al., 2006). The ability of Notch to directly and indirectly regulate gene expression allows it to control context-dependent cell differentiation (Bolos et al., 2007; Krejci et al., 2009). In the intestine, Notch signalling (primarily NOTCH1 and NOTCH2) is known to regulate differentiation of intestinal crypt cells, and γ-secretase inhibitors (GSIs) have been shown to increase the presence of secretory intestinal epithelial cells in mice (van Es et al., 2005; Fre et al., 2005; Stanger et al., 2005; Zecchini et al., 2005, Riccio et al., 2008; Okamoto et al., 2009).
While the Notch pathway plays a critical role in normal cell development, it is deregulated by several mechanisms in solid tumours such as breast, lung and glioma (Pece et al., 2004; Haruki et al., 2005; Purow et al., 2005; Palomero et al., 2006), and in T-cell acute lymphoblastic leukaemia (T-ALL) where 50% of patients harbour NOTCH1 activating mutations (Weng et al., 2004). In T-ALL, NOTCH1 mutation status has also been evaluated as a prognostic marker for response to treatment (Breit et al., 2006; Zhu et al., 2006; van Grotel et al., 2008; see Meijerink et al., 2009). NOTCH1 mutations in the receptor heterodimerization domain induce ligand-independent signalling, while C-terminal mutations confer increased ICN half-life due to deletion of the PEST domain, which normally targets the protein for ubiquitin-mediated proteolysis (Weng et al., 2004). In T-ALL cells, it has been shown that GSIs modulate genes that regulate a variety of biological processes (e.g. transcription, translation, amino acid metabolism and mitochondrial biosynthesis) associated with cell growth (Palomero et al., 2006; Margolin et al., 2009).
We previously demonstrated that the GSI, MRK-003, can induce NOTCH1-mediated cell cycle arrest and apoptosis in several human T-ALL cell lines (Lewis et al., 2007). These results were in accord with other studies utilizing different GSIs in both engineered mouse cell lines and human T-ALL cell lines (Weng et al., 2003; Palomero et al., 2006; O'Neil et al., 2007; Keersmaecker et al., 2008). We have recently shown that T-ALL cells treated with a GSI in vitro for 2 days showed cell cycle exit and provided a durable response when measured on day 8 (Rao et al., 2009). Here we demonstrate that while continuous, and near complete, pathway inhibition resulted in an anti-tumour effect, daily dosing apparently induced an unwanted side effect, differentiation of colon proliferating epithelium to secretory epithelial cells and weight loss. This can be largely circumvented by an intermittent dosing regimen that is both well tolerated and effective. Our in vivo results suggest a rationale for intermittent dosing of GSIs in ongoing clinical trials. Together these data suggest that GSIs may be useful in treating Notch-dependent cancers such as T-ALL and that continuous GSI treatment may not be required to provide good anti-tumour effects. These in vivo models also provide insight on how to maximize anti-tumour efficacy while minimizing effects on other Notch-dependent processes. We also provide support for the role of the Notch pathway as an anti-apoptotic survival factor in leukaemia cells both in vitro and in vivo.
Methods
Preclinical models of T-ALL
All animal care and experimental procedures were performed according to protocols approved by Institutional Animal Care and Use Committee of Merck Research Laboratories, Boston. TALL-1, DND-41, ALL-SIL and CCRF-HSB-2 cells were cultured, centrifuged, and the cells resuspended in 50% phosphate buffer saline (PBS) : 50% Matrigel (Fisher Scientific, Pittsburgh, PA, USA). To develop subcutaneous xenograft models, CD1 nu/nu mice (Charles River Laboratories, Wilmington, MA, USA) were dosed with 100 mg·kg−1 of cyclophosphamide (Sigma, St Louis, MO, USA, #C0768-1G) i.p. 3–4 days prior to TALL-1 cell inoculation. No cyclophosphamide treatment was necessary for DND-41 tumour growth. Cells (8 × 10⁶ cells per 100 µL) were injected into the left flank subcutaneous space of 4–6-week-old female CD1 nu/nu or SCID-NOD mice (Charles River Laboratories), and tumour growth was monitored twice weekly. To develop orthotopic xenograft models, 5 × 10⁶ cells were implanted i.p., or 2 × 10⁶ cells were injected into the tail vein of CD1 nu/nu mice. Tumour burden was evaluated by counting cells in peripheral fluid and blood up to 4 months after the tumour cell implantation.
In vivo experiments
Tumour-bearing mice were randomized to dose groups (n= 10) of equal average tumour volume. GSI in 0.5% methyl cellulose (vehicle) was given orally using a mouse gavage feeding needle (22-gauge). Tumour size was measured by callipers, and body weights were recorded biweekly. Mice were killed using CO2 at various time points after dosing, and blood was collected via cardiac puncture and processed for plasma pharmacokinetics and assay of plasma levels of the amyloid β peptide (Aβ40). Tumours were snap frozen in liquid nitrogen for biochemical analysis, and tumours and duodenum were fixed in 10% neutral buffered formalin for immunohistochemical analysis.
Measurement of Aβ40
Aβ40 levels in mouse plasma were measured as previously described (Best et al., 2005; Plentz et al., 2009) with the following modifications. Biotinylated 4G8 antibody (Covance, Richmond, CA, USA) was incubated at room temperature for 3 h. Plasma (50 µL) was incubated with ruthenium-labelled G210 (Strategic Biosolutions, Newark, DE, USA) overnight at 4°C. No blocking steps were performed.
Pharmacokinetic analysis
Blood was collected via cardiac puncture, and approximately 800 µL of blood was transferred into a microvial containing either heparin or EDTA as an anticoagulant. The blood was then centrifuged, and plasma was collected and transferred into a 96-well plate for pharmacokinetic analysis. The GSI (MRK-003) concentrations in mouse plasma and tumour lysates (as described above) were analysed by high-pressure liquid chromatography (HPLC) using Cohesive Technologies pump and auto-sampler (Thermo Scientific, Franklin, MA, USA) equipped with a reversed-phase column (Atlantis C18, 3 µm, 3 × 20 mm, Waters Corp., Milford, MA, USA) and linear water/ACN gradient (5–90% organic in 3 min) containing 0.1% formic acid at a flow rate of 850 µL·min−1. The effluent from the HPLC column was introduced into a Sciex API 4000 triple quadrupole mass spectrometer (Thornhill, Ontario, Canada) via the Turbo V ion source interface. Mass spectrometric analysis was performed in the positive ionization mode with the ion spray voltage set at 5 kV. The precursor [M+H]+/product ion MS/MS transitions selected to monitor were m/z 552.1/220.7 for GSI and 535.2/344.9 for the internal standard. The protonated molecules were fragmented by collision-induced dissociation with nitrogen as a collision gas. The collision energy voltage was set at 35 V and 48 V for GSI and internal standard respectively. The data were acquired and processed by Analyst 1.4.1 software (AB/MDS Sciex).
Immunohistochemical analysis
Formalin-fixed paraffin-embedded tissues were sectioned at 5 µm thickness. Antigen retrieval was performed using EZ antigen retrieval 3 solution (Biogenex, San Ramon, CA, USA) for Ki67 and activated caspase-3, and Target Retrieval Solution (Dako Cytomation, Glostrup, Denmark) for HES1 as specified by the manufacturer. Sections were incubated in rabbit anti-Ki67 (1:200, clone SP6, Neomarkers, Fremont, CA, USA), rabbit anti-activated caspase-3 (1:200, Cell Signaling Technologies, Danvers, MA, USA) or rat anti-HES1 antibody (2 µg·mL−1, clone NM1, MBL International, Woborn, MA, USA). Samples were incubated for 30 min with Rabbit Impress Kit (Vector Laboratories, Burlingame, CA, USA) for Ki67, biotinylated goat anti-rabbit IgG for 1 h (0.5 µg·mL−1, Jackson ImmunoResearch Laboratories, West Grove, PA, USA) and labelled with Vectastain Elite ABC Kit (Vector Laboratories) for activated caspase-3, biotinylated goat anti-rat for 1 h (1:3000, Chemicon International, Billerica, MA, USA) and TSA-HRP Kit (Kit #21, Invitrogen) for Hes1. Cellular apoptosis was evaluated by TUNEL staining (Apoptag peroxidase, Chemicon) following the manufacturer's protocol. Periodic acid Schiff (PAS) staining of mouse duodenum was conducted as previously described (van Es et al., 2005). Immunostaining was visualized with DAB Kit (Vector Laboratories) and counterstained with Gills 2× haematoxylin.
Quantitative polymerase chain reaction (qPCR) and mRNA microarray expression analysis
Cells or animals were treated with GSI for the times and doses indicated. Tumour samples for RNA analysis were snap frozen in 1 mL of Triazol (Invitrogen, Eugene, OR, USA) per 100 mg of tissue. RNA extraction, processing and profiling experiments are described elsewhere (Rao et al., 2009). qPCR was performed on an ABI 7900 using ΔΔCT protocol and inventoried Taqman Probes/Primers for human HES1, DTX1, HES5 and ASCL1 and GAPDH (as internal control). Analysis was performed using SDS 2.2.2 software (Applied Biosystems, Alameda, CA, USA). mRNA and microarray studies were conducted as previously described (O'Neil et al., 2007). Identification of genes associated with GSI sensitivity and pathway analysis were evaluated as follows as described by Rao et al. (2009): transcriptional response [treated vs. dimethyl sulphoxide (DMSO) at log10 scale] for 13 T-ALL cell lines treated with GSI (0.1 and 1 µM) was determined 3 days after exposure. The correlation coefficient between the ratio of these genes and the concentration producing 50% growth inhibition (GI50) in these 13 cell lines were calculated. To establish a threshold for selecting the genes whose expression significantly correlated or anti-correlated with the GI50, a Monte Carlo simulation was conducted. Based on 100 times of simulation, 1421 genes that showed correlation coefficients >0.4 and were selected as genes significantly (P ≤ 0.05) correlated with GI50 among the 13 GSI treated cell lines. In addition, 2080 genes showed correlation coefficients <−0.4 and were selected as genes significantly (P ≤ 0.05) anti-correlated with GI50 among the 13 GSI treated cell lines. These genes were subjected to pathway analysis with Ingenuity® software (Storey et al., 2005).
Cell culture
Human T-ALL cell lines (TALL-1, KOPTK-1, DND-41, HPB-ALL, RPMI-8402, PF-382, CRF-CEM, HSB-2, BE-13, SUPT-11, SKW-3, MOLT-16 and LOUCY) (Deutsche Sammlung von Mikroorganismen und Zellkulturen, Braunschweig, Germany; American Type Culture Collection, Manassas, VA, USA) were cultured at 37°C, 5% CO2 atmosphere in RPMI-1640 media (Invitrogen) supplemented with 10% bovine serum (FBS). Cells were treated with GSI at different concentrations, and viability assays were performed using the Cell Titer Glo kit (Promega, Madison, WI, USA) 7 days after GSI addition as described (Rao et al., 2009).
Flow cytometry analysis
TALL-1 cells were grown as described above and treated with 0.1% DMSO or 1 µM of GSI for two consecutive days. Cells were collected at days 1, 3 and 7 post treatment for flow cytometry and biochemical analysis. After resuspension in annexin-binding buffer, samples were treated with Alexa Fluor 488-Annexin-V and propidium iodide (PI) according to the manufacturer's recommendations (Invitrogen) and washed with annexin-binding buffer. To determine mitochondrial membrane potential, cells were incubated with JC1 (Reers, 1995) dye and CCCP (25 µM) simultaneously according to the manufacturer's recommendations (Invitrogen). At least 10 000 events were acquired and analysed using a FACScan flow cytometer (Becton Dickinson, San Jose, CA, USA) and FloJo software (Tree Star, Inc., Pab Alto, CA, USA).
Isolation of the cytosolic fraction (S-100)
Mitochondria-free cytoplasm was prepared as described by Majumder et al. (2000). Cell pellets were resuspended in lysis buffer containing 20 mM HEPES, 10 mM KCL, 1.5 mM MgCl2, 1 mM EDTA, 1 mM EGTA, 1 mM DTT, 0.1 mM PMSF, 10 µg·mL−1 leupeptin, 2 µg·mL−1 aprotinin and 250 mM sucrose. Cells were homogenized using a Dounce homogenizer and then centrifuged at 100×g for 5 min. The supernatant was collected and then centrifuged at 105 000×g for 30 min at 4°C. Mitochondria-free supernatant was collected, and protein was estimated by the bicinchoninic acid (BCA) protein assay (Pierce Biotechnology, Rockford, IL, USA).
Western blot analysis
Cells and xenograft tumour samples were collected, flash frozen in liquid nitrogen and stored at −80°C until processed. Frozen samples were immersed in cold RIPA lysis buffer (0.5 M Tris-HCl, pH 7.4, 1.5 M NaCl, 2.5% deoxycholic acid, 10% NP-40, 10 mM EDTA) (Upstate USA, Inc., Charlottesville, VA, USA) containing complete protease inhibitor cocktail (Roche Diagnostics Corporation, Indianapolis, IN, USA). Tumour samples were minced and subsequently homogenized with the Covaris S Series sonication system (Covaris, Inc., Woburn, MA, USA). Protein concentrations in cell and tissue lysates were determined by the BCA Protein Assay Kit (Pierce Biotechnology) according to the manufacturer's instructions. All proteins were detected by resolving proteins on Criterion 4–15% Tris-HCl SDS-PAGE (Bio-Rad Laboratories, Hercules, CA, USA) and blotted onto nitrocellulose membranes. Residual binding sites were blocked by 5% non-fat dry milk and blotted with antibodies against activated caspase-3 (1:1000), cytochrome c (1:500) (Cell Signaling Technology, Inc., Beverly, MA, USA), peroxiredoxin 5 (1:1000), NADH dehydrogenase (ubiquinone) 1 alpha subcomplex 2 (NDUFA2; 3:1000), superoxide dismutase 2 (SOD2; 1:1000), tubulin and β-actin (1:1000) (Abcam Inc., Cambridge, MA, USA). Detection of protein bands was performed using Super Signal Chemiluminescent Substrate (Pierce Biotechnology) after incubation with the horseradish peroxidase-conjugated secondary antibody (1:5000) (Jackson Immuno Research Laboratories, Inc.). Densitometric analysis was performed using Quantity One Analysis Software (Bio-Rad).
Data analysis
One-way anova followed by Dunnett's multiple comparison test was performed to evaluate anti-tumour effects and inhibition of plasma Aβ40. In mRNA expression studies a Pearson correlation coefficient was generated from the GSI-induced GI50 value of each cell line versus average log10 ratio expression of 10 NOTCH target genes using PRISM software.
Results
Continuous daily administration of the GSI was not well tolerated
To determine anti-tumour activity of the GSI in vivo, we generated mouse models of T-ALL and identified tolerated and efficacious doses of GSI. Four GSI-sensitive cell lines were evaluated for growth as orthotopic and subcutaneous xenografts; however, TALL-1 and DND-41 were the only cell lines to provide viable models, and only when grown subcutaneously in mice (data not shown). Daily administration of GSI in DND-41 tumour-bearing mice revealed that a non-efficacious dose (50 mg·kg−1) was tolerated whereas higher doses were not tolerated over the 7 days as shown by the loss of body weight (Figure 1, n= 10, and Table 1).
Figure 1.
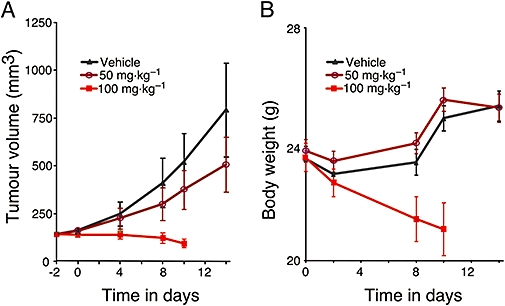
Daily administration of γ-secretase inhibitor (GSI) was not tolerated at effective concentrations. (A) DND-41 cells were implanted subcutaneously in female CD1 nu/nu mice. Tumour-bearing mice were randomized into various groups of equal average tumour volume (∼200 mm3). Different doses of GSI (50 and 100 mg·kg−1) or vehicle (0.5% methyl cellulose) were given orally once daily as indicated. Tumour size was measured (see Methods) and recorded biweekly. (B) Body weight of mice treated with GSI or vehicle were measured biweekly.
Table 1.
Summary of xenograft efficacy and tolerability
| Dosing cycle | Dose (mg·kg−1) | DND-41 xenograft anti-tumour effect* | TALL-1 xenograft anti-tumour effect* | Tolerated**≥21 days |
|---|---|---|---|---|
| Daily | 50 | No | N/A | Yes |
| 100 | Yes | N/A | No | |
| Thrice weekly (3 days on/4 days off) | 50 | No | No | Yes |
| 75 | No | No | Yes | |
| 100 | Yes | Yes | Yes | |
| 200 | Yes | N/A | No | |
| Once a week | 100 | N/A | No | Yes |
| 200 | N/A | No | Yes | |
| 300 | N/A | Yes | Yes | |
| 500 | N/A | N/A | No | |
| Bimonthly | 300 | N/A | Yes | Yes |
Anti-tumour effect: significant difference of tumour volume in GSI-treated mice as compared with controls (P < 0.05).
Tolerability: loss of body weight (≥10%) was used as indicators.
N/A, not applicable.
Intermittent dosing of GSI was tolerated and effective in xenograft models of T-ALL
Notch signalling controls the fate of intestinal progenitor cells; however, details of the recovery of tissue from the effects of GSI had not been explored (Milano et al., 2004; Fre et al., 2005; Sjolund et al., 2008). Our recent findings in a transgenic mouse model of leukaemia demonstrated that weight loss is also associated with continuous oral administration of GSI (Cullion et al., 2009). To identify several rational dosing regimens that might balance anti-tumour activity with effects on other cell types, we determined the kinetics of intestinal cell differentiation as measured by staining with PAS and cell proliferation as measured by Ki67, following three oral daily doses of GSI. Little effect on these differentiation markers was observed 8 h after the last dose at all doses tested, indicating the conversion to a secretory lineage is a slow process requiring at least 3 days (Figure 2A,B, n= 5, and Figure S1). After this period, induction and recovery of PAS positive cells was dose- and time-dependent. PAS staining from three consecutive 100 mg·kg−1 daily doses peaked 2 days after the last dose and returned rapidly towards baseline 2 days thereafter, while the 200 mg·kg−1 and 500 mg·kg−1 doses required 8 and 12 day recovery respectively (Figure 2B and Figure S1, n= 5). Along with the induction and recovery of intestinal cell differentiation, similar effects on cell proliferation were also observed (Figure S1, n= 5).
Figure 2.

Intermittent dosing of γ-secretase inhibitor (GSI) was effective in T-cell acute lymphoblastic leukaemia (T-ALL) xenograft models. (A) Secretory epithelial cells (dark pink) in the mouse intestine were visualized by periodic acid Schiff (PAS) staining following treatment with either vehicle (Veh) or GSI. Upper panel shows response to vehicle; middle and lower panels show intestine from GSI-treated mice (100 mg·kg−1) treated with three daily doses followed by 2 or 8 days of no treatment. Scale bar, 100 µm. (B) The intensity of PAS staining was scored manually in different dose groups and plotted against time as indicated. (C and D) Mice with subcutaneous T-ALL tumour xenografts were treated with two different GSI doses on two different schedules. Using the GSI at 100 mg·kg−1, with a 3 days on/4 days off dosing schedule (three times a week) caused significant (P < 0.05) anti-tumour effects as measured by tumour volume in DND-41 (C) and TALL-1 xenografts (D). GSI caused tumour regression in the TALL-1 xenografts when given once a week at 300 mg·kg−1 (D). Body weight (mean ± SEM) of DND-41 (E) and TALL-1 (F) xenograft tumour-bearing mice were measured twice a week during GSI treatment and plotted against time as indicated.
The kinetics of intestinal recovery led us to compare efficacy and tolerability of our GSI in vivo using four different dosing schedules (daily, once weekly, thrice weekly or biweekly) in mice bearing DND-41 and/or TALL-1 xenografts (Table 1). Successful regimens induced tumour stasis or regression and were well tolerated (>10% body weight loss). While continuous daily dosing in non-tumour-bearing mice was not tolerated, intermittent administration of 100 mg·kg−1 dosed thrice times a week or 300 mg·kg−1 once a week was found to be tolerated and effective (Figure 2C–Fn= 10 and Table 1). Impressively, in the TALL-1 model, four cycles of 300 mg·kg−1 once weekly resulted in complete tumour regression with no gross or histological evidence of recurrent tumours at end of study, which was 3 months after the last dose of GSI (Figure 2D, n= 10 and data not shown). Tumour regression required weekly administration of the 300 mg·kg−1 dose as administration every 2 weeks (biweekly) provided only tumour growth inhibition (Table 1 and data not shown).
Inhibiting γ-secretase 3 days a week is sufficient to achieve an anti-tumour effect
To understand the degree and duration of the target inhibition associated with anti-tumour effects, we evaluated the pharmacokinetic and pharmacodynamic markers of γ-secretase activity, NOTCH1 target gene response in tumour and plasma Aβ40 after GSI treatment (Steiner et al., 1999). An effective single dose of GSI completely suppressed plasma Aβ40 in CD1-nude mice for 3 days indicating that complete target inhibition was achieved for at least 3 days (Figure 3A, n= 4). We also explored the response of plasma Aβ40 inhibition in APP-YAC mice that overexpress APP and thus have elevated levels of Aβ40 (Lamb et al., 1993). Plasma pharmacokinetics was similar in both mouse models (Figure S2, n= 4 and data not shown). In the APP-YAC model, a non-effective single dose of GSI (75 mg·kg−1) resulted in ∼70% decrease in plasma Aβ40 protein for 1 day while an effective single dose (300 mg·kg−1) caused >70% inhibition of Aβ40 for 3 days (Figure 3B, n= 4). Together, these results indicate 3 days of >70% target inhibition was required for anti-tumour activity. This level of target inhibition could be achieved by dosing 100 mg·kg−1 once daily for three consecutive days or a single 300 mg·kg−1 dose. Plasma Aβ40 response mirrored pharmacokinetic and target engagement in tumours as measured by the protein level of HES1 (Figure 3C upper panel and data not shown, n= 4) and supported by down-regulation of NOTCH1 target genes HES1, HES5, DTX1 and up-regulation of ASCL1 (Figure 3C lower panel, n= 4).
Figure 3.
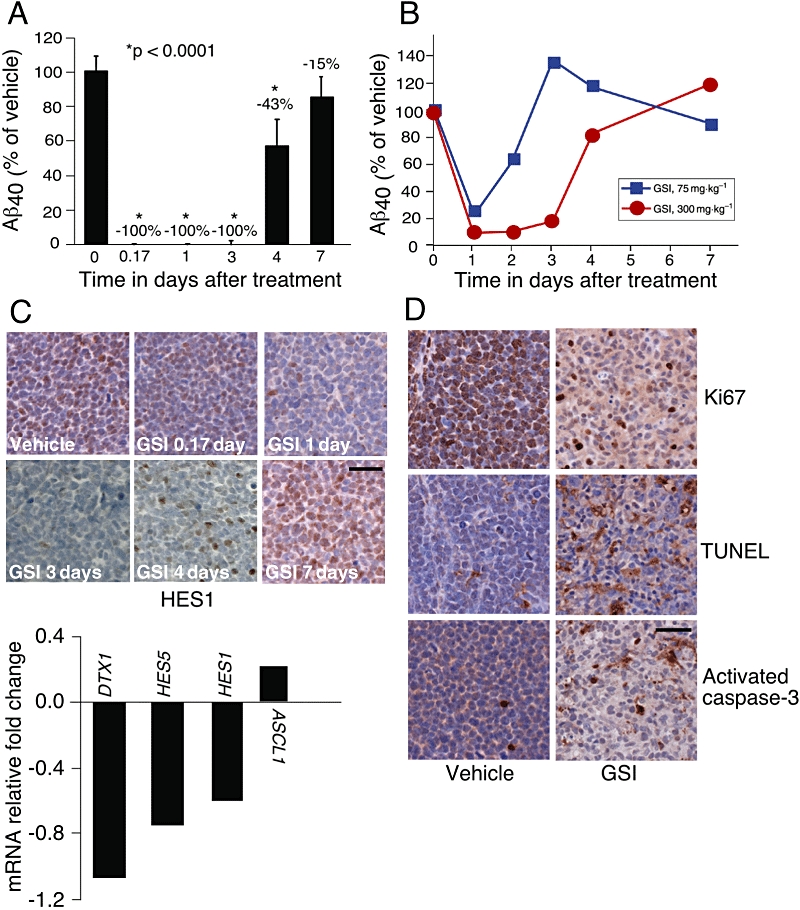
γ-Secretase inhibitor (GSI) inhibited Notch signalling, decreased tumour cell proliferation and induced apoptosis in T-cell acute lymphoblastic leukaemia (T-ALL) xenograft models. (A) Mice with TALL-1 xenograft tumours were treated with a single dose of GSI at 300 mg·kg−1; (B) APP-YAC mice were treated with either vehicle (0.5% methyl cellulose) or GSI at 75 mg·kg−1 and 300 mg·kg−1 doses. (A,B) Plasma Aβ40 levels were measured as a surrogate for inhibition of γ-secretase at 0 h (vehicle), 4 h, 1 day, 3 days, 4 days and 7 days after treatment. Serum was isolated and Aβ40 level was determined. Percent of Aβ40 remaining in GSI treated mice compared with vehicle treated mice. (C) TALL-1 tumour sections were stained with anti-HES1 antibody at 4 h, 1 day, 3 days, 4 days and 7 days post dose of GSI at 300 mg·kg−1. Scale bar, 50 µm. TALL-1 xenograft tumours were harvested 4 h after receiving a dose of GSI at 300 mg·kg−1 (lower panel). Notch pathway activity was determined by the expression of DTX1, HES5, HES1 and ASCL1 by quantitative polymerase chain reaction analysis. (D) Mice with TALL-1 xenografts were treated with either vehicle (0.5% methyl cellulose) or GSI at 100 mg·kg−1 thrice weekly for 3 weeks. Tumours were harvested 4 h after the third dose in week 3, dissected and stained with TUNEL, or with antibodies against Ki67 and activated caspase-3. Scale bar, 50 µm.
Inhibition of Notch signalling by GSI is associated with the induction of apoptosis in vivo
To determine if intermittent Notch pathway modulation by GSI treatment leads to a direct effect on tumour cell survival, we stained tumours for markers of cell proliferation (Ki67) and apoptosis (TUNEL, cleaved caspase-3). GSI decreased cell proliferation and increased apoptosis (Figure 3D, n= 4). In vivo effects are apparently enhanced by repeated dosing as a more dramatic decrease in Ki67 staining and an increase in apoptosis (TUNEL) were observed following 3 weeks of intermittent GSI treatment (Figure 3D, n= 4) compared with a single dosing cycle (Figure S3, n= 4). In order to determine the degree of apoptosis associated with sub-effective (50 mg·kg−1), effective (100 mg·kg−1) and non-tolerated (150 mg·kg−1) doses, TALL-1 tumour-bearing mice were treated with GSI for three consecutive days and the degree of caspase-3 activation was measured in tumours 4 h after the last dose. Western blot showed an increase in caspase activation in tumours from mice treated with the effective 100 mg·kg−1 dose compared with the non-effective 50 mg·kg−1 dose; however, no additional increase was observed between 100 mg·kg−1 and 150 mg·kg−1 (Figure 4, n= 4). These results demonstrated that GSI induced apoptosis in vivo and was associated with anti-tumour activity (Figure 4 and Table 1).
Figure 4.
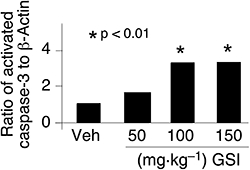
An effective dose of γ-secretase inhibitor (GSI) increased apoptosis as measured by activated caspase-3. Mice bearing TALL-1 tumour xenografts were treated with three consecutive daily doses of either vehicle (Veh), 50, 100 or 150 mg·kg−1 of GSI. Mice were killed 4 h after the last dose, and tumours were collected. Activation of caspase-3 was measured by Western blot analysis in tumour lysates and band intensity measured by densitometric analysis.
GSI altered mitochondrial transmembrane potential and induced apoptosis
Apoptosis can be triggered by many cellular cascades, one of which is activation of the mitochondrial cascades in cell death machinery (Letai, 2008). To investigate the role of the mitochondria in GSI-mediated apoptosis and activation of caspase-3 in T-ALL xenograft models, we conducted several in vitro studies. We used TALL-1 (NOTCH1 wild type) cells as their sensitivity to the we used GSI was similar to that of DND-41 cells (NOTCH1 mutated) in vivo (Figure 2C,D) and in vitro (0.11 and 0.25 µM in IC50 respectively). TALL-1 cells also displayed similar basal Notch pathway activity to DND-41 (Rao et al., 2009) and undergo GSI-induced cell cycle arrest and apoptosis as previously shown for DND-41 (Lewis et al., 2007). TALL-1 cells were treated with GSI (1 µM) or DMSO for two consecutive days and analysed 1, 3 or 7 days post treatment. We determined the effect of GSI on mitochondrial membrane potential as an important step towards cellular apoptosis. Here, we used JC1 dye to quantitate the mitochondrial membrane permeability in TALL-1 cells (Smiley et al., 1991). The eightfold increase in JC1 staining at day 7 demonstrated that treatment with the GSI did alter mitochondrial membrane permeability (Figure 5A). We then measured further the consequence of mitochondrial membrane permeability via cytosolic cytochrome c, one of the apoptotic signals upstream of caspase-3. GSI induced the release of mitochondrial cytochrome c to the cytosol following 3 days of GSI treatment, and it was further increased by day 7 (Figure 5B). A concomitant ninefold increase in the apoptosis marker Annexin-V was also observed (Figure S4) in agreement with previous findings (Lewis et al., 2007). These results provide support that the GSI-induced apoptosis observed in these T-ALL cells occurred via the mitochondrial death machinery.
Figure 5.
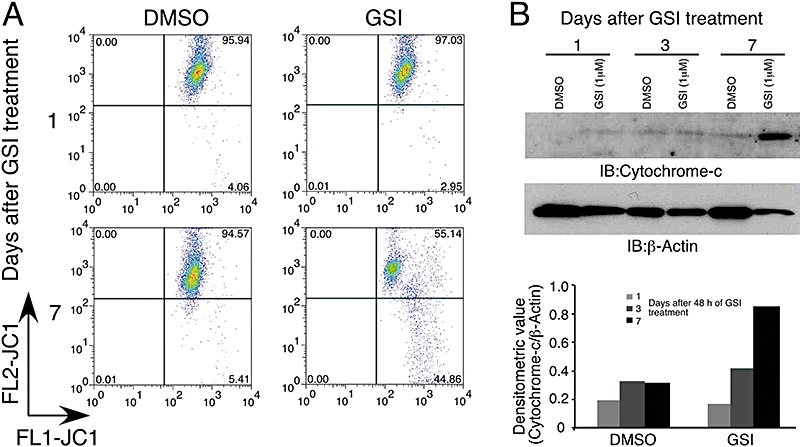
γ-Secretase inhibitor (GSI) altered mitochondrial transmembrane potential (ΔΨm) and facilitated cytochrome c release in TALL-1 cells. Cells were treated with either dimethyl sulphoxide (DMSO) or 1 µM GSI for 2 days and harvested on days 1, 3 and 7 after the last addition of drug. (A) Cells treated with GSI or DMSO were stained with JC1 dye and analysed by flow cytometry. (B) Cytosol without mitochondria (S-100 fraction) was prepared from cells treated with either DMSO or 1 µM of GSI, and immunoblot analysis was performed using antibodies against cytochrome c and β-actin. Lower panel, ratio of cytochrome c to β-actin was determined by densitometric analysis.
Mitochondrial dysfunction genes were down-regulated by GSI
To explore the cellular processes associated with the effects of the GSI, we conducted transcriptional profiling of human T-ALL cells treated with either GSI or DMSO and performed an unsupervised analysis of mRNA profiles from 13 T-ALL cell lines using Ingenuity® software (submitted in the GEO database, accession number # GSE8416). Genes that were up-regulated upon GSI treatment and correlated with GSI sensitivity included those involved in promoting apoptosis and PPARα signalling (Figure 6A left panel). Strikingly, down-regulated genes were primarily associated with mitochondrial dysfunction and included enzymes associated with the mitochondrial respiratory chain (Figure 6A right panel). Down-regulation of these mitochondrial genes correlated with GSI sensitivity as measured by growth inhibition (Figure 6B left panel) and with NOTCH target gene response (Figure 6B right panel). The NOTCH1 target gene MYC (Sharma et al., 2006; Weng et al., 2006) has recently been shown to regulate mitochondrial biogenesis by directly targeting mitochondrial genes (Kim et al., 2008), including those shown in Figure 6A right panel. The ability of MYC to bind these mitochondrial genes is further demonstrated in T-ALL cells (Margolin et al., 2009). In agreement with these findings, we observe that down-regulation of MYC is tightly correlated (P < 0.001) with down-regulation of mitochondrial dysfunction genes in human T-ALL cell lines (Figure S5 and Table S1).
Figure 6.
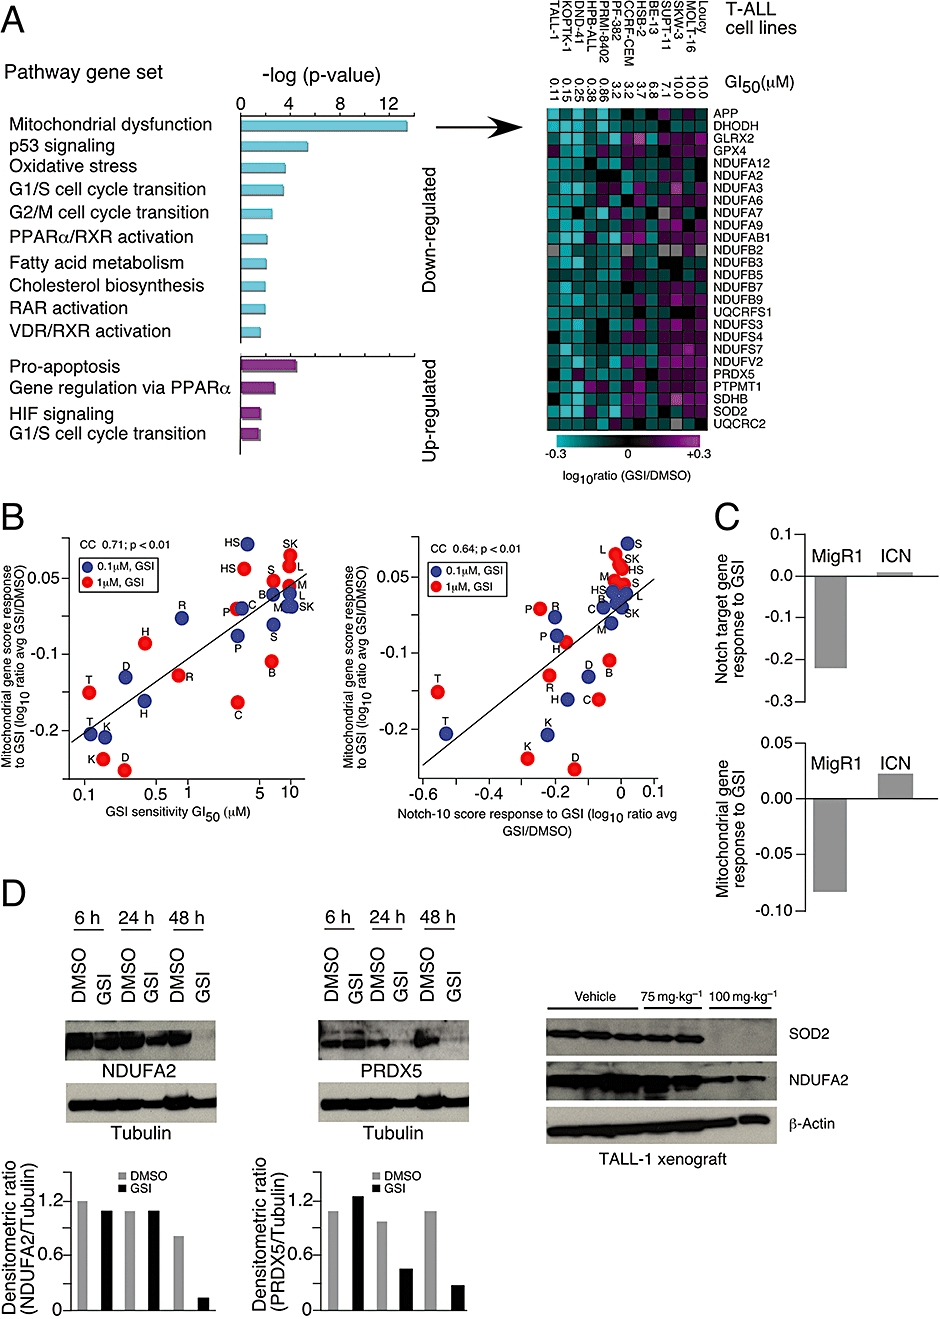
NOTCH-dependent inhibition of mitochondrial dysfunction genes by γ-secretase inhibitor (GSI). RNA profiling from 13 human T-cell acute lymphoblastic leukaemia (T-ALL) cells treated with either dimethyl sulphoxide (DMSO) or GSI at 0.1 or 1 µM for 3 days. (A) Unsupervised profiling analysis: genes with log10 expression ratios that correlated (P ≤ 0.05) with GSI sensitivity following GSI treatment were analysed for pathway association (left panel). Down-regulated genes associated with mitochondrial dysfunction are shown (right panel). (B) Correlation between GSI-induced mitochondrial gene response (average of genes shown in A) versus GI50 for each cell line indicated. Blue and red symbols represent gene response derived from 3 day treatment with 0.1 and 1 µM GSI respectively. Correlation of GSI-induced mitochondrial gene response (log10 ratio average of genes shown in A) versus GSI-induced change in NOTCH1 target genes (log10 ratio average of 10 NOTCH1 target genes: HES1, HES4, HES5, HEYL, HEY2, DTX1, MYC, NRARP, PTCRA, SHQ1) (left panel). Blue and red symbols represent gene response derived from 3 day treatment with 0.1 and 1 µM GSI respectively. The cell line Loucy is indicated by the abbreviation L; MOLT-16 by M; SKW-3 by SW; SUPT-11 by S; BE-13 by B; HSB-2 by HS; CCRF-CEM by C; PF-382 by P; RPMI-8402 by R; HPB-ALL by H; DND-41 by D; KOPTK-1 by K and TALL-1 by T. (C) DND-41 cells containing vector (MigR1) or NOTCH intracellular domain (ICN) were treated with either DMSO or GSI at 1 µM for 3 days. Average score of NOTCH1 target genes and mitochondrial genes are shown. (D) TALL-1 cells were treated with either DMSO or GSI for three consecutive days and harvested at 6, 24 and 48 h after the last dose. Proteins were blotted with antibodies against peroxiredoxin 5 (PRDX5) and NDUFA2. Tubulin was used as loading control. The densitometric ratios of TALL-1 cells treated with DMSO (grey bar) or GSI (black bar) were calculated. Mice were treated with either vehicle (0.5% methyl cellulose) or GSI at 75 and 100 mg·kg−1 three times a week for 3 weeks (right panel). Mice were killed, tumours were harvested 4 h after the final dose, and superoxide dismutase 2 (SOD2) and NDUFA2 were measured by immunoblot analysis. β-Actin was used for loading control.
To determine whether this effect of GSI was NOTCH1-dependent, we profiled DND-41 and KOPTK-1 cells expressing either vector (MigR1) or the active form of the NOTCH1 receptor (ICN) after GSI treatment. These data demonstrate that the effects of GSI on NOTCH1 target genes and mitochondrial genes can be rescued by the overexpression of ICN (Figure 6C and Figure S6). The down-regulation of mitochondrial gene expression (PRDX5 and NDUFA2) was also confirmed at the protein level in TALL-1 cells (Figure 6D left and middle panels). In order to validate GSI's effect on these mitochondrial genes in vivo, we analysed the level of SOD2 and NDUFA2 in TALL-1 xenograft tumours treated with a sub-effective (75 mg·kg−1) and effective (100 mg·kg−1) dose of GSI. Only the effective dose decreased the level of these two proteins involved in the mitochondrial respiratory process (Figure 6D right panel, n= 3). These data provide understanding of the processes associated with GSI-induced cell death whereby GSI-mediated inhibition of Notch pathway signalling initiates the apoptotic pathway both in vitro and in vivo, which is associated with the down-regulation of mitochondrial genes
Discussion
The discovery and use of targeted anticancer agents such as Gleevec, Herceptin and Tarceva have transformed the field of clinical oncology. However, as cancers utilize a number of survival pathways, the need to develop additional targeted agents remains urgent. The Notch pathway is a particularly promising target, its role in a variety of cancers has been well elucidated, and components of the signalling cascade are well characterized. It must be considered however that the Notch pathway plays a central role in the differentiation of many cell types and while several points of intervention may exist, it will be essential to design treatment protocols that minimize potential on-target side effects while maximizing on-target anti-cancer effects in Notch-dependent cancers such as T-ALL.
The sensitivity of human T-ALL cells to inhibition of the Notch pathway in vitro has been previously demonstrated (Weng et al., 2004; Lewis et al., 2007; Keersmaecker et al., 2008). Our in vivo results demonstrate that intermittent (3 days per week) and potent (>70%) inhibition of Notch signalling can induce anti-tumour effects and result in complete tumour regression. Tumour regression was also achieved using once weekly administration of the highest tolerated dose of GSI. However, tumour regression was not observed when the same total dose was distributed over the first 3 days of a weekly cycle. This suggests that better efficacy may be observed using potent intermittent doses. It is interesting to note that similar findings with high-dose administration have been observed with the targeted agent Dasatinib where pulsatile but potent inhibition of BCR-ABL was sufficient to induce apoptosis in CML cells (Shah et al., 2008b) and a daily high dose (100 mg) was as effective and better tolerated than conventional twice daily dosing (70 mg) (Shah et al., 2008a). In addition the anti-tumour activity achieved by dosing every 2 weeks in the most GSI-sensitive model (TALL-1) may benefit certain patient populations or combinations.
The anti-tumour effects observed in these models are at least in part due to cell cycle arrest and apoptosis of T-ALL cells. While we and others have previously demonstrated that GSI can induce apoptosis in T-ALL cell lines (Weng et al., 2003; 2004; Lewis et al., 2007; O'Neil et al., 2007; Keersmaecker et al., 2008) that can be rescued by ICN overexpression (Lewis et al., 2007), here we expand our understanding of this process to demonstrate that the cell death observed in the cell lines occurs through mitochondria-dependent apoptosis. Our data support a model in which γ-secretase inhibition initiates apoptosis by altering Notch pathway activity and mitochondrial transmembrane potential, which subsequently causes the release of cytochrome c into the cytoplasm and thereby activates the caspase cascade. Our observations also have important implications in understanding the mechanisms of resistance to GSI therapy in cancer, as increasing mitochondrial membrane potential via up-regulation of members of the BCL2 family is a common mode of tumour resistance (Reed, 2002; Youle and Strasser, 2008). Additional studies are needed to explore the difference between cell cycle arrest and apoptosis in other T-ALL models as induction of apoptosis has not been observed in all T-ALL cell lines.
Given that NOTCH directly regulates MYC (Sharma et al., 2006; Weng et al., 2006) and MYC binds to mitochondrial genes (Kim et al., 2008), it is likely that the mitochondria-dependent process is regulated by NOTCH through MYC. These data are supported by the ability of ICN to up-regulate MYC and mitochondrial dysfunction genes in T-ALL cells. The down-regulation of genes associated with mitochondrial dysfunction clearly suggests a role for Notch signalling within the mitochondria. These findings are supported by preclinical studies in Drosophila melanogaster where NOTCH1 mutations effected several mitochondrial enzyme activities in a dose-dependent manner (Thorig et al., 1981; de la Pena et al., 2001). They are further supported by findings in patients with Alzheimer's disease where mutation of PSEN1 and PSEN2 (critical components of active γ–secretase) have also been associated with mitochondrial dysfunction (Lin and Beal, 2006).
In addition to identifying optimal dosing regimens, it will be important to identify Notch-dependent tumours, resistance mechanisms and rational combinations. Such combinations may include the use of PI3K pathway inhibitors, as PTEN mutations are known to diminish response to GSIs (Real et al., 2008) and the effects of GSIs shown to be enhanced by mTOR inhibitors (Chan et al., 2007; Cullion et al., 2009). Treatment of Notch-dependent cancers may be further enhanced by co-administration of GSIs with glucocorticoids, which have recently been shown to overcome glucocorticoid resistance of T-ALL cells and mitigate GSI-induced differentiation of intestinal epithelial cells (Real et al., 2008). GSI may also enhance the effect of other chemotherapeutic agents; however, consideration will need to be given in selection of cell type and agents (DeKeersmaecker et al., 2008; Liu et al., 2008). Given that GSIs induce cell cycle arrest and apoptosis, the sequence of addition may also need to be considered when being combined with other therapeutic agents.
In conclusion, we have shown that NOTCH-dependent regulation of mitochondrial proteins is associated with mitochondrial dysfunction and apoptosis. Our results on the kinetics of GSI-induced differentiation of intestinal epithelium provide a new and potentially useful guide to designing intermittent but potent dosing regimens for agents, which inhibit other developmental pathways such as Wnt and Smoothened. The successful use of GSIs is particularly desirable as they affect all four NOTCH receptors and NOTCH-dependent tumour cells, tumour vessel development (Gridley, 2007) and potentially cancer-initiating cells (Farnie and Clarke, 2007).
Acknowledgments
We gratefully acknowledge Sada Breegi and Nirah Shomer of Laboratory Animal Research for technical support; Ben Munoz and Gloria Kwei of Drug Design and Optimization for logistical support; Mark Shearman of Neuroscience Drug Discovery for critical comments on the manuscript. We thank Jon C Aster, Brigham and Women's Hospital, Harvard Medical School, Boston for the MigR1 and MigR1-ICN1 retroviral constructs.
Glossary
Abbreviations:
- DMSO
dimethyl sulphoxide
- GI50
concentration for 50% growth inhibition
- GSI
γ-secretase inhibitor
- HPLC
high-pressure liquid chromatography
- ICN
intracellular domain of NOTCH receptor
- PAS
periodic acid Schiff
- PCR
polymerase chain reaction
- T-ALL
T-cell acute lymphoblastic leukaemia
Supporting Information
Additional Supporting Information may be found in the online version of this article:
Figure S1 Inhibition of Notch signalling by γ-secretase inhibitor (GSI) increases differentiation and decreases proliferation of intestinal epithelial cells in mice. Mice were treated with either vehicle (0.5% methyl cellulose) or GSI at 100, 200 and 500 mg·kg−1 once daily for three consecutive days. Intestines were harvested at indicated times ranging from 8 h to 12 days following the last dose, differentiation of intestinal proliferating cells was detected by periodic acid Schiff (PAS) staining, and proliferation was visualized by Ki67 staining. Scale bar, 150 μm.
Figure S2 Similar pharmacokinetics exposure in plasma and tumour after γ-secretase inhibitor (GSI) treatment. Mice with TALL-1 xenograft tumours were treated with a single dose of GSI at 300 mg·kg−1; Plasma and tumour drug concentrations were measured at 0 h (vehicle), 4 h, 1 day, 3 days, 4 days and 7 days post treatment.
Figure S3 Prolonged effect on proliferation and apoptosis in TALL-1 xenografts after a single dose of γ-secretase inhibitor (GSI). TALL-1 xenograft mice were treated once with GSI at 300 mg·kg−1, and tumours were harvested after 1 and 7 days. Tumour sections were stained with H&E, Ki67, activated caspase-3 and TUNEL. Scale bar, 50 μm.
Figure S4 γ-Secretase inhibitor (GSI) induces apoptosis TALL-1 cells. Cells were treated with either dimethyl sulphoxide (DMSO) or 1 μM GSI for 2 days and harvested on days 1, 3 and 7 after the last addition of drug treatment. Cells were stained with Alexa Fluor 488-Annexin-V and propidium iodide and then analysed by flow cytometry. Data showed GSI induced apoptosis as compared with DMSO. The data shown are representative of two independent experiments with similar results.
Figure S5 γ-Secretase inhibitor (GSI)-induced down-regulation of MYC is tightly associated with the mitochondrial dysfunction gene in T-cell acute lymphoblastic leukaemia (T-ALL) cells. Correlation of GSI-induced mitochondrial gene response (log10 ratio average of genes) versus GSI-induced change in MYC gene (log10 ratio). Blue and red symbols represent gene response derived from 3 day treatment with 0.1 and 1 μM GSI respectively. The abbreviation of cell line Loucy is indicated by L, MOLT-16 by M; SKW-3 by SW; SUPT-11 by S; BE-13 by B; HSB-2 by HS; CCRF-CEM by C; PF-382 by P; RPMI-8402 by R; HPB-ALL by H; DND-41 by D; KOPTK-1 by K and TALL-1 by T.
Figure S6 NOTCH1 intracellular domain (ICN) rescues NOTCH1 target genes and genes associated with mitochondrial dysfunction from the effects of γ-secretase inhibitor (GSI). (A) DND-41 and (B) KOPTK-1 cells expressing empty vector (MigR1) or ICN were treated with either dimethyl sulphoxide (DMSO) or GSI at 1 μM for 3 days. RNA was isolated and gene expression profiling performed. Alterations in genes associated with NOTCH1 and mitochondrial dysfunction after GSI treatment are plotted against DMSO controls.
Table 1 Summary of γ-secretase inhibitor (GSI) sensitivity and effect on NOTCH target, MYC and mitochondrial dysfunction genes in T-cell acute lymphoblastic leukaemia (T-ALL) cells.
Please note: Wiley-Blackwell are not responsible for the content or functionality of any supporting materials supplied by the authors. Any queries (other than missing material) should be directed to the corresponding author for the article.
References
- Best JD, Jay MT, Otu F, Ma J, Nadin A, Ellis S, et al. Quantitative measurement of changes in amyloid-beta(40) in the rat brain and cerebrospinal fluid following treatment with the gamma-secretase inhibitor LY-411575 [N2-[(2S)-2-(3,5-difluorophenyl)-2-hydroxyethanoyl]-N1-[(7S)-5-methyl-6-ox o-6,7-dihydro-5H-dibenzo[b,d]azepin-7-yl]-L-alaninamide. J Pharmacol Exp Ther. 2005;313:902–908. doi: 10.1124/jpet.104.081174. [DOI] [PubMed] [Google Scholar]
- Bolos V, Grego-Bessa J, De La Pompa JL. Notch signaling in development and cancer. Endocr Rev. 2007;28:339–363. doi: 10.1210/er.2006-0046. [DOI] [PubMed] [Google Scholar]
- Breit S, Stanulla M, Flohr T, Schrappe M, Ludwig WD, Tolle G, Happich M, et al. Activating NOTCH1 mutations predict favourable early treatment response and long-term outcome in childhood precursor T-cell lymphoblastic leukemia. Blood. 2006;108:1151–1157. doi: 10.1182/blood-2005-12-4956. [DOI] [PubMed] [Google Scholar]
- Chan SM, Weng AP, Tibshirani R, Aster JC, Utzl PJ. Notch signals postively regulate activity of the mTOR pathway in T-cell acute lymphoblastic leukemia. Blood. 2007;110:278–286. doi: 10.1182/blood-2006-08-039883. [DOI] [PMC free article] [PubMed] [Google Scholar]
- Cullion K, Draheim KM, Hermance N, Tammam J, Sharma VM, Ware C, et al. Targeting the Notch1 and mTOR pathways in a mouse T-ALL model. Blood. 2009;113:6161–6171. doi: 10.1182/blood-2008-02-136762. [DOI] [PMC free article] [PubMed] [Google Scholar]
- De La Pena P, Bornstein B, Del Hoyo P, Ferandez-Moreno MA, Martin MA, Campos Y, et al. Mitochondrial dysfunction associated with a mutation in the Notch3 gene in a CADASIL family. Neurology. 2001;57:1235–1238. doi: 10.1212/wnl.57.7.1235. [DOI] [PubMed] [Google Scholar]
- DeKeersmaecker K, Lahortiga I, Mentens N, Folens C, Van Neste L, Bekaert S. In vitro validation of g-secretase inhibitors alone or in combination with other ant-cancer drugs for the treatment of T-cell acute lymphoblastic leukemia. Haematologica. 2008;93:533–542. doi: 10.3324/haematol.11894. [DOI] [PubMed] [Google Scholar]
- van Es JH, Van Gijn ME, Riccio O, Van Den Born M, Voojis M, Begthel H, et al. Notch/gamma-secretase inhibition turns proliferative cells in intestinal crypts and adenomas into goblet cells. Nature. 2005;435:959–963. doi: 10.1038/nature03659. [DOI] [PubMed] [Google Scholar]
- Farnie G, Clarke RB. Mammary stem cells and breast cancer – role of Notch signalling. Stem Cell Rev. 2007;3:169–175. doi: 10.1007/s12015-007-0023-5. [DOI] [PubMed] [Google Scholar]
- Fre S, Huyghe M, Mourikis P, Robins S, Louvard D, Artavanis-Tsakonas S, et al. Notch signals control the fate of immature progenitor cells in the intestine. Nature. 2005;435:964–968. doi: 10.1038/nature03589. [DOI] [PubMed] [Google Scholar]
- Gridley T. Notch signaling in vascular development and physiology. Development. 2007;134:2709–2718. doi: 10.1242/dev.004184. [DOI] [PubMed] [Google Scholar]
- van Grotel M, Meijerink JPP, van Wering ER, Langerak AW, Beverloo HB, Buijs-Gladdines JG. Prognostic significance of molecular-cytogenetic abnormalities in pediatric T-ALL is not expelined by immunophenotypic differences. Leukemia. 2008;22:124–131. doi: 10.1038/sj.leu.2404957. [DOI] [PubMed] [Google Scholar]
- Haruki N, Kawaguchi KS, Eichenberger S, Massion PP, Olson S, Gonzalez A, et al. Domminant-negative Notch3 receptor inhibits mitogen-activated protein kinas pathway and the growth of human lung cancers. Cancer Res. 2005;65:3555–3561. doi: 10.1158/0008-5472.CAN-04-3132. [DOI] [PubMed] [Google Scholar]
- Keersmaecker KD, Lahortige I, Mentens N, Folens C, Van Neste L, Bekaert S, et al. In vitro validation of g-secretase inhibitors alone or in combination with other anti-cancer drugs for the treatment of T-all acute lymphoblastic leukemia. Haematologica. 2008;193:533–542. doi: 10.3324/haematol.11894. [DOI] [PubMed] [Google Scholar]
- Kim J, Lee JH, Iyer VR. Global identification of Myc target genes reveals its direct role in mitochondrial biogenesis and its E-box usage in vivo. PLoS ONE. 2008;3:e1798. doi: 10.1371/journal.pone.0001798. [DOI] [PMC free article] [PubMed] [Google Scholar]
- Krejci A, Bernard BF, Houston BE, Collins S, Bray SJ. Direct response to Notch activation: signaling crosstalk and incoherent logic. Sci Signal. 2009;2:55. doi: 10.1126/scisignal.2000140. [DOI] [PubMed] [Google Scholar]
- Lamb BT, Sisodia SS, Lawler AM, Slunt HH, Kitt CA, Kearns WG, et al. Introduction and expression of the 400 kilobase amyloid precursor protein gene in transgenic mice. Nat Genet. 1993;5:22–30. doi: 10.1038/ng0993-22. [DOI] [PubMed] [Google Scholar]
- Letai AG. Diagnosing and exploiting cancer's addiction to blocks in apoptosis. Nat Rev Cancer. 2008;8:121–132. doi: 10.1038/nrc2297. [DOI] [PubMed] [Google Scholar]
- Lewis HD, Leveridge M, Strack PR, Haldon CD, O'Neil J, Kim H, et al. Apoptosis in T cell acute lymphoblastic leukemia cells after cell cycle arrest induced by pharmacological inhibition of notch signaling. Chem Biol. 2007;14:209–219. doi: 10.1016/j.chembiol.2006.12.010. [DOI] [PubMed] [Google Scholar]
- Lin MT, Beal MF. Alzheimer's APP mangles mitochondria. Nat Med. 2006;12:1241–1243. doi: 10.1038/nm1106-1241. [DOI] [PubMed] [Google Scholar]
- Liu S, Breit S, Danckwardt S, Muckenthaler MU, Kulozik AE. Downregulation of Notch signaling by γ-secretase inhibition can abrogate chemotherapy-induced apoptosis in T-ALL cell lines. Ann Hematol. 2008;88:613–621. doi: 10.1007/s00277-008-0646-x. [DOI] [PubMed] [Google Scholar]
- Majumder PK, Pandey P, Sun X, Cheng K, Datta R, et al. Mitochondrial translocation of protein kinase C delta in phorbol ester-induced cytochrome c release and apoptosis. J Biol Chem. 2000;275(29):21793–21796. doi: 10.1074/jbc.C000048200. [DOI] [PubMed] [Google Scholar]
- Margolin AA, Palomero T, Sumazin P, Califano A, Ferrando AA, Stolovitzky G. ChIP-on-chip significance analysis reveals large-scale binding and regulation by human transcription factor oncogenes. Proc Natl Acad Sci USA. 2009;106:244–249. doi: 10.1073/pnas.0806445106. [DOI] [PMC free article] [PubMed] [Google Scholar]
- Meijerink JPP, Boer ML, Pieters R. New genetic abnormalities and treatment response in acute lymphoblastic leukemia. Semin Hematol. 2009;46:16–23. doi: 10.1053/j.seminhematol.2008.09.006. [DOI] [PubMed] [Google Scholar]
- Milano J, Mckay J, Dagenais C, Foster-Brown L, Pognan F, Gradient R, et al. Modulation of notch processing by gamma-secretase inhibitors causes intestinal goblet cell metaplasia and induction of genes known to specify gut secretory lineage differentiation. Toxicol Sci. 2004;82:341–358. doi: 10.1093/toxsci/kfh254. [DOI] [PubMed] [Google Scholar]
- Mumm JS, Schroeter EH, Saxena MT, Griesemer A, et al. A ligand-induced extracellular cleavage regulates gamma-secretase-like proteolytic activation of Notch1. Mol Cell. 2000;5:197–206. doi: 10.1016/s1097-2765(00)80416-5. [DOI] [PubMed] [Google Scholar]
- O'Neil J, Grim J, Strack P, Rao S, Tibbitts D, et al. FBW7 mutations in leukemic cells mediate NOTCH pathway activation and resistance to {gamma}-secretase inhibitors. J Exp Med. 2007;204(8):1813–1824. doi: 10.1084/jem.20070876. [DOI] [PMC free article] [PubMed] [Google Scholar]
- Okamoto R, Tsuchiya K, Nemoto Y, Akiyama J, Nakamura T, Kanai T, et al. Requirement of Notch activation during regeneration of the intestinal epithelia. Am J Physiol Cell Physiol. 2009;296:G23–G35. doi: 10.1152/ajpgi.90225.2008. [DOI] [PubMed] [Google Scholar]
- Palomero T, Lim WK, Odom DT, Sulis ML, Real PJ, Margolin A, et al. NOTCH1 directly regulates c-MYC and activates a feed-forward-loop transcriptional network promoting leukemic cell growth. Proc Natl Acad Sci USA. 2006;103:18261–18266. doi: 10.1073/pnas.0606108103. [DOI] [PMC free article] [PubMed] [Google Scholar]
- Pece S, Serresi M, Santolini E, Capra M, Hulleman E, Galimberti V, et al. Loss of negative regulation by Numb over Notch is relevant to human breast carcinogenesis. J Cell Biol. 2004;167:215–221. doi: 10.1083/jcb.200406140. [DOI] [PMC free article] [PubMed] [Google Scholar]
- Plentz R, Park JS, Rhim AD, Abravanel D, Hezel AF, Sharma SV, et al. Inhibition of gamma-secretase activity inhibits tumor progression in a mouse model of pancreatic ductal adenocarcinoma. Gastroenterology. 2009;136:1741–1749. doi: 10.1053/j.gastro.2009.01.008. [DOI] [PMC free article] [PubMed] [Google Scholar]
- Purow BW, Haque RM, Noel MW, Su Q, Burdick NJ. Expression of Notch-1 and its ligands, Delta-like-1 and Jagged-1 is critical for glioma cell survival and proliferation. Cancer Res. 2005;65:2353–2363. doi: 10.1158/0008-5472.CAN-04-1890. [DOI] [PubMed] [Google Scholar]
- Rao SS, O'Neil J, Liberator C, Hardwick JS, Dai X, Zhang T, et al. Inhibition of NOTCH signaling by gamma secretase inhibitor engages the RB pathway and elicits cell cycle exit in T-cell acute lymphoblastic leukemia cells. Cancer Res. 2009;69:3060–3068. doi: 10.1158/0008-5472.CAN-08-4295. [DOI] [PubMed] [Google Scholar]
- Real PJ, Tosello V, Palomero T, Castillo M, de Stanchina E, Sulis ML, et al. Gamma secretase inhibitors reverse glucocorticoid resistance in T cell acute lymphoblastic leukemia. Nat Med. 2008;15:50–58. doi: 10.1038/nm.1900. [DOI] [PMC free article] [PubMed] [Google Scholar]
- Reed JC. Apoptosis-based therapies. Nat Rev Drug Discov. 2002;1:111–121. doi: 10.1038/nrd726. [DOI] [PubMed] [Google Scholar]
- Reers M, Smiley ST, Mittola-Hartshorn C, Chen A, Lin M, Chen LB. Mitochondrial membrane potential monitored by JC-1 dye. Methods Enzymol. 1995;260:406–417. doi: 10.1016/0076-6879(95)60154-6. [DOI] [PubMed] [Google Scholar]
- Riccio O, Van Gijn ME, Bezdek AC, Pellegrinet L, van Es JH, Zimmer-Strobl U, et al. Loss of intestinal crypt progenitor cells owing to inactivation of both Notch1 and Notch2 is accompanied by derepression of CDK inhibitors p27Kip1 and p57Kip2. EMBO Rep. 2008;9:377–383. doi: 10.1038/embor.2008.7. [DOI] [PMC free article] [PubMed] [Google Scholar]
- Schroeter EH, Kisslinger JA, Kopan R. Notch-1 signalling requires ligand-induced proteolytic release of intracellular domain. Nature. 1998;6683:382–386. doi: 10.1038/30756. [DOI] [PubMed] [Google Scholar]
- Shah NP, Kantarjian HM, Kim DW, Rea D, Dorlhiac-Llacer PE, Milone JH, et al. Intermitent target inhibition with Dasatinib 100mg once daily preserves efficacy and improves tolerability in Imatinib-resistant and intolerant chronic-phase chronic myeloid leukemia. J Clin Oncol. 2008a;26:3204–3212. doi: 10.1200/JCO.2007.14.9260. [DOI] [PubMed] [Google Scholar]
- Shah NP, Kasap C, Weier C, Balbas M, Nicoll JM, Bleickardt E, et al. Transient potent BCR-Abl inhibition is suficient to commit schronic myeloid leukemia cells irreversibly to apoptosis. Cancer Cell. 2008b;14:485–493. doi: 10.1016/j.ccr.2008.11.001. [DOI] [PubMed] [Google Scholar]
- Sharma VM, Calvo JA, Draheim KM, Cunningham LA, Hermance N, Beverly L, et al. Notch1 contributes to mouse T-cell leukemia by directly inducing the expression of c-myc. Mol Cell Biol. 2006;26:8022–8031. doi: 10.1128/MCB.01091-06. [DOI] [PMC free article] [PubMed] [Google Scholar]
- Sjolund J, Johansson M, Manna S, Norin C, Pietras A, Beckman S, et al. Suppression of renal cell carcinoma growth by inhibition of Notch signaling in vitro and in vivo. J Clin Invest. 2008;118:217–228. doi: 10.1172/JCI32086. [DOI] [PMC free article] [PubMed] [Google Scholar]
- Smiley ST, Reers M, Mottola-Hartshorn C, Lin M, Chen A, Smith TW, et al. Intracellular heterogeneity in mitochondrial membrane potentials revealed by a J-aggregate-forming lipophilic cation JC-1. Proc Natl Acad Sci USA. 1991;88:3671–3675. doi: 10.1073/pnas.88.9.3671. [DOI] [PMC free article] [PubMed] [Google Scholar]
- Stanger BZ, Datar R, Murtaugh LC, Melton DA. Direct regulation of intestinal fate by Notch. Proc Natl Acad Sci USA. 2005;102:12443–12448. doi: 10.1073/pnas.0505690102. [DOI] [PMC free article] [PubMed] [Google Scholar]
- Steiner H, Duff K, Capella A, Romig H, Grim MG, Lincoln S, et al. A loss of function mutation of presenilin-2 interferes with amyloid beta-peptide production and notch signaling. J Biol Chem. 1999;274:28669–28673. doi: 10.1074/jbc.274.40.28669. [DOI] [PubMed] [Google Scholar]
- Storey JD, Xia O, Leek W, Tompkins JT, RG, Davis RW. Significance analysis of time course microarray experiments. Proc Natl Acad Sci USA. 2005;102:12837–12842. doi: 10.1073/pnas.0504609102. [DOI] [PMC free article] [PubMed] [Google Scholar]
- Thorig GE, Heinstra PW, Scharloo W. The action of the notchlocus in Drosophila melanogaster. II. Biochemical effects of recessive lethals on mitochondrial enzymes. Genetics. 1981;99:65–74. doi: 10.1093/genetics/99.1.65. [DOI] [PMC free article] [PubMed] [Google Scholar]
- Weng AP, Nam Y, Wolfe MS, Pear WS, Griffin JD, Blacklow SC, et al. Growth suppression of pre-T acute lymphoblastic leukemia cells by inhibition of notch signaling. Mol Cell Biol. 2003;23:655–664. doi: 10.1128/MCB.23.2.655-664.2003. [DOI] [PMC free article] [PubMed] [Google Scholar]
- Weng AP, Ferrando AA, Lee W, Morris JP, Sil Verman LB, Sanchez-Irazarry C, et al. Activating mutations of NOTCH1 in human T cell acute lymphoblastic leukemia. Science. 2004;306:269–271. doi: 10.1126/science.1102160. [DOI] [PubMed] [Google Scholar]
- Weng AP, Millholland JM, Yashiro-Ohtani Y, Arcangeli ML, Lau A, Wai C, et al. c-Myc is an important direct target of Notch1 in T-cell acute lymphoblastic leukemia/lymphoma. Genes Dev. 2006;20:2096–2109. doi: 10.1101/gad.1450406. [DOI] [PMC free article] [PubMed] [Google Scholar]
- Youle RJ, Strasser A. The BCL-2 protein family: opposing activities that mediate cell death. Nat Rev Mol Cell Biol. 2008;9:47–59. doi: 10.1038/nrm2308. [DOI] [PubMed] [Google Scholar]
- Zecchini V, Domaschenz R, Winton D, Jones P. Notch signaling regulates the differentiation of post-mitotic intestinal epithelial cells. Genes Dev. 2005;19:1686–1691. doi: 10.1101/gad.341705. [DOI] [PMC free article] [PubMed] [Google Scholar]
- Zhu Y, Zhao W, Fu J, Shi J, Pan Q, Hu J, et al. NOTCH1 mutations in T-cell Acute Lymphoblastic Leukemia: Prognostic Significance and implication in multifactorial leukemogenesis. Clin Cancer Res. 2006;12:3043–3049. doi: 10.1158/1078-0432.CCR-05-2832. [DOI] [PubMed] [Google Scholar]
Associated Data
This section collects any data citations, data availability statements, or supplementary materials included in this article.