Abstract
Pulsed electric field has been widely used as a non-viral gene delivery platform. The delivery efficiency can be improved through quantitative analysis of pore dynamics and intracellular transport of plasmid DNA. To this end, we investigated mechanisms of cellular uptake of macromolecules during electroporation. In the study, fluorescein isothiocyanate-labeled dextran (FD) with molecular weight of 4,000 (FD-4) or 2,000,000 (FD-2000) was added into suspensions of a murine mammary carcinoma cell (4T1) either before or at different time points (i.e., 1, 2, or 10 sec) after the application of a variety of pulsed electric fields (in high voltage mode: 1.2–2.0 kV in amplitude, 99 μsec in duration, and 1–5 pulses; in low voltage mode: 100–300 V in amplitude, 5–20 msec in duration, and 1–5 pulses). The intracellular concentrations of FDs were quantified, using a confocal microscopy technique. To understand transport mechanisms, a mathematical model was developed for numerical simulation of cellular uptake. We observed that the maximum intracellular concentration of FD-2000 was less than 3% of that in the pulsing medium. The intracellular concentrations increased linearly with pulse number and amplitude. In addition, the intracellular concentration of FD-2000 was ~40% lower than that of FD-4 under identical pulsing conditions. The numerical simulations predicted that the pores larger than FD-4 should last <10 msec after the application of pulsed fields if the simulated concentrations were on the same order of magnitude as the experimental data. In addition, the simulation results indicated that diffusion was negligible for cellular uptake of FD molecules. Taken together, the data suggested that large pores induced in the membrane by pulsed electric fields disappeared rapidly after pulse application and convection was likely to be the dominant mode of transport for cellular uptake of macromolecules.
Keywords: electroporation, gene delivery, diffusion
Introduction
Electric field-mediated gene delivery has been widely used as a universal method for transfection of cells both in vitro and in vivo. Despite decades of study, the transfection efficiency lags behind other delivery platforms such as recombinant viral vectors (1–3). The low efficiency may be in part due to a lack of understanding of the effects of pulsed electric fields on transport of biologically active plasmid DNA (pDNA) into cell nucleus through various physiological barriers, such as interstitium, cell membrane, cytoplasm, and nuclear envelope. These barriers can be studied separately to improve the transfection efficiency since transport processes through the barriers occur in a sequential manner. Electric field-mediated pDNA transport through the interstitium has been quantified in previous studies (4–7). The data suggest that interstitial transport of pDNA is largely ineffective for macroscopic delivery of genes but is several orders of magnitude faster than passive diffusion.
The cell membrane is an exquisitely regulated barrier that completely blocks passive diffusion of hydrophilic macromolecules. Transmembrane transport of pDNA can be facilitated by electroporation, a process characterized by an increase in permeability of cell membrane in the presence of pulsed electric field. Electroporation has gained significant attentions in biomedical research for its ability to load cells universally with impermeant molecules, such as pDNA (8–12). However, transfection efficiencies of the method are still low, especially in vivo, and highly variable among different studies. The size of electropores has not been measured directly although the creation of transient electropores has been widely accepted as the mechanism of electric field-induced membrane permeabilization (8, 13). Dynamics of pore structures and mechanisms of cellular uptake remain to be understood (8, 14–16). Traditionally, electric field-induced membrane permeabilization has been studied by using one of the three methods: 1) mathematical modeling of cells in electric fields (17–22), 2) measuring conductance changes of cells or lipid membranes in electric fields (23–25), and 3) measuring transport of impermeant molecular markers across membranes in electric fields (26–29). Among them, the third method is more likely to provide quantitative information that is directly relevant to gene delivery.
Membrane permeabilization and molecular uptake have typically been studied with small molecules, e.g. calcein (27, 30, 31), calcium ions (29, 32, 33), lucifer yellow (34), propidium iodide (29, 32, 35, 36), and trypan blue (26, 37–39). However, transport of small molecule can be significantly different from that of gene-sized molecules, e.g. large dextran and plasmid DNA, where diffusion is slower and transmembrane transport is more limited by steric hindrances as pore sizes approach the dimension of macromolecules. At present, a few studies have quantitatively investigated electric field induced transport of macromolecules into mammalian cells (28, 40, 41) or erythrocyte ghosts (42, 43) in terms of percentage of permeabilized cells or relative fluorescence intensity in cells. And only one of them measured the intracellular concentration of macromolecules after electroporation (43). Quantitative analysis of intracellular concentrations is important for understanding electropore dynamics and mechanisms of electric field-induced cellular uptake of macromolecules. To this end, we quantified the cellular uptake of two fluorescein isothiocyanate (FITC)-labeled dextran (FD) molecules during electroporation and at different time points after electroporation using a confocal microscopy technique. In addition, we developed a transport model to simulate intracellular distribution of FDs and predict the dependence of FD concentrations on various transport parameters. The analysis allowed us to glean some information on average size of electropores and fractional area of pores in the permeabilized membrane, and understand mechanisms of macromolecular transport during electroporation.
Materials and Methods
Tumor cell preparation
4T1 murine mammary carcinoma cells were cultured in DMEM with high glucose content at 37°C. The medium was supplemented with 10% fetal bovine serum (Hyclone, Logan, Utah), 1% penicillin/streptomycin (Gibco/Life Technologies, Grand Island, NY) and 5% CO2. Cells were detached from flasks, using 0.25% trypsin-EDTA for 10 min at 37°C. Trypsinization was stopped by adding the culture medium. Single cell suspensions were prepared by repeated pipetting and the cell density in suspensions was determined by counting cells with a hemocytometer.
Cellular uptake of dextran during electroporation
Approximately 500,000 cells in 0.8 ml culture medium (see above) were loaded into a 4-mm gap electroporation cuvette (BTX, San Diego, CA). In high voltage mode experiments, cells were exposed to 1, 3 or 5 square pulses with the amplitude of 1.2, 1.6 or 2.0 kV and the duration of 99 μsec. In low voltage mode experiments, cells were exposed to 1, 3 or 5 square pulses with the amplitude of 100, 200 or 300 V and the duration of 5, 10 or 20 msec. The pulsed electric fields were generated using a T820 square wave electroporator (BTX, San Diego) in initial experiments for data shown in Figures 1–2 and an ECM 830 square wave electroporator (BTX, San Diego) in subsequent experiments for data shown in Figures 3–5.
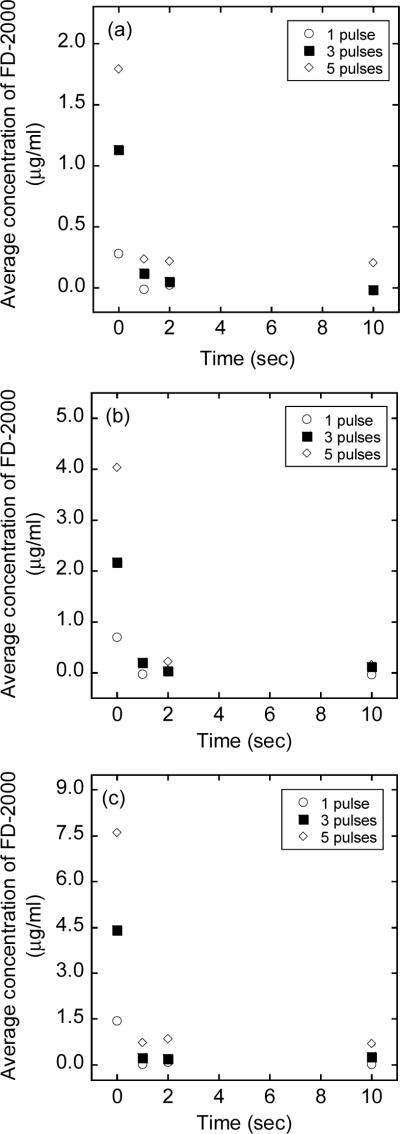
Figure 1.
Average concentrations of FD-2000 in 4T1 cells exposed to high voltage, short duration pulses with an amplitude of (a) 1.2 kV, (b) 1.6 kV, or (c) 2.0 kV. The number of pulses was 1, 3, or 5; and the pulse duration was 99 μsec in all cases. FD-2000 was added into cell suspensions either immediately before the exposure, which is indicated as time to be at zero, or at different time points (i.e., 1, 2, or 10 sec) after the exposure. Each data point presents of the mean of measurements in three repeated experiments.
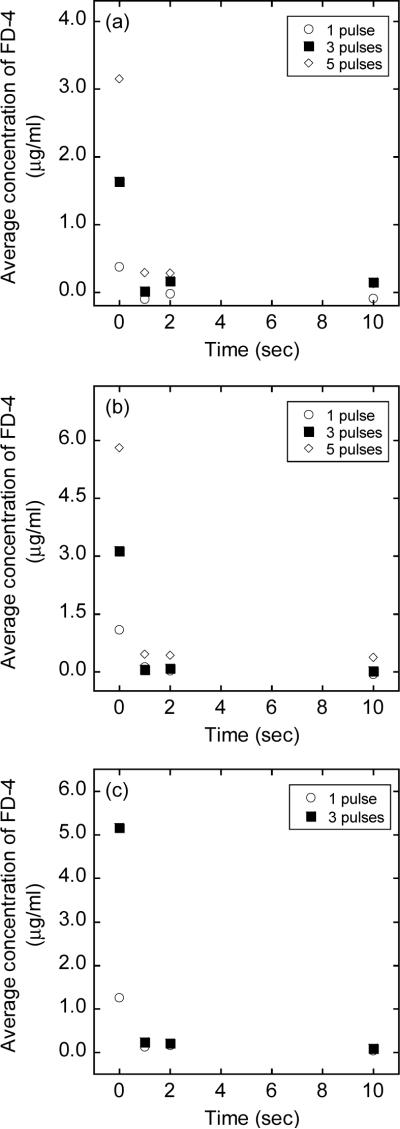
Figure 2.
Average concentrations of FD-4 in 4T1 cells exposed to pulsed electric fields. The experimental conditions were identical to those for FD-2000 shown in Figure 1, except that FD-4 instead of FD-2000 was added into cell suspensions. Each data point presents of the mean of measurements in three repeated experiments.
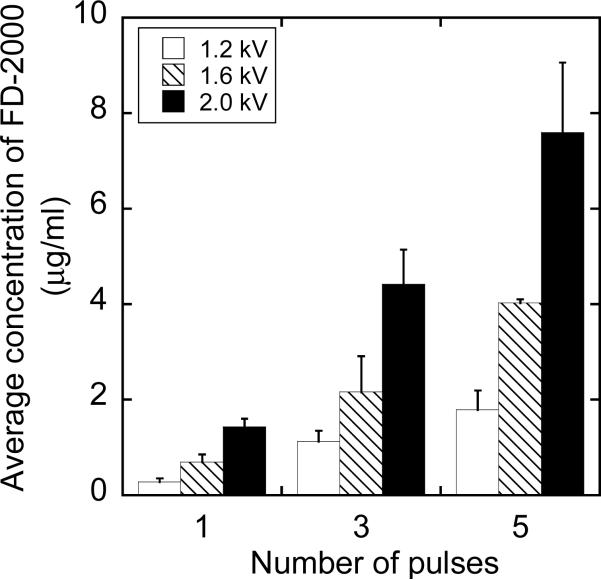
Figure 3.
Average concentration of FD-2000 in 4T1 cells exposed to pulsed electric fields. The experimental conditions were identical to those shown in Figure 1, except that FD-2000 was always added into cell suspensions immediately before the exposure. The error bar represents the standard deviation of data from three repeated experiments.
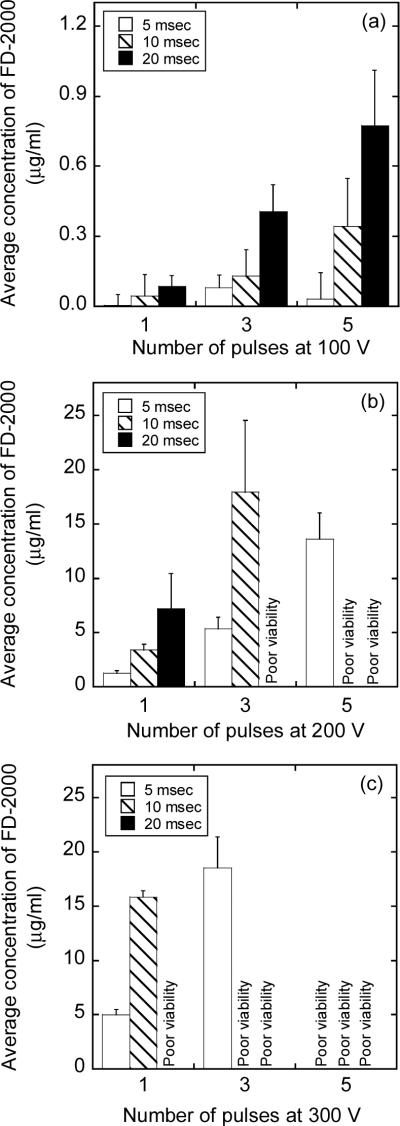
Figure 5.
Average concentrations of FD-2000 in 4T1 cells exposed to low voltage, long duration pulses with an amplitude of (a) 100 V, (b) 200 V, or (c) 300 V. The number of pulses was 1, 3, or 5; and the pulse duration was 5, 10, or 20 msec. FD-2000 was added into cell suspensions immediately before the exposure. The intracellular concentrations were not quantified if the cell viability was < 10% as indicated by “poor viability”. The error bar represents the standard deviation of data from three repeated experiments.
FITC-labeled dextran molecules, FD-4 with MW being 4,000 or FD-2000 with MW being 2,000,000 (Sigma, St. Louis, MO), were added into the pulsing medium either immediately before the application of electric field or at a time delay of 1, 2, or 10 sec after the final pulse. The concentrations of FDs in the pulsing medium were fixed at 1 mg/ml in all experimental groups. In a preliminary experiment, FD molecules were added at 5 min after the final pulse and no differences were observed in terms of intracellular concentrations of FDs, compared to those with time delays of 1, 2, and 10 sec, respectively. Thus, experimental groups with the time delay >10 sec were not included in this study. In the control group, tumor cells were mixed with FD molecules but not exposed to pulsed electric fields.
To determine the intracellular concentrations of FDs, cell suspensions were transferred to microcentrifuge tubes and rinsed twice with PBS. The final cell pellets were re-suspended in 4 μM ethidium homodimer-1 (Molecular Probes, Eugene, OR), prepared with 1 ml PBS for staining dead cells; and transferred to a 6-well culture plate. Cells in the plates were examined under a laser scanning confocal microscope workstation (Zeiss LSM 510, Thornwood, NY) equipped with both trans- and epi-illumination and a 20x objective. Three different locations per well were randomly selected. At each location, three images were acquired. One with trans-illumination was used to identify debris in the well; the second image from the fluorescence channel for ethidium homodimer-1 was used to identify dead cells; and the third image from the fluorescence channel for FITC was used to determine the average fluorescence intensity per cell in alive tumor cells using the Image-Pro Plus software (Media Cybernetics, Silver Spring, MD). The intensity data were converted to concentrations of FDs in cells, based on calibration curves derived before each experiment by imaging a range of FD concentrations in flat glass capillaries (VitroCom, Mountain Lakes, NJ). Finally, the concentrations of FDs were subtracted by the intracellular concentration of the same molecule in the control group. The results after subtraction, which reflected the cellular uptake of FDs induced by pulsed electric field, are reported here.
Mathematical model of FD diffusion into spherical cells
During electroporation, the cell membrane is permeabilized only in cap regions surrounding hyperpolarized and depolarized poles of the cell, respectively (8, 22). The size of each permeabilized cap can be characterized by the polar angle θ.p (44, 45), which is approximately the same for both caps (22). To model the cellular uptake of FD through the pores in the cap regions, we assumed: (i) the pores were uniform in size; (ii) the size of pores changed with time as a square wave function; (iii) the asymmetry in pore distributions between the two poles was negligible for transport analysis; and (iv) diffusion was the dominant mode of FD transport both across the membrane and within the cell. After pulse application, the pores in the membrane may remain open for approximately 1 msec (8, 22), which will extend the pore opening period, T, beyond the pulse duration. During the period, the distance of FD diffusion within the cell could be estimated by , where D is the diffusion coefficient. The diffusion distance was observed in a preliminary study to be significantly smaller than the dimension of the permeabilized cap (Lpm) that could be estimated , where R is the cell radius. Therefore, the model further assumed that the curvature of cell membrane was negligible and FD transport was one-dimensional (1-D), i.e., it was predominantly in the direction perpendicular to the membrane. The validation of the 1-D assumption was confirmed by the simulation data shown in the Results section. Based on all assumptions mentioned above, the governing equation for intracellular diffusion in the vicinity of a permeabilized membrane was
| (1) |
where t is the time, x is the distance away from the membrane, and C is the intracellular concentration. The initial and boundary conditions were
| (2) |
| (3) |
| (4) |
where C0 is the concentration in the extracellular medium and P is the permeability coefficient of FD across the membrane. Equations 1 through 4 can be solved analytically and the solution is
| (5) |
where erfc is the complementary error function and h is the ratio of P and D (46). The average intracellular concentration (Cmean) of FD was defined as the total amount of FD in a cell per unit volume. It was calculated by integrating Equation 5. The result is,
| (6) |
For 1-D diffusion in a membrane with homogeneous structures, P can be determined by,
| (7) |
where α is the fractional area of pores in a permeabilized cap and δ is the membrane thickness. Dp is the diffusion coefficient in the pores, which could be estimated by D0, the diffusion coefficient of the same molecule in dilute solution. This was because the diameter of FD used in the study was either larger than or comparable to the membrane thickness δ. ϕ is the partition coefficient of FD in the pores. It was estimated by (1 − λ)2 for 0 ≤ λ ≤ 1 (47), where λ is the ratio of diameters between FD (dFD) and the pore (dp). When λ > 1, ϕ = 0. Taken together, h was calculated by
| (8) |
in the model used for simulation.
Baseline values of model constants
It was assumed that R = 6.4 μm, based on unpublished data of 4T1 cells, δ = 5 nm, and θp = 54° (22). The diffusion coefficients of FD-2000 and FD-4 in water were 9.6×10⁻⁸ cm2/s (48, 49) and 1.35×10⁻⁶ cm2/s (49, 50), respectively. The ratios of extracellular to intracellular diffusion coefficients were assumed to be 0.225 for FD-4 (51) and 0.05 for FD-2000, which was within the range of data in the literature (51–53). The hydrodynamic diameters of FD-2000 and FD-4 were 52 nm (48) and 3.72 nm (50), respectively. The average diameter of pores varied from 5 nm to 500 nm. The fractional area of pores in a permeabilized cap (α) was related to the total area of pores per unit cell surface area (γ) via the equation: α = γ/(1 − cosθp). The value of γ is between 0 and 0.08% during the electroporation (22). Thus, the value of α was assumed to be between 0 and 0.3% to cover the range of γ if θp = 54°. Data in the literature have also demonstrated that electropores created in the membrane shrink biphasically after pulse application (42, 43). The initial phase is on the order of milliseconds and the second phase may last for hours. As a result, the total opening period (T) of pores for macromolecules can be several orders of magnitude shorter than that for small molecules. If the pulse duration was < 0.1 msec, once could assumed that T was between 0.1 and 10 msec (22, 42).
Results
Dextran uptake by 4T1 cells following high voltage, short duration pulses
Experiments on cellular uptake of FD-2000 were divided into four groups. In the first group (i.e., group GB), FD-2000 was added into cell suspensions immediately before electroporation and the intracellular concentration of FD-2000 was quantified after electroporation. In groups G1s, G2s, and G10s, FD-2000 was added into cell suspensions at 1, 2, and 10 sec, respectively, after electroporation and the intracellular concentration was quantified a few minutes after the addition of dextran. The average concentrations of FD-2000 in 4T1 cells, due to the exposure to pulsed electric fields, are shown in Figure 1. The intracellular concentrations of FD-2000 in groups G1s, G2s, and G10s were significantly lower than those in group GB. The differences were statistically significant (p < 0.01, Wilcoxon signed-rank test), when the data were pooled and paired according to the type of pulses. Adding FD-2000 at 5 min before electroporation did not lead to different intracellular concentrations compared with those in group GB. In addition, the intracellular concentrations in groups G1s, G2s, and G10s were not statistically different from those in non-pulsed controls, indicating that the cellular uptake in these groups was not mediated by pulsed electric fields.
Pores smaller than FD-2000 were likely to be created as well during electroporation (22). To investigate the dynamics of smaller pores, the experiments described above were repeated for FD-4. The experimental results shown in Figure 2 were similar to those of FD-2000 shown in Figure 1. Quantitatively, the intracellular concentrations were significantly greater in group GB than in other groups (p < 0.01, Wilcoxon signed-rank test) and the intracellular concentrations of FD-4 in groups G1s, G2s, and G10s were not statistically different from those in non-pulsed controls. For cells treated with 5 pulses at 2.0 kV each, the intracellular concentrations were not measured because the cell viability was estimated to be less than 10%.
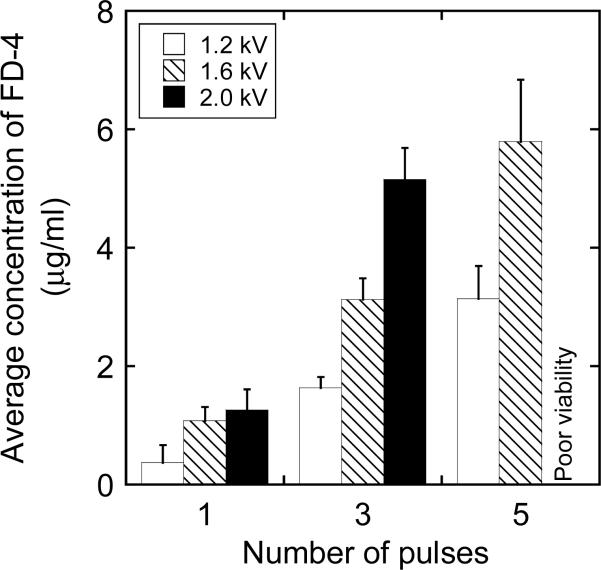
The intracellular concentrations in group GB depended on pulsing conditions for both FD-2000 (see Figure 3) and FD-4 (see Figure 4). The concentrations increased linearly with the number of pulses (R > 0.99) and the pulse amplitude (R > 0.93). Furthermore, the intracellular concentration of FD-4 was statistically greater than that of FD-2000 (p = 0.023, Wilcoxon signed-rank test) when the concentration data were pooled and paired according to the type of pulses. The mean and median of the concentration ratios between FD-4 and FD-2000 were 1.38 and 1.44, respectively.
Figure 4.
Average concentration of FD-4 in 4T1 cells exposed to pulsed electric fields. The experimental conditions were identical to those shown in Figure 2, except that FD-4 was always added into cell suspensions immediately before the exposure. For cells treated with 5 pulses at 2.0 kV each, the intracellular concentrations were not measured because the cell viability was estimated to be less than 10%. The error bar represents the standard deviation of data from three repeated experiments.
Transmembrane transport of FD-2000 induced by low voltage, long duration pulses
Transmembrane transport of FD-2000 was also investigated for a range of electric pulses with low voltage and long duration that have been commonly employed during in vivo electroporation (9, 10). It was observed in a preliminary experiment that the cellular uptake of FD-2000 was negligible in groups G1s, G2s, and G10s as compared with that in group GB. This observation was similar to the data shown in Figure 1, where high voltage, short duration pulses were used in the experiment. Therefore, only experiments in group GB were performed for pulses with low voltage and long duration. Figure 5 summarizes the experimental data of average intracellular concentrations of FD-2000. Compared with high voltage, short duration pulses (see Figure 1), the low voltage, long duration pulses resulted in a higher cellular uptake of FD-2000 (see Figures 5b and 5c), with the exception for the 100-V pulses shown in Figure 5a. The lower intracellular concentrations at 100 V might be explained by the inability of these pulses to establish a transmembrane potential that is higher than a threshold level for significantly inducing large pores in cell membrane (22, 54). Another major difference between low voltage, long duration pulse versus high voltage, short duration pulse was that the former caused more cell damage than the latter (see Figure 5).
Numerical simulations of cellular uptake of dextran
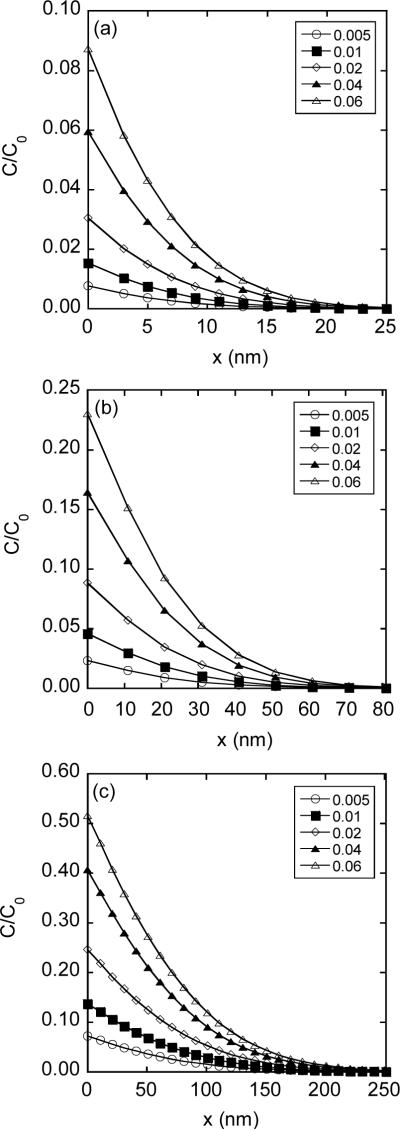
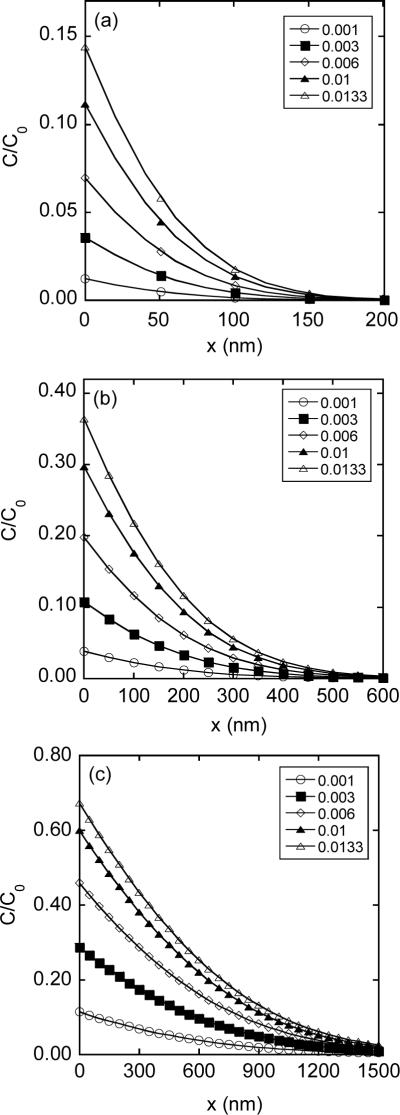
Distribution of intracellular concentration was simulated as a function of pore opening period (T) and ratio of membrane permeability versus diffusion coefficients (h), using Equation 5. The results are shown in Figures 6 and 7. The penetration depth of FD (Ld) within the cell was defined as the value of x at which the concentration was reduced to 10% of that at x = 0. Based on the data shown in Figures 6 and 7, Ld ranged from 15 nm to 141 nm for FD-2000 and 100 nm to 1.15 μm for FD-4, depending on the values of h and T used in the simulation. In all cases, the penetration depth was significantly smaller than the dimension of the permeabilized membrane (Lpm) since Lpm = 10.3 μm for R = 6.4 μm and θp = 54° (see the Materials and Methods section). This observation validated the 1-D assumption in the transport model.
Figure 6.
Spatial distribution of intracellular concentration of FD-2000 for different pore opening periods (T): (a) T = 0.1 msec; (b) T = 1 msec; and (c) T = 10 msec. The concentration profiles normalized by the concentration in pulsing medium (C0) were simulated using the mathematical model described in the Materials and Methods section. At the permeabilized membrane, x = 0. The concentration profiles depended on the parameter hδ, where h is the ratio of membrane permeability versus diffusion coefficients and δ is the membrane thickness. The maximum range of hδ was estimated by using Equation 8, in which λ was assumed to be zero, D0/D = 1/0.05, and the value of α was between 0 and 0.3% (see the Materials and Methods section). As a result, hδ ≤ 0.06. It was varied from 0.005 to 0.06 in the simulation.
Figure 7.
Spatial distribution of intracellular concentration of FD-4 for different pore opening periods (T): (a) T = 0.1 msec; (b) T = 1 msec; and (c) T = 10 msec. The concentration profiles were normalized by the concentration in pulsing medium (C0). The value of hδ was varied from 0.001 to 0.0133 (see the legend of Figure 6).
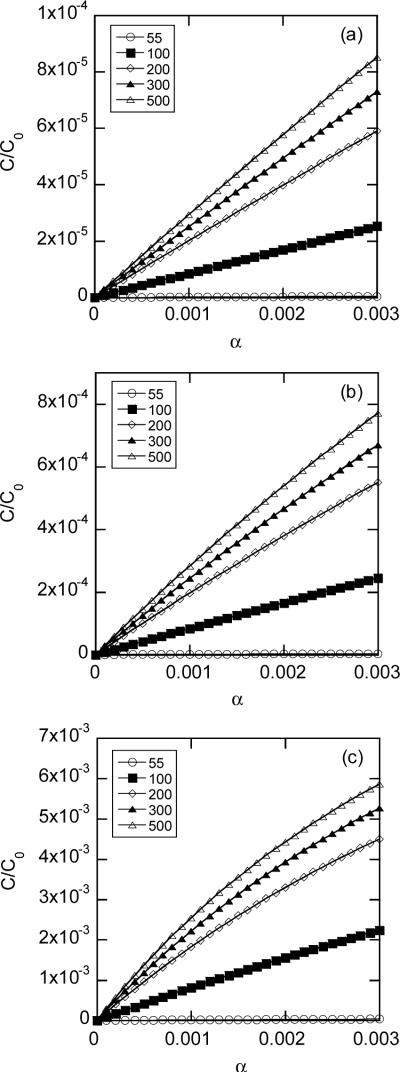
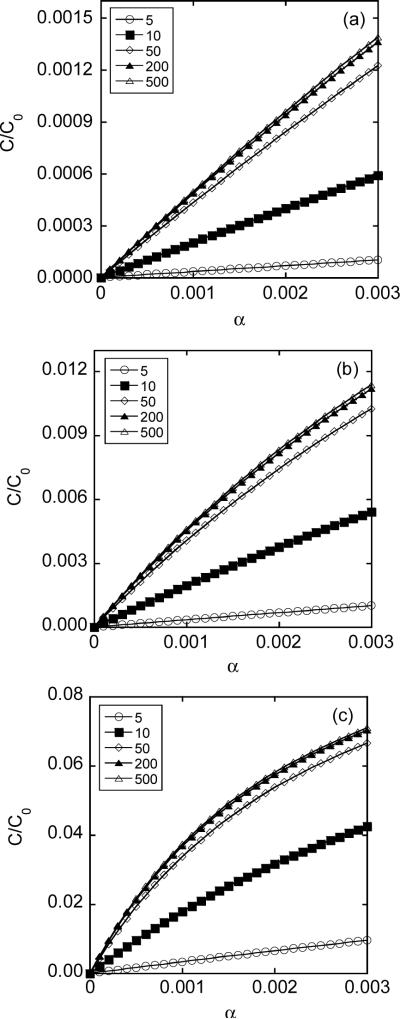
The average intracellular concentrations calculated using Equation 6 increased with increasing the fractional area of pores in the permeabilized membrane for both FD-4 and FD-2000 (see Figures 8 and 9). In addition, the concentrations increased with increasing the opening period and the diameter (dp) of pores. The concentrations became less dependent on dp when pores were much larger than dextran molecules.
Figure 8.
Average intracellular concentrations of FD-2000 as a function of the fractional area of pores in the permeabilized membrane (α) for different pore opening periods (T): (a) T = 0.1 msec; (b) T = 1 msec; and (c) T = 10 msec. The average concentrations were normalized by the concentration in pulsing medium (C0), which depended on average pore diameter ranging from 55 to 500 nm in the simulation.
Figure 9.
Average intracellular concentrations of FD-4 as a function of the fractional area of pores in the permeabilized membrane (α) for different pore opening periods (T): (a) T = 0.1 msec; (b) T = 1 msec; and (c) T = 10 msec. The average concentrations were normalized by the concentration in pulsing medium (C0), which depended on average pore diameter ranging from 5 to 500 nm in the simulation.
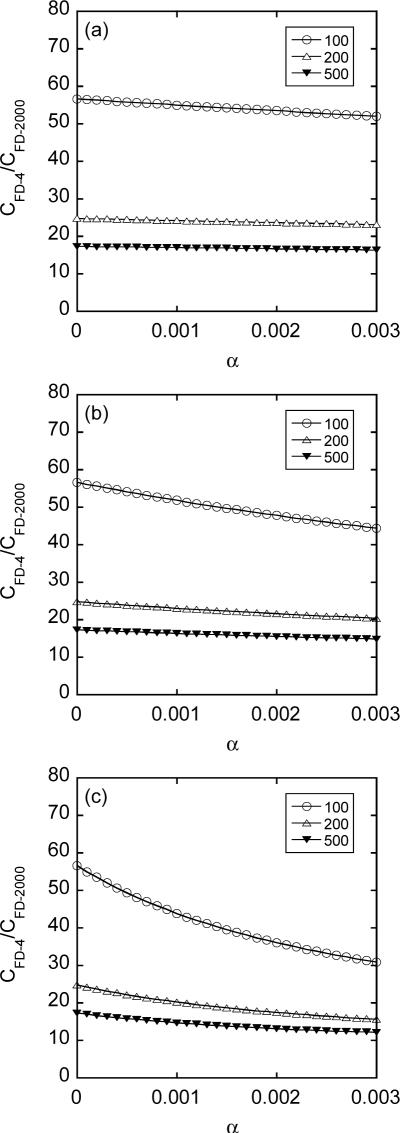
The ratios of average intracellular concentrations between FD-4 and FD-2000 were calculated for pore diameter being 100, 200, and 500 nm, respectively, using Equation 6. The results are shown in Figure 10. As expected, the ratio increased with decreasing the pore size. When the pores were smaller than FD-2000, the ratio would become infinite. Furthermore, the intracellular concentrations of FD-4 were at least one order of magnitude higher than those of FD-2000 under the same simulation conditions.
Figure 10.
Ratios of intracellular concentrations between FD-4 and FD-2000 as a function of the fractional area of pores in the permeabilized membrane cap (α) for different pore opening periods (T): (a) T = 0.1 msec; (b) T = 1 msec; and (c) T = 10 msec. The ratios depended on average pore diameter that was chosen to be 100, 200, or 500 nm in the simulation.
Discussion
We developed a novel, repeatable assay for quantification of intracellular concentrations of macromolecules, and a mathematical model for numerical simulation of transmembrane and intracellular transport. The experimental data revealed that large pores were created during electroporation but shrank rapidly and became impermeable to FD-4 and FD-2000 within 1 sec after the final pulse application. The numerical simulation provided useful information on electropore dynamics and mechanisms of macromolecular uptake by cells.
One of the key elements in this study was the development of the assay for quantification of intracellular concentrations of macromolecules. The assay was based on the use of a laser scanning confocal microscope that could image a defined section or volume within a cell. As a result, intracellular FD concentration could be quantified following a simple calibration of fluorescence intensity vs. known FD concentrations. Such quantification is not possible with a traditional fluorescence microscope in which out-of-focus light may cause image degradation and intensity of illumination may fluctuate during measurements. A second advantage of this method was the ability to image cells stained with ethidium homodimer in a separate fluorescence channel to exclude dead cells. It was critical for accurate measurement of intracellular concentrations of macromolecules, especially when a large fraction of cells died during experiments.
The ratio of intracellular versus extracellular concentration of FD observed in all experiments was < 2%. Specifically, the concentration ratios were 0.44% for FD-2000 and 0.52% for FD-4 when 4T1 cells were exposed to 3 pulses with duration of 99 μsec and amplitude of 2 kV (see Figures 3 and 4). These values were 6 to 7-fold smaller than the uptake of bovine serum albumin (~3%) by erythrocyte ghosts exposed to 3 exponential-decay pulses with a decay constant of 1.1 ms and the same peak field strength (5 kV/cm) (43). The lower intracellular concentration observed in our experiments could be caused by differences in types of cells and electric pulses.
The predicted penetration depth of FD-2000 (Ld) was smaller than its diameter (i.e., 52 nm) when the pore opening period T was equal to 0.1 msec or 1 msec in numerical simulations. This result suggested that the continuum assumption used in the mathematical model was inappropriate for diffusion in a cell. On the other hand, the model may still be valid statistically when a large number of cells are sampled to determine the average distribution of intracellular concentration. The limited penetration of FD-2000 in cells was consistent with the observation of pDNA molecules after electroporation, which accumulate only in the vicinity of the permeabilized membrane at the pole facing the cathode (12, 55). DNA accumulation near both poles can be achieved if the pulse polarity is altered.
Pore dynamics
The experimental data shown in Figures 1 and 2 demonstrated that the majority of large pores created during electroporation disappeared within 1 sec after the final pulse application. This observation was similar to those in the literature (28, 33, 39, 40, 43). Small pores, on the other hand, may last much longer after electroporation since cellular uptake of small molecules or enhancement of membrane conductance occurs both during the electroporation and at 3 to 40 min after the pulse application (37, 56–59). Therefore, it has been proposed in the literature that electroporation creates two populations of pores (8, 33, 40, 60, 61). The small pores are permeable to molecules with molecular weight up to 1,000, and can last for hours after the pulse application. The large pores allow cellular uptake of macromolecules but exist mainly during the application of pulsed field. They may disappear or shrink to become small pores within 1 msec after the pulse application. Similarly, our numerical simulations suggested that the resealing time constant of electropores larger than FD-4 should be < 10 msec if the predicted intracellular concentrations were on the same order of magnitude of experimental data. This analysis implies that pDNA must be mixed with cells before electroporation in order to have successful gene transfer.
Data shown in Figures 3–5 demonstrated that the low voltage, long duration (LV) pulses were more effective than the high voltage, short duration (HV) pulses for macromolecular delivery into cells. This observation was consistent with that in the literature, in which cellular uptake of macromolecules is more significant for pulses with longer duration (>1 ms) even if the product of pulse number and duration is fixed (40). However, our data and others in the literature showed that LV pulses caused more cell damage than HV pulses (40). The damage could be due to irreversible membrane electroporation or exchanging molecules between cytosol and pulsing medium during electroporation, which may significantly disturb intracellular microenvironment.
The pathways for transmembrane transport during electroporation remain a subject of debate (8). The most common hypothesis states that applied electric field creates transient hydrophilic pores in the membrane that allow transmembrane transport of solutes. Other pathways have also been proposed for transmembrane transport, including dynamic mismatches between lipid domains or between lipids and transmembrane proteins (8, 62, 63). Although the mathematical model developed in this study was based on the pore theory, its applications do not depend on the existence of aqueous toroidal pores in the membrane. No matter which pathways are used in the study, the only equation that needs to be modified is the expression for partition coefficient ϕ.
Mechanisms of cellular uptake of dextran
We observed in experiments that the intracellular concentration of FD-4 was approximately 40% higher than that of FD-2000. However, results from numerical simulations indicated that the former should be at least one order of magnitude higher than the latter. The discrepancy suggested that although diffusion could be an important mechanism of FD transport in cells after the pores in cell membrane were closed, it played little role in cellular uptake of dextran during electroporation. There exist two other mechanisms that may facilitate transport of FD into cells: convection and endocytosis. Convection is much less dependent on the molecular weight, which is consistent with our experimental data. In dilute solution, it is independent of the molecular weight. In cells, it may be retarded by intracellular structures, such as cytoskeleton. The extent of retardation may increase with the size of solutes. Convection-mediated cellular uptake is possible due to cell movement, cell swelling, and electrodeformation. Electric field-induced cell movement had been observed in this and previous studies (42). If the vector of movement had a nonzero component in the direction of cell axis, which is defined by depolarized and hyperpolarized poles, it might allow flow of the pulsing medium and thus convection of dextran into the cells. Cell swelling may also induce convection since pulsing medium has to enter the cell during the volume increase. It has been considered that cell swelling is caused by both colloid-osmotic and electro-osmotic effects during electroporation (41, 42, 64–67). Furthermore, cells may deform when they are exposed to strong electric pulses (68). The electrodeformation will induce convective transport if it causes an increase in cell volume. In addition to convection, pulsed electric fields may induce endocytosis and macropinocytosis (8, 69, 70). However, we observed few fluorescent vesicles in cells and a diffuse pattern of intracellular distribution of FDs, suggesting that endocytosis and macropinocytosis do not play an important role in cellular uptake of FD.
For highly charged molecules, such as plasmids, electrophoresis is an important transport mechanism. Its relative importance compared to other mechanisms can be estimated through the following analysis based on our experimental data. One may assume (i) the radius of a cell to be 6.4 μm, (ii) the maximum intracellular concentration of FD-2000 to be 2.5% of that in the pulsing medium (see Figure 5), and (iii) the percent intracellular concentration of a 5-kb plasmid to be the same as that of FD-2000. In most transfection protocols, the extracellular pDNA concentration ranges from 1 to 20 μg/ml. The molecular weight of 5-kb plasmid is approximately 3,000,000. Based on the information described above, there are only 6 to 110 copies of the plasmid per cell. In an elegant microinjection study, Ludtke et al. observed that in order to achieve 50% transfection efficiency, one requires approximately 2000 copies of plasmid per cell (71), which is at least an order of magnitude higher than the estimation based on the dextran data. The discrepancy is likely to be caused by the third assumption, indicating that the percent intracellular concentration of plasmid should be significantly higher than that of FD-2000 presumably due to electrophoresis since the net charge of FD-2000 is negligible compared to that of plasmids. As a result, passive transport is ineffective for transfection of cells unless electrophoresis of DNA is involved during electric field-mediated gene delivery.
In conclusion, electropores created by pulsed electric fields were transient and their maximum diameter was at least 52 nm under the pulsing conditions used in this study. All pores shrank to less than 3.72 nm within 1 sec. During electroporation, cellular uptake of macromolecules is likely to be mediated by convection since diffusion played little role.
Acknowledgments
This work was supported in part by a grant from the National Institutes of Health (CA94019).
References
- 1.Verma IM, Somia N. Gene therapy -- promises, problems and prospects. Nature. 1997;389:239–242. doi: 10.1038/38410. [DOI] [PubMed] [Google Scholar]
- 2.Kay MA, Glorioso JC, Naldini L. Viral vectors for gene therapy: the art of turning infectious agents into vehicles of therapeutics. Nat Med. 2001;7:33–40. doi: 10.1038/83324. [DOI] [PubMed] [Google Scholar]
- 3.Wang Y, Yuan F. Delivery of viral vectors to tumor cells: extracellular transport, systemic distribution, and strategies for improvement. Ann Biomed Eng. 2006;34:114–127. doi: 10.1007/s10439-005-9007-2. [DOI] [PubMed] [Google Scholar]
- 4.Zaharoff DA, Barr RC, Li CY, Yuan F. Electromobility of plasmid DNA in tumor tissues during electric field-mediated gene delivery. Gene Ther. 2002;9:1286–1290. doi: 10.1038/sj.gt.3301799. [DOI] [PubMed] [Google Scholar]
- 5.Zaharoff DA, Yuan F. Effects of pulse strength and pulse duration on in vitro DNA electromobility. Bioelectrochemistry. 2004;62:37–45. doi: 10.1016/j.bioelechem.2003.10.011. [DOI] [PubMed] [Google Scholar]
- 6.Henshaw JW, Zaharoff DA, Mossop BJ, Yuan F. A single molecule detection method for understanding mechanisms of electric field-mediated interstitial transport of genes. Bioelectrochemistry. 2006;69:248–253. doi: 10.1016/j.bioelechem.2006.03.006. [DOI] [PubMed] [Google Scholar]
- 7.Henshaw JW, Zaharoff DA, Mossop BJ, Yuan F. Electric field-mediated transport of plasmid DNA in tumor interstiitum in vivo. Submitted. 2007 doi: 10.1016/j.bioelechem.2007.07.005. [DOI] [PMC free article] [PubMed] [Google Scholar]
- 8.Teissie J, Golzio M, Rols MP. Mechanisms of cell membrane electropermeabilization: a minireview of our present (lack of ?) knowledge. Biochim Biophys Acta. 2005;1724:270–280. doi: 10.1016/j.bbagen.2005.05.006. [DOI] [PubMed] [Google Scholar]
- 9.Heller LC, Ugen K, Heller R. Electroporation for targeted gene transfer. Expert Opin Drug Deliv. 2005;2:255–268. doi: 10.1517/17425247.2.2.255. [DOI] [PubMed] [Google Scholar]
- 10.Mir LM, Moller PH, Andre F, Gehl J. Electric pulse-mediated gene delivery to various animal tissues. Adv Genet. 2005;54:83–114. doi: 10.1016/S0065-2660(05)54005-7. [DOI] [PubMed] [Google Scholar]
- 11.Somiari S, Glasspool-Malone J, Drabick JJ, Gilbert RA, Heller R, Jaroszeski MJ, Malone RW. Theory and in vivo application of electroporative gene delivery. Molecular Therapy. 2000;2:178–187. doi: 10.1006/mthe.2000.0124. [DOI] [PubMed] [Google Scholar]
- 12.Henshaw JW, Yuan F. Field distribution and DNA transport in solid tumors during electric field-mediated gene delivery. J Pharm Sci. 2007 doi: 10.1002/jps.21000. in press. [DOI] [PubMed] [Google Scholar]
- 13.Rols MP. Electropermeabilization, a physical method for the delivery of therapeutic molecules into cells. Biochim Biophys Acta. 2006;1758:423–428. doi: 10.1016/j.bbamem.2006.01.005. [DOI] [PubMed] [Google Scholar]
- 14.Chang DC, Reese TS. Changes in membrane structure induced by electroporation as revealed by rapid-freezing electron microscopy. Biophys J. 1990;58:1–12. doi: 10.1016/S0006-3495(90)82348-1. [DOI] [PMC free article] [PubMed] [Google Scholar]
- 15.Neumann E, Toensing K, Kakorin S, Budde P, Frey J. Mechanism of electroporative dye uptake by mouse B cells. Biophys J. 1998;74:98–108. doi: 10.1016/S0006-3495(98)77771-9. [DOI] [PMC free article] [PubMed] [Google Scholar]
- 16.Neumann E, Kakorin S, Toensing K. Fundamentals of electroporative delivery of drugs and genes. Bioelectrochem Bioenerg. 1999;48:3–16. doi: 10.1016/s0302-4598(99)00008-2. [DOI] [PubMed] [Google Scholar]
- 17.Bilska AO, DeBruin KA, Krassowska W. Theoretical modeling of the effects of shock duration, frequency, and strength on the degree of electroporation. Bioelectrochemistry. 2000;51:133–143. doi: 10.1016/s0302-4598(00)00066-0. [DOI] [PubMed] [Google Scholar]
- 18.Gowrishankar TR, Weaver JC. An approach to electrical modeling of single and multiple cells. Proc Natl Acad Sci U S A. 2003;100:3203–3208. doi: 10.1073/pnas.0636434100. [DOI] [PMC free article] [PubMed] [Google Scholar]
- 19.Neu JC, Krassowska W. Asymptotic model of electroporation. Physical Review E. 1999;59:3471–3482. [Google Scholar]
- 20.Krassowska W, Neu JC. Response of a single cell to an external electric field. Biophys J. 1994;66:1768–1776. doi: 10.1016/S0006-3495(94)80971-3. [DOI] [PMC free article] [PubMed] [Google Scholar]
- 21.DeBruin KA, Krassowska W. Modeling electroporation in a single cell. I. Effects Of field strength and rest potential. Biophys J. 1999;77:1213–1224. doi: 10.1016/S0006-3495(99)76973-0. [DOI] [PMC free article] [PubMed] [Google Scholar]
- 22.Krassowska W, Filev PD. Modeling electroporation in a single cell. Biophys J. 2007;92:404–417. doi: 10.1529/biophysj.106.094235. [DOI] [PMC free article] [PubMed] [Google Scholar]
- 23.Ghosh PM, Keese CR, Giaever I. Monitoring electropermeabilization in the plasma membrane of adherent mammalian cells. Biophys J. 1993;64:1602–1609. doi: 10.1016/S0006-3495(93)81531-5. [DOI] [PMC free article] [PubMed] [Google Scholar]
- 24.Gowrishankar TR, Pliquett U, Lee RC. Dynamics of membrane sealing in transient electropermeabilization of skeletal muscle membranes. Ann N Y Acad Sci. 1999;888:195–210. doi: 10.1111/j.1749-6632.1999.tb07957.x. [DOI] [PubMed] [Google Scholar]
- 25.Pavlin M, Leben V, Miklavcic D. Electroporation in dense cell suspension-Theoretical and experimental analysis of ion diffusion and cell permeabilization. Biochim Biophys Acta. 2007;1770:12–23. doi: 10.1016/j.bbagen.2006.06.014. [DOI] [PubMed] [Google Scholar]
- 26.Wolf H, Rols MP, Boldt E, Neumann E, Teissie J. Control by pulse parameters of electric field-mediated gene transfer in mammalian cells. Biophys J. 1994;66:524–531. doi: 10.1016/s0006-3495(94)80805-7. [DOI] [PMC free article] [PubMed] [Google Scholar]
- 27.Gift EA, Weaver JC. Simultaneous quantitative determination of electroporative molecular uptake and subsequent cell survival using gel microdrops and flow cytometry. Cytometry. 2000;39:243–249. [PubMed] [Google Scholar]
- 28.Bright GR, Kuo NT, Chow D, Burden S, Dowe C, Przybylski RJ. Delivery of macromolecules into adherent cells via electroporation for use in fluorescence spectroscopic imaging and metabolic studies. Cytometry. 1996;24:226–233. doi: 10.1002/(SICI)1097-0320(19960701)24:3<226::AID-CYTO5>3.0.CO;2-F. [DOI] [PubMed] [Google Scholar]
- 29.Gabriel B, Teissie J. Time courses of mammalian cell electropermeabilization observed by millisecond imaging of membrane property changes during the pulse. Biophys J. 1999;76:2158–2165. doi: 10.1016/S0006-3495(99)77370-4. [DOI] [PMC free article] [PubMed] [Google Scholar]
- 30.Prausnitz MR, Lau BS, Milano CD, Conner S, Langer R, Weaver JC. A quantitative study of electroporation showing a plateau in net molecular transport. Biophys J. 1993;65:414–422. doi: 10.1016/S0006-3495(93)81081-6. [DOI] [PMC free article] [PubMed] [Google Scholar]
- 31.Canatella PJ, Karr JF, Petros JA, Prausnitz MR. Quantitative study of electroporation-mediated molecular uptake and cell viability. Biophys J. 2001;80:755–764. doi: 10.1016/S0006-3495(01)76055-9. [DOI] [PMC free article] [PubMed] [Google Scholar]
- 32.Tekle E, Astumian RD, Chock PB. Selective and asymmetric molecular transport across electroporated cell membranes. Proc Natl Acad Sci U S A. 1994;91:11512–11516. doi: 10.1073/pnas.91.24.11512. [DOI] [PMC free article] [PubMed] [Google Scholar]
- 33.Hibino M, Itoh H, Kinosita K., Jr. Time courses of cell electroporation as revealed by submicrosecond imaging of transmembrane potential. Biophys J. 1993;64:1789–1800. doi: 10.1016/S0006-3495(93)81550-9. [DOI] [PMC free article] [PubMed] [Google Scholar]
- 34.Puc M, Kotnik T, Mir LM, Miklavcic D. Quantitative model of small molecules uptake after in vitro cell electropermeabilization. Bioelectrochemistry. 2003;60:1–10. doi: 10.1016/s1567-5394(03)00021-5. [DOI] [PubMed] [Google Scholar]
- 35.Djuzenova CS, Zimmermann U, Frank H, Sukhorukov VL, Richter E, Fuhr G. Effect of medium conductivity and composition on the uptake of propidium iodide into electropermeabilized myeloma cells. Biochim Biophys Acta. 1996;1284:143–152. doi: 10.1016/s0005-2736(96)00119-8. [DOI] [PubMed] [Google Scholar]
- 36.Golzio M, Teissie J, Rols MP. Cell synchronization effect on mammalian cell permeabilization and gene delivery by electric field. Biochim Biophys Acta. 2002;1563:23–28. doi: 10.1016/s0005-2736(02)00369-3. [DOI] [PubMed] [Google Scholar]
- 37.Gabriel B, Teissie J. Control by electrical parameters of short- and long-term cell death resulting from electropermeabilization of Chinese hamster ovary cells. Biochim Biophys Acta. 1995;1266:171–178. doi: 10.1016/0167-4889(95)00021-j. [DOI] [PubMed] [Google Scholar]
- 38.Teissie J, Eynard N, Gabriel B, Rols MP. Electropermeabilization of cell membranes. Advanced Drug Delivery Reviews. 1999;35:3–19. doi: 10.1016/s0169-409x(98)00060-x. [DOI] [PubMed] [Google Scholar]
- 39.Zhen J, Kennedy SM, Booske JH, Hagness SC. Experimental studies of persistent poration dynamics of cell membranes induced by electric pulses. IEEE Trans Plasma Sci. 2006;34:1416–1424. [Google Scholar]
- 40.Rols MP, Teissie J. Electropermeabilization of mammalian cells to macromolecules: control by pulse duration. Biophys J. 1998;75:1415–1423. doi: 10.1016/S0006-3495(98)74060-3. [DOI] [PMC free article] [PubMed] [Google Scholar]
- 41.Sukharev SI, Klenchin VA, Serov SM, Chernomordik LV, Chizmadzhev Yu A. Electroporation and electrophoretic DNA transfer into cells. The effect of DNA interaction with electropores. Biophys J. 1992;63:1320–1327. doi: 10.1016/S0006-3495(92)81709-5. [DOI] [PMC free article] [PubMed] [Google Scholar]
- 42.Dimitrov DS, Sowers AE. Membrane electroporation--fast molecular exchange by electroosmosis. Biochim Biophys Acta. 1990;1022:381–392. doi: 10.1016/0005-2736(90)90289-z. [DOI] [PubMed] [Google Scholar]
- 43.Prausnitz MR, Milano CD, Gimm JA, Langer R, Weaver JC. Quantitative study of molecular transport due to electroporation: uptake of bovine serum albumin by erythrocyte ghosts. Biophys J. 1994;66:1522–1530. doi: 10.1016/S0006-3495(94)80943-9. [DOI] [PMC free article] [PubMed] [Google Scholar]
- 44.Mossop BJ, Barr RC, Henshaw JW, Yuan F. Electric Fields around and within Single Cells during Electroporation-A Model Study. Ann Biomed Eng. 2007 doi: 10.1007/s10439-007-9282-1. [DOI] [PubMed] [Google Scholar]
- 45.Mossop BJ, Barr RC, Zaharoff DA, Yuan F. Electric fields within cells as a function of membrane resistivity--a model study. IEEE Trans Nanobioscience. 2004;3:225–231. doi: 10.1109/tnb.2004.833703. [DOI] [PubMed] [Google Scholar]
- 46.Crank J. The Mathematics of Diffusion. Oxford University Press; New York: 1975. [Google Scholar]
- 47.Truskey GA, Yuan F, Katz DF. Transport Phenomena in Biological Systems. Pearson Prentics Hall; Upper Saddle River, NJ: 2004. [Google Scholar]
- 48.Lebrun L, Junter GA. Diffusion of sucrose and dextran through agar gel membranes. Enzyme Microb Technol. 1993;15:1057–1062. doi: 10.1016/0141-0229(93)90054-6. [DOI] [PubMed] [Google Scholar]
- 49.Berk DA, Yuan F, Leunig M, Jain RK. Fluorescence photobleaching with spatial Fourier analysis: measurement of diffusion in light-scattering media. Biophys J. 1993;65:2428–2436. doi: 10.1016/S0006-3495(93)81326-2. [DOI] [PMC free article] [PubMed] [Google Scholar]
- 50.Granath KA, Kvist BE. Molecular weight distribution analysis by gel chromatography on Sephadex. J Chromatogr. 1967;28:69–81. doi: 10.1016/s0021-9673(01)85930-6. [DOI] [PubMed] [Google Scholar]
- 51.Verkman AS. Solute and macromolecule diffusion in cellular aqueous compartments. Trends Biochem Sci. 2002;27:27–33. doi: 10.1016/s0968-0004(01)02003-5. [DOI] [PubMed] [Google Scholar]
- 52.Popov S, Poo MM. Diffusional transport of macromolecules in developing nerve processes. J Neurosci. 1992;12:77–85. doi: 10.1523/JNEUROSCI.12-01-00077.1992. [DOI] [PMC free article] [PubMed] [Google Scholar]
- 53.Luby-Phelps K. Cytoarchitecture and physical properties of cytoplasm: volume, viscosity, diffusion, intracellular surface area. Int Rev Cytol. 2000;192:189–221. doi: 10.1016/s0074-7696(08)60527-6. [DOI] [PubMed] [Google Scholar]
- 54.Mossop BJ, Barr RC, Henshaw JW, Zaharoff DA, Yuan F. Electric fields in tumors exposed to external voltage sources: implication for electric field-mediated drug and gene delivery. Ann Biomed Eng. 2006;34:1564–1572. doi: 10.1007/s10439-006-9151-3. [DOI] [PubMed] [Google Scholar]
- 55.Golzio M, Teissie J, Rols MP. Direct visualization at the single-cell level of electrically mediated gene delivery. Proc Natl Acad Sci U S A. 2002;99:1292–1297. doi: 10.1073/pnas.022646499. [DOI] [PMC free article] [PubMed] [Google Scholar]
- 56.Bier M, Hammer SM, Canaday DJ, Lee RC. Kinetics of sealing for transient electropores in isolated mammalian skeletal muscle cells. Bioelectromagnetics. 1999;20:194–201. doi: 10.1002/(sici)1521-186x(1999)20:3<194::aid-bem6>3.0.co;2-0. [DOI] [PubMed] [Google Scholar]
- 57.Escande-Geraud ML, Rols MP, Dupont MA, Gas N, Teissie J. Reversible plasma membrane ultrastructural changes correlated with electropermeabilization in Chinese hamster ovary cells. Biochim Biophys Acta. 1988;939:247–259. doi: 10.1016/0005-2736(88)90068-5. [DOI] [PubMed] [Google Scholar]
- 58.Garner AL, Chen NY, Yang J, Kolb J, Swanson RJ, Loftin KC, Beebe SJ, Joshi RP, Schoenbach KH. Time domain dielectric spectroscopy measurements of HL-60 cell suspensions after microsecond and nanosecond electrical pulses. IEEE Trans Plasma Sci. 2004;32:2073–2084. [Google Scholar]
- 59.Shirakashi R, Sukhorukov VL, Tanasawa I, Zimmermann U. Measurement of the permeability and resealing time constant of the electroporated mammalian cell membranes. Int J Heat Mass Transfer. 2004;47:4517–4524. [Google Scholar]
- 60.Kinosita K, Jr., Ashikawa I, Saita N, Yoshimura H, Itoh H, Nagayama K, Ikegami A. Electroporation of cell membrane visualized under a pulsed-laser fluorescence microscope. Biophys J. 1988;53:1015–1019. doi: 10.1016/S0006-3495(88)83181-3. [DOI] [PMC free article] [PubMed] [Google Scholar]
- 61.Liang H, Purucker WJ, Stenger DA, Kubiniec RT, Hui SW. Uptake of fluorescence-labeled dextrans by 10T 1/2 fibroblasts following permeation by rectangular and exponential-decay electric field pulses. Biotechniques. 1988;6:550–558. [PubMed] [Google Scholar]
- 62.Cruzeiro-Hansson L, Mouritsen OG. Passive ion permeability of lipid membranes modelled via lipid-domain interfacial area. Biochim Biophys Acta. 1988;944:63–72. doi: 10.1016/0005-2736(88)90316-1. [DOI] [PubMed] [Google Scholar]
- 63.el-Mashak EM, Tsong TY. Ion selectivity of temperature-induced and electric field induced pores in dipalmitoylphosphatidylcholine vesicles. Biochemistry. 1985;24:2884–2888. doi: 10.1021/bi00333a010. [DOI] [PubMed] [Google Scholar]
- 64.Tsong TY. Electroporation of cell membranes. Biophys J. 1991;60:297–306. doi: 10.1016/S0006-3495(91)82054-9. [DOI] [PMC free article] [PubMed] [Google Scholar]
- 65.Kinosita K, Jr., Tsong TY. Formation and resealing of pores of controlled sizes in human erythrocyte membrane. Nature. 1977;268:438–441. doi: 10.1038/268438a0. [DOI] [PubMed] [Google Scholar]
- 66.Klenchin VA, Sukharev SI, Serov SM, Chernomordik LV, Chizmadzhev Yu A. Electrically induced DNA uptake by cells is a fast process involving DNA electrophoresis. Biophys J. 1991;60:804–811. doi: 10.1016/S0006-3495(91)82115-4. [DOI] [PMC free article] [PubMed] [Google Scholar]
- 67.Wang HY, Lu C. High-throughput and real-time study of single cell electroporation using microfluidics: Effects of medium osmolarity. Biotech Bioeng. 2006;95:1116–1125. doi: 10.1002/bit.21066. [DOI] [PubMed] [Google Scholar]
- 68.Zimmermann U, Friedrich U, Mussauer H, Gessner P, Hamel K, Sukhoruhov V. Electromanipulation of mammalian cells: Fundamentals and application. IEEE Trans Plasma Sci. 2000;28:72–82. [Google Scholar]
- 69.Rols MP, Femenia P, Teissie J. Long-lived macropinocytosis takes place in electropermeabilized mammalian cells. Biochem Biophys Res Commun. 1995;208:26–35. doi: 10.1006/bbrc.1995.1300. [DOI] [PubMed] [Google Scholar]
- 70.Glogauer M, Lee W, McCulloch CA. Induced endocytosis in human fibroblasts by electrical fields. Exp Cell Res. 1993;208:232–240. doi: 10.1006/excr.1993.1242. [DOI] [PubMed] [Google Scholar]
- 71.Ludtke JJ, Sebestyen MG, Wolff JA. The effect of cell division on the cellular dynamics of microinjected DNA and dextran. Mol Ther. 2002;5:579–588. doi: 10.1006/mthe.2002.0581. [DOI] [PubMed] [Google Scholar]


