

Abstract
Fibroblast growth factor 23 (FGF-23), dentin matrix protein 1 (DMP1), and matrix extracellular phosphoglycoprotein (MEPE) are skeletal proteins involved in the regulation of phosphate homeostasis and bone metabolism. Circulating FGF-23 levels are increased in patients with chronic kidney disease (CKD); however, FGF-23 skeletal expression and its regulation by DMP1 and MEPE have yet to be evaluated. Thus, expression of these three proteins was characterized by immunohistochemistry in 32 pediatric and young adult patients with CKD stages 2–5. When compared to normal controls, bone FGF-23 and DMP1 expression were increased in all stages of CKD; significant differences in bone FGF-23 and DMP1 expression were not detected between pre-dialysis CKD and dialysis patients. Bone MEPE expression in CKD did not differ from controls. FGF-23 was expressed in osteocyte cell bodies located at the trabecular periphery. DMP1 was widely expressed in osteocyte cell bodies and dendrites throughout bone. MEPE was also expressed throughout bone, but only in osteocyte cell bodies. Bone FGF-23 expression correlated directly with plasma levels of the protein (r=0.43, p<0.01) and with bone DMP1 expression (r=0.54, p<0.01) and expression of both proteins were inversely related to osteoid accumulation. Bone MEPE expression was inversely related to bone volume. In conclusion, skeletal FGF-23 and DMP1 expression are increased in CKD and are related to skeletal mineralization. The patterns of expression of FGF-23, MEPE, and DMP1 differ markedly in trabecular bone, suggesting that individual osteocytes may have specialized functions. Increases in bone FGF-23 and DMP1 expression suggest that osteocyte function is altered early in the course of CKD.
INTRODUCTION
Abnormalities in parathyroid hormone (PTH), calcium, phosphorus and vitamin D contribute to some, but not all, of the complex alterations in bone structure and function that accompany chronic kidney disease (CKD). Recent data suggest that skeletal proteins such as fibroblast growth factor 23 (FGF-23), dentin matrix protein 1 (DMP1), and matrix extracellular phosphoglycoprotein (MEPE), may regulate each other through direct or indirect mechanisms (1;2), and circulating levels of FGF-23 are markedly elevated in patients with CKD (3). We have previously demonstrated that plasma FGF-23 levels may be a biomarker of bone mineralization in pediatric patients treated with maintenance dialysis (4); however, the skeletal expression of FGF-23 in the context of uremia, its potential regulation by DMP1 and MEPE, and the role of these proteins in the pathophysiology of renal osteodystrophy remain unknown.
Bone histomorphometry is a powerful tool for assessing bone turnover, mineralization, and volume (5), while immunohistochemistry of un-decalcified bone biopsy specimens identifies protein expression in situ (5;6). When combined, these techniques have the potential to offer insights into the biochemistry of bone biology. FGF-23, DMP1, and MEPE are all expressed in bone (1;7–11), but their patterns of expression in bone biopsy specimens of patients with CKD have yet to be evaluated. Thus, the current study was performed in order to characterize bone FGF-23, DMP1, and MEPE expression by immunohistochemistry, to quantify expression of each protein, and to examine the relationship between each protein and bone histomorphometry in patients with differing degrees of renal function and various subtypes of renal osteodystrophy.
MATERIALS AND METHODS
Thirty-two patients, ages 2–26 years, were included in the current study. All subjects had either stable CKD stages 2–4 or had been treated with maintenance dialysis for at least 6 months and all underwent bone biopsy between 2006 and 2008 as part of a study to characterize renal osteodystrophy across the spectrum of CKD. The study was approved by the UCLA Human Subject Protection Committee, and informed consent was obtained from all patients and/or parents.
Patients treated with growth hormone or immunosuppressive agents within the previous 6 months and those who had undergone parathyroidectomy within the preceding year were excluded. Subjects receiving maintenance CCPD were treated with 2.5 mEq/l calcium dialysate concentration; those undergoing maintenance hemodialysis were dialyzed against a 2.0 mEq/l calcium bath. Prior to the bone biopsy, subjects were treated with either vitamin D sterols and/or phosphate binders as prescribed by their treating physicians. Serum values of calcium, albumin, phosphorus, alkaline phosphatase, PTH, FGF-23, 25(OH)vitamin D and 1,25(OH)2vitamin D were obtained at the time bone biopsy. Serum calcium, phosphorus, albumin, and alkaline phosphatase values were measured using an Olympus AU5400 (Olympus America Incorporated, Center Valley, PA). Values for calcium were adjusted based on serum albumin level by the formula: serum Ca = measured calcium + (0.8 × (4-serum albumin)). PTH concentrations were measured by the 1st generation immunometric assay (ImmutopicsR, San Clemente, California), which detects full-length PTH as well as large C-terminal fragments (normal range: 10–65 pg/ml). FGF-23 levels were determined in plasma using two immunometric assays, termed “intact” and “C-terminal” assays (ImmutopicsR, San Clemente, CA) whose characteristics have been described (4;12). 25(OH)vitamin D and 1,25(OH)2vitamin D levels were measured by radioimmunoassay (13).
Bone Histomorphometry
Patients were admitted to the UCLA General Clinical Research Center and full thickness bone biopsies were obtained from the anterior iliac crest (2 cm below the anterior superior iliac spine) using a modified Bordier trephine needle after double tetracycline-labeling, as has been previously described (14). Biopsy specimens were 0.5 cm in diameter by 1–2 cm in length. Specimens were fixed in buffered formaline for 2 hours, then dehydrated in alcohol, cleared with xylene, and embedded in methylmethacrylate. Static histomorphometric parameters were evaluated in undecalcified 5 µm sections treated with Toluidine blue stain; tetracycline labeling was assessed in unstained 10 µm sections.
Primary bone histomorphometric parameters were assessed in trabecular bone under 200x magnification using the OsteoMetricsR system (OsteoMetrics, Decatur, GA). Mineralized bone was defined by dark blue staining areas; pale-blue seams at least 1.5 µm in width were included in measurements of osteoid. Derived indices were calculated by formulae displayed in the appendix. The Turnover, Mineralization and Volume (TMV) classification for renal osteodystrophy (5) was used to characterize bone pathology.
Appendix.
Formulae used to calculate derived bone histomorphometric indices from primary measurements
| Abbreviation Structural |
Parameter | Unit | Formula |
|---|---|---|---|
| BV/TV | Bone volume/tissue volume |
% | Bone area/tissue area * 100 |
| Static Formation | |||
| OV/BV | Osteoid volume/bone volume |
% | Osteoid area/bone area *100 |
| OS/BS | Osteoid surface/bone surface |
% | Osteoid perimeter/bone perimeter * 100 |
| O.Th | Osteoid thickness | µm | (Osteoid area/osteoid perimeter) * 2/1.2 |
| Dynamic Formation | |||
| MS/BS | Mineralizing surface/bone surface |
% | (Double label perimeter + 1/2 single label perimeter)/bone perimeter *100 |
| MAR | Mineral apposition rate |
µm/d | (Distance between labels/inter-label period)/1.2 |
| AjAr | Adjusted apposition rate |
µm/d | (MAR * MS/BS)/OS/BS * 0.01 |
| MLT | Mineralization lag time |
d | O.Th/AjAr |
| OMT | Osteoid maturation time |
d | O.Th/MAR |
| BFR/BS | Bone formation rate/bone surface volume |
μm2/mm3/yr | MAR * MS/BS * 3.65 |
| Immunohistochemistry | |||
| FGF-23/T.Ar | Number of osteocytes expressing FGF- 23/tissue area |
#/mm2 | Number of osteocytes expressing FGF-23/tissue area |
Normal values for all histomorphometric parameters were previously obtained from double-tetracycline labeled iliac crest bone biopsy specimens from 31 pediatric patients with normal kidney function who were undergoing elective orthopedic surgery (14).
Immunohistochemistry and Quantification of Bone FGF-23, DMP1 and MEPE Expression
The technique for immunohistochemical detection of FGF-23, DMP1 and MEPE in bone was adapted from a previously reported method (6;15). In brief, two adjacent 5 µm sections of bone tissue were placed side by side on each slide. Sections were de-plastified in xylene and chloroform, rehydrated in graded alcohol solutions and partially decalcified in 1% acetic acid. Endogenous peroxidase activity was quenched in 3% hydrogen peroxide/methanol solution. Non-specific binding was blocked in avidin-biotin solution and in 5% normal horse serum with 1% bovine serum albumin. Sections were then incubated with either affinity purified polyclonal goat anti-human FGF-23(225–244) (Immutopics Intl, San Clemente, California), monoclonal antihuman DMP1 (LFMb31)(62–513) (Dr. Larry Fisher, National Institutes of Health), or monoclonal anti-human MEPE (LFMb33)(42–525) (Dr. Larry Fisher) primary antibody overnight at 4°C in a humidified chamber. Subsequently, samples were incubated with biotinylated horse anti-goat secondary antibody (Vector, Burlingame, CA, USA) followed by ABComplex/HRP complex (ABC-kit, Vector), and developed using AEC kit (Vector). Sections were then counterstained with Mayer hematoxilin (Sigma-Aldrich, St. Louis, MO). Iliac crest bone biopsy specimens from 4 adolescent and young adult subjects with normal renal function comprised the “normal control” population. Negative controls were performed for each bone section by omitting the primary antibody. The specimen sections were batched; thus, immunohistochemistry was performed simultaneously on all 32 patient specimens, along with normal and negative controls. Reproducibility was ensured by repeating the immunohistochemistical analysis on all specimens.
The entire area of trabecular bone (an average total tissue area of 18.5 ± 1.2 mm2/section), was assessed in each section by a single examiner blinded to bone histomorphometric diagnosis and to serum biochemical values. In order to quantify the bone expression of FGF-23 and MEPE, whose presence in the boney trabeculae were limited to the osteocyte cell bodies, staining was dichotomized as either “present” or “absent” in any given osteocyte and the total number of trabecular osteocytes with positive staining were counted and normalized by tissue or bone area. Since DMP1 expression was more diffuse, DMP1 osteocytic expression was analyzed using the Ariol SL-50 automated slide scanner (Applied Imaging, San Jose, California). Thresholds for each image were applied using the Ariol analytical software based on multiple parameters including RGB algorithm, shape, and size. In order to assess staining, the area of positive stain was calculated by applying color thresholds to detect positive red pixels. Percent positivity was determined by dividing the total positive stain area (mm2) by the total tissue area analyzed (mm2) (16–19). All analyses were performed with the MultiStain script.
Statistical Analysis
Measurements for bone and biochemical variables are reported as mean ± standard error. Median values for non-normally distributed variables (PTH, alkaline phosphatase, intact FGF-23, C-terminal FGF-23, 1,25 dihydroxyvitamin D, bone formation rate/bone surface, and mineralization lag time) are also displayed. In order to evaluate the effect of residual renal function on FGF-23, DMP1, or MEPE expression, subjects were divided into 2 groups: CKD stages 2–4 and subjects treated with maintenance dialysis. The Mann-Whitney test was used to assess differences between the two groups; subsequently, all patients were considered together. Spearman correlation coefficients were used to express the relationship between skeletal protein expression, bone histomorphometric parameters, and biochemical values. All statistical analyses were performed using SAS software (SAS Institute Inc., Cary, NC) and all tests were two-sided. A probability of type I error less than 5% was considered statistically significant and ordinary p values are reported.
RESULTS
Patient Characteristics and Biochemical Determinations
Patient demographics are presented in Table 1 and biochemical parameters are displayed in Table 2. Twelve subjects had CKD stages 2–4 and 20 patients were treated with maintenance dialysis (either continuous cycling peritoneal dialysis (CCPD, n=12) or thrice weekly hemodialysis, n=8). Levels of serum calcium were within the normal range in all subjects, while phosphorus and PTH concentrations were elevated only in patients treated with maintenance dialysis. Median C-terminal and intact plasma FGF-23 concentrations were higher in patients treated with dialysis than in those with CKD stages 2–4. 25(OH)vitamin D values were insufficient (<30 ng/dl) in half of all patients. 1,25(OH)2 vitamin D values did not differ between patients with CKD stages 2–4 and those treated with maintenance dialysis, reflecting the effects of administered vitamin D sterol therapy on circulating 1,25(OH)2 vitamin D values in dialysis patients.
Table 1.
Demographics
| CKD Stages 2–4 | CKD Stage 5 (dialysis) |
Healthy controls for immunohistochemical analysis |
|
|---|---|---|---|
| Patient number (n) | 12 | 20 | 4 |
| Renal function/dialysis | 36 (15 – 72) | 11 PD/5 HD | >90 ml/min/1.73m2 |
| modality (n or median (range)) |
ml/min/1.73m2 | ||
| Age (median (range)) (y) | 14 (2 – 20) | 19 (9 – 26) | 22 (14 – 28) |
| Gender | 9M/3F | 13M/7F | 2M/2F |
| Race (n) | |||
| Caucasian | 4 | 3 | 2 |
| Hispanic | 8 | 14 | |
| Black | 2 | 2 | |
| Asian | 1 | ||
| Vitamin D sterol therapy (n) |
10 |
Table 2.
Biochemical Measurements
| Parameter | CKD | Dialysis |
|---|---|---|
| Calcium (mg/dl) | 9.4 ± 0.1 | 9.1 ± 0.2 |
| Phosphorus (mg/dl) | 4.5 ± 0.3 | 6.8 ± 0.4a |
| Alkaline Phosphatase (IU/l) | 274 ± 55 | 301 ± 53 |
| 229 (138, 343)b | 191 (157, 408)b | |
| 25(OH)vitamin D (pg/ml) | 27 ± 2 | 24 ± 3 |
| 1,25(OH)2vitamin D (ng/ml) | 35.0 ± 3.7 | 27.5 ± 5.8 |
| 33.1 (24.6, 43.1)b | 16.7 (12.5, 35.3)b | |
| PTH (pg/ml) | 167 ± 70 | 503 ± 82a |
| 68 (39, 155)b | 584 (175, 840)a,b | |
| Intact FGF-23 (pg/ml) | 112 ± 38 | 1403 ± 552a |
| 81 (25, 150)b | 436 (125, 1251)a,b | |
| C-terminal FGF-23 (RU/ml) | 251 ± 49 | 12295 ± 5023a |
| 228 (113, 386)a,b | 2880 (1131, 10206)a,b |
Indicates a difference between groups (p<0.05)
Indicates the median (interquartile range)
When all patients were considered together, plasma FGF-23 levels determined by both C-terminal and intact assays were well correlated (r=0.80, p<0.01). The relationship between the results obtained with the two assays was higher in dialysis patients (r=0.92, p<0.01) than in those with CKD stages 2–4 (r=0.52, NS). In dialysis patients but not in CKD stages 2 through 4, plasma FGF-23 levels correlated with phosphorus levels (r=0.69, p<0.01 and r=0.63, p<0.01 for C-terminal and intact assays, respectively) and serum phosphate levels were independent predictors of both C-terminal and intact plasma FGF-23 values.
Bone Histology and Bone FGF-23, DMP1, and MEPE expression
Bone histological parameters are listed in Table 3. Overall, 15 patients had high turnover bone disease (9 with mild secondary hyperparathyroidism, 2 with osteitis fibrosa, and 4 with mixed lesion), 10 had normal rates of bone formation, and 7 had low bone turnover (2 with osteomalacia and 5 with adynamic bone). Impaired mineralization, as defined by an abnormality in static and dynamic indices of mineralization, was prevalent (Table 3). Osteoid volume/bone volume (OV/BV) was increased in 25% of patients with CKD stages 2–4 and in 50% of those treated with dialysis. Twenty-five percent of all subjects, regardless of degree of renal function, had increased osteoid thickness (O.Th), and 47% had delayed mineralization lag time (MLT). Bone volume/tissue volume (BV/TV) was either normal (75%) or increased (25%) in all patients.
Table 3.
Parameters of Bone Histomorphometry
| CKD 2–4 | Dialysis | Normal Range (n=31) |
|
|---|---|---|---|
| Turnover | |||
| BFR/BS | 24.3 ± 7.8 | 24.2 ± 5.1 | 8.0 – 73.4 |
| (µm3/mm2/yr) | 14.8 (8.7–28.5)a | 17.5 (6.3–32.0)a | |
| Mineralization | |||
| OS/BS (%) | 24.8 ± 5.4 | 35.3 ± 4.4 | 4.3 – 31.7 |
| OV/BV (%) | 7.2 ± 3.4 | 9.8 ± 3.2 | 0.2 – 5.8 |
| O.Th (µm) | 11.4 ± 2.5 | 11.2 ± 0.8 | 2.0 – 13.2 |
| OMT (d) | 15 ± 4 | 297 ± 262 | 1.2 – 11.5 |
| 9 (8, 18)a | 14 (10, 29)a | ||
| MLT (d) | 469 ± 413 | 623 ± 303 | 2.3 – 63.8 |
| 28 (14, 102)a | 89 (40, 198)a | ||
| Volume | |||
| BV/TV (%) | 29.3 ± 2.6 | 29.6 ± 2.0 | 8.9 – 34.4 |
Indicates the median (interquartile range)
Bone FGF-23 expression was identified in nucleated osteocyte cell bodies within the trabeculae (Figure 1a). Osteocytes with positive staining for FGF-23 were not uniformly distributed throughout the trabeculae but were present in patchy, bright-staining clusters at the trabecular periphery (Figure 1b). Bone marrow cells, osteoblasts, and osteoclasts did not stain for the protein. When FGF-23 immunostaining was repeated and requantified on 2 subsequent occasions, the reproducibility of measured protein expression was high (1.3 ± 0.3% intra-specimen variation). Bone FGF-23 expression was higher in all patients with all stages of CKD than in normal controls, but did not differ between patients with CKD stages 2–4 and those treated with dialysis. Skeletal FGF-23 expression did not differ between patients with low, normal or high bone turnover (Table 4). In all patients, bone FGF-23 expression was inversely correlated with osteoid volume/bone volume (r= − 0.60, p<0.01), osteoid surface/bone surface (r= − 0.60, p<0.01), and osteoid thickness (r= − 0.43, p<0.05). Bone FGF-23 expression did not correlate with bone turnover or volume (Table 5).
Figure 1.
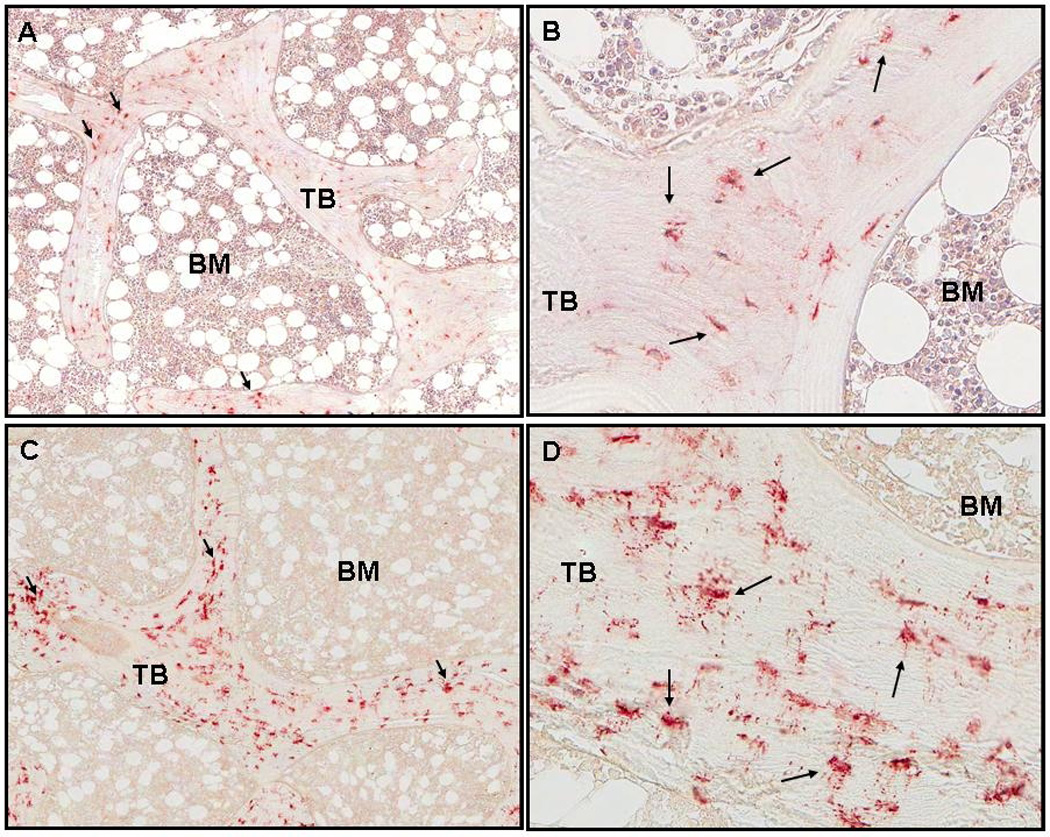
Staining of FGF-23 in cancellous bone. Arrows indicate osteoctyes with positive staining. Trabeculae and bone marrow are labeled TB and BM respectively. A. Normal control (50x). B. Normal control (200x). C. Adolescent girl with CKD stage 2 (GFR:71; Ca:10.2; P: 4.5; Alk Phos:265; PTH:12; intact FGF-23:166; C-terminal FGF-23:462; 25(OH)D:25 (50x). D: CKD stage 2 (200x). Bone FGF-23 expression was 1.21/mm2.
Table 4.
FGF-23, MEPE, and DMP1 expression
| CKD 2–4 | Dialysis | Normal Range | |
|---|---|---|---|
| FGF-23/T.Ar | 0.78 ± 0.14a | 1.38 ± 0.50a | 0.35 ± 0.1 |
| (n/mm2) | 0.83 (0.42, 1.16)a,b | 0.35 (0.02, 1.79)a,b | |
| DMP1/T.Ar | 0.20 ± 0.04a | 0.20 ± 0.03a | 0.02 ± 0.01 |
| (n/mm2) | 0.20 (0.08, 0.24)a,b | 0.16 (0.08, 0.29)a,b | |
| MEPE/B.Ar | 22.2 ± 4.2 | 16.3 ± 4.8 | 13.3 ± 0.6 |
| (n/mm2) | 22.3 (10.6, 33.0)b | 7.8 (4.2, 17.2)b |
Indicates a difference between groups (p<0.05)
Indicates the median (interquartile range)
Table 5.
Rank Correlation Coefficients between Bone Protein Expression and Parameters of Bone Histomorphometry
| Bone FGF-23 Expression (Bone FGF-23/Bone Area) |
Bone MEPE Expression (Bone MEPE/Bone Area) |
Bone DMP1 Expression (Bone DMP1/Bone Area) |
|
|---|---|---|---|
| Turnover | |||
| BFR/BS | r = − 0.13, NS | r = 0, NS | r = − 0.08, NS |
| Mineralization | |||
| OS/BS | r = − 0.60, p<0.01 | r = − 0.10, NS | r = − 0.39, p<0.05 |
| OV/BV | r = − 0.60, p<0.01 | r = − 0.01, NS | r = − 0.35, p=0.054 |
| O.Th | r = − 0.43, p<0.05 | r = − 0.08, NS | r = − 0.22, NS |
| OMT | r = − 0.18, NS | r = − 0.02, NS | r = − 0.03, NS |
| MLT | r = − 0.24, NS | r = − 0.04, NS | r = − 0.08, NS |
| Volume | |||
| BV/TV | r = 0, NS | r = − 0.36, p<0.05 | r = 0.10, NS |
| Tb.Th | r = 0.09, NS | r = − 0.42, p<0.05 | r = 0.23, NS |
DMP1 was widely expressed in osteocytes throughout trabecular bone (Figure 2a). Similar to FGF-23, bone DMP1 expression was higher in patients with CKD stages 2–4 (Table 4) and in those treated with maintenance dialysis than in normal controls. However, bone DMP1 expression did not differ between predialysis CKD and dialysis patients. Its expression was identified in osteocyte cell bodies, dendritic cell processes, and also in lacunae in which nuclei were not detected (Figure 2b). On repeat immunostaining, the reproducibility of DMP1 quantification was similar to that of FGF-23. Bone DMP1 expression was directly correlated to bone FGF-23 expression (r= 0.54, p<0.01) and inversely related to osteoid volume (r= − 0.35, p=0.054) and osteoid surface (r= − 0.39, p<0.05) (Table 5).
Figure 2.
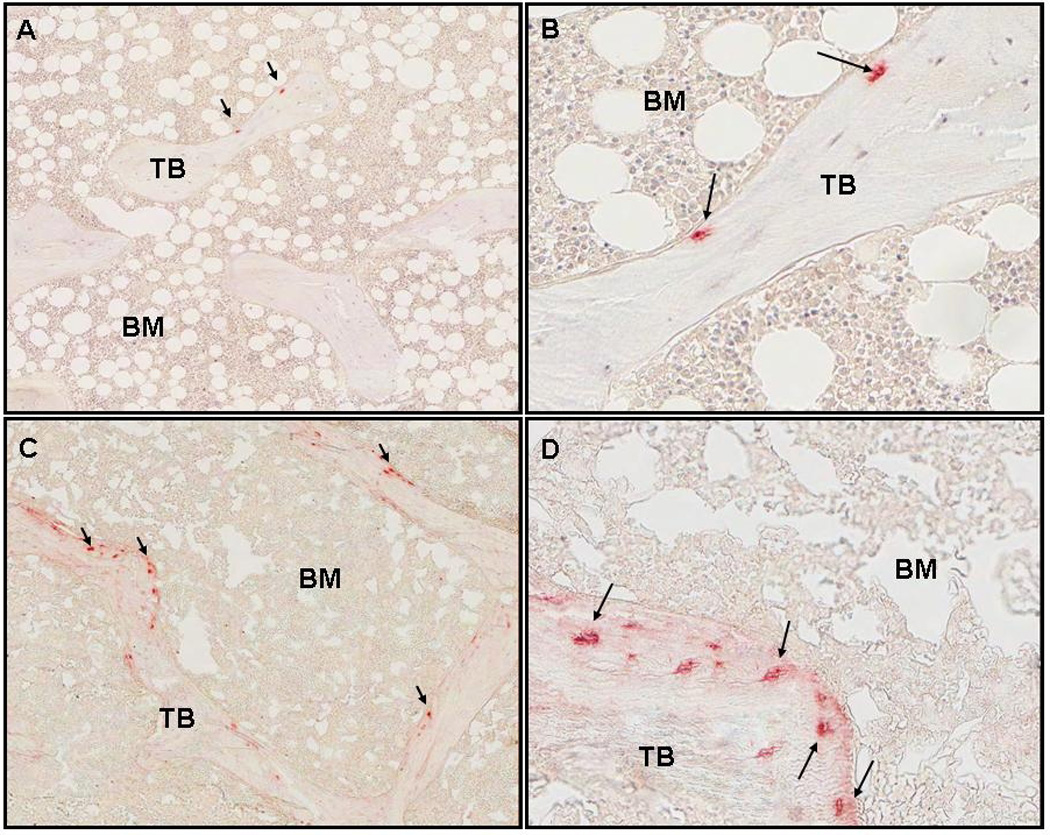
Staining of DMP1 in cancellous bone under 50x and 200x magnification. Arrows indicate osteoctyes with positive staining. Trabeculae and bone marrow are labeled TB and BM respectively. A. Normal control (50x). B. Normal control (200x). C. CKD stage 2 (50x). D: CKD stage 2 (200x). Bone DMP1 expression was 0.35/mm2.
Similar to FGF-23 and DMP1 expression, MEPE expression was identified in nucleated osteocyte cell bodies within trabecular bone. Like FGF-23 and DMP1, the intra-specimen variation in MEPE quantification was low. Its pattern of expression was more diffuse than that of FGF-23, but, unlike DMP1, MEPE was not present in dendritic processes or empty lacunae (Figures 3a and 3b). Low grade MEPE expression was identified in bone marrow cells, but not in osteoblasts or in osteoclasts. MEPE expression in CKD 2–4 and dialysis patients did not differ from normal controls, nor did protein expression differ by subtype of renal osteodystrophy. Bone expression of MEPE was inversely related to bone volume/tissue volume (r= − 0.36, p<0.05) and trabecular thickness (r= − 0.42, p<0.05), but not with any parameters of skeletal mineralization or bone turnover.
Figure 3.
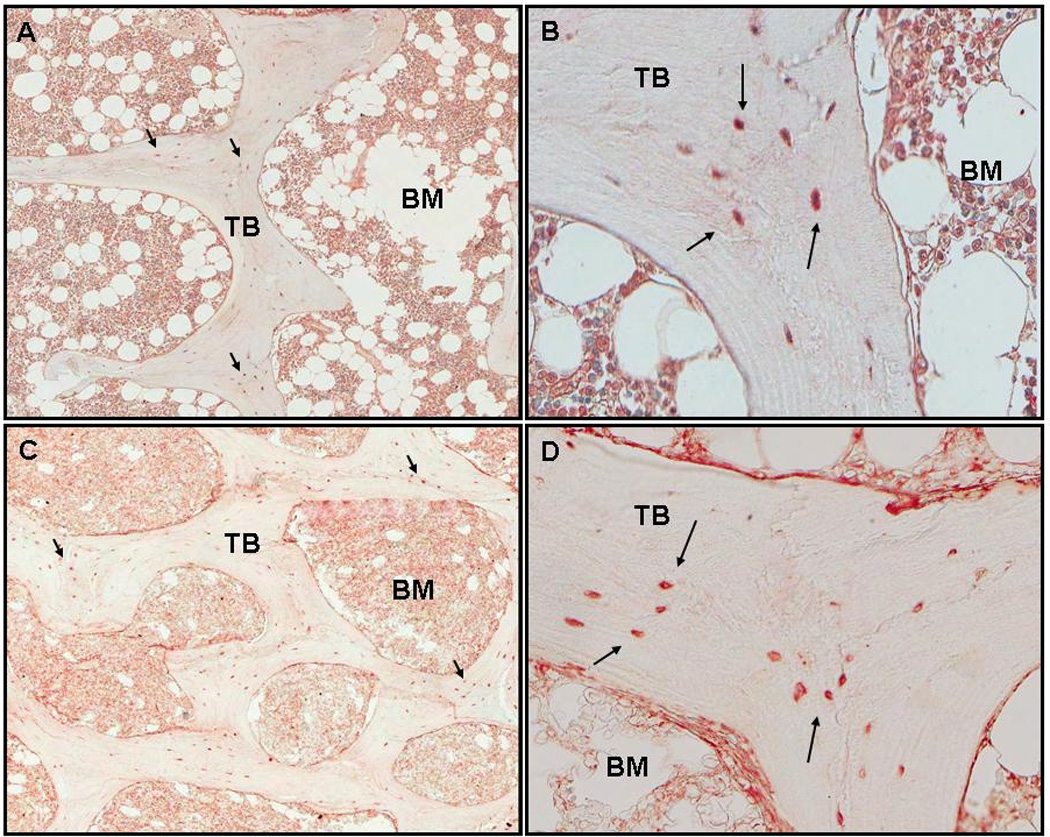
Staining of MEPE in cancellous bone under 50x and 200x magnification. Arrows indicate osteoctyes with positive staining. Trabeculae and bone marrow are labeled TB and BM respectively. A. Normal control (50x). B. Normal control (200x). C. CKD stage 2 (50x). D: CKD stage 2 (200x). Bone MEPE expression was 7.94/mm2.
Relationship between Bone Protein Expression and Serum Biochemical Values
In bivariate analysis, bone expression of FGF-23 correlated with serum phosphorus levels only in patients treated with maintenance dialysis (r=0.70, p<0.01). An inverse relationship was found between bone FGF-23 and serum alkaline phosphatase activity, as well as between bone DMP1 and serum alkaline phosphatase in all patients (r= − 0.63, p<0.01 and r= − 0.43, p<0.05 for FGF-23 and DMP1, respectively). In patients treated with maintenance dialysis, bone FGF-23 correlated with plasma FGF-23 as measured by both C-terminal and intact assays (r=0.70, p<0.01 for both assays) (Figure 2), while in patients with CKD stages 2–4, only intact plasma FGF-23 levels correlated with bone FGF-23 (r=0.69, p<0.05). Circulating levels of 1,25(OH)2vitamin D and 25(OH)vitamin D levels did not correlate with bone FGF-23 or DMP1 expression. No biochemical values correlated with bone MEPE expression.
DISCUSSION
While bone histomorphometry is the gold standard for assessing bone turnover, mineralization, and volume (5;20), the current study demonstrates the added value of immunohistochemistry (6) in assessing tissue-level skeletal protein expression in patients with renal osteodystrophy. Using immunohistochemistry in undecalcified trabecular bone specimens, the expression of three proteins--FGF-23, DMP1, and MEPE--were characterized, quantified, and related to bone histomorphometric parameters of bone turnover, mineralization, and volume. Consistent with data in individuals with normal renal function (21–23), the current study confirms that all three proteins are expressed in trabecular bone osteocytes of pediatric and young adult patients. All three proteins had different patterns of expression. Both FGF-23 and DMP1 expression were upregulated in trabecular bone in early CKD. However, MEPE expression remained unchanged from normal controls. Plasma values of FGF-23 differed markedly between patients with CKD stages 2–4 and those treated with maintenance dialysis; however, bone expression of the protein did not differ significantly between stages of CKD. In patients with all stages of CKD, the amount of bone FGF-23 correlated directly with bone DMP1 expression and the expression of each was inversely related to osteoid accumulation. By contrast, MEPE expression was not related to skeletal mineralization but was inversely related to bone volume.
Previous reports have demonstrated that FGF-23, DMP1, and MEPE are expressed in human osteocytes (21–23). However, this is the first study to simultaneously characterize and quantify the expression of these proteins by immunohistochemistry in bone samples from patients with CKD. FGF-23 staining was observed in osteocyte cell bodies grouped in clusters at the trabecular periphery while osteocytes expressing DMP1 and MEPE were distributed throughout bone. Unlike FGF-23 and MEPE, whose expression was confined to nucleated cell bodies, DMP1 was also expressed in dendrites and in cells where nuclei could not be detected. Thus, although osteocytes are distributed throughout trabecular bone, these three distinct proteins, all of which were expressed in osteocytes, displayed very different patterns of expression, suggesting that osteocytes may have different “tasks” in bone, with differences in protein expression based, at least in part, on location.
The current study is the first to identify marked increases in both bone FGF-23 and bone DMP1 expression very early in the course of CKD, with a direct correlation between bone DMP1 and bone FGF-23 expression. The simultaneous increase in both DMP1 and FGF-23 expression appears contrary to previous data suggesting that DMP1 acts to suppress FGF-23 expression. Indeed, a complete lack of DMP1 in the context of normal renal function results in increased circulating levels and bone expression of FGF-23 (24;25), while the phenotype of the DMP1/FGF-23 double knockout is indistinguishable from that observed in FGF-23 null mice (24). However, overexpression of DMP1 does not cause the inverse phenotype—i.e. DMP1 excess does not suppress FGF-23 expression (26). Moreover, DMP1 promotor activity increases in response to increasing phosphate concentrations (27), as does FGF-23 expression (28). Thus, it is possible that the simultaneous increase in bone DMP1 and FGF-23 expression in the current study reflects the increasing phosphate burden associated with progressive renal failure.
Alternatively, increased DMP1 expression may reflect alteration in protein function in the context of CKD. Although the mechanism by which this might occur is unknown, alterations in DMP1 protein phosphorylation or cleavage (29) could play a role. Recent data suggest that DMP1 undergoes post-translational cleavage, leaving less than 1% of the protein in the full-length form (30). The cleavage products appear to have distinct biological functions; in vitro mineralization studies have demonstrated that while the carboxyl-terminal fragment promotes mineralization (29;31), the full-length DMP1 molecule may inhibit hydroxyapatite formation (29). Thus, alterations in protein cleavage could have significant ramifications for DMP1 function.
Interestingly, although circulating FGF-23 levels are markedly increased in dialysis patients when compared to those in CKD stages 2–4, differences in bone FGF-23 expression could not be detected between patients with pre-dialysis CKD and those treated with maintenance dialysis. Indeed, the most prominant differences in bone FGF-23 expression were observed when comparing normal controls to subjects with any degree of CKD. By contrast, the greatest differences in circulating FGF-23 levels were those observed between patients on dialysis compared to those with pre-dialysis CKD. This discrepancy between bone expression and plasma levels of the protein may be related to renal clearance; indeed, FGF-23 is cleared by the kidneys and dialyzed patients with any (even very minimal) urine output have much lower circulating FGF-23 values than do dialysis patients who are completely anuric (4). Thus, although bone expression of FGF-23 may be similar in CKD 2–4 and in dialysis patients, renal clearance in CKD stages 2–4 may result in lower circulating FGF-23 levels.
Unlike prior studies, in which decalcification of the tissue block precluded the simultaneous performance of bone histomorphometry, the current technique, adapted to undecalcified bone, allowed for comparison of protein expression with bone histomorphometric data. In the current cohort of CKD patients, higher bone expression of both FGF-23 and bone DMP1 was associated with decreased osteoid accumulation (i.e. improved mineralization). The correlation between increased FGF-23 expression and improvements in skeletal mineralization were unexpected, since primary increases in FGF-23 in the context of normal renal function result in urinary phosphate wasting, suppression of circulating calcitriol levels, and defective skeletal mineralization (i.e. rickets/osteomalacia) (32). However, these findings are not unprecedented, since a complete deficiency in FGF-23, as is found in the FGF-23 null mouse, results in focal areas of defective skeletal mineralization, despite increased circulating levels of phosphate, calcium, and 1,25(OH)2vitamin D. In the current study, FGF-23 expression was found in patchy clusters of osteocytes, a finding which may relate to the non-uniform areas of defective skeletal mineralization in Fgf-23 null animals (24). Combined with recent evidence describing an inverse relationship between plasma FGF-23 levels and skeletal mineralization in patients treated with maintenance dialysis (4), these data suggest a role for FGF-23 expression in the local regulation of skeletal mineralization.
Although animal studies have also suggested functional interactions between FGF-23 and MEPE (2;33), no relationship between bone FGF-23 or bone DMP1 and bone MEPE expression was found in the current study. Indeed, bone MEPE expression did not appear to be altered by the presence of CKD and, similar to the MEPE null mice who display evidence of increased bone mass (34), bone MEPE expression was inversely related to histomorphometric parameters of bone volume in all subjects.
The small sample size, heterogeneity of the patient population, and intrinsic difficulties associated with quantifying protein expression by immunhistochemistry may have reduced our ability to further characterize the expression of FGF-23, DMP1, and MEPE in CKD. Interestingly, however, the marked difference in bone FGF-23 and DMP1 expression in any degree of renal dysfunction from normal controls suggests that osteocyte function is altered very early in the course of CKD. This may be the first detectable change in osteocyte function in the course of renal osteodystrophy. Moreover, the relationship between skeletal mineralization and bone FGF-23 and bone DMP1 is not altered by degree of renal function nor by bone histomorphometric diagnosis, suggesting that the relationship between these parameters and bone histology is so marked as to overcome these potentially confounding factors.
In conclusion, in pediatric and young adult patients with CKD stages 2–5 and with different subtypes of renal osteodystrophy, immunohistochemical detection of bone FGF-23, DMP1, and MEPE expression offers new insights into the pathophysiology of renal osteodystrophy. All three proteins are expressed in osteocytes, yet their patterns of expression differ markedly. Bone FGF-23 and DMP1 expression are increased very early in the course of CKD. FGF-23 and DMP1 expression are inversely related to skeletal mineralization, while bone MEPE expression inversely correlates with bone volume. Changes in bone FGF-23 and DMP1 expression may therefore reflect alterations in osteocyte metabolism that occur very early in the course of CKD.
Supplementary Material
ACKNOWLEDGMENTS
We would like to thank Jeffrey Lavigne and Richard Zahradnik at ImmutopicsR for providing the Intact and C-terminal FGF-23 assays as well as FGF-23 antibody for immunostaining, and Larry Fisher at the NIH for providing the MEPE and DMP1 antibodies. Scanning and analyses of bone DMP1 expression were performed through the Translational Pathology Core Laboratory, Department of Pathology and Laboratory Medicine, The David Geffen School of Medicine at UCLA.
Sources of Support: This study was supported by USPHS grants DK-35423, DK-67563 and MO1-RR00865 and by funds from the Casey Lee Ball Foundation.
Footnotes
Publisher's Disclaimer: This is a PDF file of an unedited manuscript that has been accepted for publication. As a service to our customers we are providing this early version of the manuscript. The manuscript will undergo copyediting, typesetting, and review of the resulting proof before it is published in its final citable form. Please note that during the production process errors may be discovered which could affect the content, and all legal disclaimers that apply to the journal pertain.
Disclosures
Isidro B. Salusky has receive honoraria from Genzyme, Amgen, and Johnson & Johnson.
REFERENCES
- 1.Feng JQ, Ward LM, Liu S, Lu Y, Xie Y, Yuan B, Yu X, Rauch F, Davis SI, Zhang S, Rios H, Drezner MK, Quarles LD, Bonewald LF, White KE. Loss of DMP1 causes rickets and osteomalacia and identifies a role for osteocytes in mineral metabolism. Nat Genet. 2006 November;38(11):1310–1315. doi: 10.1038/ng1905. [DOI] [PMC free article] [PubMed] [Google Scholar]
- 2.Liu S, Rowe PS, Vierthaler L, Zhou J, Quarles LD. Phosphorylated acidic serine-aspartate-rich MEPE-associated motif peptide from matrix extracellular phosphoglycoprotein inhibits phosphate regulating gene with homologies to endopeptidases on the X-chromosome enzyme activity. J Endocrinol. 2007 January;192(1):261–267. doi: 10.1677/joe.1.07059. [DOI] [PMC free article] [PubMed] [Google Scholar]
- 3.Larsson T, Nisbeth U, Ljunggren O, Jűppner H, Jonsson KB. Circulating concentration of FGF-23 increases as renal function declines in patients with chronic kidney disease, but does not change in response to variation in phosphate intake in healthy volunteers. Kidney Int. 2003 December;64(6):2272–2279. doi: 10.1046/j.1523-1755.2003.00328.x. [DOI] [PubMed] [Google Scholar]
- 4.Wesseling-Perry K, Pereira RC, Wang H, Elashoff RM, Sahney S, Gales B, Jűppner H, Salusky IB. Relationship between plasma FGF-23 concentration and bone mineralization in children with renal failure on peritoneal dialysis. J Clin Endocrinol Metab. 2008 December 2; doi: 10.1210/jc.2008-0326. [DOI] [PMC free article] [PubMed] [Google Scholar]
- 5.Moe S, Drueke T, Cunningham J, Goodman W, Martin K, Olgaard K, Ott S, Sprague S, Lameire N, Eknoyan G. Definition, evaluation, and classification of renal osteodystrophy: a position statement from Kidney Disease: Improving Global Outcomes (KDIGO) Kidney Int. 2006 June;69(11):1945–1953. doi: 10.1038/sj.ki.5000414. [DOI] [PubMed] [Google Scholar]
- 6.Gomes SA, dos Reis LM, de O, I, Noronha IL, Jorgetti V, Heilberg IP. Usefulness of a quick decalcification of bone sections embedded in methyl methacrylate[corrected]: an improved method for immunohistochemistry. J Bone Miner Metab. 2008;26(1):110–113. doi: 10.1007/s00774-007-0788-2. [DOI] [PubMed] [Google Scholar]
- 7.Mirams M, Robinson BG, Mason RS, Nelson AE. Bone as a source of FGF23: regulation by phosphate? Bone. 2004 November;35(5):1192–1199. doi: 10.1016/j.bone.2004.06.014. [DOI] [PubMed] [Google Scholar]
- 8.Yoshiko Y, Wang H, Minamizaki T, Ijuin C, Yamamoto R, Suemune S, Kozai K, Tanne K, Aubin JE, Maeda N. Mineralized tissue cells are a principal source of FGF-23. Bone. 2007 February 8; doi: 10.1016/j.bone.2007.01.017. [DOI] [PubMed] [Google Scholar]
- 9.Martin A, David V, Laurence JS, Schwarz PM, Lafer EM, Hedge AM, Rowe PS. Degradation of MEPE, DMP1, and release of SIBLING ASARM-peptides (minhibins): ASARM-peptide(s) are directly responsible for defective mineralization in HYP. Endocrinology. 2008 April;149(4):1757–1772. doi: 10.1210/en.2007-1205. [DOI] [PMC free article] [PubMed] [Google Scholar]
- 10.Farrow EG, Davis SI, Ward LM, Summers LJ, Bubbear JS, Keen R, Stamp TC, Baker LR, Bonewald LF, White KE. Molecular analysis of DMP1 mutants causing autosomal recessive hypophosphatemic rickets. Bone. 2009 February;44(2):287–294. doi: 10.1016/j.bone.2008.10.040. [DOI] [PMC free article] [PubMed] [Google Scholar]
- 11.Laouari D, Friedlander G, Burtin M, Silve C, Dechaux M, Garabedian M, Kleinknecht C. Subtotal nephrectomy alters tubular function: effect of phosphorus restriction. Kidney Int. 1997 December;52(6):1550–1560. doi: 10.1038/ki.1997.485. [DOI] [PubMed] [Google Scholar]
- 12.Imel EA, Peacock M, Pitukcheewanont P, Heller HJ, Ward LM, Shulman D, Kassem M, Rackoff P, Zimering M, Dalkin A, Drobny E, Colussi G, Shaker JL, Hoogendoorn EH, Hui SL, Econs MJ. Sensitivity of fibroblast growth factor 23 measurements in tumor-induced osteomalacia. J Clin Endocrinol Metab. 2006 June;91(6):2055–2061. doi: 10.1210/jc.2005-2105. [DOI] [PubMed] [Google Scholar]
- 13.Hollis BW, Kamerud JQ, Selvaag SR, Lorenz JD, Napoli JL. Determination of vitamin D status by radioimmunoassay with an 125I-labeled tracer. Clin Chem. 1993 March;39(3):529–533. [PubMed] [Google Scholar]
- 14.Sanchez CP, Salusky IB, Kuizon BD, Ramirez JA, Gales B, Ettenger RB, Goodman WG. Bone disease in children and adolescents undergoing successful renal transplantation. Kidney Int. 1998 May;53(5):1358–1364. doi: 10.1046/j.1523-1755.1998.00866.x. [DOI] [PubMed] [Google Scholar]
- 15.Santos FR, Moyses RM, Montenegro FL, Jorgetti V, Noronha IL. IL-1beta, TNF-alpha, TGF-beta, and bFGF expression in bone biopsies before and after parathyroidectomy. Kidney Int. 2003 March;63(3):899–907. doi: 10.1046/j.1523-1755.2003.00835.x. [DOI] [PubMed] [Google Scholar]
- 16.Turbin DA, Leung S, Cheang MC, Kennecke HA, Montgomery KD, McKinney S, Treaba DO, Boyd N, Goldstein LC, Badve S, Gown AM, van de RM, Nielsen TO, Gilks CB, Huntsman DG. Automated quantitative analysis of estrogen receptor expression in breast carcinoma does not differ from expert pathologist scoring: a tissue microarray study of 3,484 cases. Breast Cancer Res Treat. 2008 August;110(3):417–426. doi: 10.1007/s10549-007-9736-z. [DOI] [PubMed] [Google Scholar]
- 17.Jiang Z, Wu CL, Woda BA, Iczkowski KA, Chu PG, Tretiakova MS, Young RH, Weiss LM, Blute RD, Jr, Brendler CB, Krausz T, Xu JC, Rock KL, Amin MB, Yang XJ. Alpha-methylacyl-CoA racemase: a multi-institutional study of a new prostate cancer marker. Histopathology. 2004 September;45(3):218–225. doi: 10.1111/j.1365-2559.2004.01930.x. [DOI] [PubMed] [Google Scholar]
- 18.Leys CM, Nomura S, LaFleur BJ, Ferrone S, Kaminishi M, Montgomery E, Goldenring JR. Expression and prognostic significance of prothymosin-alpha and ERp57 in human gastric cancer. Surgery. 2007 January;141(1):41–50. doi: 10.1016/j.surg.2006.05.009. [DOI] [PubMed] [Google Scholar]
- 19.Gokhale S, Rosen D, Sneige N, Diaz LK, Resetkova E, Sahin A, Liu J, Albarracin CT. Assessment of two automated imaging systems in evaluating estrogen receptor status in breast carcinoma. Appl Immunohistochem Mol Morphol. 2007 December;15(4):451–455. doi: 10.1097/PAI.0b013e31802ee998. [DOI] [PubMed] [Google Scholar]
- 20.Parfitt AM, Drezner MK, Glorieux FH, Kanis JA, Malluche H, Meunier PJ, Ott SM, Recker RR. Bone histomorphometry: standardization of nomenclature, symbols, and units. Report of the ASBMR Histomorphometry Nomenclature Committee. J Bone Miner Res. 1987 December;2(6):595–610. doi: 10.1002/jbmr.5650020617. [DOI] [PubMed] [Google Scholar]
- 21.Amir LR, Jovanovic A, Perdijk FB, Toyosawa S, Everts V, Bronckers AL. Immunolocalization of sibling and RUNX2 proteins during vertical distraction osteogenesis in the human mandible. J Histochem Cytochem. 2007 November;55(11):1095–1104. doi: 10.1369/jhc.6A7162.2007. [DOI] [PMC free article] [PubMed] [Google Scholar]
- 22.Nampei A, Hashimoto J, Hayashida K, Tsuboi H, Shi K, Tsuji I, Miyashita H, Yamada T, Matsukawa N, Matsumoto M, Morimoto S, Ogihara T, Ochi T, Yoshikawa H. Matrix extracellular phosphoglycoprotein (MEPE) is highly expressed in osteocytes in human bone. J Bone Miner Metab. 2004;22(3):176–184. doi: 10.1007/s00774-003-0468-9. [DOI] [PubMed] [Google Scholar]
- 23.Kobayashi K, Imanishi Y, Koshiyama H, Miyauchi A, Wakasa K, Kawata T, Goto H, Ohashi H, Koyano HM, Mochizuki R, Miki T, Inaba M, Nishizawa Y. Expression of FGF23 is correlated with serum phosphate level in isolated fibrous dysplasia. Life Sci. 2006 April 11;78(20):2295–2301. doi: 10.1016/j.lfs.2005.09.052. [DOI] [PubMed] [Google Scholar]
- 24.Liu S, Zhou J, Tang W, Menard R, Feng JQ, Quarles LD. Pathogenic role of Fgf23 in Dmp1-null mice. Am J Physiol Endocrinol Metab. 2008 August;295(2):E254–E261. doi: 10.1152/ajpendo.90201.2008. [DOI] [PMC free article] [PubMed] [Google Scholar]
- 25.Lorenz-Depiereux B, Bastepe M, et-Pages A, Amyere M, Wagenstaller J, Muller-Barth U, Badenhoop K, Kaiser SM, Rittmaster RS, Shlossberg AH, Olivares JL, Loris C, Ramos FJ, Glorieux F, Vikkula M, Juppner H, Strom TM. DMP1 mutations in autosomal recessive hypophosphatemia implicate a bone matrix protein in the regulation of phosphate homeostasis. Nat Genet. 2006 November;38(11):1248–1250. doi: 10.1038/ng1868. [DOI] [PMC free article] [PubMed] [Google Scholar]
- 26.Lu Y, Ye L, Yu S, Zhang S, Xie Y, McKee MD, Li YC, Kong J, Eick JD, Dallas SL, Feng JQ. Rescue of odontogenesis in Dmp1-deficient mice by targeted re-expression of DMP1 reveals roles for DMP1 in early odontogenesis and dentin apposition in vivo. Dev Biol. 2007 March 1;303(1):191–201. doi: 10.1016/j.ydbio.2006.11.001. [DOI] [PMC free article] [PubMed] [Google Scholar]
- 27.Lu Y, Liu S, Xie Y, Yu S, Quarles L, Bonewald LF, Feng JQ. Use of the transgenic approach to determine the role of DMP1 in phosphate regulation. J Musculoskelet Neuronal Interact. 2007 October;7(4):309. [PubMed] [Google Scholar]
- 28.Portale AA, Booth BE, Halloran BP, Morris RC., Jr Effect of dietary phosphorus on circulating concentrations of 1,25-dihydroxyvitamin D and immunoreactive parathyroid hormone in children with moderate renal insufficiency. J Clin Invest. 1984 June;73(6):1580–1589. doi: 10.1172/JCI111365. [DOI] [PMC free article] [PubMed] [Google Scholar]
- 29.Tartaix PH, Doulaverakis M, George A, Fisher LW, Butler WT, Qin C, Salih E, Tan M, Fujimoto Y, Spevak L, Boskey AL. In vitro effects of dentin matrix protein-1 on hydroxyapatite formation provide insights into in vivo functions. J Biol Chem. 2004 April 30;279(18):18115–18120. doi: 10.1074/jbc.M314114200. [DOI] [PubMed] [Google Scholar]
- 30.Huang B, Maciejewska I, Sun Y, Peng T, Qin D, Lu Y, Bonewald L, Butler WT, Feng J, Qin C. Identification of full-length dentin matrix protein 1 in dentin and bone. Calcif Tissue Int. 2008 May;82(5):401–410. doi: 10.1007/s00223-008-9140-7. [DOI] [PMC free article] [PubMed] [Google Scholar]
- 31.He G, Gajjeraman S, Schultz D, Cookson D, Qin C, Butler WT, Hao J, George A. Spatially and temporally controlled biomineralization is facilitated by interaction between self-assembled dentin matrix protein 1 and calcium phosphate nuclei in solution. Biochemistry. 2005 December 13;44(49):16140–16148. doi: 10.1021/bi051045l. [DOI] [PMC free article] [PubMed] [Google Scholar]
- 32.Autosomal dominant hypophosphataemic rickets is associated with mutations in FGF23. Nat Genet. 2000 November;26(3):345–348. doi: 10.1038/81664. [DOI] [PubMed] [Google Scholar]
- 33.Guo R, Rowe PS, Liu S, Simpson LG, Xiao ZS, Quarles LD. Inhibition of MEPE cleavage by Phex. Biochem Biophys Res Commun. 2002 September 13;297(1):38–45. doi: 10.1016/s0006-291x(02)02125-3. [DOI] [PubMed] [Google Scholar]
- 34.Gowen LC, Petersen DN, Mansolf AL, Qi H, Stock JL, Tkalcevic GT, Simmons HA, Crawford DT, Chidsey-Frink KL, Ke HZ, McNeish JD, Brown TA. Targeted disruption of the osteoblast/osteocyte factor 45 gene (OF45) results in increased bone formation and bone mass. J Biol Chem. 2003 January 17;278(3):1998–2007. doi: 10.1074/jbc.M203250200. [DOI] [PubMed] [Google Scholar]
Associated Data
This section collects any data citations, data availability statements, or supplementary materials included in this article.