Abstract
The constitutive and activity-dependent components of protein synthesis are both critical for neural function. Although the mechanisms controlling extracellularly induced protein synthesis are becoming clear, less is understood about the molecular networks that regulate the basal translation rate. Here we describe the effects of chronic treatment with various neurotrophic factors and cytokines on the basal rate of protein synthesis in primary cortical neurons. Among the examined factors, brain-derived neurotrophic factor (BDNF) showed the strongest effect. The rate of protein synthesis increased in the cortical tissues of BDNF transgenic mice, whereas it decreased in BDNF knock-out mice. BDNF specifically increased the level of the active, unphosphorylated form of eukaryotic elongation factor 2 (eEF2). The levels of active eEF2 increased and decreased in BDNF transgenic and BDNF knock-out mice, respectively. BDNF decreased kinase activity and increased phosphatase activity against eEF2 in vitro. Additionally, BDNF shortened the ribosomal transit time, an index of translation elongation. In agreement with these results, overexpression of eEF2 enhanced protein synthesis. Taken together, our results demonstrate that the increased level of active eEF2 induced by chronic BDNF stimulation enhances translational elongation processes and increases the total rate of protein synthesis in neurons.
The synthesis and post-translational modification of proteins play key roles in neural development, synaptic plasticity, and cognitive brain functions such as learning and memory (1, 2). Recent studies have revealed that activity-dependent regulation of translation affects neural plasticity (3, 4). Previously, we reported that BDNF,2 a critical molecule for neural plasticity (5–7), enhances protein synthesis and activates the translational machinery in central nervous system neurons (8). In addition, neurotransmitters such as glutamate (9, 10), dopamine (11), and serotonin (12) are also reported to facilitate translation in neurons. These observations indicate that endogenous molecules can acutely modulate neuronal translation in response to neural activity. Translation of an mRNA molecule comprises three steps: initiation, elongation, and release (or termination) (13). In the first step, mRNA and methionyl-tRNAiMet are recruited to a ribosome. During elongation, aminoacyl-tRNAs are sequentially recruited and the nascent peptide chain lengthens incrementally as amino acids are covalently attached via peptide bonds. Finally, the polypeptide chain is released from the ribosome. Each step is regulated by a variety of factors. The activities of these regulatory proteins are predominantly controlled by phosphorylation and GTP binding. BDNF activates both initiation and elongation by modulating these processes (8, 14, 15).
In addition to these acute, stimulation-induced changes in the translation rate, the long term regulation of translation plays important roles in developing and mature brains. In fact, recent studies have shown that genetic disruption or overexpression of translation factors or modulator genes alters synaptic plasticity and behavior as well as the basal rate of protein synthesis. Mice lacking the gene encoding GCN2, a kinase that phosphorylates eIF2α, exhibited enhanced translation as well as aberrant long term potentiation and spatial learning (16). Similar phenotypes have been observed in mice carrying a constitutively active mutant variant (Ser52 to Ala) of eIF2α (17). Mice lacking eIF4E-binding protein 2 (4EBP2) exhibited increased cap-dependent translation and altered long-term potentiation, long-term depression (LTD), and learning (18, 19). Mice expressing a transgene encoding a dominant-negative version of MEK, which inhibits the phosphorylation of eIF4E and protein synthesis, were found to have learning deficits (20). Thus, modifying the rate of protein synthesis can produce deleterious effects on synaptic plasticity and brain function.
Although genetic modifications can affect translation, the mechanisms by which the basal translation rate is controlled in normal neurons are unknown. Here, we demonstrate that chronic treatment of primary cortical neurons with BDNF increases the level of active, unphosphorylated eukaryotic elongation factor 2 (eEF2) and enhances the rates of elongation and protein synthesis. Analysis of BDNF mutant mice supports a role for this neurotrophin in regulating the basal rate of protein synthesis.
EXPERIMENTAL PROCEDURES
Materials
BDNF was a generous gift from Sumitomo Pharmaceutical Co. The following antibodies were employed in this study: anti-eIF2α and anti-eEF2K (Cell Signaling Technology); anti-eIF2β, anti-eIF2Bβ, anti-eIF2Bϵ, anti-eIF2α, anti-eIF4G, and anti-eIF5 (Santa Cruz Biotechnology); anti-eIF4E and anti-eIF6 (BD Biosciences); anti-eEF1A and anti-PP2A C subunit (Upstate); anti-actin (Chemicon); anti-glyceraldehyde-3-phosphate dehydrogenase (Ambion); and anti-neuron-specific enolase (Polyscience). Anti-eEF2 and anti-phospho-eEF2 antibodies were prepared as described previously (15). Anti-eRF1 and anti-eRF3 antibodies were generous gifts from Dr. Shinichi Hoshino (Nagoya City University, Japan). [35S]Methionine and protein G-Sepharose were purchased from GE Healthcare.
Cell Culture
Primary cultures of cortical neurons were prepared by modifying a previously described method (8, 21). Briefly, the cerebral cortices were removed from 18- to 19-day-old embryonic rat fetuses and dissociated with papain and DNase I. Neurons were seeded at 2 × 10⁵ cells/cm2 and cultured in Dulbecco's modified Eagle's medium (DMEM; Nissui) containing 10% fetal bovine serum (Invitrogen) overnight. The following day, the medium was changed to serum-free medium containing 10 mm HEPES, 20 nm progesterone, 30 nm sodium selenite, 100 μm putrescine, transferrin, and 0.01% pyruvate. BDNF (50 ng/ml), other factors, or vehicle (2 mg/ml transferrin in phosphate-buffered saline) were added daily for 5 days.
eEF2 Transfection
Rat eEF2 was cloned by PCR using rat brain cDNA as a template and sequenced. The amplified fragment was subcloned into the pCI vector (Promega). eEF2 cDNA was transfected into neurons by electroporation (NucleofectorTM, Amaxa Biosystems) immediately after dissociation. After 72 h, neurons were harvested and used for the assays. Control transfection was performed using the same vector bearing EGFP. The transfection efficacy estimated by EGFP fluorescence was 20–25%.
BDNF Knock-out and Transgenic Mice
BDNF knock-out mice (C57BL/6J-Bdnftm1Jae) were purchased from The Jackson Laboratory. BDNF transgenic mice (CBA/C57BL6-BDNFβ-actin) were kindly supplied by Regeneron Pharmaceuticals (22). For biochemical experiments, mice were anesthetized by hypothermia with ice and sacrificed by decapitation at postnatal days 1 or 2. The cerebral cortices were removed, frozen immediately on dry ice, and stored at −80 °C until they were assayed. Genotypes were checked by PCR. Because the increase of BDNF protein levels in the cortex of adult transgenic mice is relatively low (22), we determined the levels of BDNF by enzyme-linked immunosorbent assay (23). All the procedures were performed according to the NIH Guidelines for the Care and Use of Laboratory Animals and with the permission of the Institutional Committee for Animal Care of Niigata University.
[35S]Methionine Incorporation
Cortical neurons were incubated with 10 μCi of [35S]methionine and growth factors for 30 min. Protein synthesis was measured by [35S]methionine incorporation as previously reported (8). Tissue samples were homogenized in 10 volumes of DMEM and centrifuged to remove the nuclei. The resulting supernatants were incubated with [35S]methionine and incorporation into protein was measured as described previously (14). The levels of free methionine and methionine that had been incorporated into proteins were estimated by counting the radioactivity in the supernatant and the pellet, respectively. We then calculated the ratio of [35S]methionine that precipitated to the total [35S]methionine taken up into the neurons.
Pulse-Chase
Neurons were incubated with [35S]methionine for 1 h in methionine-free DMEM at 4 days in culture. To analyze the degradation rate, cultures were washed three times with normal DMEM and incubated a further 5 h in 10% fetal bovine serum-containing DMEM. Samples from 1 and 6 h after labeling were immunoprecipitated with anti-eEF2 antibody. Resultant immunoprecipitates were analyzed by SDS-PAGE and autoradiograms were taken.
Measurement of the Ribosomal Transit Time
Ribosomal transit times were measured as described previously (15). Neurons were cultured without or with BDNF (50 ng/ml) and incubated with 3 μCi of [35S]methionine. At 1, 5, 15, and 20 min after the addition of the radiolabeled methionine, neurons were washed with phosphate-buffered saline and lysed with 1 ml of extraction buffer (20 mm HEPES, pH 7.2, 100 mm KCl, 3 mm MgCl2, 1 mm dithiothreitol, 100 μg/ml cycloheximide, 0.5% sodium deoxycholate, 0.5% Triton X-100, and complete protease inhibitor mixture (CompleteTM, Roche)). After pelleting the nuclei by centrifugation, the supernatant was aliquoted to measure the “completed” peptide chains and the “total” amount of newly synthesized (completed + ribosome-bound peptide chains) proteins. Lysate (0.5 ml) was layered onto 1 ml of extraction buffer lacking detergent and containing 0.8 m sucrose. Polysomes were pelleted by centrifugation at 12,000 × g for 2.5 h. Samples of postribosomal supernatant (1.2 ml) were collected to measure the incorporation of [35S]methionine into completed proteins. Newly synthesized proteins representing the completed and ribosome-bound elongating peptide chains were measured by determining the incorporation of [35S]methionine into the postnuclear supernatant. The transit time was determined as the difference in the positions of the intercepts on the time axis of the lines for the total and completed polypeptide chains. This difference between the intercepts is equivalent to half of the ribosomal transit time (24).
Measurement of eEF2K and Protein Phosphatase 2A (PP2A) Enzymatic Activities
The kinase activity of eEF2K was measured as previously described (15) with immunopurified unphosphorylated eEF2 as a substrate. The rat brain homogenate was centrifuged at 100,000 × g for 30 min and the resulting supernatant was absorbed with protein G and anti-phospho-eEF2 antibody. Then, the supernatant was applied to a column containing anti-eEF2 antibody bound to an Affi-Gel HzTM (Bio-Rad). eEF2 was eluted with Immunopure Ag/Ab gentle elution buffer (Pierce), dialyzed, and examined by SDS-PAGE.
The phosphatase activity of PP2A was measured using a PP2A assay kit (Upstate). Lysates from control and BDNF-treated neurons were incubated with anti-PP2A subunit C antibody for 2 h at 4 °C. Protein G-Sepharose was added and the samples were incubated for another 1 h. PP2A phosphatase activity in these immunoprecipitates was then assayed according to the manufacturer's protocol.
Electrophoresis, Western Blotting, and Immunocytochemistry
SDS-PAGE and Western blotting were performed as described previously (14). Cells or tissues were lysed and sonicated in sample buffer (10 mm Tris-HCl, 150 mm NaCl, 2% SDS, 20 mm sodium fluoride, 1 mm Na3VO4, and complete mini protease inhibitors, pH 7.5). After centrifugation, the supernatant was collected and protein concentrations were determined. Equal amounts of protein (25–40 μg/lane) were subjected to SDS-PAGE and transferred to polyvinylidene difluoride membranes. The membranes were incubated with primary antibodies and then with horseradish-peroxidase-conjugated anti-mouse IgG or horseradish peroxidase-conjugated anti-rabbit IgG secondary antibodies (Cappel; dilution, 1:2000). Peroxidase activity was visualized on x-ray film after being treated with chemiluminescence reagents (Western Lightning, PerkinElmer Life Science). Immunocytochemistry using anti-eEF2 and anti-phospho-eEF2 antibodies was performed essentially as described previously (25).
RT-PCR
RNA extraction and RT-PCR were performed as previously described (26). Total RNA (100 ng) was amplified using the RT-PCR High Plus Kit (TOYOBO, Japan) with specific primers for rat eEF2 (forward, 5′-cgcttctatgccttcggtag-3′, reverse, 5′-gcagcatcaccagacttcaa-3′). RT-PCR amplification was performed on the Gene Amp PCR system 9700 (PerkinElmer Life Sciences) using initial incubations for 30 min at 60 °C and then for 2 min at 94 °C followed by 30 cycles of 1 min at 94 °C and 1.5 min at 60 °C. A final 7-min incubation at 62 °C facilitated terminal extension. PCR products were separated by 3% agarose gel electrophoresis and stained with ethidium bromide.
Further quantitative assessment of mRNA levels was carried out with a real time PCR machine (Light Cycler, Roche Diagnostics) (27). Total RNA (100 ng) was subjected to RT-PCR amplification (60°C for 10 min, 94°C for 2 s, 30 cycles of 94 °C; 60 °C for 15 s for eEF2, and 60°C for 10 min, 94°C for 2 s; 30 cycles of 94 °C, 55°C for 5 s, and 72°C for 10 s for β-actin) in a final volume of 25 μl using RT-PCR high plus (Toyobo, Osaka, Japan), containing of 1/20,000 SYBR Green I (Molecular Probes) and 5 pmol of primers. Relative amounts of mRNA of eEF2 were calculated by the differences of cycles during linear amplification, and normalized to the relative expression of β-actin mRNA (forward, 5′-gagcgtggctacagcttca-3′, and reverse, 5′-gaaccgctcattgccgatagtgatg-3′).
RESULTS
Chronic Effects of Various Growth Factors and Cytokines on the Rate of Protein Synthesis
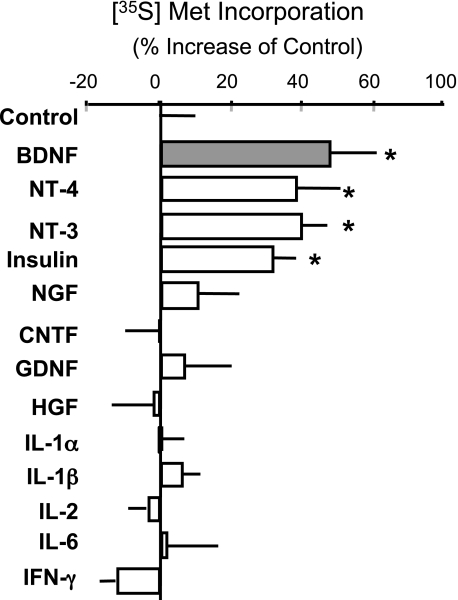
The rate of protein synthesis in primary cortical neurons was examined after chronic treatment with various neurotrophic factors and cytokines. Neurons were treated daily for 5 days and [35S]methionine incorporation into newly synthesized proteins was measured. Among the factors tested, the neurotrophins and insulin enhanced the rate of protein synthesis (Fig. 1). Because the largest effect was observed with BDNF treatment, further analysis was performed to investigate the underlying mechanisms. Immunocytochemistry with anti-microtubule-associated protein 2 antibody revealed that BDNF did not affect cell viability under these culture conditions (see supplemental Fig. S2), thus, protein synthesis rates were calculated from the same cell number.
FIGURE 1.
Chronic effects of various neurotrophic factors and cytokines on protein synthesis in cortical neurons. Neurons were treated without or with BDNF (50 ng/ml), NT-4 (50 ng/ml), NT-3 (50 ng/ml), insulin (10 μg/ml), nerve growth factor (NGF) (50 ng/ml), cilliary neurotrophic factor (CNTF) (10 ng/ml), glial cell line derived neurotrophic factor (GDNF) (10 ng/ml), human growth factor (HGF) (20 ng/ml), interleukin (IL)-1α (5 ng/ml), IL-1β (5 ng/ml), IL-2 (2.5 ng/ml), IL-6 (1 ng/ml), or interferon (IFN)-γ (5 × 10⁵ unit/ml) for 5 days. The incorporation of [35S]methionine into newly synthesized proteins was analyzed. Bars represent the mean ± S.D. (n = 4). *, p < 0.05 (t test). Similar results were obtained in three or four independent experiments.
The Rate of Protein Synthesis in the Cortices of BDNF Mutant Mice
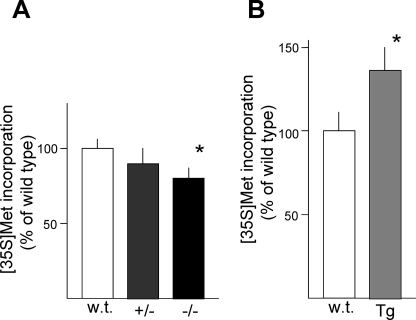
Because BDNF increased the basal rate of protein synthesis in culture, we investigated the in vivo effects of BDNF using BDNF transgenic and knock-out mice. The rates of protein synthesis in cortical tissues from wild-type littermates, BDNF knock-out mice (+/−, −/−), and BDNF transgenic mice were examined by [35S]methionine incorporation. Cortical tissue from homozygous (−/−) BDNF knock-out mice exhibited a reduced rate of protein synthesis (Fig. 2A). Lower protein synthesis rates were also observed in tissue from heterozygous (+/−) mice, which express BDNF protein at approximately half of the levels observed in wild-type littermates. BDNF protein in the cortices of both wild-type and transgenic mice was measured by enzyme-linked immunosorbent assay. In P1–2 mice, the BDNF levels were 5.3 ± 0.8 pg/mg of protein (n = 6, mean ± S.D.) in wild-type cortices, whereas they were 12.8 ± 2.2 pg/mg of protein (n = 6, mean ± S.D.) in transgenic cortices, which represented a significant increase (p < 0.001, t test). In the cortical tissue from transgenic mice overexpressing BDNF, the rate of protein synthesis was higher than in wild-type cortex (Fig. 2B).
FIGURE 2.
Protein synthesis rate in the cortices of BDNF mutant mice. The incorporation of [35S]methionine into newly synthesized proteins was analyzed in the homogenates of cortical tissue from wild-type (wt) and BDNF mutant (+/−, heterozygous; −/−, homozygous) mice (A) or wild-type and transgenic (Tg) mice (B). Bars represent the mean ± S.D.; n = 10, *, p < 0.05 (analysis of variance) (A) and, n = 6, *, p < 0.05 (t test) (B).
BDNF Increased the Level of eEF2 but Not Other Translation Factors
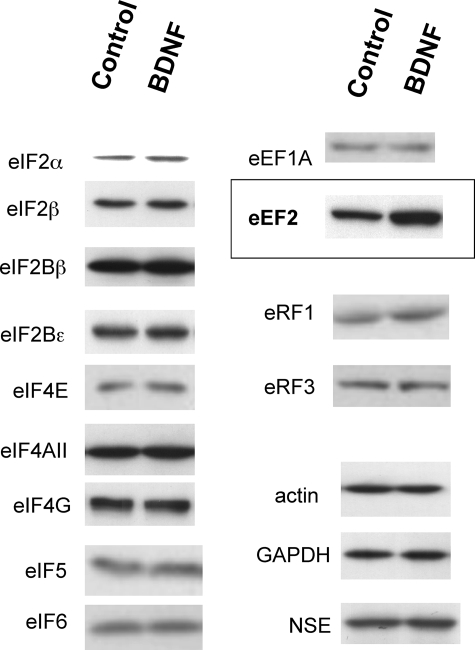
Translational processes are controlled by various translation factors. We examined whether chronic BDNF treatment altered the levels of various translation initiation factors, elongation factors, and release factors. Control cultures and neurons treated with BDNF (50 ng/ml) for 5 days in culture were harvested and their lysates were subjected to SDS-PAGE. The levels of various translation factors were analyzed by Western blotting (Fig. 3) and were quantified using densitometry (see supplemental Fig. S1). As shown in Figs. 3 and 4, BDNF specifically and significantly up-regulated the level of eEF2.
FIGURE 3.
Effects of chronic BDNF treatment on the levels of translation factors. Western blotting analysis was performed to examine the protein levels of initiation factors (eIFs), elongation factors (eEFs), and release factors (eRFs) in neurons following BDNF treatment (50 ng/ml) for 5 days. Bands were analyzed using densitometry. Only the increase in the level of eEF2 is significant. n = 4–9 for each protein. GAPDH, glyceraldehyde-3-phosphate dehydrogenase; NSE, neuron-specific enolase.
FIGURE 4.
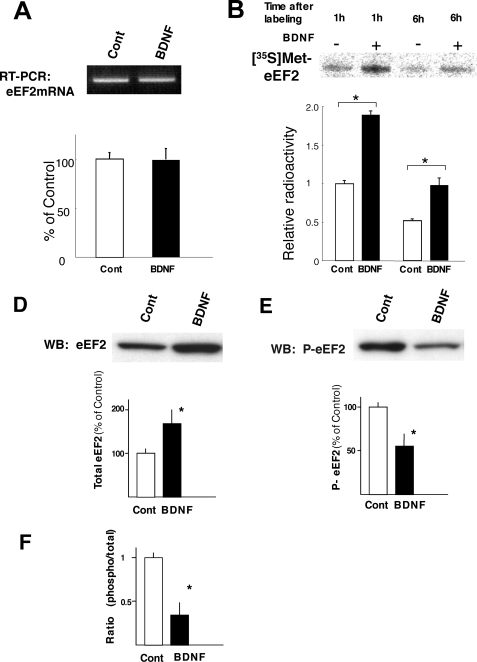
Effect of chronic BDNF treatment on the levels and phosphorylation status of eEF2. Conventional and quantitative RT-PCR was performed to examine eEF2 mRNA levels in neurons following BDNF treatment for 5 days (A). A single band of predicted size (236 bp) was observed (n = 4 in each group). Quantitative RT-PCR indicates there is no difference between control and BDNF-treated neurons (n = 4, p = 0.931 (t test)). Neurons were pulse labeled with [35S]methionine for 1 h, and then washed. eEF2 was immunoprecipitated after 1 and 6 h and analyzed in neurons at 4 days in culture and quantified by Image analyzer (BAS 5000, Fuji Film). Bars represent mean ± S.D. (n = 3). *, p < 0.01 (t test) (B). Western blotting (WB) (D and E) and densitometric analysis (D and E) were performed to examine the total and phosphorylated (inactive) protein levels of eEF2 in neurons following BDNF treatment (50 ng/ml) for 5 days. Bars represent the mean ± S.D. (n = 8). *, p < 0.001 (t test). The phosphorylation ratio of eEF2 is presented in panel F.
To examine whether the increase of the eEF2 protein level is dependent on transcription or translation, RT-PCR and pulse-chase experiments were performed. BDNF treatment did not alter the eEF2 mRNA level at culture days 3 (data not shown) or 5 as revealed by quantitative RT-PCR (Fig. 4A). In contrast, newly synthesized eEF2 protein (1 h after labeling) was significantly higher in BDNF-treated neurons, as revealed by pulse-chase and immunoprecipitation (Fig. 4B). In addition, degradation rates of eEF2 after 6 h were the same in both control and BDNF-treated neurons (in both cases, eEF2 levels at 6 h were about the half of that of 1 h). These results indicate that BDNF enhances eEF2 translation but neither its transcription nor degradation.
BDNF Decreased the Phosphorylation of eEF2
The elongation activity of eEF2 is regulated by phosphorylation at one position, serine 56. To determine whether the phosphorylation of this position was influenced by BDNF, we quantified the levels of phosphorylated eEF2 (P-eEF2) and total eEF2 on Western blots using phospho-eEF2 specific antibody and pan-eEF2 antibody. Whereas BDNF increased the total amount of eEF2 protein, it markedly reduced the level of phospho-eEF2, which does not contribute to translation elongation (Fig. 4, D–F).
Immunocytochemical analysis shows the same result. Untreated neurons exhibited faint immunoreactivity for eEF2 but rather strong signals for phospho-eEF2. Neurons treated with BDNF displayed stronger eEF2 immunoreactivity, whereas the signal for phospho-eEF2 was weak. Both total and phospho-eEF2 immunoreactivity was evident along neurites as well as in the cell body (see supplemental Fig. S2). We concluded that the net increase of the active form of eEF2 (unphosphorylated eEF2) was induced by BDNF treatment, consistent with an increased basal rate of protein synthesis.
eEF2 Levels and Its Phosphorylation Status in Cortices from BDNF Mutant Mice
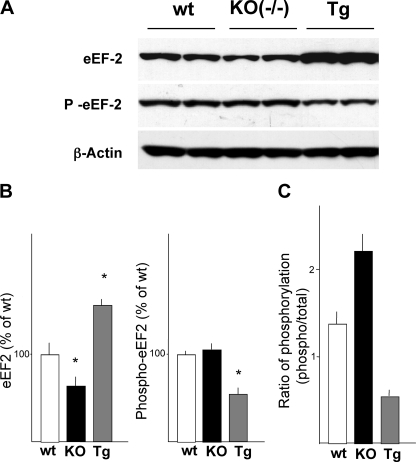
Levels of total and phosphorylated eEF2 in the cerebral cortices of BDNF knock-out and BDNF transgenic mice were examined by Western blotting. Similar to the results from neuronal cultures, an increased level of total eEF2 and a decreased level of phosphorylated eEF2 were observed in cortices from BDNF transgenic mice (Fig. 5). On the other hand, the level of eEF2 was lower and the level of phosphorylated eEF2 was higher in cortices from BDNF knock-out (−/−) mice (Fig. 5). The ratio of phosphorylated eEF2 to total eEF2 is shown in Fig. 5C.
FIGURE 5.
The levels and phosphorylation status of eEF2 in the cortices of BDNF mutant mice. Western blotting (A) and densitometric analysis (B) were performed to examine the total and phosphorylated (inactive) protein levels of eEF2 in cortical tissues of wild-type (wt), BDNF mutant (KO(−/−)), and BDNF transgenic (Tg) mice. Bars represent the mean ± S.D.; n = 4, *, p < 0.05 (analysis of variance). The phosphorylation ratio of eEF2 was calculated and is shown in panel C. KO, knock-out.
BDNF Decreases the Levels and Activity of eEF2 Kinase but Increases the Levels and Activity of PP2A
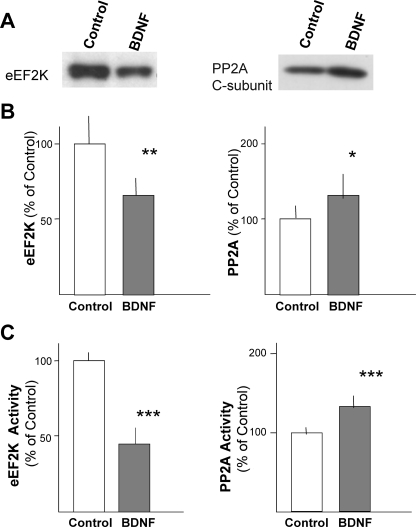
We next investigated whether the decrease in eEF2 phosphorylation induced by BDNF treatment was a consequence of decreased kinase activity or increased phosphatase activity. Protein levels and activities of the eEF2 kinase eEF2K (also called calcium/calmodulin-dependent protein kinase III), and the eEF2 phosphatase PP2A were examined. Western blot analysis revealed that chronic BDNF treatment decreased the level of eEF2K to about half that observed in control samples (Fig. 6). eEF2K kinase activity present in cell lysates from control and BDNF-treated cultures was measured using immunopurified eEF2 as a substrate. BDNF treatment decreased the level of eEF2K activity, as well as its protein level (Fig. 6C). The level and activity of PP2A were also measured. PP2A was immunoprecipitated from control and BDNF-treated neurons with anti-PP2A C subunit antibody and the phosphatase activity of PP2A in the precipitates was measured. BDNF treatment increased the levels of PP2A protein and activity (Fig. 6). Thus, the increased level of unphosphorylated eEF2 was likely due to a combination of a decrease in kinase activity and an increase in phosphatase activity.
FIGURE 6.
Effects of chronic BDNF treatment on the levels and activities of eEF2K and PP2A. Western blotting (A) and densitometric analysis (B) were performed to examine the protein levels of eEF2K and PP2A in neurons treated with BDNF (50 ng/ml) for 5 days. Bars represent the mean ± S.D. (n = 6); *, p < 0.01, and **, p < 0.005 (t test). eEF2K kinase activity and PP2A phosphatase activity were measured (C). Bars represent the mean ± S.D. (n = 4 (eEF2K) and n = 8 (PP2A)); ***, p < 0.001 (t test).
Chronic BDNF Treatment Enhances the Elongation Rate
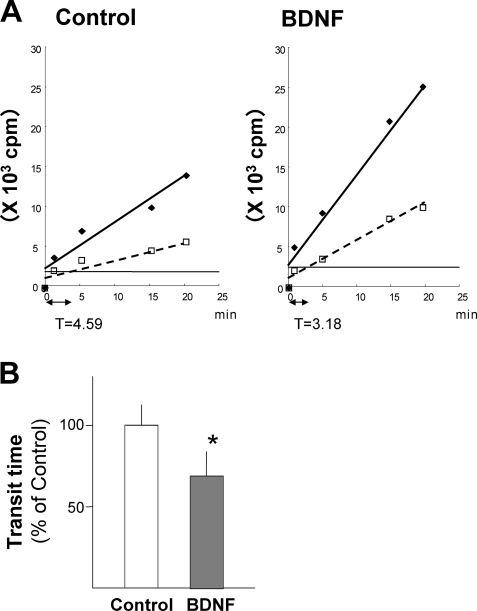
Unphosphorylated (active) eEF2 induces aminoacyl-tRNA translocation from the A site to the P site of a ribosome to promote elongation. Because BDNF increased the level of unphosphorylated eEF2, we examined the rate of translation elongation in cortical neurons with or without BDNF treatment. To accomplish this, we measured the ribosomal transit time, a parameter inversely correlated with the rate of translation elongation. The transit times for control neurons and BDNF-treated neurons were ∼9 and 6 min, respectively (Fig. 7A). Thus, BDNF treatment significantly shortened the transit time (Fig. 8B), demonstrating that BDNF enhances the elongation rate in cortical neurons.
FIGURE 7.
Effects of chronic BDNF treatment on the ribosomal transit time in cortical neurons. A, a representative example of the transit times from control neurons or neurons treated with BDNF (50 ng/ml) for 5 days. Open squares (control) and diamonds (BDNF) represent the total synthesized protein. Filled diamonds (control) and circles (BDNF) represent completed peptides at each time point. Solid lines for total (nascent plus completed) protein and dashed lines for completed peptides were obtained using linear regression analysis. To calculate the transit time, the difference between the lines along the time axis was measured and doubled. Quantitative data are shown in panel B. Bars represent mean ± S.D. (n = 8; *, p < 0.01, t test).
FIGURE 8.
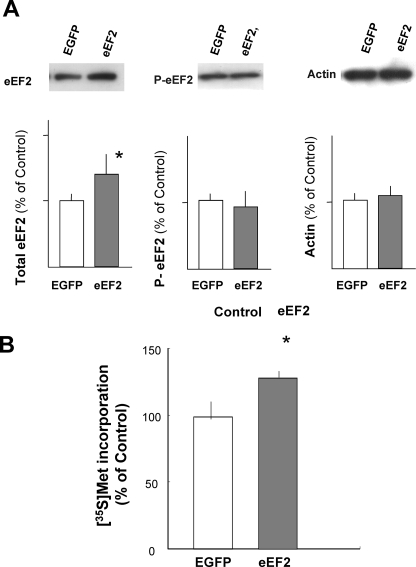
Overexpression of eEF2 in cortical neurons. cDNA encoding rat eEF2 or EGFP (as a control) was transfected into primary cortical neurons. A, expression and phosphorylation of eEF2 were analyzed by Western blotting and quantified using densitometry. Actin was used as a standard. Bars represent the mean ± S.D. (n = 4; *, p < 0.05, t test). B, the incorporation of [35S]methionine into newly synthesized protein was determined using sister transfectants to the cells used to determine the level of eEF2 expression. Bars represent the mean ± S.D. (n = 12; *, p < 0.01, t test).
eEF2 Overexpression Increases the Rate of Protein Synthesis
To directly examine the causal relationship between the increased level of eEF2 and the enhanced protein synthesis rate, we transfected primary cultured neurons with cDNA encoding rat eEF2 cDNA. Electroporation of eEF2 cDNA into neurons resulted in an ∼1.4-fold increase in the level of eEF2 protein compared with that in EGFP-transfected, control neurons (Fig. 8A). The transfection efficacy estimated by counting EGFP fluorescent cells was 20–25% in five individual experiments. In these experiments, the levels of phosphorylated eEF2 were similar following eEF2 or control transfection. eEF2-overexpressing neurons showed an increased protein synthesis rate (Fig. 8B). These results strongly suggest that the increased level of unphosphorylated eEF2 in neurons enhanced the level of protein synthesis.
DISCUSSION
Here we have demonstrated that BDNF increases the level of eEF2 and decreases its phosphorylation to promote translation elongation and the constitutive protein synthesis rate in central neurons. eEF2 overexpression increased the rate of protein synthesis, suggesting that the BDNF-induced up-regulation of eEF2 is directly linked to the enhanced protein synthesis. We also confirmed the results of our in vitro experiments using BDNF knock-out and transgenic mice.
It has been shown that acute and transient extracellular stimuli, such as hormones, growth factors, and nutrients, can alter the phosphorylation of translation factors and the rate of protein synthesis (28). Previously, we reported that BDNF acutely activates both translation initiation (8, 14) and elongation (15) to enhance protein synthesis in central nervous system neurons. Chronic changes of the translation rate induced by extracellular stimuli, however, have not been examined in the nervous system. Interestingly, overexpression of factors such as eIF4E may contribute to abnormal cell growth and/or proliferation within tumors (29). In fact, overexpression of eIF4E results in transformation of fibroblast (30). On the other hand, the cellular and molecular basis of the determinants that regulate the baseline rate of translation in normal proliferating or postmitotic cells have not yet been identified.
A number of lines of evidence have implicated protein synthesis as a critical component of synaptic plasticity, neuronal development, and cognitive functions in the brain. The signaling mechanisms that underlie translational control in neurons and the brain are beginning to be elucidated (3). Recently, studies using genetically modified mice have shown the importance of translation modulation factors on neural plasticity and learning ability (16–20). In these mice, the rate of protein synthesis is constitutively up-regulated or down-regulated due to genetic manipulations. Understanding what conditions and stimuli modify the basal rate of translation will improve our understanding of the molecular basis of neural plasticity and brain function. We have identified BDNF, a neurotrophic factor implicated in synaptic plasticity and learning (5–7), as a key molecule for the sustained regulation of translation. Sustained up-regulation of translation often leads to increases in cell volume, as seen for cancer cells. BDNF increases neuronal volume (31) and facilitates dendritic arborization (32). Moreover, reduced brain volume has been reported for BDNF knock-out mice (33). BDNF enhancement of translation may explain these biological responses.
To determine the molecular mechanisms contributing to the increase of the protein synthesis rate induced by BDNF, we examined the levels of initiation, elongation, and release factors following chronic BDNF treatment. BDNF specifically increased the eEF2 protein level. BDNF enhanced eEF2 protein synthesis but did not alter either its stability or its mRNA level, strongly suggesting the results of translational control of eEF2. eEF2 mRNA has a 5′-terminal oligopyrimidine tract sequence in its 5′-untranslated region (34). mRNAs, which have this sequence, are known to be regulated downstream of mTOR. As previously reported (8, 14), BDNF activates mTOR cascade. Thus increased eEF2 protein by chronic BDNF may be a result of accumulation of newly synthesized eEF2 in response to daily BDNF stimulation. However, BDNF did not affect the levels of eEF1A and S6 that also have 5′-terminal oligopyrimidine tract sequences in their mRNA (supplemental Fig. S3). Thus, the specific increase of eEF2 translation might be cell-type dependent or stimulation (BDNF) dependent.
It is rather surprising because the rate-limiting step for translation is believed to be the initiation process (13). In fact, insulin, which also enhanced protein synthesis (Fig. 1), increased several initiation factors (data not shown). It suggests that BDNF and insulin enhances protein synthesis through a different mechanism.
Protein synthesis is regulated at both the initiation and elongation stages of translation (13, 35, 36). For example, phosphorylation of elongation factors affects their activity and overall elongation rate (28, 37). In eukaryotes, phosphorylated, GTP-bound eEF1A increases the level of aminoacyl-tRNA recruitment. Subsequently, unphosphorylated, GTP-bound eEF2 activates peptidyl-tRNA translocation from the A site to the P site. It is not yet clear if the increase in the level of eEF2 induces an up-regulation of protein synthesis. Thus, we examined effects of eEF2 overexpression. cDNA encoding rat eEF2 was introduced into primary neurons by electroporation, resulting in an ∼1.4-fold increase in the level of eEF2 and a 1.3-fold increase in the protein synthesis rate compared with EGFP-transfected control samples. This is the first direct evidence that an increase in the level of a certain translation factor enhances the rate of protein synthesis in neurons. Considering the relatively low transfection efficacy (20–25%) and shorter period of overexpression (up to 72 h), these results are parallel to the results observed for BDNF treatment. BDNF might also affect the initiation phase by modulating phosphorylation of initiation factors, not by increasing their levels. Indeed, chronic BDNF increased phosphorylation of several initiation factors and modulator (see supplemental Fig. S4), although the effects were weak compared with the acute effect of BDNF. It is not surprising because acute BDNF induces phosphorylation of these molecules (8, 14) and activation of BDNF signaling is known to be sustained. However, transit time measurements suggest that enhancement of protein synthesis induced by BDNF may link to elongation step facilitation. Furthermore, transfection experiments suggests that active eEF2 levels may directly contribute basal protein synthesis at least in the neurons.
In addition to increasing the expression level of eEF2, BDNF decreased the level of phosphorylated eEF2. Thus, BDNF increased the net amount of active, unphosphorylated eEF2. This alteration in the activity of eEF2 is a consequence of both a decrease in the expression of a kinase that phosphorylates eEF2, eEF2K (38), and an increase in the expression of the PP2A phosphatase, for which eEF2 is a substrate (39, 40). The enzymatic activities of eEF2K and PP2A correlated with their expression levels. It is not clear if BDNF regulates the transcription, translation, and/or degradation of these proteins. Alternatively, BDNF may modulate the kinase and/or phosphatase activities as it does during acute responses. Chronic BDNF treatment, much like acute treatment (8, 14), may activate the mTOR complex 1 (mTORC1) signaling cascade. mTORC1 signaling is regulated by both nutrients, such as amino acids and glucose, and growth factors, including BDNF and insulin (41–45), and eEF2 phosphorylation is regulated downstream of mTORC1 (15, 41, 46).
We also examined the elongation rate in cortical neurons receiving chronic BDNF treatment by measuring the ribosomal transit time, which is calculated as the ratio of ribosome-bound peptides to completed peptide chains. When elongation is enhanced, the transit time that the peptide chains are retained on the ribosome is shorter. Chronic BDNF treatment enhanced the elongation rate. We conclude from these results that BDNF induces a sustained increase in the level of active eEF2 and activates the elongation process to promote protein synthesis.
To confirm our findings, we examined the basal rate of protein synthesis in cortical tissue from mice lacking or overexpressing BDNF. We observed a dose-dependent reduction in the rate of protein synthesis, although this reduction was not significant in heterozygous BDNF transgenic mice. The increase in BDNF protein levels in the cortical tissues of adult BDNF transgenic mice using an actin promoter is only 9% (22). On postnatal day 2, however, the level of BDNF in the cortices of the transgenic mice is more than 2-fold higher than that in wild-type mice. Because the endogenous expression level of BDNF is low during early postnatal days, the actin promoter may result in a higher expression level than in the adult brain. In these brains, the levels of eEF2 and phosphorylated eEF2 were also significantly altered. Transgenic mice expressed more active (unphosphorylated) eEF2, whereas and BDNF mutant mice expressed less active eEF2. Under physiological conditions, neural activity increases BDNF expression and release (5–7). Thus, sustained up-regulation of BDNF signaling occurs in active neural circuits. In these neurons, translation may be enhanced and thereby contribute to synaptic plasticity as a positive feedback loop.
In conclusion, chronic changes in BDNF levels in the brain affect protein synthesis by activating eEF2. Thus, extracellular stimuli can regulate not only activity-dependent protein synthesis, but also the baseline rate of protein synthesis in response to chronic signaling.
Supplementary Material
Acknowledgments
We thank Eiko Higuchi for technical assistance. We are grateful to Sumitomo Pharmaceuticals for supplying the recombinant BDNF, Regeneron Pharmaceuticals for BDNF transgenic mice, and Shinichi Hoshino for anti-eRF1 and anti-eRF3 antibodies.
This work was supported by research grants from the Ministry of Education, Culture, Sports, Science and Technology of Japan (a grant-in-aid for Priority Area (RNA Network), the Japan Society for the Promotion of science (a grant-in-aid for Scientific Research B), the Japan Science and Technology Corporation (Core Research for Evolutional Science and Technology, CREST), and a grant for the promotion of the Niigata University Research project.

The on-line version of this article (available at http://www.jbc.org) contains supplemental Figs. S1–S4.
- BDNF
- brain-derived neurotrophic factor
- eEF2
- eukaryotic elongation factor 2
- eEF2K
- eEF2 kinase
- PP2A
- protein phosphatase 2A
- mTOR
- mammalian target of rapamycin
- eIF
- eukaryotic initiation factor
- DMEM
- Dulbecco's modified Eagle's medium
- EGFP
- enhanced green fluorescent protein
- RT
- reverse transcriptase.
REFERENCES
- 1.Kandel E. R. (2001) Science 294, 1030–1038 [DOI] [PubMed] [Google Scholar]
- 2.Sossin W. S. (2008) Prog. Brain Res. 169, 3–25 [DOI] [PubMed] [Google Scholar]
- 3.Klann E., Dever T. E. (2004) Nat. Rev. Neurosci. 5, 931–942 [DOI] [PubMed] [Google Scholar]
- 4.Costa-Mattioli M., Sossin W. S., Klann E., Sonenberg N. (2009) Neuron 61, 10–26 [DOI] [PMC free article] [PubMed] [Google Scholar]
- 5.Thoenen H. (1995) Science 270, 593–598 [DOI] [PubMed] [Google Scholar]
- 6.Poo M. M. (2001) Nat. Rev. Neurosci. 2, 24–32 [DOI] [PubMed] [Google Scholar]
- 7.Nawa H., Takei N. (2001) Trends Neurosci. 24, 683–685 [DOI] [PubMed] [Google Scholar]
- 8.Takei N., Kawamura M., Hara K., Yonezawa K., Nawa H. (2001) J. Biol. Chem. 276, 42818–42825 [DOI] [PubMed] [Google Scholar]
- 9.Weiler I. J., Greenough W. T. (1993) Proc. Natl. Acad. Sci. U.S.A. 90, 7168–7171 [DOI] [PMC free article] [PubMed] [Google Scholar]
- 10.Lenz G., Avruch J. (2005) J. Biol. Chem. 280, 38121–38124 [DOI] [PubMed] [Google Scholar]
- 11.Smith W. B., Starck S. R., Roberts R. W., Schuman E. M. (2005) Neuron 45, 765–779 [DOI] [PubMed] [Google Scholar]
- 12.Carroll M., Warren O., Fan X., Sossin W. S. (2004) J. Neurochem. 90, 1464–1476 [DOI] [PubMed] [Google Scholar]
- 13.Mathews M. B., Sonenberg N., Hershey J. W. B. (2000) in Translational Control of Gene Expression ( Sonenberg N., Hershey J. W. B., Mathews M. B. eds) pp. 719–740, Cold Spring Harbor Laboratory Press, Cold Spring Harbor, NY [Google Scholar]
- 14.Takei N., Inamura N., Kawamura M., Namba H., Hara K., Yonezawa K., Nawa H. (2004) J. Neurosci. 24, 9760–9769 [DOI] [PMC free article] [PubMed] [Google Scholar]
- 15.Inamura N., Nawa H., Takei N. (2005) J. Neurochem. 95, 1438–1445 [DOI] [PubMed] [Google Scholar]
- 16.Costa-Mattioli M., Gobert D., Harding H., Herdy B., Azzi M., Bruno M., Bidinosti M., Ben Mamou C., Marcinkiewicz E., Yoshida M., Imataka H., Cuello A. C., Seidah N., Sossin W., Lacaille J. C., Ron D., Nader K., Sonenberg N. (2005) Nature 436, 1166–1173 [DOI] [PMC free article] [PubMed] [Google Scholar]
- 17.Costa-Mattioli M., Gobert D., Stern E., Gamache K., Colina R., Cuello C., Sossin W., Kaufman R., Pelletier J., Rosenblum K., Krnjević K., Lacaille J. C., Nader K., Sonenberg N. (2007) Cell 129, 195–206 [DOI] [PMC free article] [PubMed] [Google Scholar]
- 18.Banko J. L., Poulin F., Hou L., DeMaria C. T., Sonenberg N., Klann E. (2005) J. Neurosci. 25, 9581–9590 [DOI] [PMC free article] [PubMed] [Google Scholar]
- 19.Banko J. L., Merhav M., Stern E., Sonenberg N., Rosenblum K., Klann E. (2007) Neurobiol. Learn. Mem. 87, 248–256 [DOI] [PubMed] [Google Scholar]
- 20.Kelleher R. J., 3rd, Govindarajan A., Jung H. Y., Kang H., Tonegawa S. (2004) Cell 116, 467–479 [DOI] [PubMed] [Google Scholar]
- 21.Takei N., Numakawa T., Kozaki S., Sakai N., Endo Y., Takahashi M., Hatanaka H. (1998) J. Biol. Chem. 273, 27620–27624 [DOI] [PubMed] [Google Scholar]
- 22.Croll S. D., Suri C., Compton D. L., Simmons M. V., Yancopoulos G. D., Lindsay R. M., Wiegand S. J., Rudge J. S., Scharfman H. E. (1999) Neuroscience 93, 1491–1506 [DOI] [PMC free article] [PubMed] [Google Scholar]
- 23.Nawa H., Carnahan J., Gall C. (1995) Eur. J. Neurosci. 7, 1527–1535 [DOI] [PubMed] [Google Scholar]
- 24.Nielsen P. J., McConkey E. H. (1980) J. Cell Physiol. 104, 269–281 [DOI] [PubMed] [Google Scholar]
- 25.Inamura N., Hoshino S., Uchiumi T., Nawa H., Takei N. (2003) Mol. Brain Res. 111, 165–174 [DOI] [PubMed] [Google Scholar]
- 26.Seki M., Nawa H., Fukuchi T., Abe H., Takei N. (2003) Invest. Ophthalmol. Vis. Sci. 44, 3211–3218 [DOI] [PubMed] [Google Scholar]
- 27.Namba H., Nagano T., Iwakura Y., Xiong H., Jourdi H., Takei N., Nawa H. (2006) Mol. Cell Neurosci. 31, 628–641 [DOI] [PMC free article] [PubMed] [Google Scholar]
- 28.Proud C. G. (2000) in Translational Control in Gene Expression ( Sonenberg N., Hershey J. W. B., Mathews M. B. eds) pp. 719–740, Cold Spring Harbor Laboratory Press, Cold Spring Harbor, NY [Google Scholar]
- 29.De Benedetti A., Graff J. R. (2004) Oncogene 23, 3189–3199 [DOI] [PubMed] [Google Scholar]
- 30.Lazaris-Karatzas A., Montine K. S., Sonenberg N. (1990) Nature 345, 544–547 [DOI] [PubMed] [Google Scholar]
- 31.Mizuno K., Carnahan J., Nawa H. (1994) Dev. Biol. 165, 243–256 [DOI] [PubMed] [Google Scholar]
- 32.McAllister A. K., Katz L. C., Lo D. C. (1997) Neuron 18, 767–778 [DOI] [PubMed] [Google Scholar]
- 33.Jones K. R., Fariñas I., Backus C., Reichardt L. F. (1994) Cell 76, 989–999 [DOI] [PMC free article] [PubMed] [Google Scholar]
- 34.Meyuhas O., Hornstein E. (2000) in Translational Control in Gene Expression ( Sonenberg N., Hershey J. W. B., Mathews M. B. eds) pp. 719–740, Cold Spring Harbor Laboratory Press, Cold Spring Harbor, NY [Google Scholar]
- 35.Ryazanov A. G., Rudkin B. B., Spirin A. S. (1991) FEBS Lett. 285, 170–175 [DOI] [PubMed] [Google Scholar]
- 36.Proud C. G. (2007) Biochem. J. 403, 217–234 [DOI] [PubMed] [Google Scholar]
- 37.Ryazanov A. G., Shestakova E. A., Natapov P. G. (1988) Nature 334, 170–173 [DOI] [PubMed] [Google Scholar]
- 38.Nairn A. C., Palfrey H. C. (1987) J. Biol. Chem. 262, 17299–17303 [PubMed] [Google Scholar]
- 39.Gschwendt M., Kittstein W., Mieskes G., Marks F. (1989) FEBS Lett. 257, 357–360 [DOI] [PubMed] [Google Scholar]
- 40.Redpath N. T., Proud C. G. (1990) Biochem. J. 272, 175–180 [DOI] [PMC free article] [PubMed] [Google Scholar]
- 41.Wang X., Li W., Williams M., Terada N., Alessi D. R., Proud C. G. (2001) EMBO J. 20, 4370–4379 [DOI] [PMC free article] [PubMed] [Google Scholar]
- 42.Tokunaga C., Yoshino K., Yonezawa K. (2004) Biochem. Biophys. Res. Commun. 313, 443–446 [DOI] [PubMed] [Google Scholar]
- 43.Hay N., Sonenberg N. (2004) Genes Dev. 18, 1926–1945 [DOI] [PubMed] [Google Scholar]
- 44.Wullschleger S., Loewith R., Hall M. N. (2006) Cell 124, 471–484 [DOI] [PubMed] [Google Scholar]
- 45.Avruch J., Hara K., Lin Y., Liu M., Long X., Ortiz-Vega S., Yonezawa K. (2006) Oncogene 25, 6361–6372 [DOI] [PubMed] [Google Scholar]
- 46.Redpath N. T., Foulstone E. J., Proud C. G. (1996) EMBO J. 15, 2291–2297 [PMC free article] [PubMed] [Google Scholar]
- 47.Deleted in proof
- 48.Deleted in proof
Associated Data
This section collects any data citations, data availability statements, or supplementary materials included in this article.


