Abstract
Recently, several in vitro studies have shown that the golli–myelin basic proteins regulate Ca2+ homoeostasis in OPCs (oligodendrocyte precursor cells) and immature OLs (oligodendrocytes), and that a number of the functions of these cells are affected by cellular levels of the golli proteins. To determine the influence of golli in vivo on OL development and myelination, a transgenic mouse was generated in which the golli isoform J37 was overexpressed specifically within OLs and OPCs. The mouse, called JOE (J37-overexpressing), is severely hypomyelinated between birth and postnatal day 50. During this time, it exhibits severe intention tremors that gradually abate at later ages. After postnatal day 50, ultrastructural studies and Northern and Western blot analyses indicate that myelin accumulates in the brain, but never reaches normal levels. Several factors appear to underlie the extensive hypomyelination. In vitro and in vivo experiments indicate that golli overexpression causes a significant delay in OL maturation, with accumulation of significantly greater numbers of pre-myelinating OLs that fail to myelinate axons during the normal myelinating period. Immunohistochemical studies with cell death and myelin markers indicate that JOE OLs undergo a heightened and extended period of cell death and are unable to effectively myelinate until 2 months after birth. The results indicate that increased levels of golli in OPC/OLs delays myelination, causing significant cell death of OLs particularly in white matter tracts. The results provide in vivo evidence for a significant role of the golli proteins in the regulation of maturation of OLs and normal myelination.
Keywords: cell death, dysmyelination, golli protein, myelination, oligodendrocyte development
Abbreviations: BDNF, brain-derived neurotrophic factor; CC, corpus callosum; ClCsp3, cleaved caspase 3; CNP, 2′,3′-cyclic nucleotide phosphodiesterase; DIV, days in vitro; FGFR, fibroblast growth factor receptor; GFAP, glial fibrillary acidic protein; GFP, green fluorescent protein; hemi, hemizygous; JOE, J37-overexpressing; MBP, myelin basic protein; MyAP, myelinated axon profile; OL, oligodendrocyte; OPC, oligodendrocyte precursor cell; P, postnatal day; PDGFRα, platelet-derived growth factor receptor α; PLP, proteolipid protein; TBS-T, Tris-buffered saline with Tween 20; WT, wild-type
INTRODUCTION
The golli–MBPs (myelin basic proteins) are products of the MBP gene (Campagnoni et al., 1993) and their functions have only recently been determined. Early in vivo studies showed that golli is expressed in some neuronal populations when the cells are extending neurites and migrating (Landry et al., 1996, 1997; Pribyl et al., 1993). In vitro studies have suggested that overexpression of golli proteins in neuronal and glial cell lines induced enhanced process extension and sheet formation (Reyes and Campagnoni, 2002). More recent work has shown that OL (oligodendrocyte) process extension and retraction, and even migration, is due to the modulatory effect of golli on Ca2+ levels in the cells (Paez et al., 2007). Studies in T-cell lines and in vivo models indicate that the golli proteins also modulate Ca2+ levels in cells in the immune system (Feng et al., 2000, 2006). In vitro data indicate that the golli proteins modulate Ca2+ influx through store-operated Ca2+ channels and voltage-gated Ca2+ channels in OPCs (oligodendrocyte precursor cells). This modulation plays an important role in OL process extension and retraction, migration, proliferation and cell death (Reyes and Campagnoni, 2002; Jacobs et al., 2005; Paez et al., 2007, 2009a, 2009b).
The purpose of the present study was to examine the effect of golli overexpression in OLs in vivo, in a model in which a golli isoform, J37, was specifically targeted to these cells. Thus the phenotype of the JOE (J37-overexpressing) mouse would represent a direct effect of golli on OLs. Such studies are needed to validate in vitro findings, as well as to document any effects of golli overexpression on OL development, proliferation, survival or myelination. Towards that end, we generated the JOE transgenic mouse in which the J37 golli isoform is under the control of the classic MBP promoter. The results of the in vivo analysis of this mouse have revealed a profound effect of golli levels on OL development, survival and myelination.
MATERIALS AND METHODS
Animal experimentation
All animals used in the present study were housed at the UCLA School of Medicine Vivarium, and procedures were approved by UCLA's Animal Care and Use Committee and conducted in accordance with the guidelines in ‘Guide for the Care and Use of Laboratory Animals' from the National Institutes of Health.
Generation of the JOE construct and transgenic mouse
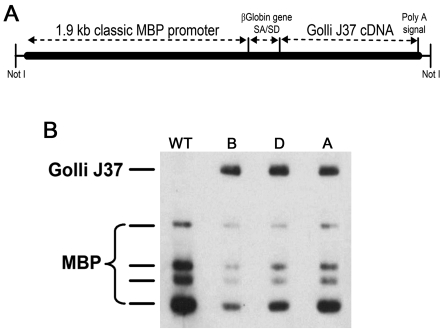
The transgene for the JOE mouse was prepared using the 1.9 kb ‘classic' MBP promoter plasmid (pMG2), a gift from Dr Robert Lazzarini (Gow et al., 1992). The pMG2 plasmid contains 1.9 kb of sequence upstream of the classic MBP translation initiation site in exon 5B of the gene and a two-exon piece of the β-globin gene to provide a splice site and polyadenylation signal. In a unique EcoRI site in exon 3 of the β-globin gene, we inserted the full-length cDNA for the J37 golli isoform in which the initiation ATG codon for golli–MBP was retained as shown in Figure 1. Since the 5′-portion of the golli J37 cDNA contains the translation initiation site of classic MBPs, the initiator methionine was mutated to a leucine residue (using the Clontech site-directed mutagenesis system) to assure that no classic MBPs arose from this construct. The transgenic founders were produced by the UCLA Transgenic Core Facility using the NotI fragment injected into pronuclei of fertilized oocytes and transferred to the oviducts of pseudopregnant mice. The background of the transgenic founders (F1) was 50% Balb/cByJ, 37–50% C57BL/6 and 0–13% C3H/He and they have been maintained on this background.
Figure 1. Generation of the JOE mouse.
(A) The construct was prepared using the 1.9 kb ‘classic' MBP promoter plasmid (pMG2; Gow et al., 1992). This promoter element contains a 1.9 kb sequence upstream of the classic MBP translation initiation site in exon 5B of the gene and two exon pieces of the β-globin gene to provide a splicing event. J37 cDNA was cloned into exon 3 of the β-globin gene. Since the 5′-portion of J37 cDNA contains the translation initiation site of classic MBPs, the initiator methionine was mutated to a leucine residue to ensure that no classic MBPs arose from this construct. (B) Western blot of samples from three JOE transgenic lines, ‘B', ‘D' and ‘A', at P24 probed with an antibody against classic MBP. J37 contains 133 amino acids of golli-specific peptide linked to classic MBP peptides 1–102 and 155–168. Our MBP antibody raised against amino acids 1−114 of bovine MBP recognizes J37 as well as classic MBPs.
Genotyping
To identify the transgenic founders, genomic tail DNA was isolated and 4 μg was digested with EcoRI and analysed by Southern blotting (Sambrook et al., 1989). Southern blots were probed with a 1.8 kb EcoRI fragment of genomic DNA that contains 88 bp of golli exon 3. This 88 bp of exon 3 in the probe recognizes a 2.6 kb J37-containing EcoRI fragment of the transgene and the entire 1.8 kb fragment hybridizes to its counterpart in the native MBP gene. This normalization of transgene to native gene allowed us to distinguish homo- from hemi-zygous animals. We used PCR to distinguish transgenic from WT (wild-type) animals before they could be distinguished by the shaking phenotype, using a Denville Taq Polymers kit and the following conditions: 4 min at 94°C, and 35 rounds of 1 min at 94°C, 1 min at 65°C and 1 min at 72°C, followed by 7 min at 72°C. The WT primer pair was: (5′WT) 5′-TGTTGGCAACTTTGGATGTGT-3′ and (3′WT) 5′-TCAGCCAAGCCTTACCTTACT-3′ which gave a band at 200 bp. The transgenic primer pair was: (5′J37) 5′-CTTTCAGGGCAATAATGATACAA-3′ and (3′J37) 5′-GCTTGCCCACGCTTCTTCTCTTCTTT-3′ which gave a product at 700 bp. The blots were analysed using a PhosphorImager (GE Healthcare).
Analysis of the JOE transgenic mouse
Analysis of mRNA expression
At each developmental time point, RNA was isolated from mouse brains using the TRIzol® method of Invitrogen. Each time point on the subsequent Northern blot analysis represents 10 μg of total RNA probed first with a 535 bp cDNA for the coding sequence of mouse 14 kDa MBP (pP535) and then stripped and probed with a mixture of a mouse cDNA for the coding sequence of PLP (proteolipid protein) (BAS1013) and cyclophilin (gift from Dr G. Sutcliffe, The Scripps Research Institute, La Jolla, CA, U.S.A.). At each probing, the blot was analysed using a PhosphorImager. Loading errors were corrected by normalizing the values for MBP or PLP time points to those for cyclophilin (P1B15).
Western blot analysis
Protein was precipitated from the organic phase of the TRIzol® RNA extraction with propan-2-ol according to the manufacturer's instructions. The final protein pellet was dissolved at room temperature (20°C) in 8 M urea, 125 mM Tris/HCl (pH 6.8), 4% (w/v) SDS and 3% (w/v) DTT (dithiothreitol). The blot shown in Figure 3 represents 1 μg of brain protein loaded on to an SDS/15% polyacrylamide gel and run at 50 V until a Bromophenol Blue marker reached the bottom of the gel. The proteins were transferred on to an Immobilon P membrane which was blocked for 30 min in 5% BSA (USB 10857 heat-shock fraction) and 0.02% NaN3 in TBS-T (Tris-buffered saline with 0.1% Tween 20) then incubated with shaking overnight at 4°C with a rabbit polyclonal antibody raised against amino acids 1–115 of bovine MBP. The next day, it was washed three times for 5 min with TBS-T, blocked for 30 min in 5% (w/v) non-fat powdered milk in TBS-T and incubated with shaking for 1 h in the same buffer now containing HRP (horseradish peroxidase)-linked anti-rabbit IgG (GE Healthcare), and washed six times with TBS-T. The blot was developed with the ECL® (enhanced chemiluminescence) system (GE Healthcare).
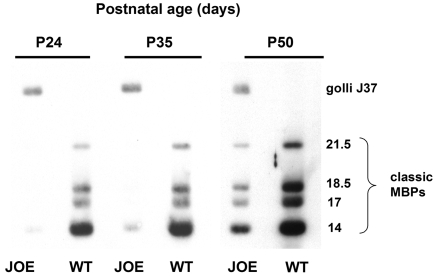
Figure 3. Delayed expression of the classic MBP proteins.
Western blot of classic MBPs and golli in JOE mice at P24, P35 and P50 showing overexpression of golli at all ages. Classic MBP levels were very low below P50 and began to increase in JOE mice at 50 days and beyond, consistent with a delay in myelination. Even so, classic MBP levels were significantly lower than the levels in WT mice.
Tissue preparation
Tissue was collected from JOE and littermate WT animals, as well as from offspring of JOE mice mated with PLP–GFP (green fluorescent protein) mice (Mallon et al., 2002) that we have designated JOEplp/gfp. Postnatal animals were prepared and analysed for immunohistochemical and ultrastructural analyses. At each developmental time point, animals were anaesthetized with sodium pentobarbital and given intracardiac perfusions with 4% (w/v) buffered paraformaldehyde. The brains were removed from the skull and post-fixed in the same fixative overnight at 4°C. After post-fixation, brains were embedded in 4% agarose and sectioned coronally at 40 μm on a vibratome (Leica VT1000S). For ultrastructural analysis, animals were perfused with 2% (w/v) glutaraldehyde/2% (w/v) paraformaldehyde in a sodium cacodylate buffer. Specific brain regions were then post-fixed with 1% OsO4, dehydrated and embedded in Epon. Ultra-thin sections were stained with uranyl acetate and lead citrate and examined with a JEOL JEM-100CX electron microscope.
Immunohistochemistry and antibodies
Free-floating vibratome sections were incubated in a blocking solution (2% normal goat serum and 0.1% Triton X-100 in PBS) for 1 h at room temperature and then incubated with the primary antibody overnight at 4°C. Sections were then rinsed in PBS and incubated with the Alexa Fluor® 594 (red) or Alexa Fluor® 498 (green) -conjugated secondary antibody (Invitrogen) for 2 h at room temperature followed by a counterstain with the nuclear dye bisbenzimide (Hoechst 33342; Invitrogen). After washing, the sections were mounted on to Superfrost Plus slides (Fisher) using coverslips and mounting medium (Aquamount; VWR). For antibodies requiring antigen retrieval [ClCsp3 (cleaved caspase 3) and histone H3], sections were incubated in sodium citrate buffer for 20 min at 95°C, cooled at room temperature for 20 min, washed three times in PBS and then processed as described above. In those experiments where sections were stained with 3,3-diaminobenzidine (Roche), free-floating sections were incubated in a solution containing 0.3% H2O2 and 10% methanol for 10 min, rinsed and then incubated with the primary antibody at 4°C overnight. After washing, the sections were incubated with a biotinylated secondary antibody for 1 h at room temperature and the secondary antibody was visualized using the avidin–biotin–peroxidase method (Vectastain Elite ABC) as recommended by the manufacturer (Vector Laboratories).
The primary antibodies used in the present study were against: CC1 (diluted 1:500; Calbiochem/EMD Biosciences), ClCsp3 (diluted 1:250; Cell Signaling Technology), CNP (2′,3′-cyclic nucleotide phosphodiesterase) (diluted 1:500; Neomarkers), polyclonal antibody for golli (diluted 1:1000; XX70), 01 (diluted 1:20), 04 (diluted 1:40), PLP/DM20 (diluted 1:400; clone AA3; gift from Steven Pfeiffer, University of Connecticut Health Science Center, Farmington, CT, U.S.A.) and PDGFRα (platelet-derived growth factor receptor α) (diluted 1:200; BD Biosciences). Antibodies against GFAP (glial fibrillary acidic protein) (diluted 1:200), phospho-histone H3 (diluted 1:1000), NeuN (diluted 1:1000), NG2 (diluted 1:300), Olig2 (1:800), Sox9 (diluted 1:500) were all purchased from Chemicon/Millipore.
Cell preparation and immunocytochemistry
Primary OL cultures were isolated from cortices of individual JOE and control littermates between P (postnatal day) 0 and P3. Cells from each pup were cultured separately while the mouse was genotyped. Genotyping was performed on tail DNA using standard PCR protocols from our laboratory (Xie et al., 2002) optimized for the current primers. After genotyping, JOE and WT brain cultures were pooled separately and continued to be grown as described previously (Amur-Umarjee et al., 1993; Givogri et al., 2001). Immunocytochemistry experiments were performed as described by Reyes and Campagnoni (2002).
Microscopy and statistical analyses
Images were collected with a Leica DM RXA microscope using conventional transmission microscopy or epifluorescence. Images were captured with a Spot CCD (charge-coupled device) camera (Diagnostic Instruments) and assembled into Figures using Adobe Photoshop CS software. Estimates of the density of labelled cells were determined by examining coronal cortical sections at 400× and counting the number of labelled cells within comparable regions of the CC (corpus callosum) (four areas per hemisphere) and cortex (three areas, upper cortex and three areas, lower cortex per hemisphere). Depending upon the age, four to six sections spanning the rostral to caudal extent of the CC were analysed from a minimum of three animals per age and genotype. Electron microscopy was performed using a JEOL JEM-100CX electron microscope. Measurements of axonal and fibre diameter were made from images taken at 14000× of myelinated axon profiles in the CC of JOE and WT mice at P28 and P60. G-ratios were calculated by dividing the axonal diameter by fibre diameter. For all measurements, the statistical significance of differences of the S.E.M. was determined using a one-tailed Student's t test. The results are expressed as means±S.E.M.
RESULTS
Mice overexpressing golli exhibit neurological abnormalities
To examine the effect of golli on OL development, several lines of transgenic mice were generated in which the J37 golli isoform was overexpressed in OLs using a classic MBP OL-specific promoter (Gow et al., 1992). Figure 1 shows a Western blot of three JOE lines (B, D and E) at P24. All three JOE lines exhibited clinical behavioural abnormalities beginning at ˜P14 that persisted until ˜P60, after which they were less evident. We chose to examine line B in more detail and refer to this line as JOE in the present study. The homozygous JOE mice were embryonic lethal, but the hemizygous (hemi) mice were born with no obvious behavioural differences from their control littermates. However, by P14, the hemi JOE mice began to display an intention tremor (see Movie 1 and Supplementary Figure S1 at http://www.asnneuro.org/an/001/an001e017add.htm) that is localized to the tail. By P30, the tremor was very pronounced and involved the entire body. At this age, the JOE mice occasionally exhibited a seizure. Between P35 and P60, the severity of the tremors declined. Behaviourally, adult hemi mice (>P60) appeared normal, but they continued to tremble when placed under proprioceptive load. JOE mice had slightly smaller body weights compared with littermate controls at P28 (i.e. 87–89% of controls) and this difference persisted into adulthood.
JOE mice undergo a substantial delay in brain myelination
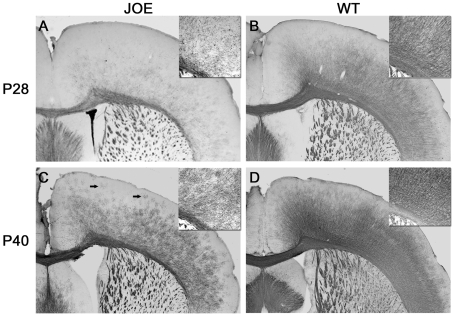
The nature of the neurological phenotype and the targeting of golli overexpression to the OLs suggested a problem with myelination. The extent of myelination in JOE brains was examined by immunohistochemistry with an antibody against PLP. At P28, fewer PLP+ fibres and cell bodies were detected in the JOE cerebral cortex than in WTs, indicating substantial hypomyelination (Figures 2A and 2B). This lack of myelination occurred throughout the brain including the cerebellum (data not shown), which may explain the severe intention tremors observed at this age. By P40, PLP immunostaining increased in the JOE cortex, but not nearly to the extent that might have been predicted by the loss of the tremors (Figures 2C and 2D). The basal intention tremors practically disappeared by this age, but the extent of myelination remained relatively low. At later ages, myelin staining in the JOE mice became close to normal, but many fibre tracts such as the cerebellar peduncles and pyramidal tracts in the cerebellum remained hypomyelinated. Histochemical analyses of myelin with the Weil stain supported these conclusions with a lack of staining in JOE brains compared with controls (data not shown). The density and organization of the myelinated fibres were also affected in the JOE brains. At higher magnification, labelled fibres were clearly sparser and more disorganized in comparison with the dense and radial organization of the fibres in controls (see insets in Figure 2). Also present in the JOE cortex were foci of isolated myelinated segments (see arrows in Figure 2C) that were not observed in the WT. Note that these are not pre-myelinating OLs, described in detail below, at this age.
Figure 2. Decreased PLP expression in JOE brains.
Coronal sections from JOE and WT mice at P28 (A and B) and P40 (C and D) were immunostained with anti-PLP. In (A), decreased PLP staining was quite evident in the P28 JOE brain in comparison with the WT (B). Particularly affected was the amount of staining in the cortical OLs with little label in the cell bodies or processes. By P40, PLP staining in the JOE brain (C) increased, but did not reach the level of staining seen in WT sections (D). Isolated foci of PLP myelinated segments were detected in the outer cortical layers (see arrows in C). Insets in (A–D) illustrate the reduced staining in OL processes as well as the extent of disorganization of the fibres in the JOE brains compared with controls. Magnification ×25, insets ×50.
Golli overexpression alters levels of MBP and PLP/DM20 myelin mRNA and proteins
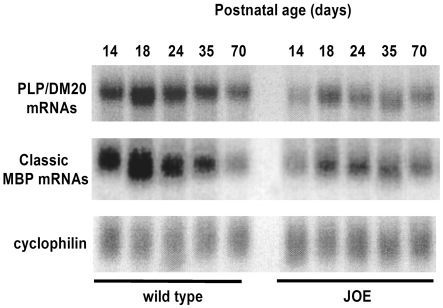
To assure that golli overexpression was occurring in the brain, and to determine the expression pattern of the classic MBPs, Northern and Western blot analyses were performed on JOE and WT brain mRNAs and proteins. A Western blot probed with anti-MBP is shown in Figure 3. Overexpression of golli J37 could be detected as early as P1.5 (the earliest age examined) and persisted for as long as 13 months (the latest age examined). With development the classic MBPs increased in amounts as myelin deposition began to occur. Figure 4 shows data obtained from a phosphorimage of a Northern blot of total RNA, probed, stripped and reprobed for MBP, PLP and cyclophilin mRNAs. The same blot was probed with an 18S rRNA probe for quantitative measurements to assure equivalence of loading in the lanes (data not shown). The data indicate that the timing of expression of the classic MBP and PLP/DM20 transcripts appear to be unaffected by overexpression of golli J37. However, the levels of the mRNAs appear to be 2.5–4-fold lower in the JOE than in WT before P50. Western blot data indicated that significant accumulation of classic MBPs did not begin until P35–P50, a timing that corresponded to the first histological signs of myelination in the JOE brains.
Figure 4. Reduced levels of PLP/DM20 and classic MBP mRNAs.
Phosphorimages of the same Northern blot probed for PLP/DM20, classic MBP and cyclophilin mRNAs. Lower levels of PLP/DM20 and MBP mRNAs were observed in JOE brains at all ages. However, the developmental timing of mRNA expression remained the same between the genotypes.
Ultrastructural analysis suggests dysmyelination not demyelination occurs in the JOE brain
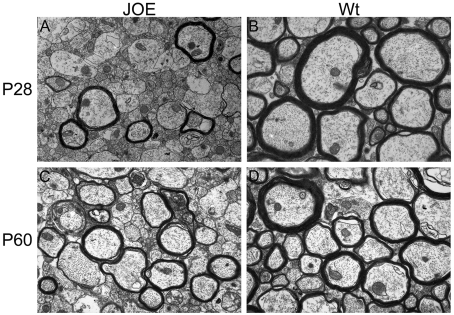
We examined the quality of the myelin formed in the JOE CNS (central nervous system). Ultrastructural changes of MyAPs (myelinated axon profiles) were studied in the CC at P28 and P60 by electron microscopy. At both ages, the majority of the axonal profiles in the JOE CC were not myelinated, but the myelin that formed appeared to have regular periodicity and structure, including the presence of the mesaxon. For example, at P28, very few MyAPs were observed in the CC of the JOE mouse compared with controls (Figures 5A and 5B). Of those axons that were myelinated, each had fewer wraps of myelin membrane than myelinated WT axons, as indicated by their G-ratio (axonal diameter divided by fibre diameter; larger numbers reflecting reduced myelin thickness). At P28, the average myelin thickness in controls (G-ratio = 0.76±0.01) was significantly greater compared with JOE (G-ratio = 0.86±0.01; P<0.01). At P60, the number of MyAPs increased in the JOE CC (Figure 5C), but the average myelin thickness remained unchanged and lower than controls (Figure 5D). The gradual appearance of myelinated axons over time along with the absence of myelin debris in extracellular spaces (data not shown) suggests that active demyelination was not occurring. Rather, our data are consistent with the conclusion that JOE brains undergo dysmyelination; and, although they began to recover at around 2 months of age, they never reached the extent of myelination observed in WT animals.
Figure 5. Severe hypomyelination is evident in the JOE CC.
Electron micrographs reveal extensive hypomyelination in the JOE CC at P28 (A and B). The number of myelinated axon profiles increased by P60 (C and D). At both ages, the JOE axons that were myelinated had significantly thinner myelin than that found in the WT CC. Magnification ×14000.
Reduced number of OLs detected in JOE brains
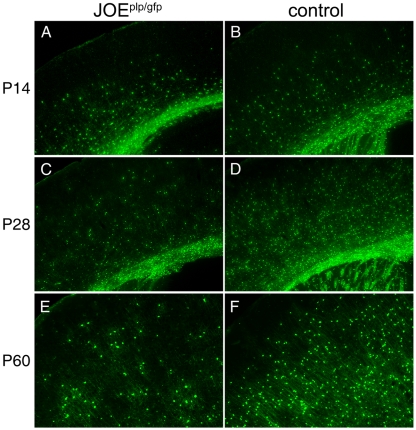
The results from the electron microscopy and biochemical studies suggested that fewer OLs were present in the JOE brain. To test this hypothesis, we crossed the JOE mice to mice expressing GFP driven by the PLP promoter (PLP–GFP; Mallon et al., 2002). Since the JOE mice were hemizygous, each litter produced JOE PLP–GFP (JOEplp/gfp) and control mice that expressed GFP in OLs. As shown in Figure 6 and Table 1, the number of GFP-labelled cells at P14 was significantly greater in the JOEplp/gfp cortices in comparison with their littermate controls (Figures 6A and 6B). By P28, the number of JOEplp/gfp GFP+ cells was reduced to less than 50% of the control (Figures 6C and 6D). At P60, the numbers of GFP+ cells increased in both genotypes, but the number of labelled cells in the JOEplp/gfp cortices remained significantly lower than in the controls (Figures 6E and 6F).
Figure 6. Fewer GFP+ OLs detected in the JOE cortex.
Coronal cortical sections from JOE×PLP–GFP (JOEplp/gfp) hemi and WT mice at P14 (A and B), P28 (C and D) and P60 (E and F). The number of GFP-labelled OLs in the JOEplp/gfp mice were reduced and localized in disorganized clusters in comparison with the more radially aligned OLs labelled in the WT mice (control). Magnification ×50 (A–D), ×100 (E and F).
Table 1. Table 1 Mean±S.E.M. number of EGFP (enhanced GFP)-labelled cells in the cortices of JOEplp/gfp and control mice at P14, P28 and P60.
Using a Student's t test, differences at each age were found to be significant at P<0.05.
| Age | JOEplp/gfp | Control | P value |
| P14 | 188±7.0 | 157±1.13 | 0.049 |
| P28 | 143±13.4 | 335±37.8 | 0.040 |
| P60 | 302±36.4 | 492±45.4 | 0.030 |
Extended period of cell death in the JOE mouse
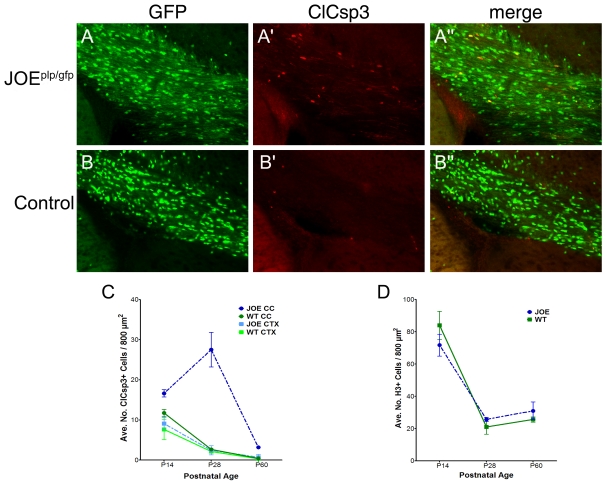
We examined the cause/dynamics for the reduced number of OLs by performing immunohistochemical studies to determine the number of apoptotic and proliferating cells in the cerebral cortex and CC at several postnatal ages. Specifically, coronal sections of JOEplp/gfp and control brains were examined at P14, P28 and P60 and stained for either ClCsp3 (a marker of cells undergoing apoptotic cell death) or phospho-histone H3 (a marker of phosphorylated histone H3 proteins present during cell proliferation). Moreover, to confirm that the ClCsp3+ cells being counted were OLs, we performed our analysis on tissue sections from the JOEplp/gfp mice; only counting cells that were labelled for both markers, i.e. GFP and ClCsp3+ or H3 (see Figures 7A–7A′′ and 7B–7B′′). We also confirmed OL identity by examining the morphology of the ClCsp3+ cells. Bipolar cells (found primarily in the CC) and multi-branched cells (resembling pre-myelinating OLs) in the cortex were included in the calculations. On alternate sections, histone H3+ cells were stained and counted in the cortex, CC and underlying subventricular zone.
Figure 7. Increased cell death in JOEplp/gfp cortices.
Coronal sections from JOE×PLP–GFP (JOEplp/gfp) hemi (A–A′′) and control (B–B′′) mice immunostained for apoptotic marker ClCsp3 (red) at P28. Magnification ×200. The average density of ClCsp3+ cells in the CC and cortex at P14, P28 and P60 is quantified in (C). Within the CC, the number of ClCsp3+ cells were significantly greater in the JOEplp/gfp than in control sections (P<0.05) at each developmental time point. In the cortex, the number of labelled cells was not significantly different between the genotypes. (D) The average density of proliferating cells (histone H3+) for the control and JOE mice did not differ between genotypes.
The density of ClCsp3+ cells in the CC and cortex of JOEplp/gfp and control mice are shown in Figure 7(C) at P14, P28 and P60. In the cortex of both JOEplp/gfp and control mice, the density of ClCsp3+ cells was highest at P14 and declined with age. There was no significant difference between the cortices of the two genotypes over the time frame of the study. In contrast, there was a significant difference in the developmental pattern of ClCsp3+ OLs in the CC of JOEplp/gfp compared with the CC of control mice. At all ages examined, the density of ClCsp3+ cells was significantly higher (P<0.05) in the JOEplp/gfp CC than in the control CC. Interestingly, between P14 and P28, the number of ClCsp3+ OLs in the JOEplp/gfp CC actually increased substantially (165%), rather than declined, but then declined precipitously between P28 and P60. The decline in ClCsp3+ OLs in the control CC paralleled the trend observed in the cortex of both the JOEplp/gfp and control mice. We did not detect increased neuronal cell death in the JOEplp/gfp cortex during this developmental period.
On adjacent cortical sections, the tissue was processed for the proliferation marker, histone H3 and the density of GFP+/histone H3+ double-labelled cells in the subventricular zone, CC and overlying cortex was quantified. In each of these areas, we found no significant difference in the number of proliferating cells between the genotypes over the period examined (P14 and P60) (Figure 7D). These results indicate that, whereas OL proliferation is relatively unaffected, OL cell death is higher in JOE brains than in WT brains.
Highly branched multi-processed pre-myelinating OLs are quite prominent in JOE brains
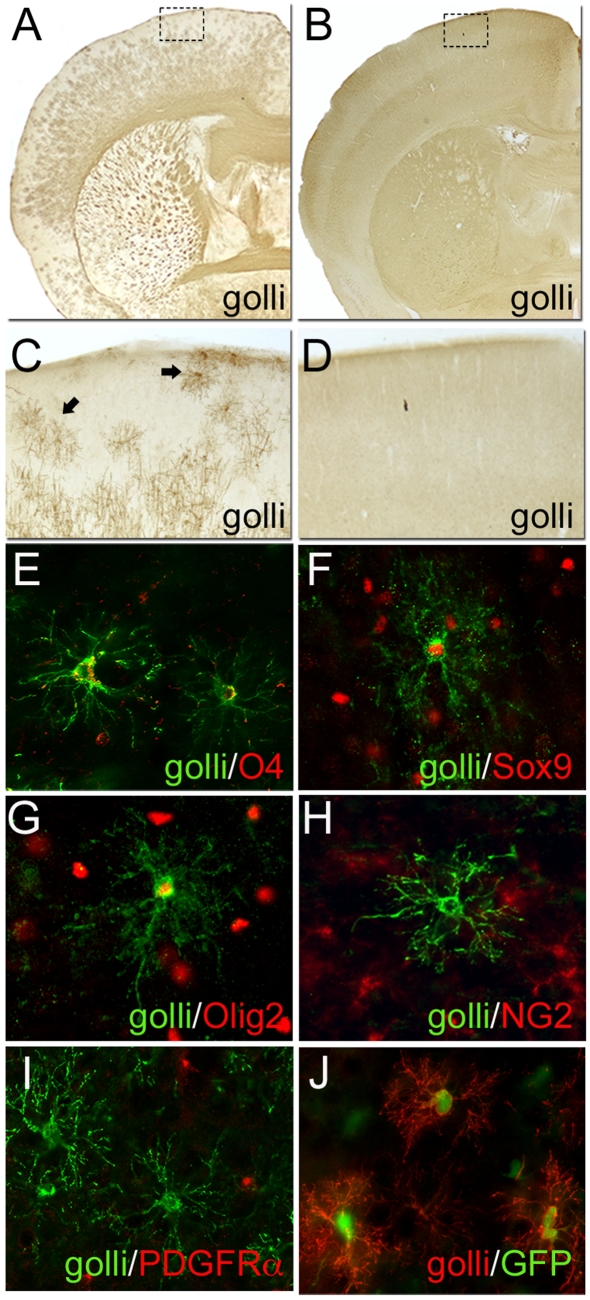
One of the most striking histological features of JOE brains is the presence of numerous highly branched multi-processed cells that label with the golli-specific antibody. These cells are prominent throughout the CNS and are present in the JOE brain throughout the developmental period examined: P4–P120. Within the cortex, these cells are located primarily in layers I–III where they encompass large areas of non-overlapping neuropil (see Figure 8A and arrows in Figure 8C). This type of cell is not evident with golli immunostaining of the WT (Figures 8B and 8D). However, the distribution and morphological characteristics of these cells suggest that they are pre-myelinating OLs. Pre-myelinating (immature) OLs have been well characterized in vitro (Gard and Pfeiffer, 1990; Hardy and Reynolds, 1991; Dubois-Dalcq and Armstrong, 1992; Miller, 1996; Nishiyama et al., 1996), but less is known about their attributes in vivo. Trapp et al. (1997) have shown that, in the rodent brain, pre-myelinating OLs are likely to originate from NG2/PDGFRα progenitors, but are themselves PDGFRα- and NG2-negative. These authors did find a small but consistent subpopulation of pre-myelinating OLs that were NG2-positive. To investigate these presumed golli+ pre-myelinating OLs in the JOE mouse, coronal sections were double-labelled with antibodies for golli (green) and OL markers O4, Sox9, Olig2, NG2 or PDGFRα (red). As shown in Figure 8, at P14, golli+ cells with pre-myelinating OL-like morphologies were detected, and these cells double-labelled for the early OL markers O4 (Figure 8E), Sox9 (Figure 8F) and Olig2 (Figure 8G). Although an occasional golli+ cell stained with anti-NG2 (data not shown), the golli+ pre-myelinating OLs were essentially negative for the progenitor markers NG2 (Figure 8H) and PDGFRα (Figure 8I). In addition, these cells did not express antigens for neuronal (NeuN, TUJ1) or astrocytic (GFAP) markers (data not shown).
Figure 8. Immunohistochemical staining of highly branched golli-expressing cells in the JOE brain.
Using immunoperoxidase staining with a golli-specific antibody (A–D), these cells were detected throughout the brain (A). Within the cortex (C) [a higher magnification of the outlined area in (A)], these cells were observed to be most prevalent in cortical layers I–III (for examples, see arrows) and were clearly absent from the WT (B and D). In sections stained with fluorescently labelled antibodies, these golli+ cells (green) co-localized with the early OL markers: anti-O4 (E), anti-Sox9 (F) and anti-Olig2 (G), but were negative for the progenitor markers anti-NG2 (H) and anti-PDGFRα (I) [E–I, developmental markers (red)]. (J) the PLP/DM20 promoter is active in these cells as evident by the co-localization of golli (red) with GFP in JOEplp/gfp sections. Images taken at P28 (A–D) and P14 (E–J). Magnification ×25 (A and B), ×50 (C and D), ×400 (E–J).
One of the most consistent markers for these cells has been the co-localization of golli (red) with GFP (green) expression in the JOEplp/gfp mouse (see Figure 8J). Since in these mice, GFP is under the control of the PLP/DM20 promoter, our data are consistent with Trapp et al. (1997) who found PLP/DM20 expression in pre-myelinating OLs. Interestingly, although the PLP/DM20 promoter is active in these cells, they labelled only lightly with anti-PLP. In the present study, co-localization of golli in these cells with other early OL markers 04, Sox9 and Olig2 (Figures 8E, 8F and 8G respectively) is consistent with their categorization as pre-myelinating/immature OLs.
One of the primary differences between the brains of JOE and WT mice is the number and persistence of the pre-myelinating OLs. In the WT brain, the number of pre-myelinating OLs peaks during the first 1–2 weeks after birth, and very few are detectable after P30 which is consistent with the findings of Trapp et al. (1997). In the JOE mice, the number of pre-myelinating OLs also peaks during the first 2 weeks after birth. However, there is nearly twice the number of these cells in the JOE animals than in the WT mice. In addition, a subpopulation of pre-myelinating cells persists into adulthood in the JOE mice. Note, that the PLP staining in the outer JOE cortices shown in Figure 2(C) are not pre-myelinating OLs, but rather foci of anti-PLP-labelled fibre/process segments.
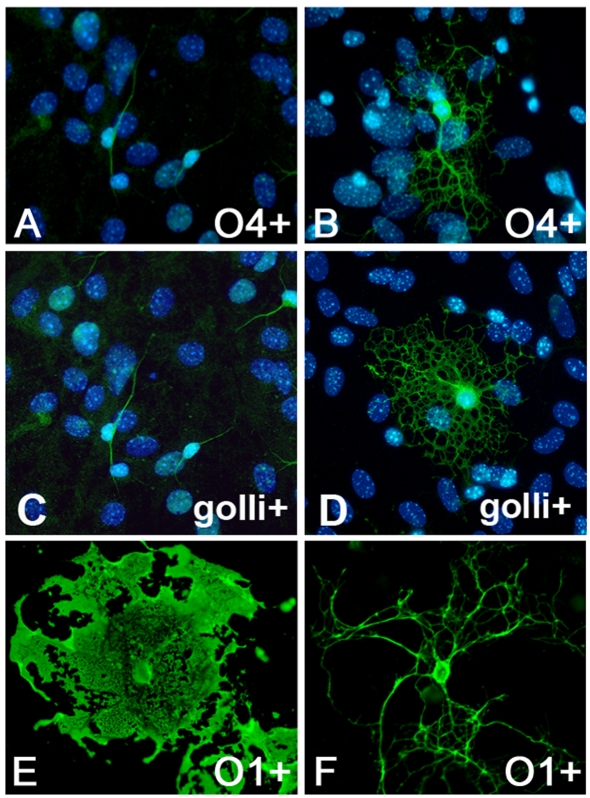
Since myelination is apparently delayed in the JOE mice, we examined primary cultures of JOE OLs to determine whether this delay is indicative of an intrinsic property of JOE OLs. Specifically, cortical OLs from P0–P3 mice were cultured and examined at 14 DIV (days in vitro) and at 28 DIV to assess the morphology of the OLs as well as their capacity to elaborate membrane sheets. At 14 DIV, a comparison of 04+ cells (Figures 9A and 9B) showed the presence of multi-polar cells in both WT and JOE cultures. However, upon closer inspection, these cells in the JOE cultures tended to contain more processes that were highly branched and similar to the pre-myelinating cells observed in vivo. This was even more apparent in 14 DIV cultures immunostained for golli. In the WT cultures, many of the golli+ OLs were bipolar (Figure 9C). In contrast, most of the golli+ cells in the corresponding JOE cultures were very highly branched and multipolar (Figure 9D). The cultures were also examined at 28 DIV when sheet formation is well advanced in the WT cultures. As shown in Figure 9(E), WT cells immunostained for the mature OL surface marker, 01, displayed large expansive myelin-like sheets. In the JOE cultures, 01+ cells were highly ramified with extensive and highly branched processes (Figure 9F). These results indicate that JOE OLs remained largely in an immature state of differentiation and that large numbers of pre-myelinating OLs seem to predominate in JOE brains.
Figure 9. Enhanced process extension and decreased myelin-like sheet formation in JOE OLs in vitro.
Mixed cortical cultures from WT (A, C and E) and JOE (B, D and F) cultured from P0–P3 mice and imaged at 14 and 28 DIV. Fluorescent images of 14 DIV OLs immunostained with anti-O4 antibody (A and B) and golli (C and D) illustrate the more highly branched processes in the JOE cultures. (E and F) At 28 DIV, O1+ OLs in the JOE cultures were multi-branched and showed a lack of myelin-like sheets that were evident in the WT. Magnification ×400.
Differential effect of golli overexpression in OL development
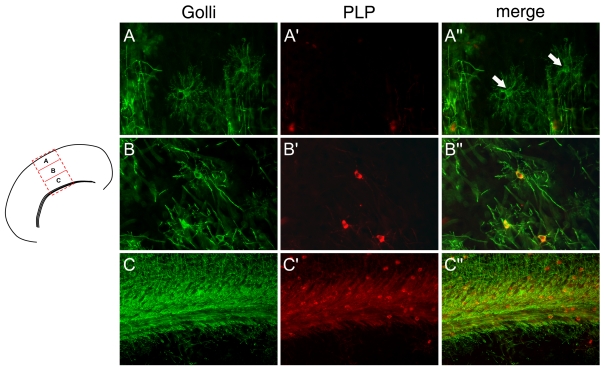
In examining the development of OLs in the JOE cortex, there appear to be significant regional differences in the stage of morphological development. In Figure 10, representative OLs at P14 immunolabelled with anti-golli antibodies are shown from the outer cortical layer (Figure 10A), middle cortex (Figure 10B) and the CC (Figure 10C). The morphologies of the OLs are typical of this stage of cortical development and include pre-myelinating OLs (Figure 10A), more mature OLs with radially aligned processes (Figure 10B) and interfascicular OLs in the CC (Figure 10C). In addition to the high numbers of pre-myelinating OLs, significantly less PLP immunoreactivity was evident in the OL processes in all cortical regions. In the immature pre-myelinating OLs, PLP immunostaining was either non-detectable or barely detectable as faint perinuclear staining (Figures 10A′ and 10A′′). In later-stage OLs, it is necessary for the OL to transport PLP to the processes for myelination to occur. As shown in Figures 10(B′) and 10(B′′), these OLs are immunoreactive for PLP, but the label is primarily restricted to the cell body, with only faint label in the processes. In corpus callosal OLs (Figures 10C–10C′′), PLP immunoreactivity infiltrated much further into the processes than in OLs from the mid-cortical region, although OLs in the CC (Figures 10C′ and 10C′′) did exhibit some accumulation of PLP immunoreactivity in the cell body. This may explain why the axons in the CC are more heavily myelinated relative to the axons in the upper cortical zones.
Figure 10. Comparison of the PLP levels and transport in JOE OLs.
Representative OLs from the outer (A) and inner (B) cortical layers and the CC (C) are shown in corresponding rows immunostained for golli (green) and PLP (red). Pre-myelinating OLs are not stained with the PLP antibody (see arrows in A ´ ´). However, OLs in the inner cortical layers and CC are PLP-positive. The PLP immunoreactivity is localized primarily to the cell bodies. Process staining for PLP is more extensive in CC OLs. Magnification ×400 (A–A ´ ´ and B–B ´ ´), ×200 (C–C ´ ´).
DISCUSSION
In the present paper, we report the in vivo consequence of altered Ca2+ homoeostasis in OPCs/OLs owing to golli overexpression in those cells. Golli overexpression resulted in a delay in myelination of ∼6 weeks and a striking neurological phenotype characterized by tremors that increased in severity and body involvement from P14 to P35 and by occasional seizures. Our analysis of the JOE CNS indicates that the underlying cause for the tremors is apparently due to a significant delay in the onset and extent of myelination (see also Martin et al., 2007). Although the entire CNS is affected, the focus of analysis in the present study has been on the perturbations observed in the cerebral cortex and CC.
Use of the classic MBP promoter permitted us to target overexpression of the golli protein specifically to OLs and their precursors. Although the classic MBPs are generally considered to be expressed in mature OLs, there are numerous reports of the promoter being active in cells earlier in the OL lineage. The classic MBP mRNAs, if not the proteins, have been reported to be expressed embryonically as well as in early postnatal animals (Mathison et al., 1993; Nakajima et al., 1993; Hajihosseini et al., 1996; Peyron et al., 1997; Zecević et al., 1998; Campagnoni and Skoff, 2001; Tosić et al., 2002; Jalabi et al., 2005). In the present study, we have confirmed that the MBP promoter–golli transgene is active perinatally in the brain, long before active myelination. Thus, in addition to mature OLs, the activity of the classic MBP promoter appeared to drive expression of golli J37 in OPCs, later-stage OL progenitors and immature OLs.
Other mouse models have been generated by transgenes driven by the classic MBP promoter. These have included oncogenes (Hayes et al., 1992), MHC molecules (Turnley et al., 1991), TNFα (tumour necrosis factor α) (Taupin et al., 1997), c-myc (Orian et al., 1997, 2001), FGFR (fibroblast growth factor receptor) (Harari et al., 1997), BDNF (brain-derived neurotrophic factor) (Forsberg-Nilsson et al., 2003) and reporter genes such as lacZ (Gow et al., 1992; Miskimins et al., 1992; Vanderluit et al., 2000). Surprisingly few of these transgenics have exhibited serious overt neurological phenotypes or major myelination disturbances, suggesting that overexpression of any gene is not damaging to the OL. The overexpression of the c-myc (Orian et al., 1997) and MHC (‘wonky' mouse) genes in OLs has been reported to cause a ‘shivering' phenotype (Turnley et al., 1991). In the case of the MHC transgenic mouse line, disturbance of locomotor activity from P11 to P14 was noted, followed by tonic seizures leading to premature death by P15–P22. Another transgenic mouse, called 2-50, has been generated through the expression of the proto-oncogene, myc, under the control of the classic MBP promoter (Orian et al., 1997, 2001). This mouse exhibits tremors transiently from P15 to P25 and appears to undergo delayed myelination because of transient expression of the transgene in OPCs during embryonic development. Myelination and myelin apparently become completely normal with further postnatal maturation. This mouse does not express the transgene beyond very early postnatal development, unlike the JOE mice, which express the transgene as early as P1.5 (earliest age examined) and continues to at least 13.5 months (latest age examined). Other models, such as transgenic mice expressing BDNF or FGFR under control of the classic MBP promoter appear to have rather subtle effects on myelin and do not exhibit any neurological symptoms. The JOE mice are also unlike the spontaneously occurring dysmyelinating mutants (e.g. shi, shimld, jimpy) and the PLP-overexpressers. These animals suffer from dysmyelination, which results in permanent myelin deficits or premature death through seizures. The JOE mice are hypomyelinated and exhibit neurological tremors over a considerable and important period in the developing brain, after which there appears to be significant recovery of myelination.
It has become apparent that golli proteins are important in OPC/OL process extension and retraction. For example, when golli proteins are overexpressed in OL cell lines, they induce the elaboration of processes and sheet-like structures (Reyes and Campagnoni, 2002; Paez et al., 2007) that do not have the composition of myelin. In transfected cells, golli co-localizes with F-actin (filamentous actin) in the plasma membrane along the extending processes and at the leading tips (J.M. Feng and A.T. Campagnoni, unpublished data), suggesting that golli may influence process motility. It is likely that this results from the role that golli proteins play in modulating Ca2+ influx at the plasma membrane (Jacobs et al., 2005; Paez et al., 2007, 2008, 2009a).
From what we know about the cellular localization of golli and its influence on process formation in vitro, one might predict that, in the presence of increased golli expression, OLs in the JOE mouse would remain in a less mature state, extending processes, but not differentiating further into mature OLs. The results from the present study support this hypothesis. Specifically, the data from our in vitro studies show a clear reduction in the ability of purified JOE OLs to produce myelin-like sheets in comparison with WT OLs in culture. Instead, these JOE 01+ cells were characterized by highly ramified processes, but without extensive sheet formation. These results with isolated OLs are different from golli overexpression in cell lines. Isolated JOE OLs primarily elaborate processes rather than sheets, revealing an interesting difference in cell lines compared with isolated OLs. Interestingly, impeded maturation of OLs in vivo was greater in the outer cortical layers (I–III), than in the deeper cortical regions and CC in the JOE compared with WT brains.
Pre-myelinating OLs are a transient population of cells that extend elaborate processes over a significant area (80 μm in the cortex and 40 μm in the CC) and largely disappear after P21 (Trapp et al., 1997). The surviving cells are thought to be those that contact and ensheathe axons and differentiate further into mature myelin-forming OLs. The greater numbers of pre-myelinating cells in the JOE mouse, particularly between P14 and P28, and their continued presence in the adult suggest that overexpression of golli impedes and/or delays the development of OLs.
Whereas the number of pre-myelinating OLs was greater in the JOE brains, some OLs did differentiate into a more mature phenotype, particularly those in the lower cortical layers (III–VI). These OLs tended to have fewer processes than the pre-myelinating OLs, and these processes had a more organized and vertical appearance, suggesting that they were aligning along side adjacent axons. However, results from our PLP immunohistochemical studies and ultrastructural analysis indicated that these cells were not able to myelinate nearby axons. In the CC, many of the OLs had typical intrafascicular morphology and were able to myelinate axons. However, the amount of myelin (number of wraps per axon) was significantly less than that produced in the WT.
In WT brains, pre-myelinating OLs in the upper cortical layers did not stain for PLP very well, but the OLs in the lower cortical layers and the CC did. The same pattern was roughly true for the JOE mouse. However, the PLP+ OLs in the lower cortical layers that appeared to mature beyond the pre-myelinating stage produced PLP, but the majority of the protein remained in the cell body. In contrast, OL processes in the JOE CC were stained more heavily for PLP. This difference may explain why, in contrast with the cortex, myelination, albeit reduced, occurred in the JOE CC. It is possible that regional differences in rates of maturation of OLs or the originating (embryonic) sources of the OLs in these areas of the cortex and subcortical white matter (Kessaris et al., 2006) account for these differences.
Our finding that OLs in the CC and cortex respond differently to overexpression of golli J37 suggests that there may be innate differences in sensitivity to increased golli expression among various subpopulations of OLs. This conclusion is consistent with increasing evidence in the literature that OPCs and OLs are heterogeneous populations of cells. Their heterogeneity has been documented with respect to their temporal and spatial sites of developmental origin (Kessaris et al., 2006; Ivanova et al., 2003; Noble et al., 2003) as well as their genetic (reviewed by Nicolay et al., 2007) and morphological phenotype (Del Rio-Hortega, 1928; Weruaga-Prieto et al., 1996). Pre-myelinating OLs in the CC have also been shown by Trapp et al. (1997) to have significant morphological and structural differences than those found in the cerebral cortex. This well-documented heterogeneity among OL populations may underlie the differences that we noted in the OPC/OL populations in the layers of the cortex and subcortical white matter in the JOE brain.
One consequence of golli overexpression in vivo appears to be an inhibition or delay of myelination. This delay may be due to the extensive cell death of OPC/OLs that we observed in the JOE mouse during the first two postnatal months. This increased cell death is likely to be a result of a perturbation in Ca2+ homoeostasis owing to increased production of golli. Our previous work showed that golli enhances Ca2+ uptake into OLs and OPCs and this can lead directly to cell death (Jacobs et al., 2005; Paez et al., 2009a). It is well-documented that increased influx of Ca2+ can be lethal in many cell types including OLs (Orrenius et al., 2003; Benjamins and Nedelkoska, 1996; Smith and Hall, 1994). Thus these in vivo findings are consistent with in vitro studies by Paez et al. (2009a), who found an increase in apoptotic cell death in JOE OPCs cultured under basal conditions. Moreover, when cultures of OPCs from golli-knockout mice were treated with high levels of K+ (inducing Ca2+ influx), Paez et al. (2009a) found that they were more resistant to apoptotic death than controls.
At a cellular level, early stages of OPC maturation may actually be accelerated by overexpression of golli. For example, we know that migration is increased in OLs both in vivo and in vitro (Paez et al., 2009b). However, we believe that golli has no role in the elaboration of myelin sheets and may in fact inhibit that process. In JOE mice, increased golli expression may enhance this inhibition and account for the delay in further OL maturation. Eventually, other factor(s) intervene and override the inhibition. This factor could include, but is not limited to, lower expression of the MBP promoter with development and/or the interaction with other molecules.
One of the most interesting phenotypic characteristics of the JOE mouse is its delayed recovery of near WT levels of myelin and loss of neurological systems by ∼60 days. In vitro, increases in internal Ca2+ have been shown to increase proliferation of JOE OPCs in culture (Paez et al., 2009a). In the JOE mouse, there was an ∼20% increase in the number of GFP+ OLs in JOEplp/gfp brains compared with controls at P28 and P60, but the results were not statistically significant. It is possible that this small difference over time could result in a ‘rebound' effect that eventually leads to the myelination occurring at later ages. However, another interpretation is that the small increase of histone H3+ proliferating cells in older animals (P28–P60) suggests that remyelination is unlikely to be due to the production of newly generated OPCs. Rather, the continued presence of pre-myelinating OLs suggests a greater pool of immature OLs that could be recruited in JOE animals that are able to differentiate and form myelin. These cells are likely to be able to do this only when the activity of the MBP promoter declines (after ∼21–28 days), reducing the intracellular levels of the golli J37 protein.
The lack of a difference in proliferating OLs between the JOE and WT mice is surprising given the increase in proliferation of JOE OPCs observed in vitro (Paez et al., 2009a). However, although we did not detect an increase in proliferating histone H3+ cells between P14 and P60, we did detect a greater number of GFP+ OLs at P14 in the JOEplp/gfp cortices. One explanation for this difference may be that increased proliferation occurred in the JOEplp/gfp mice before P14. Furthermore, increased rates of OPC migration in the JOEplp/gfp may also explain the presence of a greater number of GFP+ cells in the cortices of JOEplp/gfp mice. This would be consistent with Paez et al. (2009b), who found increased rates of migration in JOE OPCs compared with controls.
In summary, the present paper indicates that increased levels of golli delays myelination, probably due to significant cell death of OLs particularly in white matter tracts such as the CC. These findings are consistent with in vitro studies that indicate that golli acts by influencing Ca2+ influx into OPCs/OLs through store-operated Ca2+ channels and voltage-gated Ca2+ channels. The results provide in vivo evidence for a significant role of the golli proteins in the regulation and maturation of OLs and normal myelination. The JOE mouse also provides an unique model to examine the longer-term effects of hypomyelination imposed during a critical period of brain development during which neural networks are being established, axonal sprouting and synaptic connections are being made and neuronal–glial relationships are being established.
Online data
ACKNOWLEDGEMENTS
We thank Marianne Cilluffo and the UCLA BRI Electron Microscopic Core for specimen preparation and use of their microscopic facilities.
Footnotes
This work was supported by the National Institutes of Health [grant number NS046337] and the National Multiple Sclerosis Society [grant number RG2693] to A.T.C.
REFERENCES
- Amur-Umarjee S, Phan T, Campagnoni AT. Myelin basic protein mRNA translocation in oligodendrocytes is inhibited by astrocytes in vitro. J Neurosci Res. 1993;36:99–110. doi: 10.1002/jnr.490360111. [DOI] [PubMed] [Google Scholar]
- Benjamins JA, Nedelkoska L. Release of intracellular calcium stores leads to retraction of membrane sheets and cell death in mature mouse oligodendrocytes. Neurochem Res. 1996;21:471–479. doi: 10.1007/BF02527712. [DOI] [PubMed] [Google Scholar]
- Campagnoni AT, Skoff RP. The pathology of myelin mutants reveal novel biological functions of the MBP and PLP genes. Brain Pathol. 2001;11:74–91. doi: 10.1111/j.1750-3639.2001.tb00383.x. [DOI] [PMC free article] [PubMed] [Google Scholar]
- Campagnoni AT, Pribyl TM, Campagnoni CW, Kampf K, Amur-Umarjee S, Landry CF, Handley VW, Newman SL, Garbay B, Kitamura K. Structure and developmental regulation of Golli-mbp, a 105-kilobase gene that encompasses the myelin basic protein gene and is expressed in cells in the oligodendrocyte lineage in the brain. J Biol Chem. 1993;268:4930–4938. [PubMed] [Google Scholar]
- Del Rio-Hortega P. Tercera aportacion al cenocimiento morfologico e interpretacion functional de la oligodendroglia. Mem Real Soc Esp Hist Nat. 1928;14:40–122. [Google Scholar]
- Dubois-Dalcq M, Armstrong RC. The oligodendrocyte lineage during myelination and remyelination. In Myelin: Biology and Chemistry (Martenson RE, ed.), pp. 81–122, CRC Press, Boca Raton. 1992 [Google Scholar]
- Feng JM, Givogri IM, Bongarzone ER, Campagnoni C, Jacobs E, Handley VW, Schonmann V, Campagnoni AT. Thymocytes express the golli products of the myelin basic protein gene and levels of expression are stage dependent. J Immunol. 2000;165:5443–5450. doi: 10.4049/jimmunol.165.10.5443. [DOI] [PubMed] [Google Scholar]
- Feng JM, Hu YK, Xie LH, Colwell CS, Shao XM, Sun XP, Chen B, Tang H, Campagnoni AT. Golli protein negatively regulates store depletion induced calcium influx in T cells. Immunity. 2006;24:717–727. doi: 10.1016/j.immuni.2006.04.007. [DOI] [PubMed] [Google Scholar]
- Forsberg-Nilsson K, Erlandsson A, Zhang XQ, Ueda H, Svensson K, Nistér M, Trapp BD, Peterson AC, Westermark B. Oligodendrocyte precursor hypercellularity and abnormal retina development in mice overexpressing PDGF-B in myelinating tracts. Glia. 2003;41:276–289. doi: 10.1002/glia.10191. [DOI] [PubMed] [Google Scholar]
- Gard AL, Pfeiffer SE. Two proliferative stages of the oligodendrocyte lineage (A2B5+04- and 04+GalC-) under different mitogenic control. Neuron. 1990;5:615–625. doi: 10.1016/0896-6273(90)90216-3. [DOI] [PubMed] [Google Scholar]
- Givogri MI, Bongarzone ER, Schonmann V, Campagnoni AT. Expression and regulation of golli products of myelin basic protein gene during in vitro development of oligodenrocytes. J Neurosci Res. 2001;66:679–690. doi: 10.1002/jnr.10031. [DOI] [PubMed] [Google Scholar]
- Gow A, Fredrich V, Lazzarini R. Myelin basic protein gene contains separate enhancers for oligodendrocyte and Schwann cell expression. J Cell Biol. 1992;119:605–616. doi: 10.1083/jcb.119.3.605. [DOI] [PMC free article] [PubMed] [Google Scholar]
- Hajihosseini M, Tham TN, Dubois-Dalcq M. Origin of oligodendrocytes within the human spinal cord. J Neurosci. 1996;16:7981–7994. doi: 10.1523/JNEUROSCI.16-24-07981.1996. [DOI] [PMC free article] [PubMed] [Google Scholar]
- Harari D, Finkelstein D, Bernard O. FGF plays a subtle role in oligodendrocyte maintenance in vivo. J Neurosci Res. 1997;49:404–415. [PubMed] [Google Scholar]
- Hardy R, Reynolds R. Proliferation and differentiation potential of rat forebrain oligodendroglial progenitors both in vitro and in vivo. Development. 1991;111:1061–1080. doi: 10.1242/dev.111.4.1061. [DOI] [PubMed] [Google Scholar]
- Hayes C, Kelly D, Murayama S, Komiyama A, Suzuki K, Popko B. Expression of the neu oncogene under the transcriptional control of the myelin basic protein gene in transgenic mice: generation of transformed glial cells. J Neurosci Res. 1992;31:175–187. doi: 10.1002/jnr.490310123. [DOI] [PubMed] [Google Scholar]
- Ivanova A, Nakahira E, Kagawa T, Oba A, Wada T, Takebayashi H, Spassky N, Levine J, Zalc B, Ikenaka K. Evidence for a second wave of oligodendrogenesis in the postnatal cerebral cortex of the mouse. J Neurosci Res. 2003;73:581–592. doi: 10.1002/jnr.10717. [DOI] [PubMed] [Google Scholar]
- Jacobs EC, Pribyl TM, Feng JM, Kampf K, Spreuer V, Campagnoni C, Colwell CS, Reyes SD, Martin M, Handley V, Hiltner TD, Readhead C, Jacobs RE, Messing A, Fisher RS, Campagnoni AT. Region-specific myelin pathology in mice lacking the golli products of the myelin basic protein gene. J Neurosci. 2005;25:7004–7013. doi: 10.1523/JNEUROSCI.0288-05.2005. [DOI] [PMC free article] [PubMed] [Google Scholar]
- Jalabi W, Boehm N, Grucker D, Ghandour MS. Recovery of myelin after induction of oligodendrocyte cell death in postnatal brain. J Neurosci. 2005;25:2885–2894. doi: 10.1523/JNEUROSCI.2748-04.2005. [DOI] [PMC free article] [PubMed] [Google Scholar]
- Kessaris N, Fogarty M, Iannarelli P, Grist M, Wegner M, Richardson WD. Competing waves of oligodendrocytes in the forebrain and postnatal elimination of an embryonic lineage. Nat Neurosci. 2006;9:173–179. doi: 10.1038/nn1620. [DOI] [PMC free article] [PubMed] [Google Scholar]
- Landry CF, Ellison JA, Pribyl TM, Campagnoni C, Kampf K, Campagnoni AT. Myelin basic protein gene expression in neurons: developmental and regional changes in protein targeting within neuronal nuclei, cell bodies, and processes. J Neurosci. 1996;16:2452–2462. doi: 10.1523/JNEUROSCI.16-08-02452.1996. [DOI] [PMC free article] [PubMed] [Google Scholar]
- Landry CF, Ellison J, Skinner E, Campagnoni AT. Golli–MBP proteins mark the earliest stages of fiber extension and terminal arboration in the mouse peripheral nervous system. J Neurosci Res. 1997;50:265–271. doi: 10.1002/(SICI)1097-4547(19971015)50:2<265::AID-JNR15>3.0.CO;2-7. [DOI] [PubMed] [Google Scholar]
- Mallon BS, Shick HE, Kidd GJ, Macklin WB. Proteolipid promoter activity distinguishes two populations of NG2-positive cells throughout neonatal cortical development. J Neurosci. 2002;22:876–885. doi: 10.1523/JNEUROSCI.22-03-00876.2002. [DOI] [PMC free article] [PubMed] [Google Scholar]
- Martin M, Reyes SD, Hiltner TD, Givogri MI, Tyszka JM, Fisher R, Campagnoni AT, Fraser SE, Jacobs RE, Readhead C. T2-weighted mMRI and evoked potential of the visual system measurements during the development of hypomyelinated transgenic mice. Neurochem Res. 2007;32:159–165. doi: 10.1007/s11064-006-9121-z. [DOI] [PubMed] [Google Scholar]
- Mathison PM, Pease S, Garvey J, Hood L, Readhead C. Identification of an embryonic isoform of myelin basic protein that is expressed widely in the mouse embryo. Proc Natl Acad Sci USA. 1993;90:10125–10129. doi: 10.1073/pnas.90.21.10125. [DOI] [PMC free article] [PubMed] [Google Scholar]
- Miller RH. Oligodendrocyte origins. Trends Neurosci. 1996;19:92–96. doi: 10.1016/s0166-2236(96)80036-1. [DOI] [PubMed] [Google Scholar]
- Miskimins R, Knapp L, Dewey MJ, Zhang X. Cell and tissue-specific expression of a heterologous gene under control of the myelin basic protein gene promoter in transgenic mice. Dev Brain Res. 1992;65:217–221. doi: 10.1016/0165-3806(92)90182-v. [DOI] [PubMed] [Google Scholar]
- Nakajima K, Ikenaka K, Kagawa T, Aruga J, Nakao J, Nakahira K, Shiota C, Kim SU, Mikoshiba K. Novel isoforms of mouse myelin basic protein predominantly expressed in embryonic stage. J Neurochem. 1993;60:1554–1563. doi: 10.1111/j.1471-4159.1993.tb03321.x. [DOI] [PubMed] [Google Scholar]
- Nicolay DJ, Doucette JR, Nazarali AJ. Transcriptional control of oligodendrogenesis. Glia. 2007;55:1287–1299. doi: 10.1002/glia.20540. [DOI] [PubMed] [Google Scholar]
- Nishiyama A, Lin X-H, Giese N, Heldin C-H, Stallcup WB. Co-localization of NG2 proteoglycan and PDGF-receptor on 02A progenitor cells in the developing rat brain. J Neurosci Res. 1996;43:299–314. doi: 10.1002/(SICI)1097-4547(19960201)43:3<299::AID-JNR5>3.0.CO;2-E. [DOI] [PubMed] [Google Scholar]
- Noble M, Arhin A, Gass D, Mayer-Pröschel M. The cortical ancestry of oligodendrocytes: common principles and novel features. Dev Neurosci. 2003;25:217–233. doi: 10.1159/000072270. [DOI] [PubMed] [Google Scholar]
- Orian JM, Slavin A, Ayers MM, Bernard CC. Delayed and incomplete myelination in a transgenic mouse mutant with abnormal oligodendrocytes. J Neurosci Res. 1997;50:809–820. doi: 10.1002/(SICI)1097-4547(19971201)50:5<809::AID-JNR17>3.0.CO;2-W. [DOI] [PubMed] [Google Scholar]
- Orian JM, Ahern AJ, Ayers MM, Levine JM, Tapp LD, Reynolds R. Disturbed oligodendrocyte development and recovery from hypomyelination in a c-myc transgenic mouse mutant. J Neurosci Res. 2001;66:46–58. doi: 10.1002/jnr.1196. [DOI] [PubMed] [Google Scholar]
- Orrenius S, Zhivotovsky B, Nicotera P. Regulation of cell death: the calcium–apoptosis link. Nat Rev Mol Cell Biol. 2003;4:552–565. doi: 10.1038/nrm1150. [DOI] [PubMed] [Google Scholar]
- Paez PM, Spreuer V, Handley V, Feng JM, Campagnoni C, Campagnoni AT. Increased expression of golli myelin basic proteins enhances calcium influx into oligodendroglial cells. J Neurosci. 2007;27:12690–12699. doi: 10.1523/JNEUROSCI.2381-07.2007. [DOI] [PMC free article] [PubMed] [Google Scholar]
- Paez PM, Fulton D, Colwell CS, Campagnoni AT. Voltage-operated Ca2+ and Na+ channels in the oligodendrocyte linage. J Neurosci Res. 2008 doi: 10.1002/jnr.21938. [DOI] [PubMed] [Google Scholar]
- Paez PM, Fulton DJ, Spreuer V, Handley V, Campagnoni CW, Campagnoni AT. Regulation of store-operated and voltage-operated Ca2+ channels in the proliferation and death of oligodendrocyte precursor cells by golli proteins. ASN NEURO 1(1):art:e00003. 2009a doi: 10.1042/AN20090003. [DOI] [PMC free article] [PubMed] [Google Scholar]
- Paez PM, Fulton DJ, Spreuer V, Handley V, Campagnoni CW, Macklin WB, Colwell C, Campagnoni AT. Golli myelin basic proteins regulate oligodendroglial progenitor cell migration through voltage-gated Ca2+ influx. J Neurosci. 2009b;29:6663–6676. doi: 10.1523/JNEUROSCI.5806-08.2009. [DOI] [PMC free article] [PubMed] [Google Scholar]
- Peyron F, Timsit S, Thomas JL, Kagawa T, Ikenaka K, Zalc B. In situ expression of PLP/DM-20, MBP, and CNP during embryonic and postnatal development of the jimpy mutant and of transgenic mice overexpressing PLP. J Neurosci Res. 1997;50:190–201. doi: 10.1002/(SICI)1097-4547(19971015)50:2<190::AID-JNR8>3.0.CO;2-A. [DOI] [PubMed] [Google Scholar]
- Pribyl TM, Campagnoni CW, Kampf K, Kashima T, Handley VW, McMahon J, Campagnoni AT. The human myelin basic protein gene is included within a 179-kilobase transcription unit: expression in the immune and central nervous systems. Proc Natl Acad Sci USA. 1993;90:10695–10699. doi: 10.1073/pnas.90.22.10695. [DOI] [PMC free article] [PubMed] [Google Scholar]
- Reyes SD, Campagnoni AT. Two separate domains in the golli myelin basic proteins are responsible for nuclear targeting and process extension in transfected cells. J Neurosci Res. 2002;69:587–596. doi: 10.1002/jnr.10319. [DOI] [PubMed] [Google Scholar]
- Sambrook J, Fritsch EF, Maniatis T. Chapters 9.31–9.62, Molecular Cloning: a Laboratory Manual, Cold Spring Harbor Laboratory Press, Cold Spring Harbor. 1989 [Google Scholar]
- Smith KJ, Hall SM. Central demyelination induced in vivo by the calcium ionophore ionomycin. Brain. 1994;117:1351–1356. doi: 10.1093/brain/117.6.1351. [DOI] [PubMed] [Google Scholar]
- Taupin V, Renno T, Bourbonnière L, Peterson AC, Rodriguez M, Owens T. Increased severity of experimental autoimmune encephalomyelitis, chronic macrophage/microglial reactivity, and demyelination in transgenic mice producing tumor necrosis factor-α in the central nervous system. Eur J Immunol. 1997;27:905–913. doi: 10.1002/eji.1830270416. [DOI] [PubMed] [Google Scholar]
- Tosić M, Rakic S, Matthieu JM, Zecević N. Identification of Golli and myelin basic proteins in human brain during early development. Glia. 2002;37:219–228. doi: 10.1002/glia.10028. [DOI] [PubMed] [Google Scholar]
- Trapp BD, Nishiyama A, Cheng D, Macklin W. Differentiation and death of premyelinating oligodendrocytes in developing rodent brain. J Cell Biol. 1997;137:459–468. doi: 10.1083/jcb.137.2.459. [DOI] [PMC free article] [PubMed] [Google Scholar]
- Turnley AM, Morahan G, Okano H, Bernard O, Mikoshiba K, Allison J, Bartlett PF, Miller JF. Dysmyelination in transgenic mice resulting from expression of class I histocompatibility molecules in oligodendrocytes. Nature. 1991;353:566–569. doi: 10.1038/353566a0. [DOI] [PubMed] [Google Scholar]
- Vanderluit JL, Bourque JA, Peterson AC, Tetzlaff W. Model for focal demyelination of the spinal dorsal columns of transgenic MBP-LacZ mice by phototargeted ablation of oligodendrocytes. J Neurosci Res. 2000;62:28–39. doi: 10.1002/1097-4547(20001001)62:1<28::AID-JNR4>3.0.CO;2-2. [DOI] [PubMed] [Google Scholar]
- Weruaga-Prieto E, Eggli P, Celio MR. Topographic variations in rat brain oligodendrocyte morphology elucidated by injection of Lucifer Yellow in fixed tissue slices. J Neurocytol. 1996;25:19–31. doi: 10.1007/BF02284783. [DOI] [PubMed] [Google Scholar]
- Xie Y, Skinner E, Landry C, Handley V, Schonmann V, Jacobs E, Fisher R, Campagnoni A. Influence of the embryonic preplate on the organization of the cerebral cortex: a targeted ablation model. J Neurosci. 2002;22:8981–8991. doi: 10.1523/JNEUROSCI.22-20-08981.2002. [DOI] [PMC free article] [PubMed] [Google Scholar]
- Zecević N, Andjelković A, Matthieu JM, Tosić M. Myelin basic protein immunoreactivity in the human embryonic CNS. Dev Brain Res. 1998;105:97–108. [PubMed] [Google Scholar]
Associated Data
This section collects any data citations, data availability statements, or supplementary materials included in this article.


